Wind Energy Update - Wind Powering America
Wind Energy Update - Wind Powering America
Wind Energy Update - Wind Powering America

Create successful ePaper yourself
Turn your PDF publications into a flip-book with our unique Google optimized e-Paper software.
<strong>Wind</strong> <strong>Energy</strong> <strong>Update</strong><strong>Wind</strong> <strong>Powering</strong> <strong>America</strong>January 2012NREL is a national laboratory of the U.S. Department of <strong>Energy</strong>, Office of <strong>Energy</strong> Efficiency and Renewable <strong>Energy</strong>, operated by the Alliance for Sustainable <strong>Energy</strong>, LLC.
Evolution of Commercial <strong>Wind</strong> TechnologyNATIONAL RENEWABLE ENERGY LABORATORY
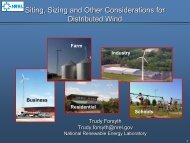
Sizes and ApplicationsSmall (≤100 kW)HomesFarmsRemote Applications (e.g.water pumping, telecomsites, icemaking)Midscale(100-1000 kW)Village PowerHybrid SystemsDistributed PowerLarge, Land-based(1-3 MW)Utility-scale wind farmsLarge Distributed PowerLarge, Offshore(3-7 MW)Utility-scale wind farms,shallow coastal watersNo U.S. installationsNATIONAL RENEWABLE ENERGY LABORATORY
Capacity & Cost Trends$1,200$1,000Cost of <strong>Energy</strong> and Cumulative US CapacityCapacity (MW)Cost of <strong>Energy</strong> ($/MWh)500004500040000$8003500030000Dollars/MWh(2010 dollars)$600$400250002000015000Megawatts$200100005000$-1980 1985 1990 1995 2000 2005 20100NATIONAL RENEWABLE ENERGY LABORATORYAs of January 2012 (AWEA)
U.S. <strong>Wind</strong> Power Additions Slowed in 2010NATIONAL RENEWABLE ENERGY LABORATORY2010 <strong>Wind</strong> Market Report, LBNL
People Want Renewable <strong>Energy</strong>!Capacity (MW)200000150000100000Total Installed <strong>Wind</strong> Capacity1. China: 50,000 MW2. United States: 43,675 MW3. Germany: 27,981 MW4. Spain: 21,200 MW5. India: 15,600 MWWorld total December 2011: 215,744 MW500000United States Europe Rest of WorldSource: <strong>Wind</strong>Power MonthlyNATIONAL RENEWABLE ENERGY LABORATORY
Texas Leads Capacity, But Not PenetrationNATIONAL RENEWABLE ENERGY LABORATORY 2010 <strong>Wind</strong> Market Report, LBNL
Since 2006, <strong>Wind</strong> has been a major contributorto new U.S. electric capacityNATIONAL RENEWABLE ENERGY LABORATORY 2010 <strong>Wind</strong> Market Report, LBNL
U.S total wind contributions still low comparedto other leading countriesNATIONAL RENEWABLE ENERGY LABORATORY2010 <strong>Wind</strong> Market Report, LBNL
Average Installed Cost Held Steady in 2010,But is Expected to Decline in 2011/12NATIONAL RENEWABLE ENERGY LABORATORY2010 <strong>Wind</strong> Market Report, LBNL
Installed <strong>Wind</strong> Capacities 1999 – January 2012Total Installed Capacity:46,919 MWAs of January 2012NATIONAL RENEWABLE ENERGY LABORATORY
Drivers for <strong>Wind</strong> PowerDeclining <strong>Wind</strong> CostsFuel Price UncertaintyFederal and StatePoliciesEconomic DevelopmentEnvironmentPublic SupportGreen Power<strong>Energy</strong> SecurityCarbon RiskNATIONAL RENEWABLE ENERGY LABORATORY
Low Wholesale Electricity Prices Continued toChallenge the Relative Economics of <strong>Wind</strong> PlantsInstalled in Recent YearsNATIONAL RENEWABLE ENERGY LABORATORY2010 <strong>Wind</strong> Market Report, LBNL
Natural Gas – Historic PricesNATIONAL RENEWABLE ENERGY LABORATORY
Historic Steel Prices - Cold Rolled12001000800$/mt6004002000Jan-00 Jan-01 Jan-02 Jan-03 Jan-04 Jan-05 Jan-06 Jan-07 Jan-08 Jan-09 Jan-10 Jan-11 Jan-12Historic Copper Prices12000<strong>Wind</strong> CostDrivers$/mt100008000600040002000Copper & Steel Price Source: World Bank, Commodity Price Data, Jan 2012NATIONAL RENEWABLE ENERGY LABORATORY0Jan-00 Jan-01 Jan-02 Jan-03 Jan-04 Jan-05 Jan-06 Jan-07 Jan-08 Jan-09 Jan-10 Jan-11 Jan-12
Historical Coal Prices$160.00CAPP/NYMEX Coal Futures Settlement Prices (2004-2011)$140.00$120.00$100.00Dollars per ton$80.00$60.00Central Appalachian (QL)Western Rail PRB (QP)Eastern Rail CSX (QX)Indonesian (McCloskey) SUBBIT$40.00$20.00$0.001/1/2004 1/1/2005 1/1/2006 1/1/2007 1/1/2008 1/1/2009 1/1/2010 1/1/2011Settlement DateNATIONAL RENEWABLE ENERGY LABORATORYSource: EIA
CO 2 prices significantly increase the cost of coal140130Levelized Cost of Electricity (2010) vs. CO2 Price2006$/MWh120110100908070Coal PCCoal IGCCCoal IGCC w/CCSGas CCNuclear<strong>Wind</strong> Class 6<strong>Wind</strong> Class 4<strong>Wind</strong> Offshore Class 660500 10 20 30 40 50Carbon Price ($/ton CO2)NATIONAL RENEWABLE ENERGY LABORATORY
Renewable Portfolio StandardsNATIONAL RENEWABLE ENERGY LABORATORY
<strong>Wind</strong> <strong>Energy</strong> InvestorsNATIONAL RENEWABLE ENERGY LABORATORY
<strong>Wind</strong>y Rural Areas Need Economic DevelopmentUS Population Change (%), 2000-2010NATIONAL RENEWABLE ENERGY LABORATORY
Jobs and Economic Impacts from the JEDI Model:<strong>Wind</strong> <strong>Energy</strong>’s Economic ImpactsJEDI Model Version W1.09.03eProject Development &Onsite Labor ImpactsConstruction WorkersManagementAdministrative SupportLegal, siting, and permittingCement truck driversRoad crewsMaintenance workersTurbine & SupplyChain ImpactsBlades, towers, gear boxesBoom truck &management, gas and gasstation workersSupporting businesses,such as bankers financingthe construction,contractor, manufacturersand equipment suppliers.Utilities.Hardware store purchasesand workers, spare partsand their suppliersInduced ImpactsJobs and earningsthat result from thespending supportedby the project,including benefits togrocery store clerks,retail salespeople,and child careprovidersConstruction Phase = 1-2 yearsOperational Phase = 20+ yearsNATIONAL RENEWABLE ENERGY LABORATORY
Project Development & Onsite LaborSample Jobs:Truck DriversCrane OperatorsEarth MovingCement PouringManagementSupportNATIONAL RENEWABLE ENERGY LABORATORY25
Local Revenues, Turbine, & Supply ChainSteel mill jobs, parts, services -Equipment manufacturing and sales - Blade and tower manufacturersNATIONAL RENEWABLE ENERGY LABORATORYProperty taxes - Financing, banking, accounting26
Induced ImpactsMoney spent on local area goods and services from increased revenue:sandwich shops, child care, grocery stores, clothing, other retail, publictransit, new cars, restaurants, medical servicesNATIONAL RENEWABLE ENERGY LABORATORY27
Typical U.S. Results from a 100MW <strong>Wind</strong> ProjectDirect Jobs70-100 Construction jobs*6-8 Operations & Maintenance Jobs*Increased Local RevenuesLand lease payments:~$350,000 - $500,000 per year (3-6% of gross project revenue)Local property tax revenue:$500,000 - $1million per yearOther BenefitsStimulate local industry (concrete, roads, environmental, siting, legal)Stimulate local manufacturing*Jobs are listed as full-time equivalentsNATIONAL RENEWABLE ENERGY LABORATORY
Wild Horse <strong>Wind</strong> Power Project Phase 1(Ellensburg, WA)• Owned by Puget Sound <strong>Energy</strong>• Commissioned 2006• 228.6 MW• (127) 1.8 MW Vestas turbines• Estimated 2008 property taxpayments totaled ~ $1.56 miilion• Project employed ~ 250 workersduring peak construction• 14-18 O&M positions• ~ 80 acres of WashingtonDepartment of Fish and Wildlifeland leased for the projectproviding between $60,000 and$125,000 annually• PSE also leases land from stateDepartment of NaturalResourcesImage Credit: Annawjacobs, Creative CommonsNATIONAL RENEWABLE ENERGY LABORATORY
White Creek <strong>Wind</strong> Project (Klickitat County, WA)• Commissioned 2007• 204.7 MW• (89) 2.3 MW Siemens turbines• Last Mile Electric Cooperative- four publicly owned utilities: TannerElectric Co-op, Lakeview Light & Power, Cowlitz County Public UtilityDistrict, Kilickitat County Public Utility District)• In order to take advantage of production tax credits, the original utilitysponsors “sold” the project to White Creek <strong>Wind</strong> I LLC, a pass-throughentity arranged by the broker-dealer arm of Meridian Companies• Once complete, White Creek’s equity sponsors assumed ownership inorder to receive the project’s tax credits• Sponsoring utilities hold an option to buy the project back after 10 yearsNATIONAL RENEWABLE ENERGY LABORATORY
Our <strong>Wind</strong> Co-Op, Small-Scale <strong>Wind</strong> Turbine Projects(Washington and Montana)• Launched in 2002 to help reduce barriersassociated with distributed customerownedwind energy development in thePacific Northwest• Installed (10) turbines in Montana andWashington between 2003 – 2006• Bergey <strong>Wind</strong>power supported the projectby offering a discount on equipment ordersby ~ $7,000 per system• Projects were funded by variousorganizations including the USDA, DOE,Montana’s Department of EnvironmentalQuality and the Bonneville EnvironmentalFoundation• As a result of the numerous fundingsources provided through Our <strong>Wind</strong> Co-op,the turbine host cost share for the initial 10sites was reduced by an average of almost80% to about $8,000, thereby reducing theactual average “payback period” from 55years to 7 years.NATIONAL RENEWABLE ENERGY LABORATORY
NaturEner’s Glacier <strong>Wind</strong> Power Project(Toole/Glacier County, MT)• Owned by NaturEner• Phase 1 – online 2008• Phase 2 – online 2009• (210) 1.5 MW Acciona turbines• Tax Revenue from the projectwill be ~ $4 million annually forGlacier and Toole Counties• ~ $1 million in annual landagreements• Total construction jobs for bothphases ~ 350• ~ 18 permanent positionsNATIONAL RENEWABLE ENERGY LABORATORY
Jerome Middle School <strong>Wind</strong> Turbine (Jerome, ID)• (1) Skystream 2.4 kW turbine• Installed November 2008• Jerome Middle School received a <strong>Wind</strong>For Schools $4,600 grant through BoiseState and the Tidwell Foundation tooffset the turbine cost.• The school solicited the following localcompanies to donate time & materials inorder to reduce the cost of installation:− Starr Corporation: Foundation kit $373,Concrete $1000, Re-bar $600, Formingmaterial $150, Equipment for diggingfoundation $320, Labor for foundation$2000.− H & H Utility: Crane $3000, Pulling wires,Meter, Installation of Turbine− Portneuf Electrical: 1800 ft (3 wire 600 fteach) 4 gauge, 600 ft bare wire (noinsulation) 8 gauge $1500.− Power by Jake (Jake Cutler): LicensedElectrician $360In the end, Jerome MiddleSchool paid ~ $3,720 for theturbine tower & various permits.NATIONAL RENEWABLE ENERGY LABORATORY
Peetz Table <strong>Wind</strong> <strong>Energy</strong> Center, CO• 400.5 MW (1.5-MW turbines)• Landowner payments: $2million/year, $65 million over30-year period• 300 – 350 workers duringpeak construction (80% local)• 16 – 18 O&M positions• Total annual tax payments:$2.3 million/year (10% of totalcounty budget); $70 millionover 30 years• Located near Peetz, CO• Owned by FPL <strong>Energy</strong>• Constructed in 2007NATIONAL RENEWABLE ENERGY LABORATORY
Twin Buttes <strong>Wind</strong> Farm (Bent County, CO)• 75 MW (GE 1.5 MW turbines)• Owned by Iberdrola <strong>Energy</strong>• Constructed in 2007• ~ 100 during peakconstruction• Will pay between $3,000 and$6,000 per turbine tolandowners annually• 6 full-time O&M positions• Will pay ~ $200,000 inproperty tax annuallyNATIONAL RENEWABLE ENERGY LABORATORY
South Dakota <strong>Wind</strong> <strong>Energy</strong> Center• 40.5 MW (1.5-MW turbines)• Landowner payments:$3,500-$4,000/year• 100 – 125 workers duringpeak construction• 3 fulltime O&M positions• Property taxes:$220,000/year• Sales and use tax: $1.2million payable in 2003• Located near Highmore, SD(population 808)• Owned by FPL <strong>Energy</strong>• Constructed in 2003NATIONAL RENEWABLE ENERGY LABORATORY
Elkhorn Ridge <strong>Wind</strong> Farm (Bloomfield, NE)• 81 MW (27 Vestas 3 MW turbines)• 2/3 of the project is owned by EdisonMission Group, 1/3 owned by Tenaska• Online in 2009• <strong>Wind</strong> farm is Nebraska’s firstCommunity Based <strong>Energy</strong>Development (C-BED) project• C-BED requires projects to have 1/3ownership by Nebraska residents• ~ 100 people employed duringconstruction• 6 fulltime O&M positions• Project will bring in ~ $5.7 million inproperty taxes over the next 5 yrs• ~ $2.4 million of property tax moneyover the next five years will go toBloomfield Community School District• ~$325,000 in annual land leasepaymentsNATIONAL RENEWABLE ENERGY LABORATORY
Spearville <strong>Wind</strong> <strong>Energy</strong> Facility (Spearville, KS)Image Credit: Jennifer Sovanski, Creative Commons• 100.5 MW (67 GE 1.5 MW turbines)• Owned by Kansas City Power & Light• Online in 2006• ~ 200 people employed during construction• 11-12 fulltime O&M positions• In lieu of taxes, KCP&L gives nearly $15 million over next 30 yearssplit between seven different taxing entities• ~ $2,000 per year for landowners• Between $200 million and $300 million spent in the community (steel,cement, hired locals and basic purchases)NATIONAL RENEWABLE ENERGY LABORATORY
Bluegrass Ridge <strong>Wind</strong> Farm (Gentry County, MO)Image Credit: Peter Young, Creative Commons• 56.7 MW (Suzlon 2.1 MW turbines)• Owned by <strong>Wind</strong> Capital Group/John Deere• Constructed in 2007• Between 100 and 150 workers during peak construction• Will pay between $81,000 and $135,000 to landowners annually• Suzlon hired 9 individuals for O&M positions (4 local)• Slated to pay more than $500,000 in property tax in 2008NATIONAL RENEWABLE ENERGY LABORATORY
Rail Splitter <strong>Wind</strong> Farm (Logan and Tazewell, IL)• Owned by Horizon <strong>Wind</strong> <strong>Energy</strong>• Commissioned 2009• 100.5 MW• (67) 1.5 MW GE turbines• More than 200 employed during peakconstruction• Expected to employ 10-15 O&M• Annual Lease payments will be in excess of$500,000 and annual Neighbor paymentswill be in excess of $50,000.• In the first year, Logan County is expectedto receive ~ $234,000 in tax revenue• Tazewell County local governments andschool district are expected to receive$513,000 in tax revenue• Of the 67 turbines, 29 will be located inLogan County, 38 will be in Tazewell• Logan County also received ~ $230,000 inbuilding permit fees.Photo courtesy of Julie Collins BatesNATIONAL RENEWABLE ENERGY LABORATORY
Streator Cayuga Ridge South <strong>Wind</strong> Power Project(Livingston County, Illinois)• Owned by Iberdrola Renewables• Commissioned 2010• 300 MW• (150) 2 MW Gamesa Turbines• More than 450 employed duringpeak construction• Expected to employ 15-20 O&M• 398,766 total project man-hoursworked• Annual Lease payments will be~$1,200,000• $2,700,000-3,500,000 annually intax revenue for Livingston CountyPhoto courtesy of Greater Livingston County Economic Development CouncilNATIONAL RENEWABLE ENERGY LABORATORY
Harvest <strong>Wind</strong> Farm(Chandler and Oliver Townships, MI)• 52.8 MW (32 Vestas1.65 MW)• Owned by John Deere <strong>Wind</strong><strong>Energy</strong>• Online 2008• 80 jobs will be created duringconstruction phase• Six to ten permanent employees• Land lease payments:~$3,000/turbine/yr• Project was supported with statetax incentive worth $6.5 millionover 12 yrs• Project will receive ~ $5 million insales tax exemptions throughMichigan’smanufacturing/industrialprocessing exemption.NATIONAL RENEWABLE ENERGY LABORATORY
Byers Auto Group <strong>Wind</strong> Turbines(Columbus & Delaware County, OH)• Proven <strong>Energy</strong> 15 kW – Delaware County,OH. Dedicated on November 19, 2010.• Northern Power Systems 100 kW –Columbus, OH. Dedicated on October 22,2010.• Idea originated while constructing newToyota showroom at the Delaware Countylocation• Partially funded through an Ohio Departmentof Development Grant for $200,000 and theSection 1603 of the Federal Tax Code thatprovided one-third of the total project cost inthe form of a line item tax credit.• Total cost of nearly $600,000 for bothinstallations.• Columbus turbine Zoning and Permittingprocess - city used existing languagepertaining to cellular towers.• Delaware County Zoning and Permittingprocess – group presented project toDelaware Planning Commission beforereceiving permission to install.• Renier Construction and ArchitecturalAlliance secured all building permits thatwere needed to begin constructionNATIONAL RENEWABLE ENERGY LABORATORY
Senior Housing Complex (Winter Harbor, ME)• Bergey Excel 10-kW turbine• Installed August 2007• Reduces energy costs for residents ofa subsidized elderly housing complex• Entirely funded by a federalResidential <strong>Energy</strong> AssistanceChallenge (REACH) grant• <strong>Wind</strong> turbine and tower cost $40,190• Installation cost $24,346• 3-year maintenance package included• Town debated: Is the wind turbine atower (not subject to zoning) or astructure (regulated by zoning)?• Verdict: turbine is NOT a structureNATIONAL RENEWABLE ENERGY LABORATORY
Hull <strong>Wind</strong> II (Hull, MA)• Owned by Hull Municipal Lightand Power (HMLP)• Commissioned in 2006• (1) Vestas 1.8 MW Turbines• Total cost of project ~$3 million• Annual O&M expenses are~$25,000, Insurance premiums =$16,000/year• HMLP signed a separate contractwith Harvard University for 50,000MWh of RECs from Hull <strong>Wind</strong> IIfor a total of $1.8 million• The federal government providesa performance-based renewablegeneration incentive payment of ~$0.018/kWh to municipal utilitiescalled the Renewable <strong>Energy</strong>Production Incentive (REPI)NATIONAL RENEWABLE ENERGY LABORATORY
Soaring Demand Spurs Expansion of U.S. <strong>Wind</strong>Turbine ManufacturingNATIONAL RENEWABLE ENERGY LABORATORY
Manufacturing and Economic DevelopmentTotal economic development impacts in Iowa(2,400 MW of development)Millions of Dollars$5,000$4,500$4,000$3,500$3,000$2,500$2,000$1,500$1,000$500$0Landowner PaymentsProperty tax paymentsOperations PeriodConstruction Period0% IA manfacturing 13% IA manufacturing(current proposed projects)35% IA manufacturing(increased utilization of currentmanufacturing capacity)NATIONAL RENEWABLE ENERGY LABORATORY
Local Ownership Models• Minnesota farmer cooperative(Minwind)• FLIP structure• Farmer-owned small wind• Farmer-owned commercial-scale© L. KennedyNATIONAL RENEWABLE ENERGY LABORATORY
NATIONAL RENEWABLE ENERGY LABORATORY
Comparing wind and coal in IndianaTotal Economic ImpactsDollars in millions$1,600$1,400$1,200$1,000$800$600$400$200Landowner revenueProperty taxesCoalOperationsConstruction$0<strong>Wind</strong> (1177 MW)Coal (500 MW, 28% instate)Constant 2007 dollarsNATIONAL RENEWABLE ENERGY LABORATORY
Comparing wind and coal in MichiganTotal Economic Impacts$1,800Landowner revenue$1,600Property taxes$1,400OperationsDollars in millions$1,200$1,000$800$600$400Const ruct ion$200$0<strong>Wind</strong> (1278 MW)Coal (500 MW, 0% in-state)Constant 2007 dollarsNATIONAL RENEWABLE ENERGY LABORATORY
Jobs and Economic Impact from the JEDI Model:1,000 MW of <strong>Wind</strong> Power in ColoradoJEDI Model Version W1.09.03eProject Development &Onsite Labor ImpactsLandowner Revenue:• $3 million/yearLocal Property Taxes:• $5.7 million/yearConstruction Phase:• 502 new jobs• $39 million to local economyOperational Phase:• 51 new jobs• $3.4M/year to local economyTurbine & Supply ChainImpactsConstruction Phase:• 3,059 new jobs• $414.8 million to localeconomiesOperational Phase:• 73 new jobs• $16.3 million/year to localeconomiesInduced ImpactsConstruction Phase:• 1,197 new jobs• $143.1 million to localeconomiesOperational Phase:• 63 new jobs• $7.6 million/year to localeconomiesConstruction Phase = 1-2 yearsOperational Phase = 20+ yearsTotals (construction + 20 years)Total economic benefit:New local jobs during construction:New local long-term jobs:$1.32 billion4,758187NATIONAL RENEWABLE ENERGY LABORATORY
Environmental BenefitsEnvironmental impacts of wind are limited to immediate locality.• No SOx or NOx• No particulates• No mercury• No CO2• No water• No wasteNATIONAL RENEWABLE ENERGY LABORATORY
NATIONAL RENEWABLE ENERGY LABORATORY Source: NOAA
NATIONAL RENEWABLE ENERGY LABORATORY Source: NOAA
<strong>Energy</strong>-Water NexusNATIONAL RENEWABLE ENERGY LABORATORYSources: EPRI, NOAA, Western Resource Advocates
Key Issues for <strong>Wind</strong> Power• Policy Uncertainty• Siting and Permitting: avian,noise, visual, federal land• Transmission: FERC rules,access, new lines• Operational impacts:intermittency, ancillary services,allocation of costs• Accounting for non-monetaryvalue: green power, no fuelprice risk, reduced emissionsNATIONAL RENEWABLE ENERGY LABORATORY
Key Issues for <strong>Wind</strong> PowerPolicy Uncertainty• Transmission: FERC rules,access, new lines, allocationof costs• Operational impacts:intermittency, ancillaryservices• Accounting for non-monetaryvalue: green power, no fuelprice risk, reduced emissions• Siting and Permitting:environmental impact, avian,federal land• Social Acceptance: noise,visual, home values, publicperceptionNATIONAL RENEWABLE ENERGY LABORATORY
Policy and Capital Instability• Inconsistency results in instability and lack of investment inmanufacturing capability• Policy implementation affects industry growth and stability.NATIONAL RENEWABLE ENERGY LABORATORY
Avian (Bird) Research• Over 200 projects, two problem sites.• Biggest problem was in Altamont Pass.• Manage by careful site selection.2%98%Nysted <strong>Wind</strong>farm - DenmarkNATIONAL RENEWABLE ENERGY LABORATORY
Summary of Anthropogenic Causes of Bird Mortality,- Erickson et. al., 2002http://www.fs.fed.us/psw/publications/documents/psw_gtr191/Asilomar/pdfs/1029-1042.pdfInstallation of enough wind to power eliminate all anthropogenic CO2 emission worldwide wouldresult in between 1.4 to 14 million deaths – less than 1% that were killed by the Avian flupandemic in 2005NATIONAL RENEWABLE ENERGY LABORATORY– Jacobson Dec 2008
Bat Fatality Estimates (per MW)NATIONAL RENEWABLE ENERGY LABORATORY
Mitigation and Management OptionsImplementation mitigating• Pre-construction assessment• Determine and avoid high riskareas• Impact mitigationOperation mitigation• Curtailment during high riskperiods that may be predictableTechnological• Development of techniques thatdeter or alert animals.NATIONAL RENEWABLE ENERGY LABORATORY
How loud are wind turbines?<strong>Wind</strong> turbines make noise and that noise has an impact.What is the sound level of a utility-scale wind turbine?• Depends on the turbine, but amaximum of 45 db at 350 meters• Sound analysis is very commonBut that’s not the whole story:• Relative level of noise as it relatesto background level• Individual noise sensitivity• Average vs. instantaneous levels• Noise can impact health – though:• Those who “use” the land• Those that “own” the land• People who like the concept vs. peoplewho have a negative viewThe key is to visit a wind turbineNATIONAL RENEWABLE ENERGY LABORATORY
Visual Impact & Land OwnershipKasigluk, AlaskaSan Cristobal, Galapagos• Clear, but not very welldocumented impact.• Based on data from new andexisting wind plants - no clearlong term cost impact tohousing near wind farms,even for large homes• People who havedemonstrated economicbenefit are much more likelyto support the project• Define the discussion, don’tlet project proponents do that.• A large amount ofvisualization tools available toallow people to see what thesite will look like – takeadvantage of themNATIONAL RENEWABLE ENERGY LABORATORY
20% <strong>Wind</strong> <strong>Energy</strong> by 20302 %“The future ain’t what it usedto be.”- Yogi Berra20 %NATIONAL RENEWABLE ENERGY LABORATORY
The 20% Technical Report• Explores one scenario for reaching 20% wind electricityby 2030 and contrasts it to a scenario in which no newU.S. wind power capacity is installed• Is not a prediction, but an analysis based on one scenario• Does not assume specific policy support for wind• Is the work of more than 100 individuals involved from2006 - 2008 (government, industry, utilities, NGOs)• Critically examines wind’s roles in energy security,economic prosperity and environmental sustainabilityNATIONAL RENEWABLE ENERGY LABORATORY
Supply Curve for <strong>Wind</strong> <strong>Energy</strong>:<strong>Energy</strong> and Transmission CostsLevelized Cost of <strong>Energy</strong>, $/MWh16014012010080604020OnshoreClass 7Class 6Class 5Class 4Class 3OffshoreClass 7Class 6Class 5Class 4Class 310% of existingtransmission capacityavailable to wind0- 200 400 600 800 1,0002010 Costs w/o PTC, $1,600/MW-mile,w/o Integration costsNATIONAL RENEWABLE ENERGY LABORATORYQuantity Available, GW
20% <strong>Wind</strong> Scenario305 GWInstalled Capacity as ofJanuary 2008 = 16,904 MWNATIONAL RENEWABLE ENERGY LABORATORY
What does 20% <strong>Wind</strong> look like?NATIONAL RENEWABLE ENERGY LABORATORYSource: DOE 20% Report
Annual Installed Capacity vs. CurrentInstalled CapacityActual installations2007: 5,329 MWCapacity additions in 20% ScenarioProjected installations2008: 7,500 MW*181614121086420Annual Installed Capacity (GW)Annual GW InstalledNATIONAL RENEWABLE ENERGY LABORATORYSource: AWEA, 2008
46 States Would Have Substantial <strong>Wind</strong>Development by 2030<strong>Wind</strong> CapacityTotal Installed (2030)(GW)0.0 - 0.10.1 - 11 - 55 - 10> 10Includes offshore wind.The black open square in the center of a state representsthe land area needed for a single wind farm to produce theprojected installed capacity in that state. The brown squarerepresents the actual land area that would be dedicatedto the wind turbines (2% of the black open square).NATIONAL RENEWABLE ENERGY LABORATORY
Need for New Transmission: Existing andNew in 2030NATIONAL RENEWABLE ENERGY LABORATORY
Economic Costs of 20% <strong>Wind</strong> Scenario$3000Incremental investment cost of 20% <strong>Wind</strong> ScenarioBillions of 2006 Dollars$2500$2000$1500$1000$5002% investmentdifference between 20%<strong>Wind</strong> and No New <strong>Wind</strong>$0No New <strong>Wind</strong><strong>Wind</strong> O&M Costs<strong>Wind</strong> Capital CostsTransmission Costs20% <strong>Wind</strong>Fuel CostsConventional O&M CostsConventional Capital CostsNATIONAL RENEWABLE ENERGY LABORATORY
20% <strong>Wind</strong> Scenario Impact on Generation Mixin 2030• Reduces electric utilitynatural gas consumptionby 50%• Reduces total natural gasconsumption by 11%• Natural gas consumerbenefits: $86-214 billion *• Reduces electric utilitycoal consumption by 18%• Avoids construction of 80GW of new coal powerplants100%80%60%40%20%0%U.S. electrical energy mixNo New <strong>Wind</strong>Natural GasCoalNuclear20% <strong>Wind</strong>Hydro<strong>Wind</strong>NATIONAL RENEWABLE ENERGY LABORATORY*Source: Hand et al., 2008
Fuel Savings from <strong>Wind</strong>4.5E+10MMBtu4.0E+103.5E+103.0E+102.5E+102.0E+101.5E+10Electricity SectorFuel UsageGas Fuel SavingsCoal Fuel SavingsGas Fuel Usage(20%wind)Coal Fuel Usage(20%wind)1.0E+105.0E+090.0E+00Reduction in National GasConsumption in 2030 (%)200020022004200620082010201220142016201820202022Natural Gas Price Reductionin 2030 (2006$/MMBtu)2024202620282030Present Value Benefits(billion 2006$)Levelized Benefit of<strong>Wind</strong> ($/MWh)11% 0.6 -1.1- 1.5 86 - 150 - 214 16.6 - 29 - 41.6NATIONAL RENEWABLE ENERGY LABORATORY
Cumulative Carbon SavingsCumulativeCarbon Savings(2007-2050, MMTCE)Present Value Benefits(billion 2006$)Levelized Benefit of <strong>Wind</strong>($/MWh-wind)4,182 MMTCE $ 50 - $145 $ 9.7/MWh - $ 28.2/MWhNATIONAL RENEWABLE ENERGY LABORATORYSource: DOE 20% Vision Report
CO2 Emissions from the Electricity SectorCO 2 Emissions in the Electric Sector(million metric tons)4,5004,0003,5003,0002,5002,0001,5001,000No New <strong>Wind</strong> Scenario CO 2 emissions20% <strong>Wind</strong> Scenario CO 2 emissions500USCAP path to 80% below today’s levels by 205002006 2010 2014 2018 2022 2026 2030NATIONAL RENEWABLE ENERGY LABORATORY
National (U.S.) Economic ImpactsCumulative Impacts from 2007-2030,From the 20% scenario – 300 GW new Onshore and Offshore DevelopmentJEDI Model Version W1.09.03eProject Development &Onsite Labor ImpactsLandowner Revenue:• $783 millionLocal Property Taxes:• $1,877 millionConstruction Phase:• 834,072 FTE jobs• $65 billion to the US economyOperational Phase:• 366,441 FTE jobs• $17 B to the US economyLocal Revenue, Turbine,& Supply Chain ImpactsConstruction Phase:• 2.63 M FTE jobs• $526 billion to the USeconomyOperational Phase:• 1.3 M FTE jobs• $207 billion to the USeconomyInduced ImpactsConstruction Phase:• 2.75 M FTE jobs• $353 billion to the USeconomyOperational Phase:• 1.64 M FTE jobs• $192 billion to the USeconomyConstruction Phase = 1-2 yearsOperational Phase = 20+ yearsAll assumptions based on DOE Report: 20% <strong>Wind</strong> <strong>Energy</strong> by 2030Totals (construction + 20 years)Total economic benefit:$1.36 trillionNew local jobs during construction: 6.2 M FTENew local long-term jobs: 3.3 M FTENATIONAL RENEWABLE ENERGY LABORATORY
Manufacturing Jobs Supported by StateJobs (in person-years)300 - 1,0001,000 - 5,0005,000 - 10,00010,000 - 20,00020,000 - 30,000> 30,000Manufacturing location information from REPP Report by Sterzinger & Svrcek (2004)Major component assumptions: 50% of blades are manufactured in U.S. in 2007 increasing to 80% by 2030,26% of towers are from the U.S. in 2007 increasing to 50% by 2030 and 20% of turbines are made in the U.S.increasing to 42% by 2030.NATIONAL RENEWABLE ENERGY LABORATORY
Jobs Supported by the 20% ScenarioOver 500,000 jobs would be supportedbetween 2007 and 2030}}Over 500,000 jobssupported by theindustry in 2030Approx. 180,000directly employedby windNATIONAL RENEWABLE ENERGY LABORATORY
Cumulative Water Savings from 20% ScenarioNATIONAL RENEWABLE ENERGY LABORATORYReduces water consumption of 4 trillion gallons through 2030(represents a reduction in electric sector water consumption by17% in 2030)
<strong>Wind</strong> Power Avoids Other Negative Impacts<strong>Wind</strong> power avoids thenegative impacts of fossil fuelbasedelectricity generation:• Air emissions of mercury orother heavy metals• Emissions from extractingand transporting fuels• Lake and streambedacidification• Production of toxic solidwastes, ash, or slurryPIX 00560NATIONAL RENEWABLE ENERGY LABORATORY
Other Benefits of 20% <strong>Wind</strong> <strong>Energy</strong>• Improves energy security by diversifying electricityportfolio with an indigenous energy source• Reduces fossil fuel demand and fuel prices, helping tostabilize electricity ratesNATIONAL RENEWABLE ENERGY LABORATORY
Results: Costs & BenefitsIncremental direct cost to societyReductions in emissions of greenhousegasses and other atmospheric pollutantsReductions in water consumptionJobs created and other economicbenefitsReductions in natural gas use and pricepressure$43 billion825 M tons (2030)$98 billion8% total electric17% in 2030150,000 direct$450 billion total11%$150 billionNet Benefits: $205B + Water savingsNATIONAL RENEWABLE ENERGY LABORATORY
Conclusions• <strong>Wind</strong> is no longer a niche technology in the US and around the world• <strong>Wind</strong> technology is competitive in the market• There are many drivers to the expanded development of wind• There are issues to wind development – so wind is not applicableeverywhere• Change is hard – and there are many who like the way things areworking now• But the nation needs energy and all energy has an impact• 20% wind energy penetration is possible but will not happen underbusiness as usual scenario• Policy choices will have a large impact on assessing the timing andrate of achieving a 20% goal• 20% <strong>Wind</strong> by 2030 report: May 2008 (www.20percentwind.org)NATIONAL RENEWABLE ENERGY LABORATORY
20% wind is possible……with stakeholders like you!NATIONAL RENEWABLE ENERGY LABORATORY
Carpe VentemFor more information, visit the <strong>Wind</strong> <strong>Powering</strong> <strong>America</strong> website,www.windpoweringamerica.gov or email us at: wpa@nrel.govNATIONAL RENEWABLE ENERGY LABORATORYWPA is funded by DOE’s <strong>Wind</strong> and Water Power Program