Time Domain & Frequency Domain - Mechatronics
Time Domain & Frequency Domain - Mechatronics
Time Domain & Frequency Domain - Mechatronics

You also want an ePaper? Increase the reach of your titles
YUMPU automatically turns print PDFs into web optimized ePapers that Google loves.
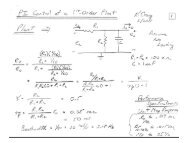
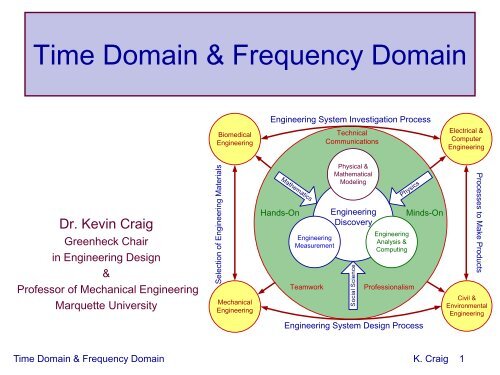
<strong>Time</strong> <strong>Domain</strong> & <strong>Frequency</strong> <strong>Domain</strong>• <strong>Time</strong> domain and frequency domain are two ways oflooking at the same dynamic system. They areinterchangeable, i.e., no information is lost inchanging from one domain to another.• They are complementary points of view that lead to acomplete, clear understanding of the behavior of adynamic engineering system.• Roughly speaking, in the time domain we measurehow long something takes, whereas in the frequencydomain we measure how fast or slow it is.• These are two ways of viewing the same thing!<strong>Time</strong> <strong>Domain</strong> & <strong>Frequency</strong> <strong>Domain</strong> K. Craig 2
– When you hear music and see color, you areexperiencing the frequency domain. It is all around you,just like the time domain.– The frequency domain is a kind of hidden companion toour everyday world of time. We describe what happensin the time domain as temporal and in the frequencydomain as spectral.– Most signals and processes involve both fast and slowcomponents happening at the same time. <strong>Frequency</strong>domain analysis separates these components and helpsto keep track of them.<strong>Time</strong> <strong>Domain</strong> & <strong>Frequency</strong> <strong>Domain</strong> K. Craig 3
MechanicalSpectrumElectromagneticSpectrum<strong>Time</strong> <strong>Domain</strong> & <strong>Frequency</strong> <strong>Domain</strong> K. Craig 5
• Electromagnetic Spectrum– Electromagnetic effects can be described in thefrequency domain as well.– Electromagnetic waves travel at the speed of light c,which depends on the medium (fastest in a vacuum,slower in other media).– The frequency of vibration f depends on the wavelengthλ of the electromagnetic phenomenon and the speed ofpropagation c of the medium according to f = c/λ.– Long-wavelength electromagnetic waves are radiowaves (see spectrum diagram). Frequencies range froma few kHz to 300 GHz.– Higher frequencies are emitted by thermal motion,which we call infrared radiation.<strong>Time</strong> <strong>Domain</strong> & <strong>Frequency</strong> <strong>Domain</strong> K. Craig 6
– Frequencies of visible light range from 440 THz(red light) to 730 THz (violet light).– Humans perceive different frequencies within thevisible light spectrum as different colors. Unlikethe ear, the eye has a nonlinear response tocombinations of frequencies.<strong>Time</strong> <strong>Domain</strong> & <strong>Frequency</strong> <strong>Domain</strong> K. Craig 7
Electromagnetic Spectrum<strong>Time</strong> <strong>Domain</strong> & <strong>Frequency</strong> <strong>Domain</strong> K. Craig 8
Radio Spectrum<strong>Time</strong> <strong>Domain</strong> & <strong>Frequency</strong> <strong>Domain</strong> K. Craig 9
• <strong>Time</strong> <strong>Domain</strong>– The time domain is a record of the response of adynamic system, as indicated by some measuredparameter, as a function of time. This is the traditionalway of observing the output of a dynamic system.– An example of time response is the displacement ofthe mass of the spring-mass-damper system versustime in response to the sudden placement of anadditional mass (here 50% of the attached mass) onthe attached mass. The resulting response is the stepresponse of the system due to the sudden applicationof a constant force to the attached mass equal to theweight of the additional mass. Typically when weinvestigate the performance of a dynamic system weuse as the input to the system a step input.<strong>Time</strong> <strong>Domain</strong> & <strong>Frequency</strong> <strong>Domain</strong> K. Craig 10
<strong>Time</strong> <strong>Domain</strong> & <strong>Frequency</strong> <strong>Domain</strong> K. Craig 11
• <strong>Frequency</strong> <strong>Domain</strong>– Over one hundred years ago, Jean BaptisteFourier showed that any waveform that exists inthe real world can be generated by adding up sinewaves.– By picking the amplitudes, frequencies, andphases of these sine waves, one can generate awaveform identical to the desired signal.– While the situation presented on the next page iscontrived, it does illustrate the idea. On the left isa “real-world” signal and on the right are threesignals, the sum of which is the same as the “realworld”signal.<strong>Time</strong> <strong>Domain</strong> & <strong>Frequency</strong> <strong>Domain</strong> K. Craig 12
<strong>Time</strong> <strong>Domain</strong> & <strong>Frequency</strong> <strong>Domain</strong> K. Craig 13
– A more convincing example is to observe that asquare wave can be represented by a series ofsine waves of different amplitudes, frequencies,and phase angles. In the diagram below, asquare wave has been approximated with only twosine waves. As more sine waves are added to theseries, the approximation becomes better andbetter.<strong>Time</strong> <strong>Domain</strong> & <strong>Frequency</strong> <strong>Domain</strong> K. Craig 14
– Any real-world signal can be broken down into asum of sine waves and this combination of sinewaves is unique. Any real-world signal can berepresented by only one combination of sinewaves.– In the diagram, a waveform is represented as thesum of two sine waves.<strong>Time</strong> <strong>Domain</strong> & <strong>Frequency</strong> <strong>Domain</strong> K. Craig 15
– In figure (a) is a three-dimensional graph of thisaddition of sine waves. The three axes are time,amplitude, and frequency. The time andamplitude axes are familiar from the time domain.The third axis, frequency, allows us to visuallyseparate the sine waves that add to give us thecomplex waveform.– If we view this three-dimensional graph along thefrequency axis, we get the view shown in figure(b). This is the time-domain view of the sinewaves. Adding them together at each instant oftime gives the original waveform.<strong>Time</strong> <strong>Domain</strong> & <strong>Frequency</strong> <strong>Domain</strong> K. Craig 16
– Now view the three-dimensional graph along thetime axis, as in figure (c). Here we have axes ofamplitude versus frequency. This is what is calledthe frequency domain. Every sine wave weseparated from the input appears as a verticalline. Its height represents its amplitude and itsposition represents its frequency. We know eachline represents a sine wave and so we haveuniquely characterized our input signal in thefrequency domain. This frequency domainrepresentation of our signal is called the spectrumof the signal. Each sine wave line of the spectrumis called a component of the total signal.<strong>Time</strong> <strong>Domain</strong> & <strong>Frequency</strong> <strong>Domain</strong> K. Craig 17
<strong>Time</strong> <strong>Domain</strong> & <strong>Frequency</strong> <strong>Domain</strong> K. Craig 18
– It is most important to understand that we haveneither gained nor lost information, we are justrepresenting it differently.– You can now see why a sine wave is the secondimportant signal, the step input being the other,used to excite a dynamic system.– Since any real-world signal can be represented bythe sum of sine waves, if we can predict theresponse of a system to a sine wave input ofvarying frequency, amplitude, and phase angle,then we can predict the response of the system toany real-world signal once we know the frequencyspectrum of that real-world signal.<strong>Time</strong> <strong>Domain</strong> & <strong>Frequency</strong> <strong>Domain</strong> K. Craig 19
LabVIEW<strong>Time</strong> <strong>Domain</strong><strong>Frequency</strong> <strong>Domain</strong>Exercise<strong>Time</strong> <strong>Domain</strong> & <strong>Frequency</strong> <strong>Domain</strong> K. Craig 20
LabVIEWBlock Diagram<strong>Time</strong> <strong>Domain</strong> & <strong>Frequency</strong> <strong>Domain</strong> K. Craig 21