An investigation of mutant white-eye Drosophila ... - Michelle Wang
An investigation of mutant white-eye Drosophila ... - Michelle Wang
An investigation of mutant white-eye Drosophila ... - Michelle Wang
Create successful ePaper yourself
Turn your PDF publications into a flip-book with our unique Google optimized e-Paper software.
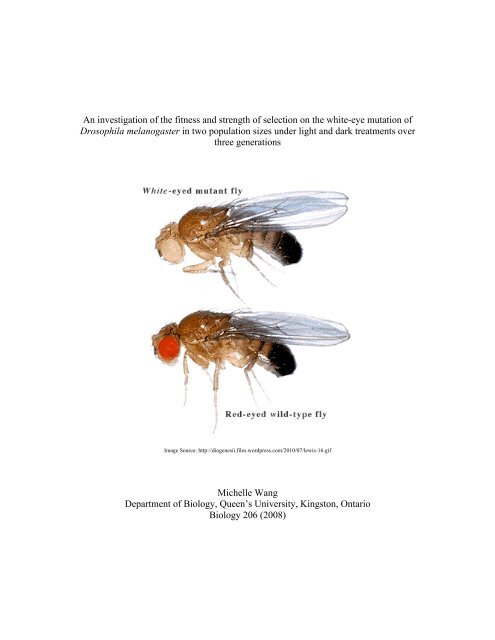
<strong>An</strong> <strong>investigation</strong> <strong>of</strong> the fitness and strength <strong>of</strong> selection on the <strong>white</strong>-<strong>eye</strong> mutation <strong>of</strong><strong>Drosophila</strong> melanogaster in two population sizes under light and dark treatments overthree generationsImage Source: http://diogenesii.files.wordpress.com/2010/07/lewis-16.gif<strong>Michelle</strong> <strong>Wang</strong>Department <strong>of</strong> Biology, Queen’s University, Kingston, OntarioBiology 206 (2008)
acted on by only two major forces, the non-random natural selection and random geneticdrift. For any given diallelic system at a locus, the frequencies <strong>of</strong> the two alleles willdepend on the strength <strong>of</strong> selection on an allele in different population sizes, and thechance for drift via random sampling errors. While evolution by natural selection acts onfitness that is heritable, genetic drift has no impact on fitness <strong>of</strong> the organisms. However,both are equally important in regards to producing evolutionary changes over thegenerations.The focus <strong>of</strong> the experiment was on the recessive and X-linked <strong>white</strong> mutationallele that produces observable <strong>white</strong> <strong>eye</strong>s in <strong>Drosophila</strong>. This particular trait is alwaysexpressed in males if they carry only one copy <strong>of</strong> the <strong>white</strong> allele. Like other <strong>mutant</strong>s, the<strong>white</strong> mutation creates a fitness cost. It causes effective blindness and slowerdevelopment in <strong>Drosophila</strong>. However, the <strong>white</strong>-<strong>eye</strong>d flies are more vigorous. Theexperimental populations were set up with an equal allele frequencies at the dialleliclocus (p=0.5, q=0.5) at the parental stage and a maximum heterozygosity value <strong>of</strong> 0.5.For each subsequent generation, the progenies are counted to assess the viability <strong>of</strong> the<strong>white</strong> allele on fitness under two selective conditions for two different population sizes,small and large. In the light, natural selection against the <strong>white</strong>-<strong>eye</strong>d phenotype is likelyto be stronger, while in the dark, selection tends to be weaker. Over the generations, the<strong>white</strong> allele frequency and the overall heterozygosity would likely to decrease in both thelight and dark treatments.In this study, small and large populations <strong>of</strong> <strong>Drosophila</strong> melanogaster wereestablished to measure fitness under various conditions. The purpose <strong>of</strong> this study was toexamine the changes in the gene frequency <strong>of</strong> the <strong>white</strong> allele in <strong>Drosophila</strong> over three
complete generations and the two evolutionary forces, selection and genetic drift, indifferent sized populations under light and dark treatments.METHODS AND MATERIALSIn the parental generation, eight virgin heterozygous (+/w) females were added intoeach <strong>of</strong> the 20 vials containing eight wildtype and eight <strong>white</strong>-<strong>eye</strong>d males. A smallamount <strong>of</strong> yeast was placed at the bottom <strong>of</strong> the vials to stimulate oviposition. Randomly,ten vials were selected to be light-pro<strong>of</strong>ed using construction papers, while the other tenvials are light vials. When all the vials were prepared and positioned in the incubator.After 48 hours, the eggs for F1 generation have been laid and the adult flies werediscarded. The eggs were allowed to develop into adults. To start the F2 generation, thevials were gently tapped down and F1 adult flies were transferred to empty vials. Theadults were then given a light dose <strong>of</strong> FlyNap. Upon the FlyNap, the flies scored andrecorded to compile the F1 generation data. To set up the F2 generation, eight femaleswere randomly removed from each population <strong>of</strong> the five light and five dark vials andplaced in fresh vials. This composed the F2 small populations. For large population, allthe flies were mixed together and collected randomly eight females into each <strong>of</strong> five lightvials and five dark vials. The same protocol was followed to propagate twelvepopulations for F3 generation. The phenotypes were recorded at each generation.RESULTSThe allele frequencies changed in both the dark and light treatments. In smallpopulations <strong>of</strong> light treatment, the <strong>white</strong> frequency (q) decreased from 0.5 in the parental
generation to 0.23 in F3, whereas in the dark, q increased from 0.5 to 0.533. In largepopulations, <strong>white</strong> frequency decreased from 0.5 to 0 and 0.5 to 0.271 in the light anddark conditions respectively. Thus, the <strong>white</strong> allele frequencies overall changed morerapidly in the light than in the dark over the three generations in two population sizes.The q increased in dark while decreased in light for small populations, and the qdecreased in both light and dark treatments in large populations. Figure 1 and Table 1describe and quantify these results. The variances did change and increased over thegenerations in both light and dark conditions. There was a significant difference in themean variances <strong>of</strong> q between the light and dark treatment over three generations (twotailed,paired t-test, p=0.062911). The variances in the mean <strong>white</strong> allele frequency wassignificantly greater in the light treatment (one-tailed, paired t-test, p=0.001587) andgreater in the dark treatment (one-tailed, paired t-test, p=0.000256) than in the parentalgeneration. The mean difference between the two treatments was calculated to be 0.0686± 0.01159. Compared to the group data, the overall section data indicated a decline in qover three generations in the small and large populations under both light and darktreatments, whereas the group data showed the same trend but an increase in q for smallpopulations in dark treatment. Both the group and section data indicated increases invariance <strong>of</strong> the <strong>white</strong> allele frequency in light and dark treatments across all populations.The observed differences could be expected from random practical sampling errors andthe impact <strong>of</strong> this on small populations. Other theoretical reasons to expect thesedifferences could be natural selection and possibly an increased fitness for the <strong>white</strong>allele due to a higher physical aggressiveness <strong>of</strong> <strong>Drosophila</strong> in the dark. In light and
significant differences between the light and dark treatments in the final mean variances<strong>of</strong> q for the small populations (two-tailed, paired t-test, p=0.437069) and for the largepopulations (two-tailed, paired t-test, p=0.057871). Furthermore, it was found that thefinal mean variances at F3 in the light (one-tailed, paired t-test, p=0.001434) and darktreatment (one-tailed, paired t-test, p=0.001879) were significantly greater or equal to theparental variance. Over time, the mean variances in q increased and this pattern wasobserved in the light and dark treatments <strong>of</strong> large and small populations.The heterozygosity values decreased over three generations for both light and darktreatments in the small and large populations. Table 4 quantifies the heterozygosityresults. The decline in heterozygosity was more rapid in the light than in the dark for bothlarge and small populations (Figure 4). The heterozyosity values decreased from 0.5 to0.377 in small populations and 0.5 to 0.389 in large populations under light conditions. Indark treatments, heterozygosity was reduced from 0.5 to 0.480 and 0.5 to 0.462 in smalland large populations respectively.It was found that the F3 heterozygosity wassignificantly less than the parental or initial heterozygosity <strong>of</strong> 0.5 in the light treatment(one-tailed, paired t-test, p=0.00445) and in the dark treatment (one-tailed, paired t-test,p=0.002441). The pattern was found to be the same in the light and dark treatments.Moreover, the heterozygosity at F3 was found to be significantly greater in the smallpopulation under dark than light treatment (one-tailed, paired t-test, p=0.142552), andgreater in the large population under dark than light treatment (one-tailed, paired t-test,p=0.249207). A one-tailed t-test was used, because <strong>of</strong> a priori expectation <strong>of</strong> an increaseor decrease in the heterozygosity over time in both the light and dark treatments. One-
tailed test was supplemented to determine the direction <strong>of</strong> heterozygosity change overthree generations in both treatments.Wright-FisherThe Wright-Fisher expectations for the variance in the F3 generation for each <strong>of</strong> the fourtreatments are shown in Table 5. Compared to the class’ mean variance values, variancesin all four treatments were larger than the expected Wright-Fisher variances. From thecomparative analysis <strong>of</strong> difference in variances between the four treatments, there was a51.3% increase in observed variance compared to the expected variance in smallpopulation under light treatment and a 140.9% increase under the dark treatment. In thelarge population, the percent increase in variance under light treatment was 267.9% and264.3% under dark treatment. The increase in variance is observed to be higher in thelarge populations than in the small populations comparatively. Thus, the class’ meanobserved variances did compare favourably for small populations in both dark and lightconditions than in the large populations under light and dark.DISCUSSIONIn the present study, the mean frequencies <strong>of</strong> the <strong>mutant</strong> <strong>white</strong> allele in <strong>Drosophila</strong>were observed to have decreased more rapidly in the light than in the dark treatment <strong>of</strong>both the small and large populations over the three generations. The mean variances overtime increased across all populations and treatments. Heterozygosity was found to havedecreased from the parental maximum heterozygosity <strong>of</strong> 0.5 in large and smallpopulations under the light and dark environment. The heterozygosity values observed inthe dark treatment were higher than those observed in the light treatment across two
In other words, more discrimination towards the male flies was probably present in thelight than dark. This could explain that the declines in heterozygosity and in the mean<strong>white</strong> allele frequency over the generations were smaller in the dark than in the lightenvironment. In fact, deviation from non-random mating, such as assortative mating, canhave dramatic effects on the heterozygosity <strong>of</strong> subsequent generation in reducing theheterozygosity value by half per generation (Chippindale et al. 2008). Althoughassortative mating itself does not cause changes in allele frequencies, but when coupledwith non-random natural selection, allele frequencies could rapidly alter. Consequently,th observed pattern <strong>of</strong> declines in heterozygosity across all treatments and populationmight be due to the directional selection from assortative mating.Although physiological differences in phenotype contribute to the relative fitnessand mating success in males, genetic drift can produce dramatic random effects onevolution through chance events known as sampling errors. Among the nonselectivemechanisms <strong>of</strong> evolution, genetic drifts in finite populations are absolutely random andare simply blind differential reproductive success that does not lead to adaptations(Freeman and Herron 2007). A similar study on <strong>Drosophila</strong> conducted by Peter Buri(1956) revealed and confirmed that alleles did become fixed or completely lost while theheterozygosity declined under genetic drift. The fixation <strong>of</strong> one allele was observed inthis experiment under the group data. The <strong>white</strong> allele frequency was entirely lost and thewildtype allele frequency reached 1 in the large population <strong>of</strong> light treatment at F3. Thisobservation could be an outlier because it is unlikely to observe fixation in a dialleliclocus for a large population size. However, although genetic drift is more rapid in smallpopulations and slower in large populations, given sufficient time, genetic drift can
produce dramatic alterations in allele frequencies in large-sized populations (Freemanand Herron 2007)The mean variances were observed to have increased in both the large and smallpopulations under the light and dark environment. Over time, the changes in variance in aparticular allele frequency depend on the population size, the number <strong>of</strong> generationselapsed and the initial allele frequencies (Chippindale et al. 2008). According to theWright-Fisher model, as the effective population size (N) increases, the variance changesslowly in finite populations and it would not change at all in infinite population(Chippindale et al. 2008). This prediction was observed in the results where the finalmean variances in the small populations were greater than that <strong>of</strong> the large populations inboth treatments. The changes in variances over the generations were expected due togenetic drift. The differences between the expected and observed mean variances mightbe due to sampling errors, but they were considerably close, especially in smallpopulations.In this experiment, non-random and random evolutionary forces were examined in<strong>Drosophila</strong> under different population sizes and various treatments over three generations.The heterozygosity and the mean <strong>white</strong> allele frequency both decreased over thegenerations in all populations and treatments, and were observed to be more rapid in thelight treatment. The final mean variances were indicated to have increased from theparental generation. These observations could be explained by the dynamic impact <strong>of</strong>evolutionary forces such as genetic drift and natural selection and departure from nonrandommating. Future researches are needed to provide further insight into other factorsthat might have decreased the survival <strong>of</strong> the <strong>white</strong> allele in the light environment.
APPENDIXTable 1: The mean <strong>white</strong> allele frequencies over three generations in small and largepopulations under light and dark treatments.Light small Dark smallP 0.5 0.5F1 0.272 0.472F2 0.23 0.533F3 0.428 0.416Light large Dark largeP 0.5 0.5F1 0.137 0.398F2 0.242 0.248F3 0 0.271Table 2: The variance in the mean <strong>white</strong> allele frequency <strong>of</strong> small populations under lightand dark treatments. (Group data)Light small Dark smallP 0 0F1 0.0931 0.0372F2 0.113 0.0344F3 0.107 0.0357Table 3: The allele frequencies over three generations. No means and variances wereobtained for larger populations because N=1. q represents the frequency <strong>of</strong> the <strong>white</strong>allele and p represents the frequency <strong>of</strong> the wildtype. (Group data)LightTreatmentGeneration MeanpAllVARpMeanqAllVARqMeanSum <strong>of</strong>adultsLight, small F1 0.572 0.0931 0.428 0.0931 63.6Light, small F2 0.728 0.113 0.272 0.113 46.4Light, small F3 0.770 0.107 0.230 0.107 61.8Dark, small F1 0.584 0.0372 0.416 0.0372 63.8Dark, small F2 0.545 0.0344 0.472 0.0344 134Dark, small F3 0.467 0.0357 0.533 0.0357 34.4Light, large F1 0.863 - 0.137 - 298Light, large F2 0.758 - 0.242 - 878Light, large F3 1 - 0 - 289Dark, large F1 0.602 - 0.398 - 392Dark, large F2 0.752 - 0.248 - 609Dark, large F3 0.729 - 0.271 - 670Table 4: The allele frequencies over three generations from pooled data. (Section data)TreatmentGenerationMeanpAllVAR(p)MeanqALLVAR(q)H
Light Small F1 0.639046 0.01587 0.360954 0.01587 0.46133Light Small F2 0.73182 0.033047 0.26818 0.033047 0.392519Light Small F3 0.748212 0.03443 0.251788 0.03443 0.376782Light Large F1 0.615233 0.012099 0.384767 0.012099 0.473443Light Large F2 0.72723 0.007063 0.27277 0.007063 0.396733Light Large F3 0.735382 0.017142 0.264618 0.017142 0.38919Dark Small F1 0.588813 0.018861 0.411187 0.018861 0.484225Dark Small F2 0.596147 0.035657 0.403853 0.035657 0.481512Dark Small F3 0.600745 0.054798 0.399255 0.054798 0.479701Dark Large F1 0.578119 0.008262 0.421881 0.008262 0.487794Dark Large F2 0.628215 0.021636 0.371785 0.021636 0.467122Dark Large F3 0.637243 0.016968 0.362757 0.016968 0.462329Table 5: Comparison between the Wright-Fisher expectations for the variance vs. theobserved mean variance in the F3 generation for each <strong>of</strong> the four treatments.Treatments Wright-FisherexpectedvarianceObservedmeanvarianceDifference(observed –expected)Light small 0.0227471 0.03443 0.01168 51.347%Dark small 0.0227471 0.054798 0.03205 140.897%Light large 0.004658 0.017142 0.01248 267.926%Dark large 0.004658 0.016968 0.01231 264.277%PercentIncrease(Difference/Expected)X 100%(A) Light Treatment(B) Dark Treatment:
Figure 1: (a) The change in allele frequency <strong>of</strong> the <strong>white</strong> allele in <strong>Drosophila</strong>melanogaster from the P generation to the F 3 adults for each <strong>of</strong> the six differentexperimental populations in the light treatment. (b) The change in allele frequency <strong>of</strong> the<strong>white</strong> allele in <strong>Drosophila</strong> melanogaster from the P generation to the F 3 adults for each <strong>of</strong>the six different experimental populations in the dark treatment.Figure 2: The average change in allele frequency <strong>of</strong> <strong>white</strong> allele from the P generation tothe F 3 adults <strong>of</strong> <strong>Drosophila</strong> melanogaster in the light and dark treatments <strong>of</strong> two differentpopulation sizes, small and large.
Figure 3: The variance in allele frequency <strong>of</strong> <strong>white</strong> allele from the P generation to the F 3adults <strong>of</strong> <strong>Drosophila</strong> melanogaster in the light and dark treatments <strong>of</strong> two differentpopulation sizes, small and large.Figure 4: Figure 3: The heterozygosity value from the P generation to the F 3 adults <strong>of</strong><strong>Drosophila</strong> melanogaster in the light and dark treatments <strong>of</strong> two different populationsizes, small and large.REFERENCEBuri P. 1956 Gene Frequency in Small Populations <strong>of</strong> Mutant <strong>Drosophila</strong>. Evolution10(4): 367-402.Chippindale, A.K., C.G. Eckert and S.C. Lougheed. 2008 Introduction to EvolutionaryGenetics Lab Manual. Queen's University, Kingston.L2.2-3.2, L3.4-3.9, L5.1-5.6,L6.1-6.2pp.Connolly, K., B. Burnet and D. Sewell. 1969 Selective Mating and Eye Pigmentation: <strong>An</strong><strong>An</strong>alysis <strong>of</strong> the Visual Component in the Courtship Behavior <strong>of</strong> <strong>Drosophila</strong>melanogaster. Evolution 23 (4): 548-559.Freeman, S. and Herron, J.C. 2007. Evolutionary <strong>An</strong>alysis 4 th Edition. Upper Saddle :Pearson Education Inc.Geer, B.W. and M. M. Green 1962. Genotype, Phenotype and Mating Behavior <strong>of</strong><strong>Drosophila</strong> melanogaster. The American Naturalist 96(888):175-181.


