Market Insights from CBRE's Hanoi Quarterly Report Q2/2012
Market Insights from CBRE's Hanoi Quarterly Report Q2/2012
Market Insights from CBRE's Hanoi Quarterly Report Q2/2012

You also want an ePaper? Increase the reach of your titles
YUMPU automatically turns print PDFs into web optimized ePapers that Google loves.
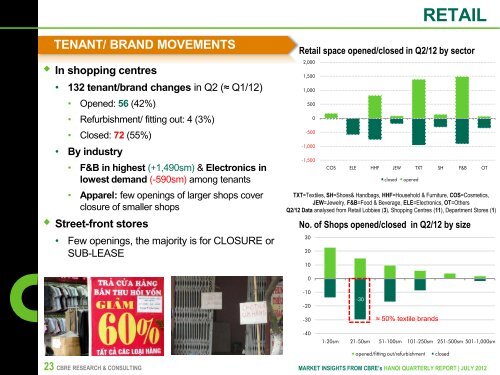
RETAILTENANT/ BRAND MOVEMENTS• In shopping centres• 132 tenant/brand changes in <strong>Q2</strong> (≈ Q1/12)• Opened: 56 (42%)• Refurbishment/ fitting out: 4 (3%)• Closed: 72 (55%)• By industry• F&B in highest (+1,490sm) & Electronics inlowest demand (-590sm) among tenants• Apparel: few openings of larger shops coverclosure of smaller shops• Street-front stores• Few openings, the majority is for CLOSURE orSUB-LEASERetail space opened/closed in <strong>Q2</strong>/12 by sector2,0001,5001,000500TXT=Textiles, SH=Shoes& Handbags, HHF=Household & Furniture, COS=Cosmetics,JEW=Jewelry, F&B=Food & Beverage, ELE=Electronics, OT=Others<strong>Q2</strong>/12 Data analysed <strong>from</strong> Retail Lobbies (3), Shopping Centres (11), Department Stores (1)3020100-500-1,000-1,500COS ELE HHF JEW TXT SH F&B OTclosedopenedNo. of Shops opened/closed in <strong>Q2</strong>/12 by size0-10-20-30-30-40≈ 50% textile brands1-20sm 21-50sm 51-100sm 101-250sm 251-500sm 501-1,000smopened/fitting out/refurbishmentclosed23 CBRE RESEARCH & CONSULTING MARKET INSIGHTS FROM CBRE’s HANOI QUARTERLY REPORT | JULY <strong>2012</strong>