A comparison of bootstrap methods and an adjusted bootstrap ...
A comparison of bootstrap methods and an adjusted bootstrap ...
A comparison of bootstrap methods and an adjusted bootstrap ...

Create successful ePaper yourself
Turn your PDF publications into a flip-book with our unique Google optimized e-Paper software.
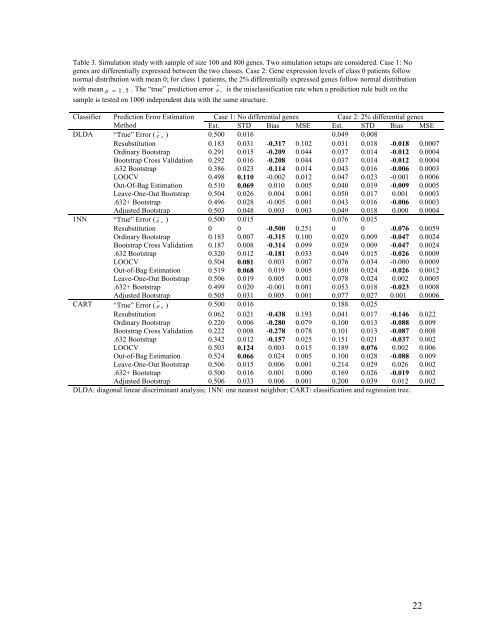
Table 3. Simulation study with sample <strong>of</strong> size 100 <strong><strong>an</strong>d</strong> 800 genes. Two simulation setups are considered. Case 1: Nogenes are differentially expressed between the two classes. Case 2: Gene expression levels <strong>of</strong> class 0 patients follownormal distribution with me<strong>an</strong> 0; for class 1 patients, the 2% differentially expressed genes follow normal distributionwith me<strong>an</strong> µ = 1.5 . The “true” prediction error e n is the misclassification rate when a prediction rule built on thesample is tested on 1000 independent data with the same structure.Classifier Prediction Error Estimation Case 1: No differential genesCase 2: 2% differential genesMethod Est. STD Bias MSE Est. STD Bias MSEDLDA “True” Error ( e n )0.500 0.016 0.049 0.008Resubstitution 0.183 0.031 -0.317 0.102 0.031 0.018 -0.018 0.0007Ordinary Bootstrap 0.291 0.015 -0.209 0.044 0.037 0.014 -0.012 0.0004Bootstrap Cross Validation 0.292 0.016 -0.208 0.044 0.037 0.014 -0.012 0.0004.632 Bootstrap 0.386 0.023 -0.114 0.014 0.043 0.016 -0.006 0.0003LOOCV 0.498 0.110 -0.002 0.012 0.047 0.023 -0.001 0.0006Out-Of-Bag Estimation 0.510 0.069 0.010 0.005 0.040 0.019 -0.009 0.0005Leave-One-Out Bootstrap 0.504 0.026 0.004 0.001 0.050 0.017 0.001 0.0003.632+ Bootstrap 0.496 0.028 -0.005 0.001 0.043 0.016 -0.006 0.0003Adjusted Bootstrap 0.503 0.048 0.003 0.003 0.049 0.018 0.000 0.00041NN “True” Error ( e n )0.500 0.015 0.076 0.015Resubstitution 0 0 -0.500 0.251 0 0 -0.076 0.0059Ordinary Bootstrap 0.185 0.007 -0.315 0.100 0.029 0.009 -0.047 0.0024Bootstrap Cross Validation 0.187 0.008 -0.314 0.099 0.029 0.009 -0.047 0.0024.632 Bootstrap 0.320 0.012 -0.181 0.033 0.049 0.015 -0.026 0.0009LOOCV 0.504 0.081 0.003 0.007 0.076 0.034 -0.000 0.0009Out-<strong>of</strong>-Bag Estimation 0.519 0.068 0.019 0.005 0.050 0.024 -0.026 0.0012Leave-One-Out Bootstrap 0.506 0.019 0.005 0.001 0.078 0.024 0.002 0.0005.632+ Bootstrap 0.499 0.020 -0.001 0.001 0.053 0.018 -0.023 0.0008Adjusted Bootstrap 0.505 0.031 0.005 0.001 0.077 0.027 0.001 0.0006CART “True” Error ( e n )0.500 0.016 0.188 0.025Resubstitution 0.062 0.021 -0.438 0.193 0.041 0.017 -0.146 0.022Ordinary Bootstrap 0.220 0.006 -0.280 0.079 0.100 0.013 -0.088 0.009Bootstrap Cross Validation 0.222 0.008 -0.278 0.078 0.101 0.013 -0.087 0.008.632 Bootstrap 0.342 0.012 -0.157 0.025 0.151 0.021 -0.037 0.002LOOCV 0.503 0.124 0.003 0.015 0.189 0.076 0.002 0.006Out-<strong>of</strong>-Bag Estimation 0.524 0.066 0.024 0.005 0.100 0.028 -0.088 0.009Leave-One-Out Bootstrap 0.506 0.015 0.006 0.001 0.214 0.029 0.026 0.002.632+ Bootstrap 0.500 0.016 0.001 0.000 0.169 0.026 -0.019 0.002Adjusted Bootstrap 0.506 0.033 0.006 0.001 0.200 0.039 0.012 0.002DLDA: diagonal linear discrimin<strong>an</strong>t <strong>an</strong>alysis; 1NN: one nearest neighbor; CART: classification <strong><strong>an</strong>d</strong> regression tree.22