Pathway to Proficiency: Linking the STAR Reading and STAR Math ...
Pathway to Proficiency: Linking the STAR Reading and STAR Math ...
Pathway to Proficiency: Linking the STAR Reading and STAR Math ...

Create successful ePaper yourself
Turn your PDF publications into a flip-book with our unique Google optimized e-Paper software.
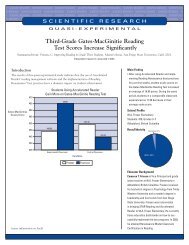
Additional reports au<strong>to</strong>matically generated by <strong>the</strong> <strong>STAR</strong> tests help educa<strong>to</strong>rs screen for laterdifficulties <strong>and</strong> progress moni<strong>to</strong>r students’ responsiveness <strong>to</strong> interventions.Sources of Data<strong>STAR</strong> <strong>Reading</strong> <strong>and</strong> <strong>STAR</strong> <strong>Math</strong> data were ga<strong>the</strong>red from schools that use those assessments onRenaissance Learning’s Real Time platform. 2 Performance-level distributions from <strong>the</strong> ARMT+<strong>Reading</strong> <strong>and</strong> Ma<strong>the</strong>matics were retrieved from <strong>the</strong> Alabama Department of Education.ARMT+ uses four performance categories:Level I, Level II, Level III, <strong>and</strong> Level IV.Students scoring in <strong>the</strong> Level III or Level IVrange would be counted as meetingproficiency st<strong>and</strong>ards for state <strong>and</strong> federalperformance-level reportingThis study uses <strong>STAR</strong> <strong>Reading</strong>, <strong>STAR</strong> <strong>Math</strong>, <strong>and</strong> ARMT+ data from <strong>the</strong> 2011–12 school year.MethodologyARMT+ Performance Levels:• Level I• Level II• Level III• Level IVMany of <strong>the</strong> ways <strong>to</strong> link scores between two tests require that <strong>the</strong> scores from each test beavailable at a student level. Obtaining a sufficient sample of student-level data can be a lengthy<strong>and</strong> difficult process. However, <strong>the</strong>re is an alternative technique that produces similar resultswithout requiring us <strong>to</strong> know each individual student’s ARMT+ score <strong>and</strong> <strong>STAR</strong> scaled score.The alternative involves using school-level data <strong>to</strong> determine <strong>the</strong> <strong>STAR</strong> scaled scores thatcorrespond <strong>to</strong> each ARMT+ performance level cutscore. School level ARMT+ data arepublically available, allowing us <strong>to</strong> streamline <strong>the</strong> linking process <strong>and</strong> complete linking studiesmore rapidly.The <strong>STAR</strong> scores used in this analysis were “projected” scaled scores. Each observed <strong>STAR</strong>score was projected <strong>to</strong> <strong>the</strong> mid-point of <strong>the</strong> ARMT+ administration window using <strong>STAR</strong><strong>Reading</strong> <strong>and</strong> <strong>STAR</strong> <strong>Math</strong> decile-based growth norms. The growth norms are both grade- <strong>and</strong>subject-specific <strong>and</strong> are based on <strong>the</strong> growth patterns of more than one million students using<strong>STAR</strong> assessments over a three-year period. They provide typical growth rates for students basedon <strong>the</strong>ir starting <strong>STAR</strong> test score, making predictions much more accurate than a “one-size-fitsall”growth rate.For each observed score, <strong>the</strong> number of weeks between <strong>the</strong> <strong>STAR</strong> test administration date <strong>and</strong><strong>the</strong> mid-point of <strong>the</strong> ARMT+ window was calculated. To get <strong>the</strong> <strong>to</strong>tal expected growth from <strong>the</strong>date of <strong>the</strong> <strong>STAR</strong> test <strong>to</strong> <strong>the</strong> ARMT+ , <strong>the</strong> number of weeks between <strong>the</strong> two tests was multipliedby <strong>the</strong> student’s expected weekly scaled score growth (from our decile-based growth norms,which take in<strong>to</strong> account grade <strong>and</strong> starting observed score). The <strong>to</strong>tal expected growth was <strong>the</strong>nadded <strong>to</strong> <strong>the</strong> observed scaled score <strong>to</strong> determine <strong>the</strong>ir projected score at <strong>the</strong> time of <strong>the</strong> ARMT+ .If a student <strong>to</strong>ok multiple <strong>STAR</strong> tests during <strong>the</strong> school year, all <strong>the</strong>ir projected scores wereaveraged.2 Renaissance Place Real Time is a service that involves “hosting” schools’ data from <strong>the</strong> <strong>STAR</strong> tests <strong>and</strong> o<strong>the</strong>rproducts. For more information about Real Time, see http://www.renlearn.com/RPRT/default.aspxRenaissance Learning <strong>Linking</strong> <strong>STAR</strong> assessments <strong>to</strong> <strong>the</strong> ARMT+ Page 4
Sample Description: <strong>Reading</strong>A <strong>to</strong>tal of 409 unique schools across grades 3 through 8 met <strong>the</strong> sample requirements for reading(explained in Sample Selection). Racial/ethnic characteristics for each grade of <strong>the</strong> sample arepresented along with statewide averages in Table 1 <strong>and</strong> suggest that White students were slightlyover-represented.Table 2 displays by-grade test summaries for <strong>the</strong> reading sample. It includes counts of studentstaking <strong>STAR</strong> <strong>Reading</strong> <strong>and</strong> <strong>the</strong> ARMT+ <strong>Reading</strong>. It also includes percentages of students in eachperformance level, both for <strong>the</strong> sample <strong>and</strong> statewide. Despite White students beingoverrepresented, students in <strong>the</strong> reading sample had similar ARMT+ performance <strong>to</strong> <strong>the</strong>statewide population.Table 1. Characteristics of reading sample: Racial/ethnic statisticsGradeNumber ofschoolsAmer.IndianPercent of students by racial/ethnic categoryAsian Black Hispanic White Mult.3 116 0.5% 0.5% 30.1% 2.7% 66.2% 0.0%4 145 0.3% 0.6% 29.3% 1.7% 68.1% 0.0%5 159 0.4% 0.6% 33.3% 1.3% 64.4% 0.0%6 134 0.6% 0.5% 38.2% 1.5% 59.2% 0.0%7 99 0.5% 0.8% 35.6% 1.0% 62.1% 0.0%8 92 0.5% 1.1% 38.2% 0.7% 59.5% 0.0%Statewide 0.9% 1.4% 34.0% 4.6% 58.3% 0.8%Table 2. Characteristics of reading sample: Performance on <strong>STAR</strong> <strong>Reading</strong> <strong>and</strong> <strong>the</strong>ARMT+ for <strong>Reading</strong>Grade<strong>STAR</strong><strong>Reading</strong>StudentsARMT+<strong>Reading</strong>StudentsLevel I Level II Level III Level IVSample Statewide Sample Statewide Sample Statewide Sample Statewide3 8,891 8,685 1% 1% 11% 11% 32% 34% 56% 54%4 12,079 11,798 0% 0% 10% 12% 30% 32% 60% 56%5 14,126 13,786 0% 0% 11% 11% 27% 29% 62% 60%6 13,015 12,753 1% 1% 11% 11% 22% 22% 66% 66%7 12,951 12,806 0% 1% 12% 13% 30% 31% 58% 55%8 11,872 11,674 1% 1% 18% 20% 38% 39% 43% 40%Renaissance Learning <strong>Linking</strong> <strong>STAR</strong> assessments <strong>to</strong> <strong>the</strong> ARMT+ Page 6
Sample Description: <strong>Math</strong>A <strong>to</strong>tal of 297 unique schools across grades 3 through 8 met <strong>the</strong> sample requirements for math(explained in Sample Selection). Tables 3 <strong>and</strong> 4 present demographic <strong>and</strong> achievement data from<strong>the</strong> math sample, along with comparisons <strong>to</strong> state averages. Like reading, White students wereover-represented in <strong>the</strong> math sample. Despite White students being overrepresented, <strong>the</strong> mathsample was similar <strong>to</strong> <strong>the</strong> statewide student population in terms of ARMT+ performance.Table 3. Characteristics of math sample: Racial/ethnic statisticsGradeNumber ofschoolsAmer.IndianPercent of students by racial/ethnic categoryAsian Black Hispanic White Mult.3 105 0.1% 0.7% 31.9% 1.5% 65.8% 0.0%4 123 0.7% 0.5% 31.3% 1.5% 66.0% 0.0%5 114 0.6% 0.8% 31.8% 0.8% 66.0% 0.0%6 101 0.7% 0.9% 27.9% 1.4% 69.0% 0.1%7 72 0.8% 1.5% 33.0% 1.3% 63.4% 0.0%8 71 1.1% 1.3% 31.3% 1.1% 65.2% 0.0%Statewide 0.9% 1.4% 34.0% 4.6% 58.3% 0.8%Table 4. Characteristics of math sample: Performance on <strong>STAR</strong> <strong>Math</strong> <strong>and</strong> <strong>the</strong> ARMT+ forMa<strong>the</strong>maticsGrade<strong>STAR</strong><strong>Math</strong>StudentsARMT+<strong>Math</strong>StudentsLevel I Level II Level III Level IVSample Statewide Sample Statewide Sample Statewide Sample Statewide3 8,488 8,287 3% 3% 12% 12% 24% 24% 61% 61%4 10,055 9,838 2% 2% 12% 12% 26% 27% 60% 59%5 10,025 9,785 0% 0% 8% 8% 28% 29% 64% 63%6 10,078 9,853 0% 0% 19% 22% 41% 43% 40% 35%7 9,659 9,549 0% 1% 26% 27% 39% 38% 35% 34%8 9,428 9,362 0% 0% 18% 21% 45% 48% 37% 31%Renaissance Learning <strong>Linking</strong> <strong>STAR</strong> assessments <strong>to</strong> <strong>the</strong> ARMT+ Page 7
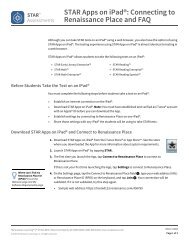
AnalysisFirst, we aggregated <strong>the</strong> sample of schools for each subject <strong>to</strong> grade level. Next, we calculated<strong>the</strong> percentage of students scoring in each ARMT+ performance level for each grade. Finally, weordered <strong>STAR</strong> scores <strong>and</strong> analyzed <strong>the</strong> distribution <strong>to</strong> determine <strong>the</strong> scaled score at <strong>the</strong> samepercentile as <strong>the</strong> ARMT+ Level III level. For example, in our third grade reading sample, 1% ofstudents were Level I, 11% were Level II, 32% were Level III, <strong>and</strong> 56% were Level IV.Therefore, <strong>the</strong> cutscores for proficiency levels in <strong>the</strong> third grade are at <strong>the</strong> 1 st percentile for LevelII, <strong>the</strong> 12 th percentile for Level III, <strong>and</strong> <strong>the</strong> 44 th percentile for Level IV.Figure 1. Illustration of linked <strong>STAR</strong> <strong>Reading</strong> <strong>and</strong> <strong>the</strong> third-grade ARMT+ for <strong>Reading</strong>scaleRenaissance Learning <strong>Linking</strong> <strong>STAR</strong> assessments <strong>to</strong> <strong>the</strong> ARMT+ Page 8
Results <strong>and</strong> ReportingTable 5 presents estimates of equivalent scores on <strong>the</strong> <strong>STAR</strong> <strong>Reading</strong> score scale <strong>and</strong> <strong>the</strong>ARMT+ for <strong>Reading</strong>. Table 6 presents estimates of equivalent scores on <strong>the</strong> <strong>STAR</strong> <strong>Math</strong> scorescale <strong>and</strong> <strong>the</strong> ARMT+ for Ma<strong>the</strong>matics. These results will be incorporated in<strong>to</strong> <strong>STAR</strong>Performance Reports (see Sample Reports, pp. 12–15) that can be used <strong>to</strong> help educa<strong>to</strong>rsdetermine early <strong>and</strong> periodically which students are on track <strong>to</strong> reach <strong>the</strong> Level III status orhigher <strong>and</strong> <strong>to</strong> make instructional decisions accordingly.Table 5. Estimated <strong>STAR</strong> <strong>Reading</strong> cutscores for <strong>the</strong> ARMT+ for <strong>Reading</strong> performancelevelsGradeLevel I Level II Level III Level IVCut score Cut score Percentile Cut score Percentile Cut score Percentile3 < 129 129 1 279 12 423 444 < 149 149 1 333 10 489 405 < 161 161 1 382 11 536 386 < 173 173 1 427 12 563 347 < 197 197 1 457 12 671 428 < 226 226 1 563 19 893 57Table 6. Estimated <strong>STAR</strong> <strong>Math</strong> cutscores for <strong>the</strong> ARMT+ for Ma<strong>the</strong>matics performancelevelsGradeLevel I Level II Level III Level IVCut score Cut score Percentile Cut score Percentile Cut score Percentile3 < 414 414 3 534 15 602 394 < 451 451 2 586 14 662 405 < 452 452 1 587 8 703 366 < 466 466 1 689 19 797 607 < 467 467 1 712 26 820 658 < 479 479 1 713 18 848 63Renaissance Learning <strong>Linking</strong> <strong>STAR</strong> assessments <strong>to</strong> <strong>the</strong> ARMT+ Page 9
References <strong>and</strong> Additional InformationB<strong>and</strong>eira de Mello, V., Blankenship, C., & McLaughlin, D. H. (2009). Mapping state proficiencyst<strong>and</strong>ards on<strong>to</strong> NAEP scales: 2005–2007 (NCES 2010-456). Washing<strong>to</strong>n, DC: U.S.Department of Education, Institute of Education Sciences, National Center for EducationStatistics. Retrieved February 2010 fromhttp://www.schooldata.org/Portals/0/uploads/Reports/LSAC_2003_h<strong>and</strong>out.pptCronin, J., Kingsbury, G. G., Dahlin, M., & Bowe, B. (2007, April). Alternate methodologies forestimating state st<strong>and</strong>ards on a widely used computer adaptive test. Paper presented at<strong>the</strong> American Educational Research Association, Chicago, IL.McGlaughlin, D. H., & V. B<strong>and</strong>eira de Mello. (2002, April). Comparison of state elementaryschool ma<strong>the</strong>matics achievement st<strong>and</strong>ards using NAEP 2000. Paper presented at <strong>the</strong>annual meeting of <strong>the</strong> American Educational Research Association, New Orleans, LA.McLaughlin, D., & B<strong>and</strong>eira de Mello, V. (2003, June). Comparing state reading <strong>and</strong> mathperformance st<strong>and</strong>ards using NAEP. Paper presented at <strong>the</strong> National Conference onLarge-Scale Assessment, San An<strong>to</strong>nio, TX.McLaughlin, D., & B<strong>and</strong>eira de Mello, V. (2006). How <strong>to</strong> compare NAEP <strong>and</strong> state assessmentresults. Paper presented at <strong>the</strong> annual National Conference on Large-Scale Assessment.Retrieved February 2010 from http://www.naepreports.org/task 1.1/LSAC_20050618.pptMcLaughlin, D. H., B<strong>and</strong>eira de Mello, V., Blankenship, C., Chaney, K., Esra, P., Hikawa, H., etal. (2008a). Comparison between NAEP <strong>and</strong> state reading assessment results: 2003(NCES 2008-474). Washing<strong>to</strong>n, DC: U.S. Department of Education, Institute ofEducation Sciences, National Center for Education Statistics.McLaughlin, D.H., B<strong>and</strong>eira de Mello, V., Blankenship, C., Chaney, K., Esra, P., Hikawa, H., etal. (2008b). Comparison between NAEP <strong>and</strong> state ma<strong>the</strong>matics assessment results: 2003(NCES 2008-475). Washing<strong>to</strong>n, DC: U.S. Department of Education, Institute ofEducation Sciences, National Center for Education Statistics.Perie, M., Marion, S., Gong, B., & Wurtzel, J. (2007). The role of interim assessments in acomprehensive assessment system. Aspen, CO: Aspen Institute.Renaissance Learning. (2010). The foundation of <strong>the</strong> <strong>STAR</strong> assessments. Wisconsin Rapids, WI:Author. Available online from http://doc.renlearn.com/KMNet/R003957507GG2170.pdfRenaissance Learning. (2012a). <strong>STAR</strong> <strong>Math</strong>: Technical manual. Wisconsin Rapids, WI: Author.Available from Renaissance Learning by request <strong>to</strong> research@renlearn.comRenaissance Learning. (2012b). <strong>STAR</strong> <strong>Reading</strong>: Technical manual. Wisconsin Rapids, WI:Author. Available from Renaissance Learning by request <strong>to</strong> research@renlearn.comRenaissance Learning <strong>Linking</strong> <strong>STAR</strong> assessments <strong>to</strong> <strong>the</strong> ARMT+ Page 10
Independent technical reviews of <strong>STAR</strong> <strong>Reading</strong> <strong>and</strong> <strong>STAR</strong> <strong>Math</strong>U.S. Department of Education: National Center on Intensive Intervention. (2012). Review ofprogress moni<strong>to</strong>ring <strong>to</strong>ols [Review of <strong>STAR</strong> <strong>Math</strong>]. Washing<strong>to</strong>n, DC: Author. Availableonline from http://www.intensiveintervention.org/chart/progress-moni<strong>to</strong>ringU.S. Department of Education: National Center on Intensive Intervention. (2012). Review ofprogress moni<strong>to</strong>ring <strong>to</strong>ols [Review of <strong>STAR</strong> <strong>Reading</strong>]. Washing<strong>to</strong>n, DC: Author.Available online from http://www.intensiveintervention.org/chart/progress-moni<strong>to</strong>ringU.S. Department of Education: National Center on Response <strong>to</strong> Intervention. (2010). Review ofprogress-moni<strong>to</strong>ring <strong>to</strong>ols [Review of <strong>STAR</strong> <strong>Math</strong>]. Washing<strong>to</strong>n, DC: Author. Availableonline from http://www.rti4success.org/ProgressMoni<strong>to</strong>ringToolsU.S. Department of Education: National Center on Response <strong>to</strong> Intervention. (2010). Review ofprogress-moni<strong>to</strong>ring <strong>to</strong>ols [Review of <strong>STAR</strong> <strong>Reading</strong>]. Washing<strong>to</strong>n, DC: Author.Available online from http://www.rti4success.org/ProgressMoni<strong>to</strong>ringToolsU.S. Department of Education: National Center on Response <strong>to</strong> Intervention. (2011). Review ofscreening <strong>to</strong>ols [Review of <strong>STAR</strong> <strong>Math</strong>]. Washing<strong>to</strong>n, DC: Author. Available onlinefrom http://www.rti4success.org/ScreeningToolsU.S. Department of Education: National Center on Response <strong>to</strong> Intervention. (2011). Review ofscreening <strong>to</strong>ols [Review of <strong>STAR</strong> <strong>Reading</strong>]. Washing<strong>to</strong>n, DC: Author. Available onlinefrom http://www.rti4success.org/ScreeningToolsRenaissance Learning <strong>Linking</strong> <strong>STAR</strong> assessments <strong>to</strong> <strong>the</strong> ARMT+ Page 11
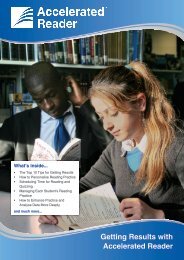
Sample Reports 3Sample <strong>STAR</strong> Performance Reports focusing on <strong>the</strong> <strong>Pathway</strong> <strong>to</strong> <strong>Proficiency</strong>. This reportwill be available <strong>to</strong> Alabama schools using <strong>STAR</strong> <strong>Reading</strong> Enterprise or <strong>STAR</strong> <strong>Math</strong> Enterprise.The report graphs <strong>the</strong> student’s <strong>STAR</strong> <strong>Reading</strong> or <strong>STAR</strong> <strong>Math</strong> scores <strong>and</strong> trend line (projectedgrowth) for easy comparison with <strong>the</strong> pathway <strong>to</strong> proficiency on <strong>the</strong> ARMT+ .3 Reports are regularly reviewed <strong>and</strong> may vary from those shown as enhancements are made.Renaissance Learning <strong>Linking</strong> <strong>STAR</strong> assessments <strong>to</strong> <strong>the</strong> ARMT+ Page 12
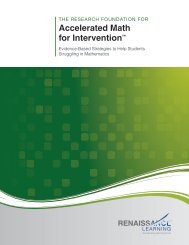
Sample Growth <strong>Proficiency</strong> Chart. Using <strong>the</strong> classroom GPC, school administra<strong>to</strong>rs <strong>and</strong> teachers can better identify best practices that arehaving a significant educational impact on student growth. Displayed on an interactive, web-based growth proficiency chart, <strong>STAR</strong>Assessments’ Student Growth Percentiles <strong>and</strong> expected State Assessment performance are viewable by district, school, grade, or class. Inaddition <strong>to</strong> Student Growth Percentiles, <strong>the</strong> Growth Report displays o<strong>the</strong>r key growth indica<strong>to</strong>rs such as grade equivalency, percentile rank,<strong>and</strong> instructional reading level.Renaissance Learning <strong>Linking</strong> <strong>STAR</strong> assessments <strong>to</strong> <strong>the</strong> ARMT+ Page 14
AcknowledgmentsThe following experts have advised Renaissance Learning in <strong>the</strong> development of <strong>the</strong> <strong>STAR</strong> assessments.Thomas P. Hogan, Ph.D., is a professor of psychology <strong>and</strong> a Distinguished University Fellow at <strong>the</strong>University of Scran<strong>to</strong>n. He has more than 40 years of experience conducting reviews of ma<strong>the</strong>maticscurricular content, principally in connection with <strong>the</strong> preparation of a wide variety of educational tests,including <strong>the</strong> Stanford Diagnostic Ma<strong>the</strong>matics Test, Stanford Modern Ma<strong>the</strong>matics Test, <strong>and</strong> <strong>the</strong>Metropolitan Achievement Test. Hogan has published articles in <strong>the</strong> Journal for Researchin Ma<strong>the</strong>matics Education <strong>and</strong> Ma<strong>the</strong>matical Thinking <strong>and</strong> Learning, <strong>and</strong> he has authored two textbooks<strong>and</strong> more than 100 scholarly publications in <strong>the</strong> areas of measurement <strong>and</strong> evaluation. He has also served as consultant <strong>to</strong> awide variety of school systems, states, <strong>and</strong> o<strong>the</strong>r organizations on matters of educational assessment, program evaluation, <strong>and</strong>research design.James R. McBride, Ph.D., is vice president <strong>and</strong> chief psychometrician for Renaissance Learning. Hewas a leader of <strong>the</strong> pioneering work related <strong>to</strong> computerized adaptive testing (CAT) conducted by <strong>the</strong>Department of Defense. McBride has been instrumental in <strong>the</strong> practical application of item response<strong>the</strong>ory (IRT) <strong>and</strong> since 1976 has conducted test development <strong>and</strong> personnel research for a variety oforganizations. At Renaissance Learning, he has contributed <strong>to</strong> <strong>the</strong> psychometric research <strong>and</strong>development of <strong>STAR</strong> <strong>Math</strong>, <strong>STAR</strong> <strong>Reading</strong>, <strong>and</strong> <strong>STAR</strong> Early Literacy. McBride is co-edi<strong>to</strong>r of aleading book on <strong>the</strong> development of CAT <strong>and</strong> has authored numerous journal articles, professionalpapers, book chapters, <strong>and</strong> technical reports.Michael Milone, Ph.D., is a research psychologist <strong>and</strong> award-winning educational writer <strong>and</strong> consultant<strong>to</strong> publishers <strong>and</strong> school districts. He earned a Ph.D. in 1978 from The Ohio State University <strong>and</strong> hasserved in an adjunct capacity at Ohio State, <strong>the</strong> University of Arizona, Gallaudet University, <strong>and</strong> NewMexico State University. He has taught in regular <strong>and</strong> special education programs at all levels, holds aMaster of Arts degree from Gallaudet University, <strong>and</strong> is fluent in American Sign Language. Miloneserved on <strong>the</strong> board of direc<strong>to</strong>rs of <strong>the</strong> Association of Educational Publishers <strong>and</strong> was a member of <strong>the</strong>Literacy Assessment Committee <strong>and</strong> a past chair of <strong>the</strong> Technology <strong>and</strong> Literacy Committee of <strong>the</strong>International <strong>Reading</strong> Association. He has contributed <strong>to</strong> both readingonline.org <strong>and</strong> Technology & Learning magazine on aregular basis. Over <strong>the</strong> past 30 years, he has been involved in a broad range of publishing projects, including <strong>the</strong> SRA readingseries, assessments developed for Academic Therapy Publications, <strong>and</strong> software published by The Learning Company <strong>and</strong>LeapFrog. He has completed 34 marathons <strong>and</strong> 2 Ironman races.R44719.130215