Macro-flow and Velocity Dispersion - SEG Digital Library
Macro-flow and Velocity Dispersion - SEG Digital Library
Macro-flow and Velocity Dispersion - SEG Digital Library

Create successful ePaper yourself
Turn your PDF publications into a flip-book with our unique Google optimized e-Paper software.
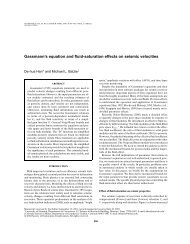
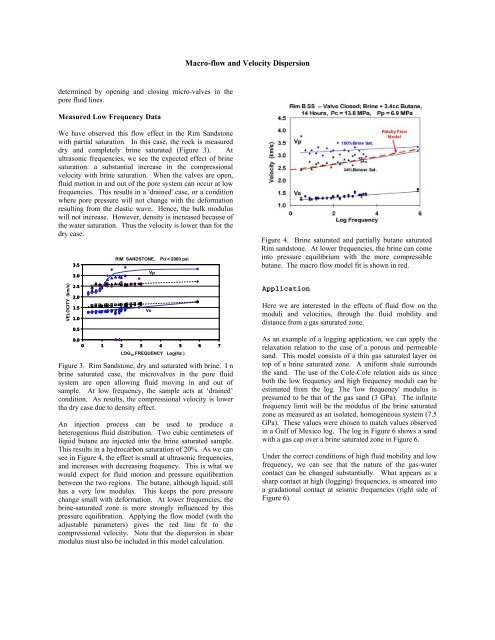
<strong>Macro</strong>-<strong>flow</strong> <strong>and</strong> <strong>Velocity</strong> <strong>Dispersion</strong>determined by opening <strong>and</strong> closing micro-valves in thepore fluid lines.Measured Low Frequency DataWe have observed this <strong>flow</strong> effect in the Rim S<strong>and</strong>stonewith partial saturation. In this case, the rock is measureddry <strong>and</strong> completely brine saturated (Figure 3). Atultrasonic frequencies, we see the expected effect of brinesaturation: a substantial increase in the compressionalvelocity with brine saturation. When the valves are open,fluid motion in <strong>and</strong> out of the pore system can occur at lowfrequencies. This results in a 'drained' case, or a conditionwhere pore pressure will not change with the deformationresulting from the elastic wave. Hence, the bulk moduluswill not increase. However, density is increased because ofthe water saturation. Thus the velocity is lower than for thedry case.VELOCITY (km/s)3.53.02.52.01.51.00.5RIM SANDSTONE,Pd = 2000 psi0.00 1 2 3 4 5 6 7LOG 10 FREQUENCY Log(Hz )Figure 3. Rim S<strong>and</strong>stone, dry <strong>and</strong> saturated with brine. I nbrine saturated case, the microvalves in the pore fluidsystem are open allowing fluid moving in <strong>and</strong> out ofsample. At low frequency, the sample acts at ‘drained’condition. As results, the compressional velocity is lowertha dry case due to density effect.An injection process can be used to produce aheterogenious fluid distribution. Two cubic centimeters ofliquid butane are injected into the brine saturated sample.This results in a hydrocarbon saturation of 20%. As we cansee in Figure 4, the effect is small at ultrasonic frequencies,<strong>and</strong> increases with decreasing frequency. This is what wewould expect for fluid motion <strong>and</strong> pressure equilibrationbetween the two regions. The butane, although liquid, stillhas a very low modulus. This keeps the pore pressurechange small with deformation. At lower frequencies, thebrine-saturated zone is more strongly influenced by thispressure equilibration. Applying the <strong>flow</strong> model (with theadjustable parameters) gives the red line fit to thecompressional velocity. Note that the dispersion in shearmodulus must also be included in this model calculation.VsVpFigure 4. Brine saturated <strong>and</strong> partially butane saturatedRim s<strong>and</strong>stone. At lower frequencies, the brine can comeinto pressure equilibrium with the more compressiblebutane. The macro <strong>flow</strong> model fit is shown in red.ApplicationHere we are interested in the effects of fluid <strong>flow</strong> on themoduli <strong>and</strong> velocities, through the fluid mobility <strong>and</strong>distance from a gas saturated zone.As an example of a logging application, we can apply therelaxation relation to the case of a porous <strong>and</strong> permeables<strong>and</strong>. This model consists of a thin gas saturated layer ontop of a brine saturated zone. A uniform shale surroundsthe s<strong>and</strong>. The use of the Cole-Cole relation aids us sinceboth the low frequency <strong>and</strong> high frequency moduli can beestimated from the log. The 'low frequency' modulus ispresumed to be that of the gas s<strong>and</strong> (3 GPa). The infinitefrequency limit will be the modulus of the brine saturatedzone as measured as an isolated, homogeneous system (7.5GPa). These values were chosen to match values observedin a Gulf of Mexico log. The log in Figure 6 shows a s<strong>and</strong>with a gas cap over a brine saturated zone in Figure 6.Under the correct conditions of high fluid mobility <strong>and</strong> lowfrequency, we can see that the nature of the gas-watercontact can be changed substantially. What appears as asharp contact at high (logging) frequencies, is smeared intoa gradational contact at seismic frequencies (right side ofFigure 6).