Provision of Sight Distance around Concrete Barriers and Structures ...
Provision of Sight Distance around Concrete Barriers and Structures ...
Provision of Sight Distance around Concrete Barriers and Structures ...

You also want an ePaper? Increase the reach of your titles
YUMPU automatically turns print PDFs into web optimized ePapers that Google loves.
Arndt, Cox, Lennie & Whitehead 1Title: <strong>Provision</strong> <strong>of</strong> <strong>Sight</strong> <strong>Distance</strong> <strong>around</strong> <strong>Concrete</strong> <strong>Barriers</strong> <strong>and</strong> <strong>Structures</strong> onFreeways <strong>and</strong> InterchangesA paper prepared for the 4 th International Symposium on Highway Geometric DesignSubmission Date: October 2009Number <strong>of</strong> words in paper: 8166CORRESPONDING AUTHOR’S DETAILSDr Owen K ArndtPrincipal Advisor (Road Design St<strong>and</strong>ards)Queensl<strong>and</strong> Department <strong>of</strong> Transport <strong>and</strong> Main RoadsFloor 6, 477 Boundary Street, Spring HillGPO Box 1412, Brisbane, Queensl<strong>and</strong>, Australia, 4001.Phone: +61 7 3834 2398Fax: +61 7 3834 2998Email: owen.k.arndt@tmr.qld.gov.auCOAUTHORS’ DETAILSRicky L. CoxPrincipal Advisor (Design Innovation <strong>and</strong> St<strong>and</strong>ards)Queensl<strong>and</strong> Department <strong>of</strong> Transport <strong>and</strong> Main RoadsPhone: +61 7 3834 2285Email: ricky.l.cox@tmr.qld.gov.auS<strong>and</strong>ra C LenniePrincipal Engineer (Road Engineering St<strong>and</strong>ards)Queensl<strong>and</strong> Department <strong>of</strong> Transport <strong>and</strong> Main RoadsPhone: +61 7 3834 2709Email: s<strong>and</strong>ra.c.lennie@tmr.qld.gov.auMike T WhiteheadPrincipal Engineer (Road Design St<strong>and</strong>ards)Queensl<strong>and</strong> Department <strong>of</strong> Transport <strong>and</strong> Main RoadsPhone: +61 7 3834 5047Email: mike.t.whitehead@tmr.qld.gov.auAddress <strong>and</strong> fax details are the same for all authors
Arndt, Cox, Lennie & Whitehead 2AbstractUse <strong>of</strong> 1.1m high concrete barriers at both median <strong>and</strong> outer shoulder edges <strong>of</strong> freeways is common in Australia.Use <strong>of</strong> such barriers is also common on interchange ramps on or under structures. Where curved ramps form anoverpass <strong>of</strong> a major road or a road crosses a rail line, 1.4m high concrete barriers <strong>and</strong> larger are used.The provision <strong>of</strong> normal stopping sight distance criteria <strong>around</strong> these concrete barriers <strong>and</strong> otherstructures such as bridge abutments <strong>and</strong> retailing walls on horizontal curves (<strong>and</strong> on combinations <strong>of</strong> horizontal<strong>and</strong> vertical curves) can lead to very wide shoulders being required. This can have ramifications with decreasedbarrier performance. Previously, such shoulder widths were <strong>of</strong>ten considered uneconomical <strong>and</strong> only narrowshoulders were provided. This was either based on some artificially low design speed, or even worse, byignoring the sight distance requirements altogether <strong>and</strong> simply providing what was considered to be ‘practical’.This paper discusses new criteria for the provision <strong>of</strong> sight distance <strong>around</strong> barriers <strong>and</strong> structures, asdocumented in the 2009 release <strong>of</strong> the Austroads ‘Guide to Road Design Series’. This series forms the primaryroad design guides for Australia <strong>and</strong> New Zeal<strong>and</strong>. The new criteria achieve practical, yet justifiable results by: Using the current stopping sight distance models to provide stopping to likely hazards (in most cases) Using less conservative, but realistic values within the stopping sight distance model based on theresults on international <strong>and</strong> Australian research Ensuring supplementary manoeuvre capability, including minimum shoulder widths, for avoidingsmaller objects Being based on the predicted operating (85th percentile speed) on each geometric element Considering sight distance capability for both cars <strong>and</strong> trucks
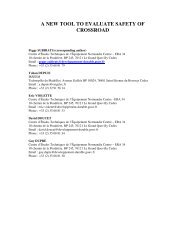
Arndt, Cox, Lennie & Whitehead 3<strong>Provision</strong> <strong>of</strong> <strong>Sight</strong> <strong>Distance</strong> <strong>around</strong> <strong>Concrete</strong> <strong>Barriers</strong> <strong>and</strong> <strong>Structures</strong> on Freeways <strong>and</strong>InterchangesINTRODUCTIONThe purpose <strong>of</strong> this paper is to describe the development <strong>and</strong> use <strong>of</strong> practical, yet justifiable criteria for theprovision <strong>of</strong> sight distance <strong>around</strong> concrete safety barriers <strong>and</strong> structures (eg bridge abutments <strong>and</strong> retainingwalls) on freeways <strong>and</strong> interchanges. These criteria are documented in Part 3 <strong>of</strong> the 2009 release <strong>of</strong> theAustroads ‘Guide to Road Design Series’ (GRD) (1), the primary road design guides for Australia <strong>and</strong> NewZeal<strong>and</strong>.BACKGROUND<strong>Concrete</strong> barrier heights <strong>of</strong> 1.1m <strong>and</strong> 1.4m are commonly being used in Australia on freeways <strong>and</strong> atinterchanges. The normal stopping sight distance model in Part 3 <strong>of</strong> the GRD (1) (<strong>and</strong> previous Austroadspublications) requires a driver <strong>of</strong> a passenger car with a 1.1m eye height to see a small object on the roadway <strong>of</strong>0.2m height. On horizontal curves (or on combinations <strong>of</strong> horizontal <strong>and</strong> vertical crest curves), such a line <strong>of</strong>sight is normally not possible over concrete barriers. Nor is a line <strong>of</strong> sight to the taillight <strong>of</strong> a passenger vehicle<strong>of</strong> 0.8m height <strong>of</strong>ten achievable. In these cases, application <strong>of</strong> the normal stopping sight distance model requiresthe line <strong>of</strong> sight to be fully contained within the trafficable lane <strong>and</strong> shoulder.The following situations also require the line <strong>of</strong> sight to be fully contained within the trafficable lane<strong>and</strong> shoulder on horizontal curves: Retaining walls <strong>of</strong> significant height Tunnels Bridge structures eg underpasses, abutments <strong>and</strong> piersIn areas where it is not possible to provide the normal stopping distance criteria over roadside safetybarriers <strong>and</strong> structures, it is preferable to increase the horizontal curve radius or the <strong>of</strong>fset as per AASHTO (2).However, increasing the horizontal curve radius on ramps will usually increase the operating speed. This meansthat much larger horizontal curves are usually required before the <strong>of</strong>fset is significantly reduced. Further, inconstrained areas, increasing the curve radius is difficult due to financial costs <strong>and</strong> social/ environmentalimpacts resulting from l<strong>and</strong> resumptions.In Australia in recent years, there has been increasing pressure to ensure road designs are suitable fortrucks. In fact, since 2009, the design <strong>of</strong> all new roads should now cater for the requirements <strong>of</strong> trucks (1). Whenapplying the normal stopping sight distance model, this means that truck drivers with a 2.4m eye height havesufficient distance to perceive/react <strong>and</strong> stop for a 0.2m high hazard on the roadway.Over crest vertical curves, the normal stopping sight distance requirements for passenger cars in manycases provide sufficient sight distance for trucks. Although trucks take a longer distance to brake compared to apassenger car, their higher eye height over crests usually compensates for this. This is not the case for sightdistance on horizontal curves where the higher truck eye height is usually <strong>of</strong> no advantage. Experience hasshown that application <strong>of</strong> stopping sight distance for trucks on horizontal curves on ramps means that anadditional <strong>of</strong>fset <strong>of</strong> up to 4m is required over that for cars.Prior to the release <strong>of</strong> the GRD (1), the provision <strong>of</strong> stopping sight distance <strong>around</strong> concrete barriers<strong>and</strong> structures on freeways <strong>and</strong> interchanges has varied within Australia. Some designers have insisted onstrictly applying the normal stopping sight distance model, others have disregarded sight distance requirementsaltogether whilst many have simply assumed a lower design speed. Each <strong>of</strong> these techniques are discussedbelow, along with potential problems that each causes.TECHNIQUE NUMBER 1 - APPLY THE NORMAL STOPPING SIGHT DISTANCE MODELApplication <strong>of</strong> the normal stopping sight distance model <strong>around</strong> concrete safety barriers <strong>and</strong> structures <strong>of</strong>tenresults in very wide shoulders being required, especially when allowing for trucks. An example <strong>of</strong> this is shownin Figure 1 where a horizontal curve radius <strong>of</strong> about 550m is used in combination with a crest vertical curve atthe Bernera Road Interchange on the Sydney ring road. The road is <strong>of</strong> freeway st<strong>and</strong>ard with dual carriageways<strong>and</strong> two 3.5m lanes in each direction. Typically on the straighter sections <strong>of</strong> this freeway, the kerbside <strong>and</strong>
Arndt, Cox, Lennie & Whitehead 4median shoulders are 2.5m <strong>and</strong> 1m respectively. This motorway is controlled by variable speed limits with amaximum posted speed limit <strong>of</strong> 100km/h.Part <strong>of</strong> this geometry is on structure <strong>and</strong> roadside barriers have been installed to protect vehicles fromfalling over the overpass. Significant sight distance widening is used on this element (shoulder width = 7.25m).The sight distance widening was based on truck stopping sight distance to downstream hazards.Such application <strong>of</strong> sight distance, however, has the following negative effects: Drivers parking their vehicles (both cars <strong>and</strong> trucks) in the widened area, creating obstructions tosight distance for drivers in the traffic lanes Construction cost <strong>of</strong> providing the widened area becomes prohibitively expensive, especially whenon or under structures Additional resumptions may be required (particularly in urban areas), which may not be politically orsocially acceptable.In addition to these effects, AASHTO (2) advises against using shoulder widths above 3.6m because <strong>of</strong>the concern that drivers will use the shoulders as passing or travelling lanes.FIGURE 1 <strong>Sight</strong> <strong>Distance</strong> Widening on the Sydney Ring RoadTECHNIQUE NUMBER 2 - DISREGARD SIGHT DISTANCE REQUIREMENTSIn recognising the negative effects <strong>of</strong> applying the normal stopping sight distance model (as discussed above),some designers have disregarded sight distance requirements altogether. In some instances in Queensl<strong>and</strong>,shoulder widths as low as 0.5m have been constructed. This has usually occurred in extremely constrained areaswhere designers have had no scope to achieve the normal stopping sight distance (which would require muchgreater shoulder widths, generally >3m). These designers have made no attempt to achieve any sight distancecapability <strong>and</strong> have designed locations <strong>of</strong> extremely poor visibility. In these situations, the <strong>of</strong>fsets provided areusually based only on what is considered to be practical <strong>and</strong> cost effective.The negatives <strong>of</strong> this technique are the potential for increased accident rates given the very smallamounts <strong>of</strong> sight distance provided. This would only be an issue if reductions in sight distance do indeedincrease accident rates. When reviewing literature on this subject, it was seen that there have been numerousattempts at linking stopping sight distance <strong>and</strong> accident rates for midblock sections <strong>of</strong> roadway. Table 1 showsthe results <strong>of</strong> a literature review by McLean et al (3). Many <strong>of</strong> the studies investigated restrictions to sightdistance due to crest vertical curves on rural roads.
Arndt, Cox, Lennie & Whitehead 5TABLE 1 Results <strong>of</strong> Studies Linking Stopping <strong>Sight</strong> <strong>Distance</strong> to Accident Rates for Midblock Sections <strong>of</strong>Roadway from McLean et al (3)Study Result Effect on AccidentRates byDecreasing <strong>Sight</strong><strong>Distance</strong>Choueiri etal (4)Olson et al(5)Fambro etal (6)Iyinam et al(7)Elvik <strong>and</strong>Vaa (8)Suggests that accident rates are higher with low sightdistances but change little when the sight distanceexceeds 150m to 200m.The accident rate on low sight distance crests (36 –94m long) was 50% greater than on high sightdistance crests (over 215m long) for operating speedsbetween 90 <strong>and</strong> 100km/h.Small increase in accident frequency with decreasingsight distance below 100m <strong>and</strong> negligible changewith increasing sight distance above 100m.A 50% increase in accident rate for sight distancedecreasing from 500m to 100m.Cited two studies (Danish <strong>and</strong> British). Bothsuggested that increasing sight distance from lessthan 200m to more than 200m leads to a 23% higheraccident rateIncreaseIncreaseIncreaseIncreaseDecrease (2 studies)From Table 1, it can be seen that there is no strong, consistent result between studies linking sightdistance to midblock accidents. All that can be deduced from Table 1 is that the number <strong>of</strong> studies indicatingthat a reduction in sight distance will increase accident rates is double the number indicating that a reduction insight distance will reduce accident rates.A review <strong>of</strong> accident reports on Queensl<strong>and</strong> freeways in the vicinity <strong>of</strong> interchanges shows that thefollowing accident types are quite common: Rear-end type <strong>and</strong> side swipe accidents with vehicles stopped due to traffic congestion or accidents Accidents involving vehicles hitting objects fallen from vehicles (especially trucks).Providing some minimum level <strong>of</strong> sight distance on freeways <strong>and</strong> at interchanges may well be moreimportant than for midblock sections <strong>of</strong> rural roads because <strong>of</strong> the increased exposure to hazards (stoppedvehicles <strong>and</strong> fallen objects). Therefore, studies relating sight distance to accident rates on freeways <strong>and</strong> atinterchanges may yield stronger results than those for midblock sections <strong>of</strong> rural roads given in Table 1.Arndt (9) found a link between sight distance <strong>and</strong> rear-end vehicle accidents on the major road (theroad with priority) at unsignalised intersections where a through vehicle collides with a turning vehicle. Almostall <strong>of</strong> these accidents occurred to right turning vehicles (equivalent to left turning vehicles in the USA <strong>and</strong> much<strong>of</strong> Europe) where there was no turn slot provided. Reduced sight distance was found to increase accident rates,particularly when the sight distance was less than about 150m for through speeds <strong>of</strong> 100km/h. In this type <strong>of</strong>accident, the turning vehicles (<strong>of</strong>ten stationary) are basically regular hazards on the through roadway.In locations where extremely poor sight distance has been provided, the authors have observed somedrivers actually reducing their speed from what they would normally choose for such a horizontal curve. This islikely to be due to the perceived risk <strong>of</strong> encountering a downstream hazard on the roadway. In itself, thisreduction in speed may not cause any accident potential. However, there are some drivers that do not slow downin the absence <strong>of</strong> insufficient visibility. This behaviour may well increase accident potential, especially in areaswhere hazards are more likely (for example, where there are queued vehicles).It is considered that the evidence given above (although only anecdotal) is sufficient to justify whysight distance requirements should not be ignored completely.
Arndt, Cox, Lennie & Whitehead 6TECHNIQUE NUMBER 3 - ASSUME A LOWER DESIGN SPEEDIn an attempt to provide a practical amount <strong>of</strong> sight distance <strong>around</strong> roadside barriers <strong>and</strong> structures, manydesigners have applied the normal stopping sight distance model by assuming an artificially low design speed.Such practice is common <strong>around</strong> the world as identified in the following examples: AASHTO (2) recommends reducing the design speed as an option when sufficient stopping sightdistance is not available because a railing or longitudinal barrier constitutes a sight distance obstruction. It isunclear what constitutes a reduction in the design speed ie whether or not this entails simply assuming someartificially low design speed. It certainly does not provide any guidance on how such practice provides sufficientdriver capability to avoid/evade hitting objects on the roadway when sight distance less than the normal valuesare provided. Clause 2.10 <strong>of</strong> Part 1 <strong>of</strong> Section 1 <strong>of</strong> Volume 6 the United Kingdom Department <strong>of</strong> Transport‘Design Manual for Roads <strong>and</strong> Bridges’ (10) states that sight distance to the tops <strong>of</strong> vehicles (1.05m objectheight) will be obtained over parapets or safety fences or safety barriers. On B<strong>and</strong> A roads meeting thiscriterion, the stopping sight distance to the 0.26m object height may be relaxed by one design speed step. Theone design speed step is an artificial lowering <strong>of</strong> the design speed by utilising some <strong>of</strong> the latitude availablewithin the stopping sight distance model. As with the US approach, it does not show how such practice providessufficient driver capability to avoid/evade hitting objects on the roadway when sight distance less than thenormal values are provided.Assuming a lower design speed has been a common approach used in Australia for the provision <strong>of</strong>sight distance <strong>around</strong> roadside safety barriers <strong>and</strong> structures. The authors strongly disagree with this approachfor the following reasons: It is important that the design speed relates to all features <strong>of</strong> the highway. A reduction in designspeed is unlikely to affect overall operating speeds. It will potentially result in the unnecessary reduction <strong>of</strong> all<strong>of</strong> the speed-related design criteria rather than just sight distance. It produces designs based on artificially low operating speeds instead <strong>of</strong> the anticipated operatingspeeds <strong>of</strong> the reasonable <strong>and</strong> prudent driver. The designs will therefore only to cater for a relatively smallnumber <strong>of</strong> drivers using the roadway. This can result in the design <strong>of</strong> inappropriate geometric features thatviolate driver expectations <strong>and</strong> degrade the safety <strong>of</strong> the road. Such designs are less likely to be defendable in acourt <strong>of</strong> law. The emphasis should be on the consistency <strong>of</strong> design so as not to surprise the motorist withunexpected features. There is no limit for how low the design speed (<strong>and</strong> thus the sight distance <strong>and</strong> the values <strong>of</strong> otherparameters) can be made. This excludes the UK design speed step method. Our legal advice has indicated that we would have great difficulty in defending the practice <strong>of</strong>assuming an artificially low design speed.For these reasons, it is recommended that design speed should never be less than the 85 th percentileoperating speed for the particular geometric element.Wooldridge et al (11) identified a similar issue when undertaking case studies <strong>of</strong> stopping sightdistance at ramps. They discussed how AASHTO (12) provides three different values for design speed,representing the various percentages <strong>of</strong> the design speed on the connecting highway (upper range - 85%, middlerange - 70% <strong>and</strong> lower range - 50%). In one <strong>of</strong> the case studies, it was found that the horizontal <strong>of</strong>fset providedonly allowed for the 3rd percentile operating speed, based on a spot speed study. The middle range value (50%)was approximately equal to the actual 85th percentile speed on the ramp. Use <strong>of</strong> the lower range values in thiscase was stated as being questionable.A NEW TECHNIQUE – USING LESS CONSERVATIVE, BUT JUSTIFIABLE SIGHT DISTANCECRITERIAAs discussed above, it is <strong>of</strong>ten impractical to provide the normal stopping sight distance requirements <strong>around</strong>roadside safety barriers <strong>and</strong> structures. However, it is considered equally important that a minimum level <strong>of</strong>sight distance be provided so that drivers can avoid hazards in most situations. Given that we cannot currentlyquantify the ‘substantive safety’ [Hauer (13)] <strong>of</strong> providing sight distance <strong>around</strong> roadside safety barriers <strong>and</strong>structures, only ‘nominal safety’ techniques are available.
Arndt, Cox, Lennie & Whitehead 7The proposed sight distance criteria <strong>around</strong> roadside safety barriers <strong>and</strong> structures presented in thispaper use less conservative, but realistic values for many <strong>of</strong> the parameters within the stopping sight distancemodel (eg higher rates <strong>of</strong> deceleration, higher object heights). This can be justified because the normal stoppingcondition that has been universally used is extremely conservative. This is because the design stoppingcondition is a combination <strong>of</strong> 85th percentile conditions (or even higher). The use <strong>of</strong> 85th percentile conditionsis common in road design. But the combination <strong>of</strong> many 85th percentile values does not yield something that isrepresentative <strong>of</strong> the capability <strong>of</strong> most drivers travelling at the 85th percentile speed. This is explained in detailin Cox (14).The proposed criteria also include supplementary manoeuvre capability in order for drivers to evadesmaller objects.The following sections set out the proposed sight distance criteria that are considered to be practical<strong>and</strong> cost effective, as documented in Part 3 <strong>of</strong> the GRD (1). The criteria are in the following two parts: <strong>Sight</strong> distance criteria where sighting over roadside barriers is possible <strong>Sight</strong> distance criteria where no line <strong>of</strong> sight is possible over roadside safety barriers <strong>and</strong> structures.These criteria are developed based on similar principals as those used to develop the Extended DesignDomain (EDD) criteria. EDD was developed for sight distance on existing roads as introduced by Cox <strong>and</strong>Arndt (15) at the 3 rd International Symposium on Highway Geometric Design. The EDD criteria have beenadopted in Appendix A <strong>of</strong> Parts 3 <strong>and</strong> 4A <strong>of</strong> the GRD (1).Because the new criteria for sight distance <strong>around</strong> roadside safety barriers <strong>and</strong> structures are lessconservative than that given by the normal stopping sight distance model, it is important that other road usershave sufficient capability to avoid hazards on the roadway. For this reason, the new sight distance criteria<strong>around</strong> roadside safety barriers <strong>and</strong> structures is applied for two design vehicles – a passenger car <strong>and</strong> a truck.The latter is typically a 19m semi-trailer.SIGHT DISTANCE CRITERIA WHERE SIGHTING OVER ROADSIDE SAFETY BARRIERS ISPOSSIBLEThis section discusses the criteria used for sight distance <strong>around</strong> roadside safety barriers when a line <strong>of</strong> sightexists over the barrier. The criteria are documented in Section 5.5.1 <strong>of</strong> Part 3 <strong>of</strong> the GRD (1). Basically, thefollowing is provided for cars <strong>and</strong> trucks: Stopping sight distance criteria- stopping capability to a downstream stationary vehicle as aminimum Manoeuvre criteria – capability to manoeuvre <strong>around</strong> smaller objectsBoth <strong>of</strong> these criteria are discussed in the following sections.Stopping <strong>Sight</strong> <strong>Distance</strong> CriteriaStopping distances are calculated from Equation 1.2Vt Vd (1)3.6 a G 254 9.81 100 whered = braking distance (m)V = initial speed (km/h)t = perception-reaction time (s)a = equivalent constant deceleration rate (m/s/s)G = grade in %; + for upgrade, - for down grade.
Arndt, Cox, Lennie & Whitehead 8Initial Speed (V)Initial speed is a critical parameter when using the stopping distance model since braking distance is a function<strong>of</strong> the square <strong>of</strong> the initial vehicle speed. Because the new criteria for sight distance <strong>around</strong> roadside safetybarriers is less conservative than that given by the normal stopping sight distance model (Technique Number 1),it is even more important to be sure that the initial speed (V) is not underestimated. There is no longer thelatitude to cover an underestimate <strong>of</strong> V.Because <strong>of</strong> the squared function <strong>and</strong> the absence <strong>of</strong> a lower limit <strong>of</strong> V, designers using TechniqueNumber 3 ‘Assume a Lower Design Speed’ can easily choose a speed too low. This is likely to result in theprovision <strong>of</strong> insufficient sight distance.In Australia, V has been clearly defined as being the 85th percentile speed since 1980. Data from speedsurveys shows that the 85 th percentile speed for cars <strong>and</strong> trucks on midblock sections <strong>of</strong> freeways is typically6km/h to 8km/h over the speed limit. Where the 85 th percentile speed on a particular roadway has beenmeasured, it is permissible to use this speed (1). In the absence <strong>of</strong> any speed information, V is taken as 10km/habove the speed limit.The operating speed model for intermediate <strong>and</strong> low speed rural roads is used to predict the 85thpercentile car speed on direct, semi-direct, outer connector <strong>and</strong> loop ramps in the manner explained in Part 4C<strong>of</strong> (1). Based on observed driver behaviour, the speed model predicts the extent to which car drivers areprepared to slow for horizontal curves, given their desired driver speed <strong>and</strong> section operating speed. This gives amore accurate estimate <strong>of</strong> 85 th percentile speed than simply choosing an arbitrary side friction factor upon whichto calculate speed.An operating speed model for trucks travelling <strong>around</strong> horizontal curves currently does not exist inAustralia. Based on anecdotal evidence, truck speeds tend to be 10km/h lower than car speeds for other thanhigh speed roads, when car speeds are above 60km/h (1). In the absence <strong>of</strong> other information, the speed <strong>of</strong>trucks on direct, semi-direct, outer connector <strong>and</strong> loop ramps is based on this criterion. Where ramp geometryincorporates grades, the speeds <strong>of</strong> heavy vehicles are also calculated by the s<strong>of</strong>tware package VEHSIM (16) orby graphs (1).Research is currently underway in Australia to develop an operating speed model for trucks travelling<strong>around</strong> horizontal curves.Perception-reaction time (t)Table 2 lists the perception-reaction times from the GRD (1). The degree to which these values arerepresentative <strong>of</strong> normal driving conditions are given below: 2.5s represents better than a 90th percentile value <strong>and</strong> possibly better than a 95th percentile value forall drivers – refer Fambro et al. (6) (see page 74). 2.0s represents at least an 85th percentile value <strong>and</strong> possibly a 95th percentile value for all car drivers– refer Fambro et al. (6) (see pages 32 <strong>and</strong> 74). 1.5s represents at least a mean value for surprise stopping for all drivers from a number <strong>of</strong> tests<strong>around</strong> the world – refer pages 24 <strong>and</strong> 32 <strong>of</strong> Fambro et al. (6), Summala (17), Green (18) <strong>and</strong> Exhibit 2-26 inAASHTO (19). The data in Summala (17) suggests that ‘urgency’ ensures that 1.5s may be an 85th percentilevalue or better (in good conditions at least) for drivers travelling at the 85th percentile speed. This is furthersupported by Figure 4 in Durth <strong>and</strong> Bernhard (20).For determining sight distance <strong>around</strong> barriers on interchange ramps, a perception-reaction time <strong>of</strong> 1.5sis typically used for cars <strong>and</strong> trucks (see Table 2). For midblock sections <strong>of</strong> most freeways, a 2.0s perceptionreactiontime is typically used. Prior to the development <strong>of</strong> Table 2, Technique Numbers 1 <strong>and</strong> 3 (‘Apply theNormal Stopping <strong>Sight</strong> <strong>Distance</strong> Model’ <strong>and</strong> ‘Assume a Lower Design Speed’ respectively) would typicallyhave used a 2.0s perception-reaction time in the sight distance cases above.
Arndt, Cox, Lennie & Whitehead 9TABLE 2 Driver Perception-reaction Times for Cars <strong>and</strong> Trucks (t) [Source: Table 5.2 <strong>of</strong> Part 3 <strong>of</strong> theGRD (1)]ReactionTime R T(s)Typical Road ConditionsTypical Use2.52.01.5Unalerted driving conditions due to the road onlyhaving isolated geometric features to maintain driverinterestAreas with high driver workload/complex decisionsHigh speed roads with long distances between townsHigher speed urban areasFew intersectionsAlerted driving situations in rural areasHigh speed roads in urban areas comprisingnumerous intersections or interchanges where themajority <strong>of</strong> driver trips are <strong>of</strong> relatively short length.Tunnels with operating speed ≥ 90m/h.Alert driving conditions egHigh expectancy <strong>of</strong> stopping due to traffic signalsConsistently tight alignments for example,mountainous roadsRestricted low speed urban areasBuilt-up areas – high traffic volumesInterchange ramps when sighting over or <strong>around</strong>barriersTunnels with operating speed ≤ 90m/h.Absolute minimum value for high speedroads with unalerted driving conditions.General minimum value forHigh speed rural motorwaysHigh speed rural intersections.Absolute minimum value for the roadconditions listed in this row.General minimum value for most roadtypes, including those with alert drivingconditions.Absolute minimum value. Only used invery constrained situations wheredrivers will be alert.Notes:The driver reaction times are representative for cars at the 85 th percentile speed <strong>and</strong> for heavy vehicles. Thedeceleration rates for heavy vehicles cover the inherent delay times in the air braking systems for thesevehicles.The above times typically afford an extra 0.5s to 1.0s reaction time to drivers who have to stop from the meanfree speed. It is considered, for example, that the mean free speed is more representative <strong>of</strong> the speed travelledby older drivers.Equivalent constant deceleration rate (a)Table 3 lists the coefficient <strong>of</strong> deceleration values in the GRD (1). These values are numerically equal to thedeceleration rate (a) divided by gravity (g). As can be seen, there is a range <strong>of</strong> values depending on type <strong>of</strong>vehicle <strong>and</strong> road type.The degree to which the values <strong>of</strong> the coefficient <strong>of</strong> deceleration given in Table 2 are representative <strong>of</strong>driving conditions are given below: 0.61 represents the average braking capability in dry conditions – refer Fambro et al. (6). 0.46 represents the average braking capability in wet conditions – refer Fambro et al. (6) <strong>and</strong> Durth<strong>and</strong> Bernhard (20). 0.36 represents about a 90th percentile value for braking on wet, sealed roads – refer Fambro et al.(6). This value continues to be used in Austroads guides as the maximum coefficient <strong>of</strong> deceleration for thedesign <strong>of</strong> deceleration lanes at intersections <strong>and</strong> is therefore more conservative than what drivers use inemergency braking situations. 0.26 represents comfortable deceleration. This value continues to be used in Austroads guides as thedesirable coefficient <strong>of</strong> deceleration for the design <strong>of</strong> deceleration lanes at intersections. 0.29 represents braking by large single unit trucks, semi-trailers (prime movers with one trailer) <strong>and</strong>B-doubles (prime movers with two trailers) on dry roads – refer Di Crist<strong>of</strong>oro et al. (21).For determining sight distance <strong>around</strong> barriers on interchange ramps, a coefficient <strong>of</strong> deceleration <strong>of</strong>0.46 is typically used for cars (refer Table 3). For trucks, a value <strong>of</strong> 0.29 is generally used. On ‘tight’ horizontal
Arndt, Cox, Lennie & Whitehead 11Driver Eye Height <strong>and</strong> Object HeightTable 4 shows the eye <strong>and</strong> object heights adopted in (1).TABLE 4 Driver Eye <strong>and</strong> Object Heights [Source: Table 5.1 <strong>of</strong> Part 3 <strong>of</strong> the GRD (1)]Vertical Height Parameter Height Typical Application(m)Height <strong>of</strong> Eye <strong>of</strong> Driver h 11. Passenger Car 1.1 All car sight distance models2. Truck 2.4 All truck sight distance models where a truck is travelling indaylight hours <strong>and</strong> at night-time where the road is lit.3. Bus 1.8 Specific case for bus only facilities, e.g. buswaysHeadlight Height h 11. Passenger Car 0.65 Headlight stopping sight distance in sagsCheck case for night time stopping for cars (no overhead lighting)2. Commercial Vehicle 1.05m Check case for night time stopping for trucks (no overheadlighting)Object cut-<strong>of</strong>f Height h 21. Road surface 0.0 Approach sight distance at intersections.Approach sight distance to taper at end <strong>of</strong> auxiliary lane.Headlight sight distance in sags.Horizontal curve perception distance.Water surface at floodways.2. Stationary object on road 0.2 Normal stopping sight distance for cars <strong>and</strong> trucks to hazard onroadway.3. Front turn indicator 0.65 Minimum gap sight distance at intersections.4. Car tail light/stoplight/turn indicator0.8 Car stopping sight distance to hazards over roadside safetybarriers in constrained locations (1)Truck stopping sight distance to hazards over roadside safetybarriers in constrained locationsStopping sight distance where there are overhead obstructions.5. Top <strong>of</strong> car 1.25 Car stopping sight distance to hazards over roadside safetybarriers on a lit horizontally curved bridge (1)Truck stopping sight distance to hazards over roadside safetybarriers in extremely constrained locations that are lit (1)Intermediate sight distanceOvertaking sight distanceSafe intersection sight distanceMutual visibility at merges(1) Where car stopping sight distance over roadside barriers is applied to an object height <strong>of</strong> greater than 0.2mor truck stopping sight distance over roadside barriers is applied to an object height <strong>of</strong> greater than 0.8m, theminimum shoulder widths <strong>and</strong> manoeuvre times given in Table 5 apply.From Table 4, eye height are: 1.1m for cars. This represents the 15 th percentile driver eye height in Australia as determined by Cox(22). 2.4m for trucks. This represents a truck driver eye height <strong>of</strong> 19m semi trailers or larger vehicles, asdetermined by McLean (23)
Arndt, Cox, Lennie & Whitehead 12Table 4 shows that the following object heights are used for sight distance over roadside safetybarriers: 0.8m for car <strong>and</strong> truck stopping sight distance to hazards over roadside safety barriers in constrainedlocations. This value represents the 15% tail light height <strong>of</strong> passenger vehicles in Australia, as determined byLennie et al (24). 1.25m for car stopping sight distance to hazards over roadside safety barriers on a horizontallycurved bridge with road lighting. This value is also used for truck stopping sight distance to hazards overroadside safety barriers in extremely constrained locations with road lighting. 1.25 m represents a value 0.21 mlower than the 15th percentile passenger car height as determined by Lennie et al. (24). The value <strong>of</strong> 0.21 m wasbased on sufficient vehicle height available for other drivers to perceive the vehicle <strong>and</strong> allowance for thepassenger car height to be a rounded value.Prior to the development <strong>of</strong> Table 4, Technique Numbers 1 <strong>and</strong> 3 (‘Apply the Normal Stopping <strong>Sight</strong><strong>Distance</strong> Model’ <strong>and</strong> ‘Assume a Lower Design Speed’ respectively) would typically have used similar eyeheights but would have consistently used a 0.2m object height.Manoeuvre CriteriaApplication <strong>of</strong> the stopping sight distance criteria given in the previous section has meant that drivers <strong>of</strong>passenger cars <strong>and</strong> trucks can at least stop for a stationary downstream vehicle. If the roadway is unlit, thismeans stopping sight distance is at least provided to a design object height <strong>of</strong> 0.8m (taillight height <strong>of</strong> apassenger car). If the roadway is lit (typical <strong>of</strong> urban freeways <strong>and</strong> interchanges), it means that providingstopping sight distance to a design object height <strong>of</strong> 1.25m (top <strong>of</strong> a passenger car) is possible.To provide drivers with capability to avoid objects smaller than the design object height, Section 5.5.1<strong>of</strong> Part 3 <strong>of</strong> the GRD (1) requires that drivers have sufficient capability to avoid objects smaller than the designobject height by manoeuvring <strong>around</strong> them. This is provided by the following: A minimum manoeuvre time – allows drivers travelling at the operating speed sufficient time toperceive/react to a hazard <strong>and</strong> manoeuvre <strong>around</strong> it A minimum manoeuvre width – allows drivers enough width to manoeuvre a hazard.Where car stopping sight distance over roadside barriers is applied to an object height greater than 0.2m, or truck stopping sight distance over roadside barriers is applied to an object height greater than 0.8 m, theminimum shoulder widths <strong>and</strong> manoeuvre times given in Table 5 apply. No supplementary manoeuvrecapability needs to be provided where object heights <strong>of</strong> 0.2m for car stopping <strong>and</strong> 0.8m for truck stopping areused. This is because objects lower than these in the majority <strong>of</strong> circumstances are assumed not to be majorhazards to the vehicles. Also, the latitude available under the design condition usually affords some stoppingcapability for the smaller hazards.The minimum sight distance required to achieve manoeuvre capability is calculated according toEquation 2.V td (2)3.6wheredVt= manoeuvre distance (m)= initial speed (km/h)= manoeuvre time = perception-reaction time + evasive action time (s)For car stopping, the manoeuvre distance must be provided from a 1.1m passenger car eye height to a0.2m high object. For truck stopping, this distance must be provided from a 2.4m truck eye height to a 0.8mhigh object.
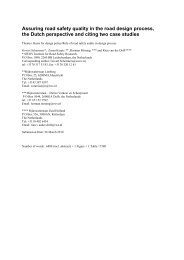
Arndt, Cox, Lennie & Whitehead 13CaseTABLE 5 Minimum Shoulder Widths <strong>and</strong> Manoeuvre Times for <strong>Sight</strong> <strong>Distance</strong>s over RoadsideSafety <strong>Barriers</strong> on Horizontal Curves [Source: Table 5.6 <strong>of</strong> Part 3 <strong>of</strong> the GRD (1)]Car stopping sightdistanceTruck stoppingsight distanceObject HeightAdopted forStoppingCapability ‘h 2 ’ (m)Minimum Shoulder Widthon Inside <strong>of</strong> HorizontalCurve for Manoeuvring (m)(1)Minimum Manoeuvre Time atthe 85th Percentile VehicleSpeed(s) (2)0.2 < h 2 ≤ 1.25 2.5 Reaction time plus 2.5s to a 0.2mhigh object.0.8 < h 2 ≤ 1.25 3.5 Reaction time plus 3.0s to a 0.8mhigh object(1) The minimum shoulder width enables vehicles (on the inner most lane) to manoeuvre <strong>around</strong> objects lowerthan the chosen object height. The minimum shoulder width must be the greatest dimension that satisfies boththe car <strong>and</strong> truck stopping sight distance cases given in this table. It is preferred that the shoulder is fully sealed.(2) The minimum manoeuvre time provides drivers with sufficient time to react <strong>and</strong> take evasive action.(3) Where a sight line passes over a median barrier, the line <strong>of</strong> sight should not be interrupted by vehicles in theon-coming carriageway. Typically, this means that the line <strong>of</strong> sight should not intrude more than 0.5m into theclosest on-coming traffic lane.Justification <strong>of</strong> Manoeuvre CapabilityManoeuvre sight distance has been an alternative design criterion in Australia since 1980 (25). Given thechance, drivers will elect to manoeuvre <strong>around</strong> a hazard rather than stop for it – refer Olsen et al. (5)The s<strong>of</strong>tware program HVE (26) dynamically simulates vehicle movement over any given environment<strong>and</strong> has been used to show that the minimum manoeuvre times <strong>and</strong> minimum shoulder widths in Table 5 arerealistic <strong>and</strong> achievable in practice. Figure 2 shows preliminary results from HVE. The hazard, a stationaryvehicle, takes up most <strong>of</strong> the lane. The minimum manoeuvre time is 4.5s (1.5s perception/reaction time plus 3sevasive action time) <strong>and</strong> the shoulder width is 3.5m. HVE shows that such a manoeuvre is achievable by drivers<strong>of</strong> heavy vehicles.SIGHT DISTANCE CRITERIA WHERE SIGHTING OVER ROADSIDE SAFETY BARRIERS /STRUCTURES IS NOT POSSIBLEA line <strong>of</strong> sight is not possible over the following: Special high performance safety barriers (eg 1.4m or 2m high), except if in combination with asignificant sag vertical curve, Retaining walls <strong>of</strong> significant height, Tunnels, Bridge structures eg underpasses, abutments <strong>and</strong> piers, or Roadside safety barriers in combination with a significant crest vertical curve.In these cases, there is <strong>of</strong>ten limited ability to widen the shoulder due to cost <strong>and</strong>/or practicalconstraints e.g. the geometry comprises a motorway ramp on structure. This can make it very difficult to provideany stopping sight distance capability for trucks.Where this occurs <strong>and</strong> all other design options have been investigated, Section 5.5.2 <strong>of</strong> Part 3 <strong>of</strong> theGRD (1) gives the following capabilities as the minimum which should be provided: Car stopping sight distance on a dry road using a coefficient <strong>of</strong> deceleration <strong>of</strong> 0.61 (refer Table 3),supplemented by the required minimum shoulder width <strong>and</strong> minimum manoeuvre time according to Table 5. Asper Table 3, a horizontal curve with a side friction factor greater than the desirable maximum value requires thatthe coefficient <strong>of</strong> deceleration be reduced by 0.05. The justification for using braking on a dry road is based onthe difficulty in achieving practical sight distance criteria in these instances combined with the fact thatAustralia is a very dry country <strong>and</strong> only a very small area <strong>of</strong> the country ever encounters snow or ice.
Arndt, Cox, Lennie & Whitehead 14 Truck manoeuvre only capability – provide a minimum shoulder width <strong>of</strong> 4m <strong>and</strong> a minimummanoeuvre time to a 0.8m high object equal to the reaction time plus 3.5 seconds.These criteria effectively limit the width <strong>of</strong> the shoulder to 4m.Where sighting over roadside safety barriers was not possible, Technique Numbers 1 <strong>and</strong> 3 (‘Apply theNormal Stopping <strong>Sight</strong> <strong>Distance</strong> Model’ <strong>and</strong> ‘Assume a Lower Design Speed’ respectively) would have usedthe same parameter values in the stopping sight distance model as discussed in the previous section titled ‘<strong>Sight</strong><strong>Distance</strong> Criteria Where <strong>Sight</strong>ing over Roadside Safety <strong>Barriers</strong> is Possible’. This required stopping to a 0.2mhigh object at all locations.Radius(m)Superelevation(%)SurfaceConditionInitial Speed(km/h)Typical SpeedReduction (km/hr)120 7 Dry 64 4-10 Yes (1)Wet 12 Yes (1)200 6 Dry 75 3 YesWet 9 Yes400 5 Dry 91 3 YesWet 8 Yes600 5 Dry 100 4 YesManoeuvre Successfulwithin 3s <strong>of</strong> Travel(1) Some difficultly experienced in achieving a successful manoeuvre with some vehicle instability evident.Notes:Horizontal Curve for the Criteria given in Table 5 <strong>and</strong> detailed results can be provided by authors.FIGURE 2 Check on HV Manoeuvre Capability over <strong>Distance</strong> ≡ 3s <strong>of</strong> Travel at Initial Speed.
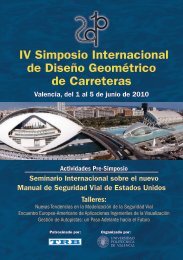
Arndt, Cox, Lennie & Whitehead 15CASE STUDY OF THE PROVISION OF SIGHT DISTANCE AROUND ROADSIDE SAFETYBARRIERS AND STRUCTURES ON FREEWAYS AND INTERCHANGESFigure 3 shows the southbound ramp between the Port <strong>of</strong> Brisbane Motorway <strong>and</strong> the Gateway Motorway inBrisbane. The ramp at this location forms an overpass <strong>of</strong> a railway line. The ramp comprises a left turninghorizontal curve <strong>of</strong> 170m radius on a downgrade <strong>of</strong> 3%. The lane width is 4.3m <strong>and</strong> the left shoulder width is3.3m. The speed limit on the ramp is 70km/h. The roadside safety barriers are 1.4m high on the rail overpass sosighting to stationary vehicles over the barrier is not possible. This layout existed prior to the development <strong>of</strong> thenew sight distance criteria <strong>around</strong> roadside safety barriers <strong>and</strong> structures in (1).Using the operating speed model in (1) for a desired driver speed <strong>of</strong> 80km/h (speed limit plus 10km/h),the model indicates the drivers <strong>of</strong> passenger cars will slow to 74km/h on the ramp. It is assumed that trucks willbe travelling at 70km/h (the speed limit). It is unlikely that truck drivers will be travelling slower than thisbecause at 70km/h, they have not yet reached their maximum side friction dem<strong>and</strong>.Table 6 shows what sight distances <strong>and</strong> shoulder widths are required in order for drivers <strong>of</strong> passengercars <strong>and</strong> trucks to have sufficient visibility <strong>around</strong> the roadside barrier. Both the sight distance required underprevious Austroads documents (using the normal stopping sight distance model) <strong>and</strong> the sight distance requiredin the new GRD (1) are shown.As would be expected, sight distance for trucks is the overriding criteria. A shoulder width <strong>of</strong> 6.8mwould have been required under the previous Austroads documents. The new criteria, which allows manoeuvreonly capability for trucks where a line <strong>of</strong> sight is not possible over the barrier, indicate that a shoulder width <strong>of</strong>4m is required.If the ramp in Figure 3 was being built new, an additional 0.7m shoulder width would be required tomeet the new sight distance criteria.FIGURE 2 <strong>Sight</strong> <strong>Distance</strong> Widening on Southbound Ramp between the Port <strong>of</strong> BrisbaneMotorway <strong>and</strong> the Gateway Motorway
Arndt, Cox, Lennie & Whitehead 16TABLE 6 <strong>Sight</strong> <strong>Distance</strong> <strong>and</strong> Shoulder Widths Required for the Case StudyCriteriaNormal stopping sight distance model in previous AustroadsdocumentsNew criteria where sighting over roadside safetybarriers/structures is not possible – stopping sight distanceNew criteria where sighting over roadside safetybarriers/structures is not possible – manoeuvre sight distance<strong>Sight</strong> <strong>Distance</strong>Required (m)Shoulder WidthRequired (m)Cars Trucks Cars Trucks81 113 2.7 6.868 - 1.2 -82 88 2.8 4.0CONCLUSIONThe provision <strong>of</strong> stopping sight distance <strong>around</strong> concrete barriers <strong>and</strong> structures on freeways <strong>and</strong> interchangeshas varied within Australia (<strong>and</strong> the world). Some designers have insisted on strictly applying the normalstopping sight distance model, others have disregarded sight distance requirements altogether whilst many havesimply assumed a lower design speed. Each method creates its own problems.As well as being uneconomical, strict application <strong>of</strong> the normal stopping sight distance model yieldsvery wide shoulders that can act as parking area <strong>and</strong> decrease barrier performance. Based on anecdotal evidence,ignoring sight distance requirements altogether is likely to decrease safety. Assuming a lower design speed canresult in the design <strong>of</strong> inappropriate geometric features that violate driver expectations <strong>and</strong> degrade the safety <strong>of</strong>the road, especially if the design speed chosen is too low. It will potentially result in the unnecessary reduction<strong>of</strong> all <strong>of</strong> the speed-related design criteria rather than just sight distance.This practice is also less likely to bedefendable in a court <strong>of</strong> law.The criteria proposed for sight distance <strong>around</strong> concrete barriers <strong>and</strong> structures in this paper have beendeveloped by using less conservative, but realistic values for many <strong>of</strong> the parameters within the stopping sightdistance model (eg higher rates <strong>of</strong> deceleration, higher object heights). This can be justified because the normalstopping condition that has been universally used is extremely conservative. This is because the design stoppingcondition is a combination <strong>of</strong> 85th percentile conditions (or even higher). The use <strong>of</strong> 85th percentile conditionsis common in road design. But the combination <strong>of</strong> many 85th percentile values does not yield something that isrepresentative <strong>of</strong> the capability <strong>of</strong> most drivers travelling at the 85th percentile speed.The new criteria retain the intents <strong>of</strong> the sight distance models by providing reasonable stopping <strong>and</strong>manoeuvring capability. The intent <strong>of</strong> the sight distance models is to ensure that for the whole length <strong>of</strong> a road,motorists may see some hazard then stop for it or avoid it. No court is likely to find that this is not reasonable.Using some different model <strong>and</strong> technical foundation will not serve the inevitable comparison with what is usedfor the remainder <strong>of</strong> the road network.When using these criteria, it is paramount that the design speed is not underestimated because <strong>of</strong> thesmaller latitude that exists within the models.The new criteria comprise two sections. One is for where sight distance over roadside safety barriers ispossible. The other is for where sight distance over roadside barriers <strong>and</strong> structures is not possible. The newcriteria are incorporated into the latest Australian road design guidelines (1). There is scope to also apply thecriteria to sight distance over roadside barriers on roads other than freeways <strong>and</strong> at interchanges.
Arndt, Cox, Lennie & Whitehead 17REFERENCES1. Austroads (2009). Guide to Road Design Series. Austroads, Sydney, Australia.2. AASHTO (2004). A Policy on Geometric Design <strong>of</strong> Highways <strong>and</strong> Streets. American Association <strong>of</strong>State Highway <strong>and</strong> Transportation Officials, Washington D.C., USA.3. McLean, J., Veith, G. <strong>and</strong> Turner, B. (2009). Road Safety Engineering Risk Assessment Part 1:Relationships between Crash Risk <strong>and</strong> the St<strong>and</strong>ards <strong>of</strong> Geometric Design Elements. Project NumberST1428, Austroads, Sydney, Australia.4. Choueiri, E.M., Lamm, R., Kloeckner, J.H. <strong>and</strong> Mailender, T. (1994). Safety Aspects <strong>of</strong> IndividualDesign Elements <strong>and</strong> their Interactions on Two-lane Highways: International Perspective.Transportation Research Record, Number 1445, Washington, D.C., USA pp.34-46.5. Olson, P.L., Clevel<strong>and</strong>, D.E., Fancher, P.S., Kostyniuk, L.P. <strong>and</strong> Schneider, L.W. (1984). ParametersAffecting Stopping <strong>Sight</strong> <strong>Distance</strong>. NCHRP report 270, Transportation Research Board, Washington,DC., USA.6. Fambro, D.B., Fitzpatrick, K. <strong>and</strong> Koppa, R. J. (1997). Determination <strong>of</strong> Stopping <strong>Sight</strong> <strong>Distance</strong>s.NCHRP report 400, Transportation Research Board, Washington, DC., USA.7. Iyinam, A.F., Iyinam, S. <strong>and</strong> Ergun, M. (2003). Analysis <strong>of</strong> Relationship between Highway Safety <strong>and</strong>Road Geometric Design Elements: Turkish Case. Traffic Forum, Technical University <strong>of</strong> Dresden,Dresden, URL viewed 27 September 2007, http://vwisb7.vkw.tudresden.de/TrafficForum/vwt_2003/beitraege/VWT19proceedings_contribution_91.1-91.8.pdf#search='geometric%20design%20<strong>and</strong>%20accidents.8. Elvik, R. <strong>and</strong> Vaa, T. (2004). The H<strong>and</strong>book <strong>of</strong> Road Safety Measures. Elsevier, Oxford, UK.9. Arndt, O.K. (2004). Relationship Between Unsignalised Intersection Geometry <strong>and</strong> Accident Rates.Doctor <strong>of</strong> Philosophy Thesis, Queensl<strong>and</strong> University <strong>of</strong> Technology <strong>and</strong> Queensl<strong>and</strong> Department <strong>of</strong>Main Roads, Brisbane, Australia.10. United Kingdom Department <strong>of</strong> Transport (2002). Design Manual for Roads <strong>and</strong> Bridges. UK.11. Wooldridge, M. D., Parham, A. H., Fitzpatrick, K., Nowlin, R.L. <strong>and</strong> Brydia, R. E. (1998). Evaluation<strong>and</strong> Modification <strong>of</strong> <strong>Sight</strong> <strong>Distance</strong> Criteria Used by TxDOT. Federal Highway Administration, ReportNumber FHWA/TX99/1811-1, Texas, USA.12. AASHTO (1994). A Policy on Geometric Design <strong>of</strong> Highways <strong>and</strong> Streets. American Association <strong>of</strong>State Highway <strong>and</strong> Transportation Officials, Washington D.C., USA.13. Hauer, E. (2000). Safety in Geometric Design St<strong>and</strong>ards II: Rift, Roots <strong>and</strong> Reform. Proceedings, 2ndInternational Symposium on Highway Geometric Design, June 2000, Mainz, Germany.14. Cox, R.L. (2003). Reduced <strong>Sight</strong> <strong>Distance</strong> on Existing Rural Roads – How Can We Defend It? 21stARRB <strong>and</strong> 11th REAAA Conference, Cairns, Australia.15. Cox, R.L. <strong>and</strong> Arndt, O.K. (2005). Using an Extended Design Domain Concept for Road RestorationProjects. 3rd International Symposium on Highway Geometric Design, June 2005, Chicago, USA.16. Queensl<strong>and</strong> Government (2003) Vehicle Simulation (VEHSIM)– Computer simulation program,Brisbane17. Summala, H. (2002). Behavioural Adaptation <strong>and</strong> Drivers' Task Control. In Fuller, Ray & Jorge A.Santos (2002): Human Factors for Highway Engineers - Pergamon (Elsevier Science Ltd, Oxford UK).18. Green, M. (2000). How Long Does It Take to Stop? Methodological Analysis <strong>of</strong> Driver Perception-Brake Times. In Transportation Human Factors, 2(3). Lawrence Ealbaum Associates, Inc.19. AASHTO (2001). Guidelines for Geometric Design <strong>of</strong> Very Low-Volume Local Roads (ADT
Arndt, Cox, Lennie & Whitehead 1824. Lennie, S.C. Arndt, O. K. <strong>and</strong> Cox, R. L. (2008). 2008 Measurement <strong>of</strong> Passenger Cars - Head LightHeight, Tail Light Height & Vehicle Height. Queensl<strong>and</strong> Department <strong>of</strong> Main Roads. Brisbane,Australia.25. NAASRA (1980). Interim Guide to the Design <strong>of</strong> Rural Roads. NAASRA, Sydney, Australia.26. Engineering Dynamics Corporation (2009) Human Vehicle Environment (HVE) Version 7, OregonUSA.