Sutter Health Cancer Services and Programs
Sutter Health Cancer Services and Programs
Sutter Health Cancer Services and Programs
You also want an ePaper? Increase the reach of your titles
YUMPU automatically turns print PDFs into web optimized ePapers that Google loves.
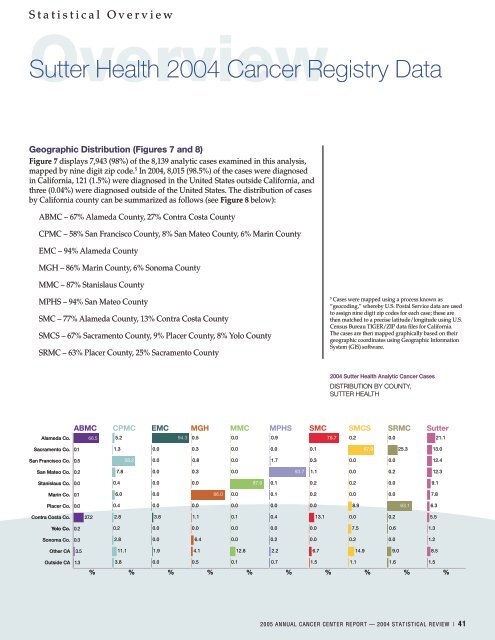
S t a t i s t i c a l O v e r v i e wOverview<strong>Sutter</strong> <strong>Health</strong> 2004 <strong>Cancer</strong> Registry DataGeographic Distribution (Figures 7 <strong>and</strong> 8)Figure 7 displays 7,943 (98%) of the 8,139 analytic cases examined in this analysis,mapped by nine digit zip code. 5 In 2004, 8,015 (98.5%) of the cases were diagnosedin California, 121 (1.5%) were diagnosed in the United States outside California, <strong>and</strong>three (0.04%) were diagnosed outside of the United States. The distribution of casesby California county can be summarized as follows (see Figure 8 below):ABMC – 67% Alameda County, 27% Contra Costa CountyCPMC – 58% San Francisco County, 8% San Mateo County, 6% Marin CountyEMC – 94% Alameda CountyMGH – 86% Marin County, 6% Sonoma CountyMMC – 87% Stanislaus CountyMPHS – 94% San Mateo CountySMC – 77% Alameda County, 13% Contra Costa CountySMCS – 67% Sacramento County, 9% Placer County, 8% Yolo CountySRMC – 63% Placer County, 25% Sacramento County5Cases were mapped using a process known as“geocoding,” whereby U.S. Postal Service data are usedto assign nine digit zip codes for each case; these arethen matched to a precise latitude/longitude using U.S.Census Bureau TIGER/ZIP data files for California.The cases are then mapped graphically based on theirgeographic coordinates using Geographic InformationSystem (GIS) software.2004 <strong>Sutter</strong> <strong>Health</strong> Analytic <strong>Cancer</strong> CasesDistribution by County,<strong>Sutter</strong> <strong>Health</strong>Ala me da Co .ABMC66.5CPMC5.2EMC94.3MGH MMC MPHS SMC SMCS SRMC0.50.00.976.7 0.20.0<strong>Sutter</strong>21.1S acr a me n to Co .0.11.30.00.30.00.00.167.025.313.0S a n F r a ncisco Co .0.558.20.00.80.01.70.30.00.012.4S a n Mate o Co .0.27.80.00.30.093.71.10.00.212.3S t a nislaus Co .0.00.40.00.087.00.10.20.20.09.1Ma r in Co .0.16.00.086.00.00.10.20.00.07.8Place r Co .0.00.40.00.00.00.00.08.963.16.3Con t r a Cost a Co .27.22.83.81.10.10.413.10.00.25.5Y ol o C o .0.20.20.00.00.00.00.07.50.61.3Sonoma Co .0.32.80.06.40.00.20.00.20.01.2O t he r C A3.511.11.94.112.82.26.714.99.08.5Outside C A1.33.80.00.50.10.71.51.11.61.5%%%%%%%%%%2005 Annual <strong>Cancer</strong> Center Report — 2004 Statistical Review | 41


