RBC Capital Markets Stampede Energy Roundtable - Enerplus
RBC Capital Markets Stampede Energy Roundtable - Enerplus
RBC Capital Markets Stampede Energy Roundtable - Enerplus
Create successful ePaper yourself
Turn your PDF publications into a flip-book with our unique Google optimized e-Paper software.
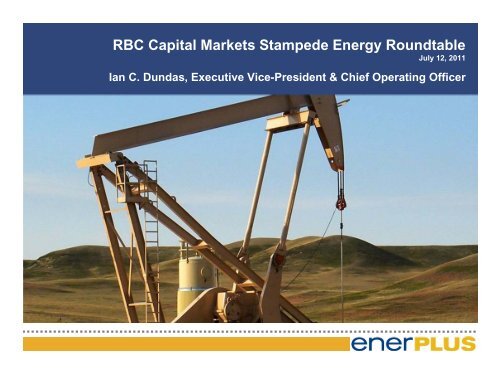
The Game Plan<strong>RBC</strong> <strong>Capital</strong> <strong>Markets</strong> <strong>Stampede</strong> <strong>Energy</strong> <strong>Roundtable</strong>July 12, 2011Ian C. Dundas, Executive Vice-President & Chief Operating Officer
<strong>Enerplus</strong> Overview• North American oil and gas producer focused onproviding growth and income• Current yield of 7%• 10 – 15% production growth expected by 2012• Diversified portfolio of oil and gas properties throughoutWestern Canada and the U.S.• Low decline properties primarily in Western Canadagenerating free cash flow• Concentrated positions in the Bakken, waterfloods andMarcellus that provide future growth in reserves andproductionHigh yieldingE&P companyproviding growth& income• Disciplined capital strategy and strong balance sheetsupport growth plans over next 1 – 2 years1
Our Assets80,000 acresin liquidsrich DeepBasin regionLow decline,cash generatingassets withsignificant oilupside~70% oil& liquidsLowdeclinedry gas~47% oil& liquidsGrowth Potential230,000 acres Light oil110,000 acres Shale gas~65% oil& liquids2
Improving our Outlook10090Total <strong>Enerplus</strong> Exit ProductionOil Gas1000900OilTotal <strong>Enerplus</strong> Cash FlowGas80800MMBOE/day706050403020$ Millions700600500400300200101000Exit 2010 Exit 2011 Exit 201202011E2012E• Total production growth of 10 – 15%through 2012• Bakken production expected toincrease by ~70% through 2012• Oil production increasing more than30% over next two years• Oil weighting increasing from 43% to49% by end of 2012• Williston properties expected to generate50% of total net operating income in 2011• 55% of total capex in 2011 is in theWilliston• IRR on projects range from 40% to 150%• Fort Berthold projects have an expectedrecycle of 3.4x to 6.5xBased upon forward commodity prices (WTI US$101/bbl, AECO $3.94/Mcf, NYMEX Gas US$4.38/MMBtu) and forecast costs as of May 25, 2011 including hedging3
Our Williston Basin AssetsENERPLUS ASSETWilliston Basin Summary:• Acreage:• Over 250,000 net acres• Current Production:• ~15,500 BOE/day (~20%of total)• Reserves:• 79 MMBOE (~26% of total)• Contingent Resource:• 72 MMBOE• 2011 <strong>Capital</strong>:• ~$360 million (55% of total)Source - U.S. EIA4
Our Williston Basin AssetsENERPLUS ASSETSaskatchewan:• Waterflood expansion and new drilling potential• 122,300 net acres targeting Ratcliffe/Bakken• Current Production ~3,000 BOE/day• 2011 Capex: $80 Million• Drilling 20 net wells, 20 injector conversionsMontana:• Mature property generating free cash flow• Current Production ~6,500 BOE/day• 2011 Capex: $35 Million• Drilling 4 net wellsNorth Dakota:• Significant production & reserves growth potential• 74,500 net acres targeting Bakken and Three Forks• Current Production ~4,500 BOE/day• 2011 Capex: $230 Million• Expect to complete ~30 net wellsSource - U.S. EIA5
North Dakota Bakken & Three Forks PotentialKey FactsNet Acreage2P Reserves (Dec. 31, 2010)Bakken Contingent Resource Est.(Best)74,500 (116 sections)22.4 million BOE60 million BOE90 drilling locations• Concentrated acreage position (allottees)with long lease tenure• Early results exceeding type curves andpoint to repeatability and rates of return from60% – 100+%>90% operated, ~90% WI• $230 MM capital program planned for 2011 -currently running 4 rigs with servicecontracts in place to drill and complete 4 – 5wells per month6
Economics are Exceeding Type CurveLong laterals are 30% ahead of the avg type well predictionShort laterals are 45% ahead of the avg type well predictionLong Laterals (9,000 ft. 24 frac stages), $8.5 MM/wellTypeCurveActual5 Well avgAvg. 30 day initial production (bbls/day) 1,100 – 1,200 1,230Expected Ultimate Recovery (Mbbls) 600 – 800Expected Net Present Value (12%, $MM)* $11.20 – $18.0Expected Payout Period (years) 1.3 – 0.8Expected F&D ($/BOE) $13.00 - $9.75Short Laterals (4,500 ft. 12 frac stages), $6 MM/wellTypeCurveActual5 Well avgAvg. 30 day initial production (bbls/day) 500 – 650 730Expected Ultimate Recovery (Mbbls) 300 – 400Expected Net Present Value (12%, $MM)* $4.0 – $7.5Expected Payout Period (years) 2.2 – 1.3Expected F&D ($/BOE) $18.50 - $13.50*Based on May 25, 2011 forward priceRoyalties average 20%, plus state production tax of 11.5%, op. costs of $4/bbl, differential assumption of $10 - $12/bbl7
Keys to Fort Berthold Development• Expect to complete ~30 net wellsin 2011• Determine optimal well spacingand density• Maximize long horizontals• Determine Three Forks potential• Focus on multi-well pad drilling• minimize surface impact andtie-in costs• Install gathering system tocapture associated gas• Implement salt water disposalsolution8
Significant Future Production Growth from Fort BertholdGrowth potential of 20,000 – 25,000 BOE/day30,00025,00020,000Incremental production - 4 to 6 rigsProduction assuming 4 rigsIncremental capital required - 4 to 6 rigs<strong>Capital</strong> required - 4 rigsFree Cash Flow (NOI - Capex) - 4 to 6 rigsFree Cash Flow (NOI - Capex) - 4 rigs$600$500$400• Self-funding with free cashflow in 2012• Over $1 billion of capitalover next 4 yearsBOE/day15,00010,0005,00002011 2012 2013 2014$300$200$100$0$ Millions• Net operating incomeapproaches ~$500 millionby 2014• Expected F&D cost of$10 - $19/BOE with currentnetbacks of over $65/bbl• Recycle ratios of 3.4 – 6.5x-5,000-$100Assumes May 25, 2011 strip pricing9
Freda/Skinner/Neptune, SK - Ratcliffe & Bakken• Approximately 115,000 netacres of Ratcliffe rights• Majority overlay Bakkenrights• Oungre/Ratcliffe zones at a1,600 - 1,800 metre depth• Current Ratcliffe production~1,800 BOE/day<strong>Enerplus</strong> RatcliffeRights• Internal best estimatecontingent resource of 9.0MMBOE, 70% of our booked2P reserves• Positive success in theRatcliffeAverage working interest > 98%Ranging from 70 –100%10
Summary• Current development plans expected to result innearly 40% increase in total cash flow through 2012• Williston is a key contributor to growth for <strong>Enerplus</strong>– Expect to see ~20% increase in light oil volumes by exit2011– Multi-year inventory of drilling prospects in the basin• ~100% reserve upside through current identified contingentresource• Pursue strategic acquisitions to build on corepositionsWilliston Basin:A key driver ofproduction,reserves and cashflow growth• $1 billion unutilized credit facility supports our growthstrategy11
Supplemental InformationThe Game Plan
Attractive Valuation*Peer Average: $113,114Peer Average: 9.1xPeer Average: 1.6x Peer Average: 3.1%* Cash Flow is Q1 2011 annualized. Average production and debt are as of Q1 2011. Share prices are as of June 23, 2011.** <strong>Enerplus</strong> Q1 2011 debt and enterprise value has been adjusted to reflect the proceeds of sale of non-operated Marcellus assets in May 201113
HedgingThe following is a summary of the financial contracts in place at May 2, 2011 expressedas a percentage of our forecasted net production volumes:April 1, 2011– December 31, 2011Crude Oil(US$/bbl)January 1, 2012– December 31, 2012Purchased Puts (downside protection) - $103.00% of forecasted net production - 3%Sold Puts (limiting downside protection) $56.50 $65.00% of forecasted net production 12% 3%Swaps (fixed price) $87.27 $97.64% of forecasted net production 61% 30%Sold Calls (capped price) - $133.00% of forecasted net production - 3%Purchased Calls (repurchasing upside) $101.17 -% of forecasted net production 12% -* There are no natural gas hedges in place at this point in time14
SupplementalBakkenInformation
Bakken & Three Forks GeologyMiddle BakkenUpper Three ForksGeological Age Mississippian DevonianDepth 10,500 – 11,000 ft 10,600 – 11,000 ftThickness 35 – 45 ft 30 – 45 ftPorosity 5 - 6% 6 - 10%Overpressure 0.6 – 0.8 psi/ft 0.6 – 0.8 psi/ftOOIP/640 acres 4 - 6 MMbbls 4 - 5 MMbbls• Believe all our acreage is prospective fordual development• Industry testing Three Forks proximal toour leasehold:• Helis Oil and Gas Dodge well offsettingour acreage to the west - produced 90Mbbls in 4 monthsSource: Tudor Pickering Holt & Co.• Kodiak well offsetting our acreage to theeast - 24 hour IP rate of 1,042 BOE/day;30 day average of 603 BOE/day - only 6of 22 stages currently completed16
Fort Berthold Production – Gathering & Transportation• <strong>Enerplus</strong> has committed to a field gathering system at the Fort BertholdReservation which will:• Aggregate production at a central collection point off the Reservation that willprovide flexible options for marketing the barrels• Gather and monetize both gas and liquids at market prices• Reduce the potential for shut in production due to varying weather, roadconditions, and availability of trucking contractors• Provide some ability to better manage and dispose of produced water• Reduce the number of trucks moving on the Reservation which will reducedust and road wear, and increase safety for the residents• Current transportation/sales commitments of 2,000 bbls/day through2012, increasing to 10,000 bbls/day for 2013/1417
Fort Berthold Well CostsTotal Cost $8.5 MMTotal Cost $5.7 MMCompletions - 125,000 lbs of proppant/stage, $1.3 - $1.5 MM for ceramic proppant- Water: 2,500 – 3,000 bbls/stage, $3 - 6/bbl for trucking & disposal feesTie-in - Additional $500,000Expect pad drilling will materially decrease tie-in costs18
<strong>Enerplus</strong> Well Design Methodology• Typical rigs are 1,000– 1,600 hp with top drive to improveperformance; 2 of 4 drilling rigs in fleet are self moving(“walkers”)• Measured depth of horizontal wells are ~20,000’ (TVD10,700’) and drill in approximately 28 days• Intermediate casing of 7” to the lateral• Liner 4.5” with swellable or mechanical external packers forisolations and mechanical sleeves for stimulation• Frac design is 24 stages with ~125,000 lbs of high strengthproppant per stage to retain long-term conductivity andimprove reserve recovery per wellSource: Baker Tools19
Well Timelines10 – 12 monthsWell application / permitapprovalSite BuildDrillingWaiting on FracCrewsFracing4 - 6 months1 month1 month/well2 months1 - 2 weeks• Environmental assessmentrequired on all federal lands• Have 11 permits in hand or verylate stage approval• Have an additional 30 permitsexpected to complete EA processand be received by mid-summer• Have 50 permits that are beingworked on for submittal betweennow and August• Expect 40 additional permitssubmitted by year-endCannot beginbuilding siteuntil permit inhandMulti-well pads“walking rig” willhelp reducedrilling timeShortage ofbasin-widefleets relativeto drillingactivity20
U.S. Bakken Infrastructure CapacityBarrels800,000700,000600,000500,000400,000300,000200,000100,000PipeCapacityShortfallPlains Bakken ProposalKeystone XL Market LinkBelle Fourche ProposalEnbridge Bakken125k80kEnbridge North DakotaButte Pipeline50k100k60k93k186k150k• Current U.S. Bakkenproduction is ~400MBOE/day• 500 MBOE/day in 2011• Pipeline capacity shortfall:• 80 MBOE/day in 2010• could increase to 125MBOE/day in 2011• Rail and trucking coverscapacity shortfallMandan Refinery55k02007 2008 2009 2010 2011 2012 2013 2014 2015 2016 2017 2018 2019 2020 2021 2022 2023 2024 2025Source: Internal company data and industry analysis• Numerous new pipelines and expansions of over 300 MBOE/day are proposed toaddress the takeaway shortfall• We control some pipeline capacity and also sell to intermediaries who hold capacity onexisting pipelines or who have access to trucking/railing facilities21
SupplementalWaterfloodInformation
Low Decline, Crude Oil WaterfloodsKey FactsP+P Reserves (Dec 31, 2010)Best Est. Contingent Resources83.7 MMBOE(booked to 27%)60.5 MMBOERecovery to Date 21%Average Oil Quality2011E Annual Production30° API13.5 – 15.0 MBOE/day18% of company total• Original oil in place of ~1.1 billion BOEwithin a portion of waterflood portfolio• Significant asset base producing frommedium and light oil formations• Free cash flow supports dividend andgrowth strategy• Underlying base decline rate of ~10%• Significant future reserve potential• EOR projects/pilots under way atGiltedge and Medicine Hat23
Waterflood Upside - Improving and Enhancing Oil RecoveryAssetOOIP(MMBOE)2010 YE 2PReserves(MMBOE)Contingent Resource(MMBOE)IOR EOR Total2011Cap Ex($MM)Project TypeMedicine Hat, AB 217 16.5 6.5 21.7 28.2 24 Drilling & EOR workGiltedge, AB 126 10.4 4.0 12.6 16.6 7 EOR – polymer projectFreda/Skinner Lake, SK 75 10.2 6.6 0 6.6 36 DrillingCadogan, AB 45 2.1 3.6 0 3.6 2 DrillingVirden/Daly, MB 283 8.5 3.1 0 3.1 14 DrillingNeptune, SK 24 2.6 2.4 0 2.4 8 DrillingSub-Total 770 50.3 26.2 34.3 60.5 91• Other waterflood assets with IOR/EOR upside:• Pembina 5-way• Gleneath• Joarcam• Progress/Pouce CoupeContingentresource estimaterepresents a 75%increase to 2Pwaterfloodreserves if fullybookedNote: There are other waterflood properties that contribute to reserves and production within this resource play that are not included above24
The Stages of Oil RecoveryStageWaterflood• Injecting high pressure waterImplications• Hold production steady, grow recovery• Facilities in place• Maintenance costs increasing with ageImproved Oil Recovery (IOR)• Optimizing waterfloods throughsweep, pattern or voidageimprovements• Conducting lab work to screen forEOR potentialEnhanced Oil Recovery (EOR)• Reducing residual oil saturationand improving sweep efficiency• Grow production & recovery• Spending capital up front for future benefit• Expand facilities• Convert vertical producers to injection• Drill horizontal producers• Maintenance costs improved• Grow production and recovery• Spending capital up front for future benefit• Increasing op costs• Facilities for polymer injection• Polymer25
Polymer Flood• Polymer is chemical additivethat increases viscosity ofinjected water• Reduces residual oil saturation• Improves sweep efficiency• Works best with heavier crudesin high permeability reservoirswith low waterflood recoveryfactors• The first identified projects areat Giltedge and Medicine HatGlauc C• Typical expected recoveryimprovement is ~8 - 15% (ruleof thumb is 30% of the projectedwaterflood recoverable oil)Source – Oil and Gas Journal26
Giltedge – Polymer EOR Project AreaArea ofPolymerProject262522 23 24113614 1312 12100 % Working InterestWildmere Unit (4.73% WI)Wildmere UnitE+ 4.7% WIKey FactsOOIPRecovery Factor to Date ~13%Cumulative ProductionP+P Reserves (Dec 31, 2010)Best Est. Contingent ResourceOil Quality2011E Avg. Production126 MMBOE16.4 MMBOE10.4 MMBOE(booked to 21%)16.6 MMBOE14° - 20° API1,700 BOE/dayoil, 97% water cut• Waterflood initiated in 1974, we acquired in1996• Lloydminster zone at a depth of 650 metres• Historical decline: ~13%• Expected 2011 netback: ~$45/BOE• IOR and EOR contingent resource potential of16.6 MMBOE, over 60% more than current 2Preserves• Polymer project underway in 201127
Giltedge – Anticipated EOR Upside with Polymer FloodPolymer ProjectArea• Potential incrementalreserve adds of 0.8 MMBOE -1.5 MMBOE in project area• Production in project areacould increase 2 - 3 timesfrom current levels overnext 20 - 30 months• Full field internal bestestimate contingentresource of 13 MMBOE(10% incremental RF)• Currently injecting polymerwith expected results byyear-endPolymer injection wells28
Giltedge – Polymer Project Costs and EconomicsMaterial value creation opportunity• Project timeline• Q2 2011 – first injection, production response in ~6 months• Polymer injection will continue for approximately four years• Decision to expand may be made sometime after 2013• Intent is to be at full field polymer flood by late 2017Project costs• Facilities - $7 million• Polymer - $10 million (over 4 years)• Operating Cost - $1 million/year• Indicative economic factors• NPV @ 10%: ~$20 million• IRR: 25 - 40%29
Giltedge Production HistoryProduction maintained for last decadeReconstructionDowntime30
Medicine Hat Glauc C – Polymer PotentialKey FactsOOIPRecovery Factor to Date ~8%Cumulative ProductionP+P Reserves (Dec 31,2010)Best Estimate ContingentResourceOil Quality2011E Avg. Production217 MMBOE17 MMBOE16.5 MMBOE (booked to 15%)IOR 6.5 MMBOE (+3% RF)EOR 21.7 MMBOE (+10% RF)11° to 18° API2,500 BOE/day, 91% water cut72% WI across ~14 sections• Discovered in 1984, acquired in 1998, unitizedin 2001• Initiated waterflood in 2001 with focuseddevelopment from 2007• Currently 112 producing and 55 injection wells• EOR could more than double remaining reserves• Estimated incremental recovery factor of 10%• 21.7 MMBOE of best estimate contingentresource under polymer flood31
2011 Development <strong>Capital</strong> Plans at Med HatEOR Project $2 million:Facilities $10 million:Wells $12 million:Total Budget - $24 million:• EOR design completeby mid 2011• First Polymer projectbegins in Q2 2012with a second projectstarting one year later• Early costs includingdesign, skids, etc.• Battery expansionsand rebuilds – Q22011 completion• Fluid handlingoptimization ongoing• Decrease HZ wellspacing to 100metres• Drill source wellwest of river• Optimized productionand injection• Increase EUR by 3%(6.5 MMBOE)• Anticipated full cycleF&D of ~ $20/BOE32
Freda Lake Ratcliffe UnitFreda Lake Ratcliffe Voluntary Unit #199.86% WIKey FactsOOIP55 MMBOERecovery Factor to Date ~14%Cumulative ProductionP+P Reserves (Dec. 31, 2010)8 MMBOE10.2 MMBOE(booked to 31%)Best Est. Contingent Resource 2.3 MMBOE (+4%RF)Oil Quality2011E Exit Production32° API1,900 BOE/day oil(+40% vs 2010)<strong>Enerplus</strong> Ratcliffe Rights2009/10 Development Locations2011 Development Locations2011 Injector ConversionsHorizontal wells and waterflood optimizationunlocked major resource• Discovered 1967 & developed on 80 acre vertical wellspacing, acquired in 2003• Peripheral waterflood implemented mid 1980’s• New wells attract lower royalties• Historical decline ~ 4%, RLI ~40 years• Injection conversions increasing oil production fromsurrounding producers• Recent single and dual leg HZ wells producing at150-300 bbl/day with 37-65% water cuts vs aprevious pool average of over 90%33
Freda Lake Ratcliffe Unit ProductionUp to 14 more HZ wells to drill in the unit7 HZ wells drilled increasedproduction from ~500 BOE/day toover 1,300 BOE/day at year-end34
SupplementalMarcellusInformation
Marcellus Overview• Over 110,000 net acres in the region• Concentrated non-operated land position in NEPennsylvania– 45,000 non-operated acres with 20% averageworking interest– Average EUR of 4.9 Bcf– Partnered with two experienced shale players –Chief & EXCO• Long-tenure operated lease position– 66,000 net operated acres in West Virginia,Maryland and Central PA– Control of pace of development• Contingent resource estimate of 2.3 Tcf - triplebooked corporate 2P natural gas reserves• Attractive full-cycle F&D cost of ~$1.65/Mcf150 MMcf/dayof futureproductionpotential36
Marcellus Shale Gas Overview• 66,000 net operated acres with90% working interest• Long lease tenure• Focused on delineation in 2011• 45,000 net non-operated acreswith 20% avg. working interest• Major non-op partners:• EXCO (22% WI)• Chief Oil and Gas (18% WI)37
Improving Marcellus PerformancePrior to Non-Op SaleAfter Non-Op SaleCumulative Production (MCFE)1,400,0001,200,0001,000,000800,000600,000400,000200,0006.0 Bcfe Type Curve3.5 Bcfe Type CurveTop 5 wells (min. 180 days)Average Actual ProductionCumulative Production (Mcfe)1,400,0001,200,0001,000,000800,000600,000400,000200,0006.0 Bcfe Type Curve3.5 Bcfe Type CurveTop 5 wells (min. 180 days)Average Actual Production00 30 60 90 120 150 180 210 240 270 300 330 36000 30 60 90 120 150 180 210 240 270 300 330 360Days ProducingDays Producing• Type curve estimates have been increased as well results have either met orexceeded expectations.• ~40% of wells post-divestment are outperforming 6 Bcfe type curve• Average actual production now tracking 6 Bcfe type curve38
Marcellus Well EconomicsNYMEX$/MMbtuIRR4.0 Bcf Well 5.0 Bcf Well 6.0 Bcf WellPayout(Years)NPV 12%($MM)IRRPayout(Years)NPV 12%($MM)IRRPayout(Years)NPV 12%($MM)* Assumes long-runwell cost of $6.0 MM$6.00 27% 3.4 $2.51 41% 2.5 $4.57 57% 2.0 $6.62$5.00 16% 4.9 $0.75 26% 3.4 $2.37 37% 2.6 $3.99$4.00 7% 8.6 ($1.02) 13% 5.7 $0.17 20% 4.2 $1.35IRR > 12%6.0 Bcf Type Curve3.5 Bcf Type Curve39
2011 Marcellus Plans• 2011 capital program of $160 million – underreview as a result of non-operated acreage sale• Non-operated activity – focused in NE PAregion:– EXCO – currently running 2 rigs, expect toincrease to 3 rigs in Q3 with all activity focused inLycoming County– Chief – continue to run 3 rigs with activityfocused in Bradford and Susquehanna counties• Operated activity:– Running 1 rig and expect to drill 5 gross wellsfocused on delineating resource• Starting second well in Clinton County, PA with 3wells planned in Preston County, WVCurrent averagenetback of$3.74/Mcf40
Future Production Growth in the MarcellusSizeable resource capture provides opportunity for material development• Production of ~150 MMcf/dayby end of 2014• <strong>Capital</strong> spending requirementsof over $800 million in next4 years• Net operating income growsto almost $200 million by 2014• Expected F&D cost of~$1.65/McfAssumes April 26, 2011 strip pricing41
Marcellus Well Timeline6 – 8 monthsWell application / permitapprovalSite BuildDrillingWaiting on FracCrewsFracing45 – 60 days in PA45 – 90 days25 – 35days/well30 - 60 days7 - 14 days• 30 – 45 days in WV• Assumes water sourcespermitted• Current regulations• Cannot beginbuilding siteuntil permit inhand• Depends ontime of year• Multi-wellpads• “self-skidding”rigs helpreduce drillingtime• Shortage offrac fleetsrelative tobasin-widedrilling activityNote: Timeline excludes well “resting” and tie-in to gathering systems42
Moving Natural Gas Out of the Marcellus• <strong>Enerplus</strong> has taken several steps to ensure we can move our growingMarcellus gas production to market:• Entered into longer term (5 years +) firm “must take” contracts with creditworthysubstantial end users of the natural gas who:• hold firm capacity on the various interstate pipelines (Transco, Tennessee)• have storage capacity and trading ability• These contracts have flexibility to increase delivered volumes as we bringproduction to pipe:MMBtu/d MMcf/d 2011 2012 2013 2014 2015Min Max Min Max Min Max Min Max Min MaxCommitted Sales into Transco Pipeline: 12 36 48 74 68 81 65 80 38 45Committed Sales in to Tennessee Gas Pipeline: 21 30 30 38 14 38 38 14 6 6• Participated in the Wyoming Pipeline Project that creates optionality for ourproduction between the two key pipelines - Transco and Tennessee43
SupplementalDeep BasinInformation
Deep Basin OpportunityStacked MannvillePotential• 60,000 net acres of land(42,000 undeveloped)Montney Potential• 20,000 net acres ofundeveloped land<strong>Enerplus</strong> Deep Basin growth opportunitiesExisting <strong>Enerplus</strong> Deep Basin assets• Approximately 80,000 netacres of high working interestland in the Deep Basin• Includes 100% workinginterest in approximately60,000 undeveloped acres• Multiple contiguous acreageblocks with liquids rich multizonepotential• Focused on delineation in2011 given current gas priceenvironmentLarge, long tenure, high workinginterest land holdings45
Deep Basin Development Plan• Pace of development heavily influenced by natural gas prices• High working interest and 3+ years of land tenure allow us to control thepace of play on our undeveloped land position• Benefiting from competitor de-risking• Competitor well results in line with type curve expectations both inMontney and Stacked Mannville regions• 2011 capital spending plans:• ~$40 million• Mainly non-operated drilling activity in liquids-rich area• Positive drilling results to date surrounding our properties atAnsell/Minehead• Some operated drilling to delineate a portion of Stacked Mannville lands46
Stacked MannvilleKey FactsKey propertiesNet Acreage (acres)Pine Creek to Hanlan~60,000 total (42,000 undeveloped)Future HZ Drilling Locations 100 - 200Expected EUR/Well*2.8 - 4.0 Bcfe• Acquiring and utilizing 3D seismic• Drilled/drilling 3 delineation wells, 3 otherslicensed and ready to execute in 2011• Liquids ratios of 15 – 40 bbls/MMcf• Additional de-risking ongoing by competitorsand partnersContiguous land blocks in highlyprospective regions<strong>Enerplus</strong> working interest lands* Expected EUR/well based on public data from offset wells. Number of future locations based on development of30% to 60% of <strong>Enerplus</strong> acreage47
Montneyb-66-B wellPink MountainMntn LicensesKey Facts94-G-2Mntn ProductionERF Well LicenseKey Properties Cameron /Julienne CreekERF 3D SeismicNet Acreage (acres) 17,000Future Hz Drilling Locations 50 – 150<strong>Enerplus</strong>Expected EUR/Well3.5 – 5.5 Bcfe• 3D seismic purchased andreprocessed94-B-15• Existing well (b-66B) indicates over300 metres of Montney thickness• Rock analysis indicates goodreservoir development• Liquids ratio is expected to bebetween 20 and 30 bbls/MMcf• <strong>Enerplus</strong> well licensed in Q1 2011although drill timing is uncertain100% working interest48
DisclaimersAssumptionsAll economics contained have been calculated using forward prices and costs as of February 14, 2011. All amounts are stated in Canadian dollars unlessotherwise specified.Barrels of Oil Equivalent and Cubic Feet of Gas EquivalentThis presentation contains references to "BOE" (barrels of oil equivalent), "Mcfe" (thousand cubic feet of gas equivalent), "Bcfe" (billion cubic feet of gasequivalent) and "Tcfe" (trillion cubic feet of gas equivalent). <strong>Enerplus</strong> has adopted the standard of six thousand cubic feet of gas to one barrel of oil (6 Mcf: 1bbl) when converting natural gas to BOEs, and one barrel of oil to six thousand cubic feet of gas (1 bbl: 6 Mcf) when converting oil to Mcfes, Bcfes and Tcfes.BOEs, Mcfes, Bcfes and Tcfes may be misleading, particularly if used in isolation. The foregoing conversion ratios are based on an energy equivalencyconversion method primarily applicable at the burner tip and do not represent a value equivalency at the wellhead. "MBOE" and "MMBOE" mean "thousandbarrels of oil equivalent" and "million barrels of oil equivalent", respectively.Presentation of Production and Reserves InformationIn accordance with Canadian practice, production volumes and revenues are reported on a “Company interest” basis, before deduction of Crown and otherroyalties, plus <strong>Enerplus</strong>’ royalty interest. Unless otherwise specified, all reserves volumes in this presentation (and all information derived therefrom) arebased on "company interest reserves" using forecast prices and costs. "Company interest reserves" consist of "gross reserves" (as defined in NationalInstrument 51-101 adopted by the Canadian securities regulators ("NI 51-101"), being <strong>Enerplus</strong>' working interest before deduction of any royalties, plus<strong>Enerplus</strong>' royalty interests in reserves. “Company interest reserves" are not a measure defined in NI 51-101 and do not have a standardized meaning under NI51-101. Accordingly, our company interest reserves may not be comparable to reserves presented or disclosed by other issuers. Our oil and gas reservesstatement for the year ended December 31, 2010, which will include complete disclosure of our oil and gas reserves and other oil and gas information inaccordance with NI 51-101, will be contained within our Annual Information Form for the year ended December 31, 2010 ("our AIF") which is available on ourwebsite at www.enerplus.com and on our SEDAR profile at www.sedar.com. Additionally, our Annual Information Form is part of our Form 40-F that has beenfiled with the U.S. Securities and Exchange Commission and will available on EDGAR at www.sec.gov. Readers are also urged to review the Management’sDiscussion & Analysis and financial statements filed on SEDAR and EDGAR for more complete disclosure on our operations.Contingent Resource EstimatesThis presentation contain estimates of "contingent resources". "Contingent resources" are not, and should not be confused with, oil and gas reserves."Contingent resources" are defined in the Canadian Oil and Gas Evaluation Handbook (the "COGE Handbook") as "those quantities of petroleum estimated,as of a given date, to be potentially recoverable from known accumulations using established technology or technology under development, but which are notcurrently considered to be commercially recoverable due to one or more contingencies. Contingencies may include factors such as economic, legal,environmental, political and regulatory matters or a lack of markets. It is also appropriate to classify as “contingent resources” the estimated discoveredrecoverable quantities associated with a project in the early evaluation stage." There is no certainty that we will produce any portion of the volumes currentlyclassified as “contingent resources”. The “contingent resource” estimates contained herein are presented as the "best estimate" of the quantity that will actuallybe recovered, effective as of December 31, 2010. A "best estimate" of contingent resources means that it is equally likely that the actual remaining quantitiesrecovered will be greater or less than the best estimate, and if probabilistic methods are used, there should be at least a 50% probability that the quantitiesactually recovered will equal or exceed the best estimate.49
DisclaimersFor information regarding the primary contingencies which currently prevent the classification of our disclosed “contingent resources” associated with our Marcellusshale gas assets as reserves and the positive and negative factors relevant to the “contingent resource” estimate, see our Annual Information Form for the yearended December 31, 2009 (and corresponding Form 40-F) dated March 12, 2010, a copy of which is available on our SEDAR profile at www.sedar.com and acopy of the Form 40-F which is available on our EDGAR profile at www.sec.gov. With respect to the “contingent resource” estimate for our North Dakota Bakkenproperties, the primary contingencies which currently prevent the classification of our disclosed “contingent resources” associated with the properties as "reserves"consist of additional delineation drilling to establish economic productivity in the development areas and limitations to development based on adverse topographyor other surface restrictions. Significant positive factors related to the estimate include; continued advancement of drilling and completion technology and earlyperformance of producing wells that are above forecast. A significant negative factor related to the estimate is the limited performance history in the immediatearea of the “contingent resource”. With respect to our Waterflood assets, the primary contingencies which currently prevent the classification of our disclosed“contingent resources” associated with the properties as "reserves" are due to the early stage of implementation to the specific patterns within the existingwaterfloods and the early stage of the specific enhanced oil recovery projects to the existing waterfloods. Significant positive factors related to the estimate includeestablished waterflood technology, the history of waterflood performance data and the estimates are based on incremental recovery from higher displacementefficiency only with no improved recovery from additional areal sweep. A significant negative factor relevant to this estimate is the geological complexity and itseffect on injector producer connectivity. There are a number of inherent risks and contingencies associated with the development of our interests in theseproperties including commodity price fluctuations, project costs, our ability to make the necessary capital expenditures to develop the properties, reliance on ourindustry partners in project development, acquisitions, funding and provisions of services and those other risks and contingencies described above, and that applygenerally to oil and gas operations as described above, and under "Risk Factors" in our Annual Information Form referred to above.F&D CostsF&D costs presented are calculated (i) in the case of F&D costs for proved reserves, by dividing the sum of exploration and development costs incurred in the yearplus the change in estimated future development costs in the year, by the additions to proved reserves in the year, and (ii) in the case of F&D costs for proved plusprobable reserves, by dividing the sum of exploration and development costs incurred in the year plus the change in estimated future development costs in theyear, by the additions to proved plus probable reserves in the year. The aggregate of the exploration and development costs incurred in the most recent financialyear and the change during that year in estimated future development costs generally will not reflect total finding and development costs related to its reservesadditions for that year.Non-GAAP MeasuresIn these presentations, we use the terms "payout ratio" and "adjusted payout ratio" to analyze operating performance, leverage and liquidity, and the term "F&Dcosts" as a measure of operating performance. We calculate "payout ratio" by dividing cash distributions to unitholders by cash flow from operating activities, bothof which are measures prescribed by Canadian generally accepted accounting principles ("GAAP") and which appear on our consolidated statements of cash flow."Adjusted payout ratio" is calculated as cash distributions to unitholders plus development capital and office expenditures, divided by cash flow from operatingactivities. We also use the term "netback", which is used to measure operating performance and is calculated by subtracting <strong>Enerplus</strong>’ expected royalties andoperating costs from the anticipated revenues in respect of the relevant properties. <strong>Enerplus</strong> believes that, in addition to net earnings and other measuresprescribed by GAAP, the terms "payout ratio", "adjusted payout ratio", "F&D costs" and "netback" are useful supplemental measures as they provide an indicationof the results generated by <strong>Enerplus</strong>' principal business activities. However, these measures are not measures recognized by GAAP and do not have astandardized meaning prescribed by GAAP. Therefore, these measures, as defined by <strong>Enerplus</strong>, may not be comparable to similar measures presented by otherissuers.50
DisclaimersNOTICE TO U.S. READERSThe oil and natural gas reserves information contained herein has generally been prepared in accordance with Canadian disclosure standards, which are notcomparable in all respects to United States or other foreign disclosure standards. Reserves categories such as "proved reserves" and "probable reserves"may be defined differently under Canadian requirements than the definitions contained in the United States Securities and Exchange Commission (the "SEC")rules. In addition, under Canadian disclosure requirements and industry practice, reserves and production are reported using gross (or, as noted above,"company interest") volumes, which are volumes prior to deduction of royalty and similar payments. The practice in the United States is to report reserves andproduction using net volumes, after deduction of applicable royalties and similar payments. Canadian disclosure requirements require that forecastedcommodity prices be used for reserves evaluations, while the SEC mandates the use of an average of first day of the month price for the 12 months prior tothe end of the reporting period. Additionally, the SEC prohibits disclosure of oil and gas resources, whereas Canadian issuers may disclose oil and gasresources. Resources are different than, and should not construed as reserves. For a description of the definition of, and the risks and uncertaintiessurrounding the disclosure of, contingent resources, see “Information Regarding Reserves, Resources and Operational Information” above.FORWARD-LOOKING INFORMATION AND STATEMENTSThis presentation contains certain forward-looking information and statements ("forward-looking information") within the meaning of applicable securitieslaws. The use of any of the words "expect", "anticipate", "continue", "estimate", “guidance”, "objective", "ongoing", "may", "will", "project", "should", "believe","plans", "intends", “budget”, "strategy" and similar expressions are intended to identify forward-looking information. In particular, but without limiting theforegoing, these presentations contains forward-looking information pertaining to the following: <strong>Enerplus</strong>' strategy to deliver both income and growth toinvestors and <strong>Enerplus</strong>' related asset portfolio; future returns to shareholders from both dividends and from growth in per share production and reserves; futurecapital and development expenditures and the allocation thereof among our resource plays and assets; future development and drilling locations and plans;the performance of and future results from <strong>Enerplus</strong>' assets and operations, including anticipated production levels and decline rates; future growth prospects,acquisitions and dispositions; the volumes and estimated value of <strong>Enerplus</strong>' oil and gas reserves and contingent resource volumes and future commodity priceand foreign exchange rate assumptions related thereto; the life of <strong>Enerplus</strong>' reserves; the volume and product mix of <strong>Enerplus</strong>' oil and gas production; securingnecessary infrastructure and third party services; the amount of future asset retirement obligations; future cash flows and debt-to-cash flow levels; potentialasset sales; returns on <strong>Enerplus</strong>' capital program; <strong>Enerplus</strong>' tax position; and future costs, expenses and royalty rates.The forward-looking information contained in this presentation reflects several material factors and expectations and assumptions of <strong>Enerplus</strong> including,without limitation: that <strong>Enerplus</strong> will conduct its operations and achieve results of operations as anticipated; that <strong>Enerplus</strong>' development plans will achieve theexpected results; the general continuance of current or, where applicable, assumed industry conditions; the continuation of assumed tax, royalty andregulatory regimes; the accuracy of the estimates of <strong>Enerplus</strong>' reserve and resource volumes; commodity price and cost assumptions; the continuedavailability of adequate debt and/or equity financing and cash flow to fund <strong>Enerplus</strong>' capital and operating requirements as needed; and the extent of itsliabilities. <strong>Enerplus</strong> believes the material factors, expectations and assumptions reflected in the forward-looking information are reasonable but no assurancecan be given that these factors, expectations and assumptions will prove to be correct.51
Investor Relations ContactsJo-Anne M. CazaVice President, Corporate & Investor Relations403-298-2273jcaza@enerplus.comGarth DollManager, Investor Relations403-298-1218gdoll@enerplus.com1-800-319-6462investorrelations@enerplus.comwww.enerplus.comThe Dome TowerSuite 3000, 333 7th Ave SWCalgary, AB CanadaT2P 2Z1


