Morbidity and Mortality Weekly Report - Active Living Network
Morbidity and Mortality Weekly Report - Active Living Network
Morbidity and Mortality Weekly Report - Active Living Network

You also want an ePaper? Increase the reach of your titles
YUMPU automatically turns print PDFs into web optimized ePapers that Google loves.
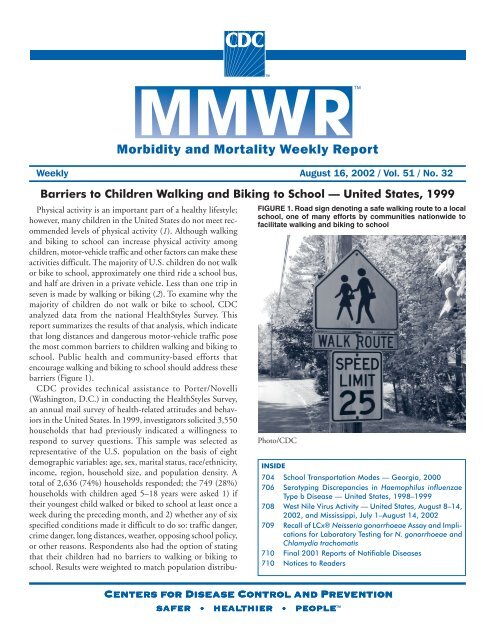
<strong>Morbidity</strong> <strong>and</strong> <strong>Mortality</strong> <strong>Weekly</strong> <strong>Report</strong><strong>Weekly</strong> August 16, 2002 / Vol. 51 / No. 32Barriers to Children Walking <strong>and</strong> Biking to School — United States, 1999Physical activity is an important part of a healthy lifestyle;however, many children in the United States do not meet recommendedlevels of physical activity (1). Although walking<strong>and</strong> biking to school can increase physical activity amongchildren, motor-vehicle traffic <strong>and</strong> other factors can make theseactivities difficult. The majority of U.S. children do not walkor bike to school, approximately one third ride a school bus,<strong>and</strong> half are driven in a private vehicle. Less than one trip inseven is made by walking or biking (2). To examine why themajority of children do not walk or bike to school, CDCanalyzed data from the national HealthStyles Survey. Thisreport summarizes the results of that analysis, which indicatethat long distances <strong>and</strong> dangerous motor-vehicle traffic posethe most common barriers to children walking <strong>and</strong> biking toschool. Public health <strong>and</strong> community-based efforts thatencourage walking <strong>and</strong> biking to school should address thesebarriers (Figure 1).CDC provides technical assistance to Porter/Novelli(Washington, D.C.) in conducting the HealthStyles Survey,an annual mail survey of health-related attitudes <strong>and</strong> behaviorsin the United States. In 1999, investigators solicited 3,550households that had previously indicated a willingness torespond to survey questions. This sample was selected asrepresentative of the U.S. population on the basis of eightdemographic variables: age, sex, marital status, race/ethnicity,income, region, household size, <strong>and</strong> population density. Atotal of 2,636 (74%) households responded; the 749 (28%)households with children aged 5–18 years were asked 1) iftheir youngest child walked or biked to school at least once aweek during the preceding month, <strong>and</strong> 2) whether any of sixspecified conditions made it difficult to do so: traffic danger,crime danger, long distances, weather, opposing school policy,or other reasons. Respondents also had the option of statingthat their children had no barriers to walking or biking toschool. Results were weighted to match population distribu-Centers for Disease Control <strong>and</strong> PreventionSAFER • HEALTHIER • PEOPLE TMFIGURE 1. Road sign denoting a safe walking route to a localschool, one of many efforts by communities nationwide tofacilitate walking <strong>and</strong> biking to schoolPhoto/CDCINSIDE704 School Transportation Modes — Georgia, 2000706 Serotyping Discrepancies in Haemophilus influenzaeType b Disease — United States, 1998–1999708 West Nile Virus Activity — United States, August 8–14,2002, <strong>and</strong> Mississippi, July 1–August 14, 2002709 Recall of LCx® Neisseria gonorrhoeae Assay <strong>and</strong> Implicationsfor Laboratory Testing for N. gonorrhoeae <strong>and</strong>Chlamydia trachomatis710 Final 2001 <strong>Report</strong>s of Notifiable Diseases710 Notices to Readers
702 MMWR August 16, 2002The MMWR series of publications is published by theEpidemiology Program Office, Centers for Disease Control<strong>and</strong> Prevention (CDC), U.S. Department of Health <strong>and</strong>Human Services, Atlanta, GA 30333.SUGGESTED CITATIONCenters for Disease Control <strong>and</strong> Prevention. [ArticleTitle]. MMWR 2002;51:[inclusive page numbers].Centers for Disease Control <strong>and</strong> PreventionJulie L. Gerberding, M.D., M.P.H.DirectorDavid W. Fleming, M.D.Deputy Director for Science <strong>and</strong> Public HealthDixie E. Snider, Jr., M.D., M.P.H.Associate Director for ScienceEpidemiology Program OfficeStephen B. Thacker, M.D., M.Sc.DirectorOffice of Scientific <strong>and</strong> Health CommunicationsJohn W. Ward, M.D.DirectorEditor, MMWR SeriesDavid C. JohnsonActing Managing Editor, MMWR (<strong>Weekly</strong>)Jude C. RutledgeTeresa F. RutledgeJeffrey D. Sokolow, M.A.Writers/Editors, MMWR (<strong>Weekly</strong>)Lynda G. CupellMalbea A. HeilmanBeverly J. Holl<strong>and</strong>Visual Information SpecialistsQuang M. DoanErica R. ShaverInformation Technology Specialiststion in the United States by using the eight demographicvariables.Of the 611 respondents, 19% reported children walking<strong>and</strong> 6% reported children biking to or from school at leastonce a week during the preceding month. Frequency of walking<strong>and</strong> biking trips ranged from zero to >10 times a week(mean frequency: six one-way trips a week). These trips represented14% of all school trips (11% walking <strong>and</strong> 3% biking).The proportions of primary school–aged childrenwalking (18.6%) <strong>and</strong> biking (5.7%) to school were similar tothose of secondary school–aged children walking (19.6%) <strong>and</strong>biking (5.7%) to school.<strong>Report</strong>ed barriers to walking <strong>and</strong> biking to school includedlong distances (55%; 95% confidence interval [CI]=+4%),traffic danger (40%; 95% CI=+4%), adverse weather conditions(24%; 95% CI=+3%), crime danger (18%; 95%CI=+3%), opposing school policy (7%; 95% CI=+2%), orother reasons (26%; 95% CI=+3%) (Figure 2). A total of 16%(95% CI=+3%) reported no barriers to their children walkingor biking to school.Of the 16% of respondents who reported no barriers, 64%reported children walking, <strong>and</strong> 21% reported children bikingto or from school at least once a week during the precedingmonth. Children with no barriers were six times morelikely to walk or bike to school than the rest of their peersaged 5–18 years with one or more barriers.A total of 66% of the children were primary school–aged(aged 5–11 years); 34% were secondary school–aged (aged12–18 years). <strong>Report</strong>ed barriers for primary school–aged childrenwere compared with those for secondary school–agedchildren (Figure 3). Proportions were similar for distance,weather, opposing school policy, <strong>and</strong> other reasons. The proportionof respondents reporting no barriers to their childrenwalking or biking to school was the same for both age groups.However, primary school–aged children reportedly faced barriersof traffic danger <strong>and</strong> crime danger significantly morethan their older peers.FIGURE 2. Percentage of respondents* reporting barriers totheir children walking <strong>and</strong> biking to school, by selectedbarriers — United States, HealthStyles Survey, 1999Division of Public Health Surveillance<strong>and</strong> InformaticsNotifiable Disease <strong>Morbidity</strong> <strong>and</strong> 122 Cities <strong>Mortality</strong> DataRobert F. FaganDeborah A. AdamsFelicia J. ConnorLateka DammondPatsy A. HallPearl C. SharpPercentage1009080706050403020100* n=611.Distance Traffic Weather Crime School OtherpolicyBarriersNo barriers
Vol. 51 / No. 32 MMWR 703FIGURE 3. Percentage of respondents* reporting barriers totheir children walking <strong>and</strong> biking to school, by age group ofchild <strong>and</strong> selected barriers — United States, HealthStylesSurvey, 1999Percentage6050403020100* n=611.Primary school–aged children (aged 5–11 years)Secondary school–aged children (aged 12–18 years)Distance Traffic Weather Crime School OtherpolicyBarriersNo barriers<strong>Report</strong>ed by: AM Dellinger, PhD, Div of Unintentional InjuryPrevention, National Center for Injury Prevention <strong>and</strong> Control;CE Staunton, MD, EIS Officer, CDC.Editorial Note: To increase physical activity among children,two of the national health objectives for 2010 are to increasethe proportion of trips to school made by walking <strong>and</strong> biking(objectives 22-14,15) (3). The median distance to school froma child’s residence is relatively long (2 miles for children aged5–15 years); however, many children do not walk or bike toschool even when distances are short. For children living
704 MMWR August 16, 20025. CDC. Annual mortality tapes. Hyattsville, Maryl<strong>and</strong>: U.S. Departmentof Health <strong>and</strong> Human Services, CDC, 1990–1998. Available athttp://www.cdc.gov/ncipc/osp/data.htm.6. CDC. Data from the National Electronic Injury Surveillance System-All Injury Program operated by the U.S. Consumer Product SafetyCommission. Atlanta, Georgia: US Department of Health <strong>and</strong>Human Services, CDC, National Center for Injury Prevention <strong>and</strong>Control, 2001.7. Schieber RA, Thompson NJ. Developmental risk factors for childhoodpedestrian injuries. Inj Prev 1996;2:228–36.8. CDC. National strategies for advancing child pedestrian safety. In:Schieber RA, Vegega ME, eds. Atlanta, Georgia: US Department ofHealth <strong>and</strong> Human Services, CDC, National Center for Injury Prevention<strong>and</strong> Control, 2001.9. National Highway Traffic Safety Administration, CDC, Federal HighwayAdministration. National strategies for advancing bicycle safety.Washington, DC: U.S. Department of Transportation, National HighwayTraffic Safety Administration, 2001.10. Marin County Bicycle Coalition. Safe Routes to School demonstrationproject, final report, prepared for the National Highway TrafficSafety Administration. Marin, California: Marin County BicycleCoalition, 2001.School Transportation Modes —Georgia, 2000Moderate physical activity (e.g., walking or bicycling)offers substantial health benefits (1–3). Physical activity isespecially important for young persons not only because ofits immediate benefits but also because participation in healthybehaviors early in life might lead to healthier lifestyles in adulthood(4). Persons aged >2 years should engage in >30 minutesof moderately intense physical activity on all or mostdays of the week (1). However, sedentary after-school activities(e.g., watching television or using computers), decreasedparticipation in physical education, <strong>and</strong> fewer students walkingor riding their bicycles to school might contribute to thehigh rate of childhood obesity (5). Walking to school providesa convenient opportunity for children to be physicallyactive. To examine modes of transportation to school forGeorgia children, the Georgia Division of Public Health analyzeddata from the Georgia Asthma Survey conducted duringMay–August 2000. This report summarizes the results ofthat analysis, which indicate that
Vol. 51 / No. 32 MMWR 705TABLE. Percentage of children aged 5–15 years who lived
706 MMWR August 16, 2002Serotyping Discrepancies inHaemophilus influenzae Type bDisease — United States, 1998–1999Since Haemophilus influenzae type b (Hib) conjugate vaccineswere introduced in the United States in 1990, the incidenceof Hib invasive disease has declined markedly (1,2).The majority of cases of Haemophilus influenzae (Hi) diseaseare caused by organisms with capsule types other than b or bynontypeable organisms (1). One of the national health objectivesfor 2010 is to reduce to zero indigenous Hib invasivedisease cases in children aged
Vol. 51 / No. 32 MMWR 707<strong>Report</strong>ed by: LL LaClaire, MS, ML Tondella, PhD, DS Beall, PhD,CA Noble, NE Rosenstein, MD, T Popovic, MD, Div of Bacterial <strong>and</strong>Mycotic Diseases <strong>and</strong> <strong>Active</strong> Bacterial Core Surveillance/EmergingInfections Program <strong>Network</strong>, National Center of Infectious Diseases;PL Raghunathan, PhD, EIS Officer, CDC.Editorial Note: This report documents frequent discrepanciesbetween the results of H. influenzae slide agglutinationserotyping obtained by state health department laboratoriesparticipating in the ABCs system <strong>and</strong> results obtained byCDC. Using PCR capsule typing as the reference st<strong>and</strong>arddemonstrates that nontypeable H. influenzae isolates were disproportionatelymisidentified by slide agglutinationserotyping. All 79 isolates that were nontypeable by PCRlacked the bexA capsular export gene, proving that they wereunencapsulated organisms <strong>and</strong> indicating that variable expressionlevels of capsular polysaccharide were not responsiblefor the discrepancies (6). As Hib disease declines, state healthdepartment laboratories perform slide agglutination serotypingless frequently, which might explain incorrect serotyping ofnontypeable H. influenzae isolates.Using st<strong>and</strong>ardized procedures <strong>and</strong> quality control reducedthe number of discrepancies. For example, when three statehealth department laboratories conducted H. influenzaeserotyping after receiving st<strong>and</strong>ardized reagents <strong>and</strong> protocols,>95% of slide agglutination serotyping results agreedwith slide agglutination serotyping <strong>and</strong> PCR capsule typingresults performed by CDC (7). Slide agglutination serotypingperformed by CDC correlated 100% with PCR capsule typingresults. These results indicate that slide agglutinationserotyping remains a valid <strong>and</strong> reliable method. To improvereproducibility, laboratories should adhere to st<strong>and</strong>ardH. influenzae slide agglutination serotyping procedures. Comparedwith slide agglutination, the PCR approach appearssensitive <strong>and</strong> specific. Because the PCR approach mightresolve serotyping inconsistencies, further evaluation of thisapproach might be beneficial.In this study, of 40 H. influenzae isolates reported to CDCduring 1998–1999 as serotype b, 28 (70%) were identifiedincorrectly by slide agglutination serotyping. Discrepancy ratesvaried substantially among the seven state health departmentlaboratories. Consequently, these findings cannot be extrapolatedbeyond the ABCs sites. During October 2002–September 2003, CDC requests state health department laboratoriesto send all H. influenzae isolates associated withinvasive disease among children aged
708 MMWR August 16, 2002West Nile Virus Activity —United States,August 8–14, 2002, <strong>and</strong> Mississippi,July 1–August 14, 2002This report summarizes West Nile virus (WNV) surveillancedata reported to CDC through ArboNET <strong>and</strong> by states<strong>and</strong> other jurisdictions as of August 14, 2002.United StatesDuring the reporting period of August 8–14,a total of 44 laboratory-positive human cases of WNVassociatedillness were reported from Mississippi (n=20),Louisiana (n=14), Alabama (n=three), Texas (n=two), Florida(n=one), Illinois (n=one), Indiana (n=one), Massachusetts(n=one), <strong>and</strong> the District of Columbia (n=one). During thesame period, WNV infections were reported in 382 deadcrows, 310 other dead birds, 52 horses, <strong>and</strong> 362 mosquitopools.During 2002, a total of 156 human cases with laboratoryevidence of recent WNV infection have been reported fromLouisiana (n=85), Mississippi (n=48), Texas (n=14), Alabama(n=three), Illinois (n=two), Florida (n=one), Indiana (n=one),Massachusetts (n=one), <strong>and</strong> District of Columbia (n=one).Nine deaths have been reported from Louisiana (n=seven) <strong>and</strong>Mississippi (n=two). Among the 154 patients with availabledata, the median age was 54 years (range: 3–94 years), <strong>and</strong> thedates of illness onset ranged from June 10 to August 13.In addition, 1,458 dead crows <strong>and</strong> 1,137 other dead birdswith WNV infection were reported from 37 states, New YorkCity, <strong>and</strong> the District of Columbia (Figure 1); 139 WNVFIGURE 1. Areas reporting West Nile virus (WNV) activity —United States, 2002*infections in horses have been reported from 15 states(Alabama, Florida, Georgia, Illinois, Kansas, Kentucky, Louisiana,Minnesota, Mississippi, Nebraska, North Dakota, Ohio,South Dakota, Tennessee, <strong>and</strong> Texas). During 2002, WNVseroconversions have been reported in 62 sentinel chickenflocks from Florida, Nebraska, <strong>and</strong> Pennsylvania; 787 WNVpositivemosquito pools have been reported from 13 states(Alabama, Georgia, Illinois, Indiana, Massachusetts, Mississippi,Nebraska, New Jersey, Ohio, Pennsylvania, SouthDakota, Texas, <strong>and</strong> Virginia), New York City, <strong>and</strong> theDistrict of Columbia.MississippiDuring July 1–August 14, the Mississippi State Departmentof Health (MSDH) identified 48 human cases with laboratoryevidence of WNV infection (Figure 2). Using the surveillancecase definition, 31 cases were laboratory confirmed<strong>and</strong> 17 were probable. Of the two reported deaths, onewas attributed to WNV infection; the second is underinvestigation.The 48 patients had a median age of 55 years (range: 3–89years); 58% were male. Initial clinical data indicate that 46(96%) of the patients had WNV-associatedmeningoencephalitits. The two remaining cases are underevaluation.FIGURE 2. Number of West Nile virus cases in humans*, bycounty — Mississippi, July 1–August 14, 2002121StarkvilleDistrict ofColumbiaJackson12014 3125 1 1 2HattiesburgRecent human WNV infection <strong>and</strong> animal WNV activityAnimal WNV activity only111Pascagoula* As of August 14, 2002.* n=48.
Vol. 51 / No. 32 MMWR 709Of Mississippi’s 82 counties, 43 (52%) have reported WNVactivity (positive animal, mosquito, or human cases). Humancases occurred among persons in 17 counties, with 20 (42%)cases reported from Hinds county, located in the most populatedportion of the state. The attack rate for the state is 1.7per 100,000 population, <strong>and</strong> that for Hinds county is 8.0.Since May 1, 2002, MSDH has conducted active hospitalbasedsurveillance, <strong>and</strong> this activity was responsible for identifyingthe incident human case with an onset date of June24. Additional surveillance methods include dead bird reporting<strong>and</strong> testing, wild bird serosurveys, mosquito trapping <strong>and</strong>testing, <strong>and</strong> testing of sick equines. Testing of dead birds islimited to blue jays <strong>and</strong> crows; approximately 90% of theWNV-positive findings have been in blue jays. All mosquitopools that have tested positive for WNV were Culexquinquefasciatus.Few local areas in the state conduct any type of mosquitocontrol (i.e., surveillance, dipping, larvaciding, <strong>and</strong>adulticiding). To enhance mosquito-control activities inaffected areas, MSDH <strong>and</strong> the Mosquito <strong>and</strong> Vector ControlAssociation are sponsoring mosquito-control workshops forelected officials <strong>and</strong> public workers. The workshops areintended to provide training <strong>and</strong> technical assistance for publicofficials <strong>and</strong> workers responsible for mosquito control.In addition to intensified mosquito-control efforts, responseto the outbreak has included community awareness <strong>and</strong> education,including the launch of the Fight the Bite campaignto promote self-protection <strong>and</strong> source reduction; physicianeducation; <strong>and</strong> enhanced surveillance in areas with humancases. Veterinarians have been encouraged to submit specimensfrom clinically ill equines for free testing by MSDH.Additional information about MSDH WNV surveillance<strong>and</strong> prevention activities is available at http://www.msdh.state.ms.us. Additional information about WNVactivity is available at http://www.cdc.gov/ncidod/dvbid/westnile/index.htm <strong>and</strong> http://www.cindi.usgs.gov/hazard/event/west_nile/west_nile.html.Notice to ReadersRecall of LCx® Neisseria gonorrhoeaeAssay <strong>and</strong> Implications for LaboratoryTesting for N. gonorrhoeae<strong>and</strong> Chlamydia trachomatisOn July 18, 2002, Abbott Laboratories (Abbott Park, IL)initiated a voluntary recall of its LCx® Neisseria gonorrhoeaeAssay (List Numbers 8A48-81 <strong>and</strong> 8A48-82) because, during routinequality assurance testing, several reagent lots failed tomeet the analytical sensitivity described in the product insert.The cause of the failure is under investigation by the company.Abbott Laboratories has sent a letter to its customersinforming them of this recall <strong>and</strong> the specific reagent lotnumbers not meeting the analytical sensitivity.The possibility of false-negative results for specimens testedwith affected lots has prompted the following actions:1.As recommended by Abbott Laboratories, laboratoriesshould discontinue use of <strong>and</strong> discard any remainingLCx® N. gonorrhoeae assay reagents.2.Laboratories that have tested specimens using theaffected lots should notify their consumers (e.g., healthcare agencies <strong>and</strong> clinicians) about the increased risk fora false-negative result on such specimens. Notificationsshould be documented as required by the Clinical LaboratoryImprovement Amendments (CLIA) of 1988.3.For patients whose specimens were tested with theaffected lots, clinicians should offer retesting to patientswhose test results were negative <strong>and</strong> who were notpresumptively treated.Separate LCx® assays for the detection of Chlamydiatrachomatis <strong>and</strong> N. gonorrhoeae have been cleared by the Food<strong>and</strong> Drug Administration (FDA). Although the LCx®C. trachomatis Assay has not been recalled, public healthdepartments have reported delays in obtaining both assays.For laboratories unable to test specimens for C. trachomatis<strong>and</strong> N. gonorrhoeae because of the unavailability of LCx®assay reagents, several testing options are available:1.Testing with the LCx® assays can be delayed. Urine specimensor endocervical or urethral swab specimens collectedfor LCx® testing can be stored at -4 o F (-20 o C) for up to60 days before testing with the assay.2.For more timely patient management, the use of otherFDA-cleared tests should be considered. Urine specimensthat have not been processed for LCx® testing can betested by using another FDA-cleared nucleic acid amplificationtest. Only nucleic acid amplification tests are recommendedfor the direct detection of C. trachomatis orN. gonorrhoeae in urine. Swab specimens collected frompatients <strong>and</strong> placed in LCx® transport medium cannotbe tested by using another FDA-cleared test. Health-careproviders should consider recalling such patients to collecta new specimen for testing with another FDA-clearedtest. If this is done, the laboratory should be consultedabout procedures for proper swab collection. Laboratoriesalso could consider culture as an option to test forN. gonorrhoeae.3.In addition, laboratories may consider redirecting theirconsumers to other laboratories that can provide suchscreening services.
710 MMWR August 16, 2002Notice to ReadersFinal 2001 <strong>Report</strong>s of Notifiable DiseasesThe notifiable diseases tables on pages 723–730 summarizefinal data for 2001. Final as of June 21, 2002, these datawill be published in more detail in the Summary of NotifiableDiseases, United States, 2001 (1). Because no cases of westernequine encephalitis, paralytic poliomyelitis, or yellow feverwere reported in the United States during 2001, thesenationally notifiable diseases do not appear in these tables.Policies for reporting notifiable disease cases can vary by diseaseor reporting jurisdiction depending on case status classification(i.e., confirmed, probable, or suspected). Populationestimates for the states are from the Population Division, U.S.Bureau of the Census: 2001 Estimates of the Population,Popular Table (2). Population numbers for territories are 2001estimates from the U.S. Bureau of the Census IDB DataAccess Display Mode (3).References1. CDC. Summary of notifiable diseases, United States, 2001. MMWR2001;50(no. 53) (in press).2. U.S. Bureau of the Census. Population estimates, popular table. Availableat http://eire.census.gov/popest/data/states/populartables/table01.php3. U.S. Bureau of the Census. IDB Data Access—Display Mode. Availableat http://www.census.gov/ipc/www/idbprint.html.Notice to ReadersWorking with Communitiesfor Environmental Health SatelliteBroadcast <strong>and</strong> WebcastCDC <strong>and</strong> ATSDR will present “Working with Communitiesfor Environmental Health,” a live, interactive satellitebroadcast <strong>and</strong> webcast on September 12, 2002, from1:00–3:30 p.m. (EDT). Participants will learn ways toincrease their effectiveness when planning, implementing, <strong>and</strong>evaluating work with communities. The program will featurea question-<strong>and</strong>-answer session in which participants nationwidecan interact with the course instructors through toll-freetelephone lines. Registered participants will receive a freehealth-education planning kit after the program. The programis designed for health educators; public <strong>and</strong> environmentalhealth professionals; state, county, <strong>and</strong> local healthagency officials <strong>and</strong> staff; nurses <strong>and</strong> nurse practitioners;health-care providers; school health personnel <strong>and</strong> teachers;managed care group personnel; <strong>and</strong> personnel from academia.Additional information about program content, registration,course materials, continuing education credit, <strong>and</strong>accessing the live webcast is available at http://www.phppo.cdc.gov/phtn/envedu. Information about registrationis available from CDC, telephone 800-418-7246 or404-639-1292.Notice to ReadersEpidemiology in ActionCDC <strong>and</strong> Emory University’s Rollins School of PublicHealth will cosponsor a course, “Epidemiology in Action,”from November 12–22, 2002, at CDC <strong>and</strong> Emory Universitycampuses. The course is designed for state <strong>and</strong> local publichealth professionals.The course emphasizes the practical application of epidemiologyto public health problems <strong>and</strong> will consist of lectures,workshops, classroom exercises (including actualepidemiologic problems), <strong>and</strong> roundtable discussions. Topicscovered include descriptive epidemiology <strong>and</strong> biostatistics,analytic epidemiology, epidemic investigations, publichealth surveillance, surveys <strong>and</strong> sampling, Epi Info 2000(Windows ® version) training, <strong>and</strong> discussions of selectedprevalent diseases. There is a tuition charge.Deadline for application is October 1, 2002. Additionalinformation <strong>and</strong> applications are available from EmoryUniversity, International Health Dept. (PIA), 1518 CliftonRoad, N.E., Room 746, Atlanta, Georgia 30322; telephone(404) 727-3485; fax (404) 727-4590; or fromhttp://www.sph.emory.edu/EPICOURSES; or e-mailpvaleri@sph.emory.edu.
Vol. 51 / No. 32 MMWR 711Erratum: Vol. 51, No. RR-10In the MMWR Recommendations <strong>and</strong> <strong>Report</strong>s, “Guidelinesfor the Prevention of Intravascular Catheter-RelatedInfections,” published on August 9, 2002, on page 29 inAppendix B, an error occurred under the column heading“Replacement <strong>and</strong> relocation of device.” The corrected tableis as follows:Appendix BSummary of Recommended Frequency of Replacements for Catheters,Dressings, Administration Sets, <strong>and</strong> FluidsReplacement <strong>and</strong> Replacement of Replacement of Hang time forCatheter relocation of device catheter site dressing administration sets parenteral fluidsPeripheral venouscathetersIn adults, replace catheter<strong>and</strong> rotate site no morefrequently than every72–96 hours. Replacecatheters inserted underemergency basis <strong>and</strong> inserta new catheter at a differentsite within 48 hours. Inpediatric patients, do notreplace peripheral cathetersunless clinically indicated.Replace dressing when thecatheter is removed orreplaced, or when thedressing becomes damp,loosened, or soiled. Replacedressings more frequently indiaphoretic patients. Inpatients who have largebulky dressings that preventpalpation or directvisualization of the catheterinsertion site, remove thedressing <strong>and</strong> visually inspectthe catheter at least daily<strong>and</strong> apply a new dressing.Replace intravenous tubing,including add-on devices, no morefrequently than at 72-hour intervalsunless clinically indicated. Replacetubing used to administer blood,blood products, or lipid emulsionswithin 24 hours of initiating theinfusion.No recommendation for replacementof tubing used for intermittentinfusions. Consider short extensiontubing connected to the catheter tobe a portion of the device. Replacesuch extension tubing when thecatheter is changed.No recommendation for the hang timeof intravenous fluids, includingnonlipid-containing parenteral nutritionfluids. Complete infusion of lipidcontainingparenteral nutrition fluids(e.g., 3-in-1 solutions) within 24 hoursof hanging the fluid. Complete infusionof lipid emulsions alone within 12hours of hanging the fluid. Completeinfusions of blood products within 4hours of hanging the product.Midline cathetersNo recommendation for thefrequency of the catheterreplacement.As above.As above.As above.Peripheral arterialcathetersIn adults, do not replacecatheters routinely toprevent catheter-relatedinfection. In pediatricpatients, no recommendationfor the frequency ofcatheter replacement.Replace disposable orreusable transducers at 72-hour intervals. Replacecontinuous flush device atthe time the transducer isreplaced.Replace dressing when thecatheter is replaced, or whenthe dressing becomes damp,loosened, or soiled, or wheninspection of the site isnecessary.Replace the intravenous tubing at thetime the transducer is replaced (i.e.,72-hour intervals).Replace the flush solution at the timethe transducer is replaced (i.e., 72-hour intervals).Central venouscathetersincludingperipherallyinserted centralcatheters <strong>and</strong>hemodialysiscathetersDo not routinely replacecatheters.Replace gauze dressingsevery 2 days <strong>and</strong> transparentdressings every 7 dayson short-term catheters.Replace the dressing whenthe catheter is replaced, orwhen the dressing becomesdamp, loosened, or soiled, orwhen inspection of the site isnecessary.Replace intravenous tubing <strong>and</strong> addondevices no more frequently thanat 72-hour intervals. Replace tubingused to administer blood products orlipid emulsions within 24 hours ofinitiating the infusion.No recommendation for the hang timeof intravenous fluids, includingnonlipid-containing parenteral nutritionfluids. Complete infusions of lipidcontainingfluids within 24 hours ofhanging the fluid.Pulmonary arterycathetersDo not replace catheter toprevent catheter-relatedinfection.As above.As above.As above.UmbilicalcathetersDo not routinely replacecatheters.Not applicable.Replace intravenous tubing <strong>and</strong> addondevices no more frequently thanat 72-hour intervals. Replace tubingused to administer blood products orlipid emulsions within 24 hours ofinitiating the infusion.No recommendation for the hang timeof intravenous fluids, includingnonlipid-containing parenteral nutritionfluids. Complete infusion of lipidcontainingfluids within 24 hours ofhanging the fluid. Includes nontunneledcatheters, tunneled catheters, <strong>and</strong>totally implanted devices.
712 MMWR August 16, 2002
Vol. 51 / No. 32 MMWR 713FIGURE I. Selected notifiable disease reports, United States, comparison of provisional 4-week totals ending August 10, 2002,with historical dataDISEASE DECREASE INCREASEHepatitis A, AcuteHepatitis B, AcuteHepatitis C; Non-A, Non-B, AcuteLegionellosisMeasles, TotalMeningococcal InfectionsMumpsPertussisRubella*CASES CURRENT4 WEEKS3524311271074551056700.031250.06250.1250.250.5124Ratio (Log Scale) †Beyond Historical Limits* No rubella cases were reported for the current 4-week period yielding a ratio for week 32 of zero (0).† Ratio of current 4-week total to mean of 15 4-week totals (from previous, comparable, <strong>and</strong> subsequent 4-week periods for the past 5 years). The point where the hatched area beginsis based on the mean <strong>and</strong> two st<strong>and</strong>ard deviations of these 4-week totals.TABLE I. Summary of provisional cases of selected notifiable diseases, United States, cumulative, week ending August 10, 2002 (32nd Week)*Cum. Cum. Cum. Cum.2002 2001 2002 2001Anthrax 2 1 Encephalitis: West Nile † 48 4Botulism: foodborne 9 13 Hansen disease (leprosy) † 50 45infant 37 58 Hantavirus pulmonary syndrome † 9 5other (wound & unspecified) 9 10 Hemolytic uremic syndrome, postdiarrheal † 104 82Brucellosis † 45 78 HIV infection, pediatric †§ 116 107Chancroid 45 23 Plague - 2Cholera 6 3 Poliomyelitis, paralytic - -Cyclosporiasis † 107 73 Psittacosis † 14 9Diphtheria 1 1 Q fever † 23 16Ehrlichiosis: human granulocytic (HGE) † 174 126 Rabies, human 1 1human monocytic (HME) † 70 70 Streptococcal toxic-shock syndrome † 58 57other <strong>and</strong> unspecified 4 4 Tetanus 18 25Encephalitis: California serogroup viral † 23 19 Toxic-shock syndrome 72 79eastern equine † 2 2 Trichinosis 11 11Powassan † - - Tularemia † 40 78St. Louis † - 9 Yellow fever 1 -western equine † - --:No reported cases.* Incidence data for reporting year 2001 <strong>and</strong> 2002 are provisional <strong>and</strong> cumulative (year-to-date).†Not notifiable in all states.§Updated monthly from reports to the Division of HIV/AIDS Prevention — Surveillance <strong>and</strong> Epidemiology, National Center for HIV, STD, <strong>and</strong> TB Prevention(NCHSTP). Last update July 28, 2002.
714 MMWR August 16, 2002TABLE II. Provisional cases of selected notifiable diseases, United States, weeks ending August 10, 2002, <strong>and</strong> August 11, 2001(32nd Week)*Escherichia coliShiga Toxin Positive,AIDS Chlamydia † Cryptosporidiosis O157:H7 Serogroup non-O157Cum. Cum. Cum. Cum. Cum. Cum. Cum. Cum. Cum. Cum.<strong>Report</strong>ing Area 2002 § 2001 2002 2001 2002 2001 2002 2001 2002 2001UNITED STATES 24,713 23,760 446,688 464,685 1,262 1,693 1,432 1,505 64 66NEW ENGLAND 1,011 845 15,670 13,550 77 72 140 148 19 26Maine 23 22 946 723 3 7 19 17 2 -N.H. 20 16 988 832 16 3 15 20 - 3Vt. 8 10 509 367 17 20 4 10 - 1Mass. 519 479 6,277 5,343 22 31 65 74 6 7R.I. 71 61 1,685 1,734 13 3 5 6 - -Conn. 370 257 5,265 4,551 6 8 32 21 11 15MID. ATLANTIC 5,619 6,282 45,008 50,081 153 179 105 113 - -Upstate N.Y. 404 976 9,738 8,130 50 52 84 67 - -N.Y. City 3,210 3,338 17,252 18,597 68 73 6 11 - -N.J. 925 1,070 4,995 7,990 8 9 15 35 - -Pa. 1,080 898 13,023 15,364 27 45 N N - -E.N. CENTRAL 2,494 1,689 77,212 85,474 333 760 345 379 5 4Ohio 453 300 19,801 22,056 79 86 68 82 4 2Ind. 347 197 9,817 9,429 27 39 34 49 - -Ill. 1,170 776 18,911 25,986 43 291 92 106 - -Mich. 398 322 19,185 18,076 62 93 60 40 1 2Wis. 126 94 9,498 9,927 122 251 91 102 - -W.N. CENTRAL 421 504 25,141 23,479 150 165 231 207 7 6Minn. 90 92 5,691 4,796 68 76 82 78 5 4Iowa 54 54 2,765 2,791 16 38 55 35 - -Mo. 189 233 8,924 8,480 19 25 36 31 N NN. Dak. 1 1 607 618 6 7 3 9 - -S. Dak. 3 18 1,302 969 5 6 20 13 1 1Nebr. 43 51 1,857 2,123 26 13 16 26 1 1Kans. 41 55 3,995 3,702 10 - 19 15 - -S. ATLANTIC 7,537 7,131 86,149 90,371 187 205 134 119 19 16Del. 131 142 1,598 1,755 2 2 4 1 - -Md. 1,066 899 9,161 9,205 13 28 10 9 - -D.C. 371 507 2,054 2,019 4 9 - - - -Va. 538 593 9,894 11,790 7 15 28 32 2 2W. Va. 58 50 1,442 1,444 2 1 2 4 - -N.C. 555 494 15,018 13,684 23 19 23 27 - -S.C. 547 434 7,779 9,373 2 3 1 10 - -Ga. 1,160 852 15,586 18,915 87 86 44 20 9 7Fla. 3,111 3,160 23,617 22,186 47 42 22 16 8 7E.S. CENTRAL 1,128 1,075 29,972 30,470 83 28 57 76 - -Ky. 173 219 5,234 5,404 3 3 14 37 - -Tenn. 483 333 9,773 9,154 43 6 24 23 - -Ala. 197 260 8,506 8,412 33 10 13 10 - -Miss. 275 263 6,459 7,500 4 9 6 6 - -W.S. CENTRAL 2,696 2,406 65,637 65,870 18 50 19 130 - -Ark. 163 123 3,893 4,653 6 5 5 5 - -La. 693 548 11,641 10,941 4 7 1 5 - -Okla. 133 128 7,016 6,590 8 7 13 17 - -Tex. 1,707 1,607 43,087 43,686 - 31 - 103 - -MOUNTAIN 790 843 28,267 27,402 92 77 154 139 9 8Mont. 8 13 1,333 1,240 4 6 10 8 - -Idaho 18 16 1,512 1,138 18 8 12 18 2 2Wyo. 6 2 546 492 6 1 4 5 1 -Colo. 157 184 8,455 7,915 28 23 51 55 2 4N. Mex. 53 75 3,957 3,651 15 14 4 9 3 2Ariz. 327 336 8,789 8,946 12 4 18 16 1 -Utah 43 71 1,417 1,032 6 17 41 20 - -Nev. 178 146 2,258 2,988 3 4 14 8 - -PACIFIC 3,017 2,985 73,632 77,988 169 157 247 194 5 6Wash. 302 325 8,680 8,312 24 U 62 52 - -Oreg. 216 119 4,194 4,442 26 18 56 27 5 6Calif. 2,416 2,489 55,999 61,200 118 135 99 102 - -Alaska 17 14 2,155 1,672 - 1 5 3 - -Hawaii 66 38 2,604 2,362 1 3 25 10 - -Guam 2 8 - 253 - - N N - -P.R. 668 732 1,635 1,628 - - - 1 - -V.I. 66 2 98 113 - - - - - -Amer. Samoa U U U U U U U U U UC.N.M.I. 2 U 122 U - U - U - UN: Not notifiable. U: Unavailable. -: No reported cases. C.N.M.I.: Commonwealth of Northern Mariana Isl<strong>and</strong>s.* Incidence data for reporting year 2001 <strong>and</strong> 2002 are provisional <strong>and</strong> cumulative (year-to-date).†Chlamydia refers to genital infections caused by C. trachomatis.§Updated monthly from reports to the Division of HIV/AIDS Prevention — Surveillance <strong>and</strong> Epidemiology, National Center for HIV, STD, <strong>and</strong> TB Prevention. Last updateJuly 28, 2002.
Vol. 51 / No. 32 MMWR 715TABLE II. (Continued) Provisional cases of selected notifiable diseases, United States, weeks ending August 10, 2002, <strong>and</strong> August 11, 2001(32nd Week)*Haemophilus influenzae,InvasiveEscherichia coliAge
716 MMWR August 16, 2002TABLE II. (Continued) Provisional cases of selected notifiable diseases, United States, weeks ending August 10, 2002, <strong>and</strong> August 11, 2001(32nd Week)*Haemophilus influenzae, InvasiveAge
Vol. 51 / No. 32 MMWR 717TABLE II. (Continued) Provisional cases of selected notifiable diseases, United States, weeks ending August 10, 2002, <strong>and</strong> August 11, 2001(32nd Week)*MeaslesLegionellosis Listeriosis Lyme Disease Malaria TotalCum. Cum. Cum. Cum. Cum. Cum. Cum. Cum. Cum. Cum.<strong>Report</strong>ing Area 2002 2001 2002 2001 2002 2001 2002 2001 2002 2001UNITED STATES 528 585 257 340 5,798 8,472 714 870 15 † 91§NEW ENGLAND 48 32 33 32 931 2,531 38 53 - 5Maine 2 3 2 - 53 - 2 3 - -N.H. 4 6 2 2 100 42 6 2 - -Vt. 18 4 2 2 13 5 1 - - 1Mass. 16 9 18 16 456 839 15 26 - 3R.I. 1 2 1 1 113 197 3 3 - -Conn. 7 8 8 11 196 1,448 11 19 - 1MID. ATLANTIC 123 131 45 58 3,937 4,415 155 242 5 17Upstate N.Y. 41 33 22 17 2,335 1,455 26 36 - 4N.Y. City 22 22 11 14 78 53 91 141 5 6N.J. 12 11 3 11 326 1,615 20 39 - 1Pa. 48 65 9 16 1,198 1,292 18 26 - 6E.N. CENTRAL 131 155 34 52 48 555 85 112 2 10Ohio 64 71 13 10 40 15 14 18 1 3Ind. 12 12 6 4 8 13 6 13 1 4Ill. - 19 1 20 - 28 21 50 - 3Mich. 37 28 11 15 - 5 34 19 - -Wis. 18 25 3 3 U 494 10 12 - -W.N. CENTRAL 27 37 8 8 137 174 46 27 1 4Minn. 2 9 - - 88 126 16 6 - 2Iowa 6 6 1 - 20 20 2 4 - -Mo. 10 13 5 5 24 22 13 10 1 2N. Dak. - 1 1 - - - 1 - - -S. Dak. 2 3 - - - - - - - -Nebr. 7 4 - 1 1 4 5 2 - -Kans. - 1 1 2 4 2 9 5 - -S. ATLANTIC 106 100 45 37 627 631 214 181 1 5Del. 6 3 - 2 68 95 2 1 - -Md. 18 24 9 5 374 396 66 75 - 3D.C. 5 7 - - 15 7 14 11 - -Va. 10 17 3 8 51 92 17 36 - 1W. Va. N N - 4 8 9 3 1 - -N.C. 7 5 4 2 63 24 12 9 - -S.C. 5 5 6 3 9 2 5 5 - -Ga. 10 9 10 7 1 - 59 29 - 1Fla. 45 30 13 6 38 6 36 14 1 -E.S. CENTRAL 19 42 8 11 30 33 10 21 - 2Ky. 9 9 2 4 13 13 3 7 - 2Tenn. 4 20 3 3 10 9 2 8 - -Ala. 6 9 3 4 7 6 3 3 - -Miss. - 4 - - - 5 2 3 - -W.S. CENTRAL 4 17 5 28 4 62 8 61 1 1Ark. - - - 1 2 - 1 3 - -La. 1 6 - - 1 4 3 4 - -Okla. 3 3 5 2 - - 4 2 - -Tex. - 8 - 25 1 58 - 52 1 1MOUNTAIN 25 32 20 27 13 6 33 35 1 1Mont. 3 - - - - - 1 2 - -Idaho - 2 2 1 2 3 - 3 - 1Wyo. 1 2 - 1 - 1 - - - -Colo. 4 11 3 6 3 - 18 19 - -N. Mex. 1 2 2 6 1 - 2 3 - -Ariz. 7 8 9 6 2 - 5 3 - -Utah 8 4 3 1 4 - 4 2 - -Nev. 1 3 1 6 1 2 3 3 1 -PACIFIC 45 39 59 87 71 65 125 138 4 46Wash. 3 6 5 5 3 3 12 4 - 15Oreg. N N 5 5 11 7 7 10 - 2Calif. 42 28 44 73 56 53 98 115 3 22Alaska - 1 - - 1 2 2 1 - -Hawaii - 4 5 4 N N 6 8 1 7Guam - - - - - - - - - -P.R. - 2 1 - N N - 3 - -V.I. - - - - - - - - - -Amer. Samoa U U U U U U U U U UC.N.M.I. - U - U - U - U - UN: Not notifiable. U: Unavailable. -: No reported cases.* Incidence data for reporting year 2001 <strong>and</strong> 2002 are provisional <strong>and</strong> cumulative (year-to-date).†Of 15 cases reported, six were indigenous <strong>and</strong> nine were imported from another country.§Of 91 cases reported, 42 were indigenous <strong>and</strong> 49 were imported from another country.
718 MMWR August 16, 2002TABLE II. (Continued) Provisional cases of selected notifiable diseases, United States, weeks ending August 10, 2002, <strong>and</strong> August 11, 2001(32nd Week)*MeningococcalDisease Mumps Pertussis Rabies, AnimalCum. Cum. Cum. Cum. Cum. Cum. Cum. Cum.<strong>Report</strong>ing Area 2002 2001 2002 2001 2002 2001 2002 2001UNITED STATES 1,028 1,616 169 151 4,062 3,089 3,452 4,261NEW ENGLAND 70 75 7 - 367 279 498 406Maine 7 1 - - 5 - 30 42N.H. 9 9 4 - 8 14 11 6Vt. 4 5 - - 75 25 72 38Mass. 32 44 2 - 264 223 169 150R.I. 5 2 - - 9 2 36 37Conn. 13 14 1 - 6 15 180 133MID. ATLANTIC 109 175 15 18 169 219 648 742Upstate N.Y. 33 47 2 3 121 107 393 467N.Y. City 14 28 1 11 8 35 10 19N.J. 22 30 1 - 3 8 97 115Pa. 40 70 11 4 37 69 148 141E.N. CENTRAL 150 238 17 19 511 427 57 69Ohio 57 64 2 1 261 190 16 20Ind. 23 28 2 1 40 37 16 1Ill. 30 59 6 14 83 45 8 10Mich. 28 53 6 2 35 40 17 29Wis. 12 34 1 1 92 115 - 9W.N. CENTRAL 92 103 12 6 378 135 245 220Minn. 22 15 3 2 141 31 21 23Iowa 12 21 1 - 116 16 43 47Mo. 35 39 3 - 77 66 25 22N. Dak. - 5 1 - - - 11 24S. Dak. 2 4 - - 5 3 41 32Nebr. 16 10 - 1 3 4 - 4Kans. 5 9 4 3 36 15 104 68S. ATLANTIC 183 245 20 22 240 151 1,497 1,474Del. 6 3 - - 2 - 24 29Md. 5 34 5 4 33 22 168 293D.C. - - - - 1 1 - -Va. 28 30 3 5 94 26 298 265W. Va. 2 10 - - 17 1 114 83N.C. 20 57 1 1 24 46 423 359S.C. 17 26 2 2 28 23 70 76Ga. 29 36 4 7 17 17 237 252Fla. 76 49 5 3 24 15 163 117E.S. CENTRAL 65 106 12 4 136 75 108 157Ky. 11 19 4 1 55 17 17 16Tenn. 26 44 2 - 50 31 59 106Ala. 17 29 3 - 24 24 32 35Miss. 11 14 3 3 7 3 - -W.S. CENTRAL 60 248 11 9 1,078 294 76 785Ark. 20 14 - - 388 12 - -La. 23 61 1 2 4 5 - 6Okla. 16 23 - - 65 12 76 47Tex. 1 150 10 7 621 265 - 732MOUNTAIN 68 73 13 11 544 974 161 168Mont. 2 3 - 1 4 20 8 22Idaho 3 7 1 - 46 165 16 10Wyo. - 4 - 1 9 - 14 20Colo. 22 28 2 3 210 202 26 -N. Mex. 3 9 1 2 115 65 4 9Ariz. 20 11 1 1 95 461 87 103Utah 4 7 5 1 35 50 3 3Nev. 14 4 3 2 30 11 3 1PACIFIC 231 353 62 62 639 535 162 240Wash. 46 51 - 1 284 88 - -Oreg. 34 45 N N 127 37 3 -Calif. 144 246 50 29 213 379 135 202Alaska 1 2 - 1 4 3 24 38Hawaii 6 9 12 31 11 28 - -Guam - - - - - - - -P.R. 3 4 - - 1 - 49 65V.I. - - - - - - - -Amer. Samoa U U U U U U U UC.N.M.I. - U - U 1 U - UN: Not notifiable. U: Unavailable. - : No reported cases.* Incidence data for reporting year 2001 <strong>and</strong> 2002 are provisional <strong>and</strong> cumulative (year-to-date).
Vol. 51 / No. 32 MMWR 719TABLE II. (Continued) Provisional cases of selected notifiable diseases, United States, weeks ending August 10, 2002, <strong>and</strong> August 11, 2001(32nd Week)*RubellaRocky MountainCongenitalSpotted Fever Rubella Rubella SalmonellosisCum. Cum. Cum. Cum. Cum. Cum. Cum. Cum.<strong>Report</strong>ing Area 2002 2001 2002 2001 2002 2001 2002 2001UNITED STATES 502 315 8 16 2 - 19,234 21,377NEW ENGLAND - 2 - - - - 1,151 1,468Maine - - - - - - 87 123N.H. - - - - - - 72 121Vt. - - - - - - 42 44Mass. - 2 - - - - 641 849R.I. - - - - - - 76 64Conn. - - - - - - 233 267MID. ATLANTIC 29 14 4 7 - - 2,439 2,891Upstate N.Y. 7 - 2 1 - - 797 671N.Y. City 4 1 - 5 - - 730 749N.J. 8 3 2 1 - - 341 710Pa. 10 10 - - - - 571 761E.N. CENTRAL 14 14 - 2 - - 3,057 3,007Ohio 10 1 - - - - 807 821Ind. 2 1 - - - - 282 297Ill. - 12 - 2 - - 910 862Mich. 2 - - - - - 554 535Wis. - - - - - - 504 492W.N. CENTRAL 70 47 - 3 - - 1,403 1,223Minn. - - - - - - 341 375Iowa 1 2 - 1 - - 236 187Mo. 64 43 - 1 - - 507 309N. Dak. - - - - - - 25 17S. Dak. - 2 - - - - 46 80Nebr. 4 - - - - - 70 92Kans. 1 - - 1 - - 178 163S. ATLANTIC 258 145 - 3 - - 4,872 4,755Del. 2 - - - - - 39 51Md. 36 29 - - - - 516 459D.C. - - - - - - 48 48Va. 17 15 - - - - 556 837W. Va. 1 - - - - - 67 73N.C. 142 74 - - - - 670 627S.C. 36 16 - 2 - - 292 448Ga. 18 8 - - - - 983 889Fla. 6 3 - 1 - - 1,701 1,323E.S. CENTRAL 48 64 - - 1 - 1,370 1,243Ky. 3 2 - - - - 191 199Tenn. 34 44 - - 1 - 379 314Ala. 11 10 - - - - 415 356Miss. - 8 - - - - 385 374W.S. CENTRAL 70 21 1 - - - 879 2,552Ark. 21 4 - - - - 437 355La. - 2 - - - - 183 454Okla. 49 15 - - - - 257 215Tex. - - 1 - - - 2 1,528MOUNTAIN 10 8 - - - - 1,219 1,250Mont. 1 1 - - - - 60 45Idaho - 1 - - - - 76 80Wyo. 3 2 - - - - 36 43Colo. 1 - - - - - 297 353N. Mex. - 1 - - - - 168 148Ariz. - - - - - - 348 336Utah - 3 - - - - 113 129Nev. 5 - - - - - 121 116PACIFIC 3 - 3 1 1 - 2,844 2,988Wash. - - - - - - 271 294Oreg. 1 - - - - - 228 181Calif. 2 - 3 - - - 2,138 2,272Alaska - - - - - - 41 27Hawaii - - - 1 1 - 166 214Guam - - - - - - - 18P.R. - - - 3 - - 120 557V.I. - - - - - - - -Amer. Samoa U U U U U U U UC.N.M.I. - U - U - U 23 UN: Not notifiable. U: Unavailable. - : No reported cases.* Incidence data for reporting year 2001 <strong>and</strong> 2002 are provisional <strong>and</strong> cumulative (year-to-date).
720 MMWR August 16, 2002TABLE II. (Continued) Provisional cases of selected notifiable diseases, United States, weeks ending August 10, 2002, <strong>and</strong> August 11, 2001(32nd Week)*Streptococcal Disease, Streptococcus pneumoniae, Streptococcus pneumoniae,Shigellosis Invasive, Group A Drug Resistant, Invasive Invasive (
Vol. 51 / No. 32 MMWR 721TABLE II. (Continued) Provisional cases of selected notifiable diseases, United States, weeks ending August 10, 2002, <strong>and</strong> August 11, 2001(32nd Week)*SyphilisTyphoidPrimary & Secondary Congenital Tuberculosis FeverCum. Cum. Cum. Cum. Cum. Cum. Cum. Cum.<strong>Report</strong>ing Area 2002 2001 2002 2001 2002 2001 2002 2001UNITED STATES 3,707 3,515 193 319 6,920 8,214 146 198NEW ENGLAND 79 31 - 3 231 291 10 10Maine - - - - 10 12 - 1N.H. 3 1 - - 8 11 - 1Vt. 1 2 - - - 4 - -Mass. 57 16 - 2 126 148 8 7R.I. 3 4 - - 23 39 - -Conn. 15 8 - 1 64 77 2 1MID. ATLANTIC 422 302 35 49 1,243 1,371 40 66Upstate N.Y. 20 13 4 2 177 211 5 14N.Y. City 254 167 15 26 641 683 20 25N.J. 77 64 15 21 303 313 12 23Pa. 71 58 1 - 122 164 3 4E.N. CENTRAL 617 610 26 47 716 839 14 25Ohio 88 56 - 2 118 166 5 3Ind. 45 103 - 7 60 63 2 2Ill. 163 196 20 30 353 405 1 12Mich. 309 238 6 5 144 162 3 5Wis. 12 17 - 3 41 43 3 3W.N. CENTRAL 55 57 - 7 324 321 6 8Minn. 21 24 - 2 138 139 3 4Iowa 2 4 - - 17 18 - -Mo. 14 11 - 4 91 83 1 4N. Dak. - - - - 1 3 - -S. Dak. - - - - 9 8 - -Nebr. 4 2 - - 9 21 2 -Kans. 14 16 - 1 59 49 - -S. ATLANTIC 987 1,243 44 78 1,405 1,532 23 26Del. 9 10 - - 13 9 - -Md. 118 160 8 3 160 130 5 8D.C. 53 18 1 2 - 47 - -Va. 45 67 1 4 116 154 1 8W. Va. 2 - - - 18 19 - -N.C. 180 288 15 8 196 202 1 2S.C. 76 165 5 18 116 124 - -Ga. 184 215 1 17 201 276 8 6Fla. 320 320 13 26 585 571 8 2E.S. CENTRAL 321 373 13 24 429 503 4 -Ky. 61 28 2 - 77 77 4 -Tenn. 121 208 3 14 168 181 - -Ala. 105 66 6 4 128 160 - -Miss. 34 71 2 6 56 85 - -W.S. CENTRAL 510 422 43 50 940 1,280 - 12Ark. 16 25 1 5 73 91 - -La. 88 86 - - - 78 - -Okla. 40 41 2 4 84 89 - -Tex. 366 270 40 41 783 1,022 - 12MOUNTAIN 166 128 10 20 208 318 10 6Mont. - - - - 6 - - 1Idaho 1 - 1 - 8 7 - -Wyo. - - - - 2 2 - -Colo. 24 15 1 1 28 78 5 -N. Mex. 20 11 - 2 21 39 - -Ariz. 112 92 8 17 113 121 - 1Utah 4 7 - - 17 19 3 -Nev. 5 3 - - 13 52 2 4PACIFIC 550 349 22 41 1,424 1,759 39 45Wash. 32 34 1 - 150 153 4 3Oreg. 10 7 1 - 56 64 2 3Calif. 501 301 19 41 1,094 1,425 32 36Alaska - - - - 33 27 - 1Hawaii 7 7 1 - 91 90 1 2Guam - 2 - 1 - 42 - 2P.R. 139 166 10 3 33 53 - -V.I. 1 - - - - - - -Amer. Samoa U U U U U U U UC.N.M.I. 13 U - U 27 U - UN: Not notifiable. U: Unavailable. - : No reported cases.* Incidence data for reporting year 2001 <strong>and</strong> 2002 are provisional <strong>and</strong> cumulative (year-to-date).
722 MMWR August 16, 2002TABLE III. Deaths in 122 U.S. cities,* week ending August 10, 2002 (32nd Week)All Causes, By Age (Years)All Causes, By Age (Years)All P&I † All P&I †<strong>Report</strong>ing Area Ages >65 45-64 25-44 1-24 65 45-64 25-44 1-24 100,000. A death is reported by the place of itsoccurrence <strong>and</strong> by the week that the death certificate was filed. Fetal deaths are not included.†Pneumonia <strong>and</strong> influenza.§Because of changes in reporting methods in this Pennsylvania city, these numbers are partial counts for the current week. Complete counts will be available in 4 to 6 weeks.Total includes unknown ages.
Vol. 51 / No. 32 MMWR 723TABLE. <strong>Report</strong>ed cases of notifiable diseases, by geographic division <strong>and</strong> area — United States, 2001Total residentpopulationBotulism<strong>Report</strong>ing area (in thous<strong>and</strong>s) AIDS* Anthrax Foodborne Infant Other † Brucellosis Chancroid §United States 284,796 41,868 22 39 97 19 136 38New Engl<strong>and</strong> 14,022 1,565 1 — — — — 2Maine 1,287 48 — — — — — —N.H. 1,259 40 — — — — — —Vt. 613 25 — — — — — —Mass. 6,379 765 — — — — — 2R.I. 1,059 103 — — — — — —Conn. 3,425 584 1 — — — — —Mid. Atlantic 39,783 11,072 13 1 23 — 4 7Upstate N.Y. 11,312 1,492 — — 2 — 1 —N.Y. City 7,700 5,984 7 — 4 — 1 3N.J. 8,484 1,756 5 — 6 — 1 4Pa. 12,287 1,840 1 1 11 — 1 —E.N. Central 45,364 3,023 — — 3 — 7 —Ohio 11,374 581 — — 3 — — —Ind. 6,115 378 — — — — — —Ill. 12,482 1,323 — — — — 4 —Mich. 9,991 548 — — — — 3 —Wis. 5,402 193 — — — — — —W.N. Central 19,324 892 — — 2 — 7 —Minn. 4,972 157 — — 2 — 2 —Iowa 2,923 90 — — — — 2 —Mo. 5,630 445 — — — — 1 —N. Dak. 634 3 — — — — — —S. Dak. 757 25 — — — — — —Nebr. 1,713 74 — — — — 1 —Kans. 2,695 98 — — — — 1 —S. Atlantic 52,763 12,583 7 — 12 — 9 20Del. 796 248 — — 1 — 1 —Md. 5,375 1,860 3 — 5 — — —D.C. 572 870 — — — — — —Va. 7,188 951 2 — 4 — 1 —W. Va. 1,802 100 — — 1 — — —N.C. 8,186 942 — — — — 2 3S.C. 4,063 729 — — — — — 15Ga. 8,384 1,745 — — 1 — 1 —Fla. 16,397 5,138 2 — — — 4 2E.S. Central 17,128 1,791 — — 9 — 3 —Ky. 4,066 333 — — 5 — 1 —Tenn. 5,740 602 — — 4 — 1 —Ala. 4,464 438 — — — — 1 —Miss. 2,858 418 — — — — — —W.S. Central 31,942 4,195 1 17 5 — 52 6Ark. 2,692 199 — 1 — — 9 —La. 4,465 861 — 1 — — 2 —Okla. 3,460 243 — — 1 — — —Tex. 21,325 2,892 1 15 4 — 41 6Mountain 18,649 1,386 — 1 9 — 10 1Mont. 904 15 — — 1 — — —Idaho 1,321 19 — — — — — —Wyo. 494 5 — — — — — —Colo. 4,418 288 — — — — 2 —N. Mex. 1,829 143 — — 1 — 1 —Ariz. 5,307 540 — 1 2 — 6 —Utah 2,270 124 — — 4 — 1 1Nev. 2,106 252 — — 1 — — —Pacific 45,821 5,248 — 20 34 19 44 2Wash. 5,988 532 — 7 — — — —Oreg. 3,473 259 — — 2 1 — —Calif. 34,501 4,315 — 3 30 18 41 2Alaska 635 18 — 10 — — — —Hawaii 1,224 124 — — 2 — 3 —Guam 158 12 — — — — 1 —P.R. 3,937 1242 — — — — — 4V.I. 122 35 NA NA NA NA NA —American Samoa 67 1 — — — — — —C.N.M.I. 75 — — 3 — — — —NA: Not available NN: Not notifiable —: No reported cases* Totals reported to the Division of HIV/AIDS Prevention — Surveillance <strong>and</strong> Epidemiology, National Center for HIV, STD, <strong>and</strong> TB Prevention (NCHSTP), through December 31, 2001.† Includes cases reported as wound <strong>and</strong> unspecified.§ Totals reported to the Division of Sexually Transmitted Diseases Prevention, NCHSTP, as of May 3, 2002. Total includes 113 cases in persons with unknown state of residence.
724 MMWR August 16, 2002TABLE. (Continued) <strong>Report</strong>ed cases of notifiable diseases, by geographic division <strong>and</strong> area — United States, 2001<strong>Report</strong>ing area Chlamydia* Cholera Coccidioidomycosis Cryptosporidiosis Cyclosporiasis DiphtheriaUnited States 783,242 5 3,922 3,785 147 2New Engl<strong>and</strong> 24,391 1 3 152 20 —Maine 1,338 — NN 19 — —N.H. 1,383 1 3 17 — —Vt. 638 — NN 34 NN —Mass. 10,402 — NN 55 16 —R.I. 2,912 — NN 10 NN —Conn. 7,718 — NN 17 4 —Mid. Atlantic 91,076 2 — 374 36 —Upstate N.Y. 16,744 1 NN 125 5 —N.Y. City 29,649 1 NN 123 20 —N.J. 16,312 — NN 24 3 —Pa. 28,371 — NN 102 8 —E.N. Central 144,001 — 8 1,607 5 1Ohio 37,653 — NN 183 — —Ind. 15,258 — NN 90 — —Ill. 43,716 — NN 483 2 —Mich. 31,090 — 8 187 3 1Wis. 16,284 — NN 664 — —W.N. Central 40,110 1 5 546 1 —Minn. 8,323 — NN 197 — —Iowa 5,699 1 NN 82 1 —Mo. 13,949 — NN 55 — —N. Dak. 1,062 — NN 15 NN —S. Dak. 1,821 — NN 8 — —Nebr. 3,206 — 5 185 — —Kans. 6,050 — NN 4 NN —S. Atlantic 151,297 — — 380 79 —Del. 2,793 — NN 6 — —Md. 15,640 — NN 40 NN —D.C. 3,286 — — 14 1 —Va. 18,337 — NN 27 1 —W. Va. 2,346 — NN 2 — —N.C. 22,101 — NN 31 — —S.C. 15,329 — NN 7 — —Ga. 33,840 — NN 162 29 —Fla. 37,625 — NN 91 48 —E.S. Central 50,758 — — 62 — —Ky. 8,881 — NN 5 NN —Tenn. 15,560 — — 24 — —Ala. 14,524 — NN 18 NN —Miss. 11,793 — NN 15 — —W.S. Central 105,350 — — 130 — —Ark. 7,280 — NN 10 NN —La. 17,840 — NN 8 — —Okla. 10,478 — NN 16 — —Tex. 69,752 — NN 96 — —Mountain 46,455 — 2,368 243 6 1Mont. 1,919 — NN 37 — 1Idaho 2,023 — — 23 NN —Wyo. 839 — 4 7 — —Colo. 13,239 — NN 44 5 —N. Mex. 6,254 — 14 30 1 —Ariz. 14,346 — 2,301 11 NN —Utah 3,004 — 11 84 — —Nev. 4,831 — 38 7 — —Pacific 129,804 1 1,538 291 — —Wash. 13,631 — NN — — —Oreg. 7,454 — NN 58 — —Calif. 101,944 — 1,538 229 NN —Alaska 2,744 1 NN 1 — —Hawaii 4,031 — NN 3 — —Guam 431 — — — — —P.R. 2748 — NN — — —V.I. 131 NA NA NA NA NAAmerican Samoa NA — — — — —C.N.M.I. NA 1 — — — —NA: Not available NN: Not notifiable —: No reported cases* Totals reported to the Division of Sexually Transmitted Diseases Prevention, NCHSTP, as of May 3, 2002. Chlamydia refers to genital infections caused by Chlamydia trachomatis.
Vol. 51 / No. 32 MMWR 725TABLE. (Continued) <strong>Report</strong>ed cases of notifiable diseases, by geographic division <strong>and</strong> area — United States, 2001Escherichia coliEncephalitis*Shiga toxinEhrlichoiosis California positive, Shiga toxinHuman Human serogroup Eastern serogroup positive, not<strong>Report</strong>ing area granulocytic monocytic viral equine St. Louis O157:H7 non-O157 serogroupedUnited States 261 142 128 9 79 3,287 170 20New Engl<strong>and</strong> 62 4 1 1 — 250 43 1Maine 1 — — — — 29 2 —N.H. — — — — — 36 3 —Vt. — — — — — 15 1 1Mass. 2 4 — 1 — 115 10 —R.I. 17 — — — — 17 1 —Conn. 42 — 1 — — 38 26 —Mid. Atlantic 85 27 — — — 251 — 3Upstate N.Y. 73 18 — — — 161 — —N.Y. City 6 4 — — — 16 — —N.J. 6 5 — — — 74 — —Pa. — — — — — NN — 3E.N. Central 2 4 31 1 — 813 12 7Ohio 1 — 14 — — 224 10 7Ind. — 1 5 — — 90 — —Ill. 1 3 5 — — 174 — —Mich. — — — 1 — 102 2 —Wis. — — 7 — — 223 — —W.N. Central 102 34 14 — — 523 46 4Minn. 93 3 12 — — 219 36 —Iowa — — 2 — — 79 — —Mo. 8 27 — — — 66 — —N. Dak NN NN — — — 27 3 4S. Dak. — — — — — 44 6 —Nebr. — — — — — 60 1 —Kans. 1 4 — — — 28 — —S. Atlantic — 24 56 5 — 269 40 —Del. — — — — — 4 1 —Md NN NN 1 — — 29 — —D.C. — — — — — — — —Va. — 1 2 — — 52 9 —W. Va. — — 44 — — 11 — —N.C. — 11 9 — — 59 — —S.C. — — — — — 24 — —Ga. — 4 — 2 — 45 10 —Fla. — 8 — 3 — 45 20 —E.S. Central — 24 26 — — 144 1 3Ky. — 2 — — — 65 1 3Tenn. — 22 17 — — 49 — —Ala. — — 1 — — 18 — —Miss NN NN 8 — — 12 — —W.S. Central 8 24 — 2 78 222 — —Ark. 8 — — — 2 17 — —La NN NN — 1 71 8 — —Okla. — 24 — — — 36 — —Tex. — — — 1 5 161 — —Mountain — 1 — — 1 301 22 2Mont NN NN — — — 23 — —Idaho NN — — — 81 5 — —Wyo. — — — — — 10 3 —Colo NN NN — — — 87 8 2N. Mex NN NN — — — 17 6 —Ariz. — 1 — — 1 30 — —Utah — — — — — 35 — —Nev. — — — — — 18 — —Pacific 2 — — — — 514 6 —Wash. — — NN NN — 150 — —Oreg. 1 — — — — 86 6 —Calif. 1 — — — — 253 — —Alaska NN NN — — — 4 — —Hawaii — — — — — 21 — —Guam — — — — — 1 — —P.R. — — — — — 2 — —V.I. NA NA NA NA NA NA NA NAAmerican Samoa — — — — — — — —C.N.M.I. — — — — — — — —NA: Not available NN: Not notifiable —: No reported cases* No cases of Western equine encephalitis were reported in 2001.
726 MMWR August 16, 2002TABLE. (Continued) <strong>Report</strong>ed cases of notifiable diseases, by geographic division <strong>and</strong> area — United States, 2001HaemophilusHemolyticinfluenzae, Hansen Hantavirus uremic Hepatitis, acuteinvasive disease pulmonary syndrome, C; non-A,<strong>Report</strong>ing area Gonorrhea* disease (leprosy) syndrome postdiarrheal A B non-BUnited States 361,705 1,597 78 8 202 10,609 7,843 3,976New Engl<strong>and</strong> 6,983 121 1 — 18 736 149 34Maine 141 2 — — 1 11 7 1N.H. 176 7 — — — 18 16 —Vt. 76 5 NN — — 16 5 7Mass. 3,214 43 1 — 13 376 41 26R.I. 830 10 — — 1 75 33 —Conn. 2,546 54 — — 3 240 47 —Mid. Atlantic 45,464 248 17 — 27 1,370 1,426 1,397Upstate N.Y. 9,685 98 1 — 16 333 153 36N.Y. City 12,614 59 15 — 2 447 660 —N.J. 8,921 48 1 — 5 283 286 1,218Pa. 14,244 43 — — 4 307 327 143E.N. Central 75,291 285 3 — 23 1,214 1,049 161Ohio 21,163 74 1 — 12 258 92 9Ind. 6,972 59 — — — 102 75 1Ill. 24,025 103 1 — 3 441 218 12Mich. 17,120 14 1 — — 326 618 139Wis. 6,011 35 — — 8 87 46 —W.N. Central 17,045 89 2 — 12 395 250 1,170Minn. 2,701 56 1 — 9 47 44 33Iowa 1,418 — — — — 36 24 —Mo. 8,723 20 1 — 2 88 130 1,119N. Dak. 56 8 NN — 1 3 2 —S. Dak. 289 — — — — 3 1 —Nebr. 1,189 3 — NN NN 37 35 10Kans. 2,669 2 — — — 181 14 8S. Atlantic 93,709 394 2 — 13 2,693 1,666 144Del. 1,733 — — — — 16 29 11Md. 9,427 92 — NN NN 296 141 9D.C. 2,883 — — — — 80 13 —Va. 11,095 34 1 — — 167 213 3W. Va. 732 16 — — — 29 35 26N.C. 16,583 50 NN NN 2 242 221 22S.C. 10,805 8 — — — 85 72 13Ga. 18,920 109 NN — 6 930 435 —Fla. 21,531 85 1 — 5 848 507 60E.S. Central 32,674 84 2 — 10 453 520 198Ky. 3,588 2 — — NN 145 64 13Tenn. 10,145 51 2 — 10 189 275 70Ala. 11,182 29 — NN — 81 88 5Miss. 7,759 2 — NN — 38 93 110W.S. Central 51,665 64 2 1 18 825 1,061 671Ark. 4,604 3 — — 1 74 107 15La. 12,253 10 1 — — 87 124 151Okla. 4,784 48 1 1 5 116 116 6Tex. 30,024 3 — — 12 548 714 499Mountain 10,382 175 4 6 27 753 497 58Mont. 104 1 — — — 16 3 1Idaho 76 2 1 2 NN 57 11 2Wyo. 77 1 — — — 7 3 8Colo. 3,190 38 NN — 11 88 103 11N. Mex. 1,040 29 — 2 — 40 136 12Ariz. 3,920 82 1 1 NN 409 164 9Utah 219 10 1 1 13 66 25 3Nev. 1,756 12 1 — 3 70 52 12Pacific 28,492 137 45 1 54 2,170 1,225 143Wash. 2,991 9 NN 1 — 184 171 31Oreg. 1,144 39 — — 11 105 168 15Calif. 23,296 60 21 — 43 1,848 854 97Alaska 457 6 — — — 16 10 —Hawaii 604 23 24 — — 17 22 —Guam 48 — — — — 2 — —P.R. 589 2 1 NN NN 258 297 1V.I. 34 NA NA NA NA NA NA NAAmerican Samoa — — 1 — — 2 — —C.N.M.I. — — — — — — 38 —NA: Not available NN: Not notifiable —: No reported cases* Totals reported to the Division of Sexually Transmitted Diseases Prevention, NCHSTP, as of May 3, 2002.
Vol. 51 / No. 32 MMWR 727TABLE. (Continued) <strong>Report</strong>ed cases of notifiable diseases, by geographic division <strong>and</strong> area — United States, 2001MeaslesMeningococcal<strong>Report</strong>ing area Legionellosis Listeriosis Lyme disease Malaria Indigenous Imported* diseaseUnited States 1,168 612 17,027 1,544 62 54 2,326New Engl<strong>and</strong> 74 57 5,526 107 4 1 113Maine 8 2 108 5 — — 8N.H. 12 4 129 2 — — 14Vt. 5 3 18 1 1 — 7Mass. 21 30 1,164 53 2 1 57R.I. 13 3 510 16 — — 7Conn. 15 15 3,597 30 1 — 20Mid. Atlantic 285 119 8,907 440 7 13 256Upstate N.Y. 82 36 4,020 76 — 4 72N.Y. City 43 26 63 250 3 4 42N.J. 24 20 2,020 65 — 1 43Pa. 136 37 2,804 49 4 4 99E.N. Central 316 88 720 177 — 10 359Ohio 143 17 44 27 — 3 89Ind. 23 8 26 19 — 4 47Ill. 24 24 32 71 — 3 88Mich. 82 25 21 40 — — 83Wis. 44 14 597 20 — — 52W.N. Central 55 22 540 77 2 4 173Minn. 15 4 461 45 2 2 29Iowa 8 2 36 9 — — 31Mo. 22 10 37 15 — 2 58N. Dak. 1 — — — — — 8S. Dak. 3 — — — — — 5Nebr. 5 1 4 2 — — 27Kans. 1 5 2 6 — — 15S. Atlantic 223 77 1,039 317 3 2 383Del. 12 NN 152 2 — — 6Md. 32 16 608 112 2 1 42D.C. 8 — 17 13 — — —Va. 39 15 156 55 1 — 46W. Va NN 6 16 1 — — 15N.C. 11 NA 41 19 — — 63S.C. 15 5 6 9 — — 33Ga. 12 16 — 45 — 1 57Fla. 94 19 43 61 — — 121E.S. Central 63 23 72 38 2 — 144Ky. 14 7 23 14 2 — 27Tenn. 32 9 31 14 — — 63Ala. 13 7 10 6 — — 35Miss. 4 — 8 4 — — 19W.S. Central 31 34 87 91 — 1 336Ark. — 1 4 3 — — 25La. 7 — 8 6 — — 78Okla. 7 2 — 5 — — 32Tex. 17 31 75 77 — 1 201Mountain 57 38 15 68 1 1 102Mont. — — — 3 — — 4Idaho 3 1 5 4 — 1 8Wyo. 3 2 1 1 — — 5Colo. 16 9 — 25 — — 37N. Mex. 3 7 1 3 — — 11Ariz. 21 10 3 19 1 — 21Utah 7 2 1 4 — — 8Nev. 4 7 4 9 — — 8Pacific 64 154 121 229 43 22 460Wash. 10 14 9 19 13 2 71Oreg NN 12 15 17 3 — 63Calif. 48 122 95 179 25 15 310Alaska 1 — 2 1 — — 3Hawaii 5 6 — 13 2 5 13Guam — — — 1 — — —P.R. 2 — — 6 1 — 9V.I. NA NA NA NA NA NA NAAmerican Samoa — — — — — — 3C.N.M.I. — — — — — — —NA: Not available NN: Not notifiable —: No reported cases* Imported cases include only those resulting from importation from other countries.
728 MMWR August 16, 2002TABLE. (Continued) <strong>Report</strong>ed cases of notifiable diseases,* by geographic division <strong>and</strong> area — United States, 2001RubellaRabiesCongenital<strong>Report</strong>ing area Mumps Pertussis Plague Psittacosis Q fever Animal Human RMSF † Rubella syndromeUnited States 266 7,580 2 25 25 7,150 1 695 23 3New Engl<strong>and</strong> 2 736 — — — 760 — 3 — —Maine — 22 — — — 82 — — — —N.H. — 31 — — — 21 — 1 — —Vt. — 113 — — NN 62 — — — —Mass. 2 537 — — NN 279 — 2 — —R.I. — 9 — — NN 72 — — — —Conn. — 24 — — — 244 — — — —Mid. Atlantic 35 455 — 9 — 1,371 — 33 9 —Upstate N.Y. 4 175 — 6 — 781 — 2 1 —N.Y. City 13 59 — — — 38 — 2 6 —N.J. 4 23 — — — 200 — 9 1 —Pa. 14 198 — 3 NN 352 — 20 1 —E.N. Central 32 985 — 1 1 158 — 16 2 1Ohio 1 327 — — NN 52 — 2 — 1Ind. 3 116 — 1 NN 15 — 1 — —Ill. 21 194 — — — 24 — 12 2 —Mich. 5 149 — — 1 47 — 1 — —Wis. 2 199 — — — 20 — — — —W.N. Central 17 609 — 4 5 375 — 69 3 —Minn. 6 308 — — 1 47 — 1 — —Iowa 1 139 — 3 NN 84 — 2 1 —Mo. 4 107 — 1 1 40 — 62 1 —N. Dak. — 11 — NN 1 42 — 1 — —S. Dak. — 5 — — — 58 — 2 — —Nebr. 1 8 — — 2 4 — 1 — —Kans. 5 31 — — — 100 — — 1 —S. Atlantic 45 493 — 2 2 2,512 — 328 5 1Del. — — — — NN 39 — 13 — —Md. 8 53 — 1 NN 504 — 39 1 —D.C. — 1 — — — — — 1 — —Va. 8 272 — — NN 502 — 40 — 1W. Va. — 6 — — — 141 — 1 — —N.C. 5 75 — — — 571 — 185 — —S.C. 7 34 — — — 144 — 31 2 —Ga. 9 23 — — 1 402 — 9 — —Fla. 8 29 — 1 1 209 — 9 2 —E.S. Central 9 208 — — 3 204 — 121 — —Ky. 3 96 — — 1 30 — 2 — —Tenn. 1 70 — — 2 106 — 85 — —Ala. — 37 NN — — 64 — 18 — —Miss. 5 5 — — NN 4 — 16 — —W.S. Central 16 1,528 — — 1 1,144 — 113 2 —Ark. — 858 — — NN 32 — 54 — —La. 2 12 — — 1 9 — 2 — —Okla. — 43 — — — 60 — 57 — —Tex. 14 615 — — NN 1,043 — — 2 —Mountain 17 1,561 2 — 6 254 — 11 — —Mont. 1 54 — — — 38 — 1 — —Idaho 2 171 — — — 28 — 1 — —Wyo. 2 1 — — 1 28 — 2 — —Colo. 3 389 — — 4 — — 2 — —N. Mex. 2 137 1 — — 15 — 1 — —Ariz. 2 690 — — — 129 — — — —Utah 1 78 1 — — 15 — 3 — —Nev. 4 41 — — 1 1 — 1 — —Pacific 93 1,005 — 9 7 372 1 1 2 1Wash. 2 184 — — — — — — — —Oreg NN 57 — — — 4 — 1 — —Calif. 48 706 — 8 7 319 1 — 1 —Alaska 1 16 — 1 — 49 — NN — —Hawaii 42 42 — — — — — — 1 1Guam — — — — — — — — — —P.R. 2 — — — — 99 — — 3 —V.I. NA NA NA NA NA NA NA NA NA NAAmerican Samoa 1 — — — — — — — — —C.N.M.I. — — — — — — — — — —NA: Not available NN: Not notifiable —: No reported cases* No cases of paralytic poliomyelitis were reported in 2001.† Rocky Mountain spotted fever.
Vol. 51 / No. 32 MMWR 729TABLE. (Continued) <strong>Report</strong>ed cases of notifiable diseases, by geographic division <strong>and</strong> area — United States, 2001Streptococcal Streptococcal Streptococcus Syphilis*disease, invasive, toxic-shock pneumoniae, drug Congenital Primary <strong>and</strong><strong>Report</strong>ing area Salmonellosis Shigellosis group A syndrome resistant, invasive All stages † (age
730 MMWR August 16, 2002TABLE. (Continued) <strong>Report</strong>ed cases of notifiable diseases,* by geographic division <strong>and</strong> area — United States, 2001Toxic-shock Varicella §<strong>Report</strong>ing area Tetanus syndrome Trichinosis Tuberculosis † Tularemia Typhoid fever (chickenpox)United States 37 125 22 15,989 128 368 22,536New Engl<strong>and</strong> — 4 — 498 7 20 3,096Maine — — — 20 — 1 146N.H. — 1 — 20 1 2 NNVt. — — — 7 — — 149Mass. — 3 — 270 6 12 1,093R.I. — — — 60 — — 9Conn. — NN — 121 — 5 1,699Mid. Atlantic 3 21 3 2,556 2 113 —Upstate N.Y. 1 7 — 415 1 15 NNN.Y. City 1 4 2 1,261 — 49 NNN.J. — — 1 530 1 38 NNPa. 1 10 — 350 — 11 NNE.N. Central 2 25 2 1,544 17 34 10,474Ohio — 8 — 306 1 5 1,653Ind. — 1 — 115 NN 2 NNIll. 2 4 1 707 14 18 —Mich. — 10 — 330 2 5 6,600Wis. — 2 1 86 — 4 2,221W.N. Central 2 20 2 561 46 16 18Minn. — 7 — 239 — 7 NNIowa — 1 2 43 NN — NNMo. — 4 — 157 27 9 3N. Dak. — — — 6 1 — 15S. Dak. — — — 13 7 — NNNebr. — 6 — 40 4 — NNKans. 2 2 — 63 7 — NNS. Atlantic 7 17 — 3,088 4 52 2,100Del. — — — 33 1 1 NNMd. 1 NN — 262 1 10 NND.C. — 1 — 74 — — 73Va. — 2 — 306 NN 15 540W. Va. 1 — — 32 — — 1,421N.C. 2 7 — 398 1 3 NNS.C. — 3 — 263 — — 66Ga. — 4 NN 575 1 12 NNFla. 3 — — 1,145 — 11 NNE.S. Central 2 3 — 884 11 1 —Ky. — 2 NN 152 4 — NNTenn. 1 1 — 313 6 1 NNAla. — — — 265 1 — NNMiss. 1 NN — 154 — — NNW.S. Central 4 1 — 2,293 16 20 5,800Ark. — — NN 162 9 — NNLa. — — — 294 — — 59Okla. 1 1 — 194 7 1 —Tex. 3 — — 1,643 NN 19 5,741Mountain 2 8 1 644 17 11 1,048Mont. — — — 20 2 2 NNIdaho — — — 9 — — 3Wyo. — — 1 3 7 — NNColo. 1 7 — 138 2 1 NNN. Mex. — 1 — 54 1 — NNAriz. 1 — — 289 1 2 951Utah — — — 35 4 2 92Nev. — — — 96 — 4 2Pacific 15 26 14 3,921 8 101 —Wash. — NN — 261 5 7 NNOreg. — — — 123 1 8 —Calif. 15 26 13 3,332 1 82 NNAlaska — NN 1 54 1 1 NNHawaii — — — 151 — 3 —Guam — — 22 63 — 3 60P.R. — — — 121 — — 2,187V.I. NA NA NA NA NA NA NAAmerican Samoa — — — — — — 173C.N.M.I. — — — 58 — — —NA: Not available NN: Not notifiable —: No reported cases* No cases of yellow fever were reported in 2001.† Totals reported to the Division of Tuberculosis Elimination, NCHSTP, as of March 29, 2002.§ Although not nationally notifiable, reporting is recommended by the Council of State <strong>and</strong> Territorial Epidemiologists.
Vol. 51 / No. 32 MMWR 731All MMWR references are available on the Internet at http://www.cdc.gov/mmwr. Use the search function to find specific articles.——————Use of trade names <strong>and</strong> commercial sources is for identification only <strong>and</strong> does not imply endorsement by the U.S. Department of Health <strong>and</strong>Human Services.——————References to non-CDC sites on the Internet are provided as a service to MMWR readers <strong>and</strong> do not constitute or imply endorsement ofthese organizations or their programs by CDC or the U.S. Department of Health <strong>and</strong> Human Services. CDC is not responsible for thecontent of these sites. URL addresses listed in MMWR were current as of the date of publication.
732 MMWRAugust 16, 2002The <strong>Morbidity</strong> <strong>and</strong> <strong>Mortality</strong> <strong>Weekly</strong> <strong>Report</strong> (MMWR) Series is prepared by the Centers for Disease Control <strong>and</strong> Prevention (CDC) <strong>and</strong>is available free of charge in electronic format <strong>and</strong> on a paid subscription basis for paper copy. To receive an electronic copy each week, sendan e-mail message to listserv@listserv.cdc.gov. The body content should read SUBscribe mmwr-toc. Electronic copy also is available fromCDC’s World-Wide Web server at http://www.cdc.gov/mmwr or from CDC’s file transfer protocol server at ftp://ftp.cdc.gov/pub/publications/mmwr. To subscribe for paper copy, contact Superintendent of Documents, U.S. Government Printing Office, Washington, DC 20402;telephone 202-512-1800.Data in the weekly MMWR are provisional, based on weekly reports to CDC by state health departments. The reporting week concludesat close of business on Friday; compiled data on a national basis are officially released to the public on the following Friday. Addressinquiries about the MMWR Series, including material to be considered for publication, to Editor, MMWR Series, Mailstop C-08, CDC,1600 Clifton Rd., N.E., Atlanta, GA 30333; telephone 888-232-3228.All material in the MMWR Series is in the public domain <strong>and</strong> may be used <strong>and</strong> reprinted without permission; citation as to source,however, is appreciated.✩U.S. Government Printing Office: 2002-733-100/69051 Region IV