Tools for Managing Clusters of NVIDIA Gpus
Tools for Managing Clusters of NVIDIA Gpus
Tools for Managing Clusters of NVIDIA Gpus

You also want an ePaper? Increase the reach of your titles
YUMPU automatically turns print PDFs into web optimized ePapers that Google loves.
<strong>Tools</strong> <strong>for</strong> <strong>Managing</strong> <strong>Clusters</strong> <strong>of</strong> <strong>NVIDIA</strong><br />
GPUs<br />
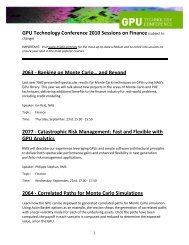
San Jose, CA | September 21st
My Background<br />
§ At <strong>NVIDIA</strong> <strong>for</strong> over 7 years<br />
§ Lead architect <strong>for</strong> an internal, large, from-scratch<br />
distributed compute farm<br />
— Used internally <strong>for</strong> building, testing, simulation HW/SW<br />
— We transition from 5 nodes -> 100 nodes -> 1000+ nodes<br />
— Some HPC problems are universal
Topics<br />
§ Historical challenges <strong>for</strong> GPUs<br />
— Vs. traditional clusters<br />
§ Where we stand today<br />
— Current tool support<br />
§ Future directions<br />
— Which areas we’re focusing on
Historical challenges <strong>for</strong> GPUs<br />
§ A 10,000’ assessment <strong>of</strong> GPU-based hybrid systems:<br />
— Very appealing due to the huge perf/watt advantage<br />
— But, harder to manage and maintain<br />
We haven’t eliminated this latter deficiency, but we’re<br />
making great progress
Historical challenges <strong>for</strong> GPUs<br />
§ But first, some context<br />
— What are the key cluster management problems?<br />
— Where do hybrid GPU-based systems lag their CPU-only peers?<br />
— And in those cases, why?
Key Problem Spaces<br />
§ Visibility into system state<br />
— Utilization rates<br />
— ECC error counts<br />
— Crash dumps<br />
— Job failure cause (e.g. OOM)<br />
§ Monitoring<br />
— Out-<strong>of</strong>-band<br />
— Runtime health checks<br />
— Crash dumps retrieval<br />
— Fenced Node<br />
— Diagnostic, RMA
Key Problem Spaces<br />
§ Job isolation<br />
— Clean aborts<br />
— Sandboxing (space and time)<br />
— Security<br />
§ Per<strong>for</strong>mance<br />
— Minimal monitoring cost<br />
— Minimal SW stack<br />
overhead<br />
— Minimal HW latency
Key Problem Spaces<br />
§ Tight CM integration<br />
— Resource scheduling<br />
— Health monitoring<br />
— Maintenance<br />
— Job cleanup/recovery<br />
§ Ecosystem integration<br />
— Programmatic<br />
interfaces<br />
— API support (WMI, SNMP,<br />
etc)
Where We Stand Today<br />
§ Nvidia-smi<br />
— Addressing: GPU visibility, monitoring, ecosystem integration<br />
§ Nvidia Healthmon<br />
— Addressing: Health monitoring<br />
§ GPU Direct<br />
— Addressing: Latency/overhead<br />
§ 3rd Party <strong>Tools</strong><br />
— Addressing: Ecosystem integration
nvidia-smi<br />
§ Command-line tool<br />
§ Windows Server 2008+ and Linux<br />
§ Tesla and Fermi architecture compute parts<br />
§ Ships with driver<br />
§ Our primary monitoring tool
nvidia-smi Features -- Queries<br />
§ Get serial #s<br />
— Immutable, universally unique<br />
§ Get PCI device and location ids<br />
§ Get thermals<br />
— Temps <strong>for</strong> GPU, memory<br />
— Fan speeds<br />
§ Get ECC counts<br />
— FB, RF, L1, L2<br />
— Volatile vs. lifetime
Nvidia-smi Features -- Queries<br />
§ Get utilization rates<br />
— GPU % busy<br />
— Memory usage<br />
§ Get compute mode<br />
§ Get driver version
Nvidia-smi Features -- Operations<br />
§ Reset ECC error counts<br />
§ Set compute mode<br />
§ Set driver model<br />
— TCC vs. WDDM
Nvidia-smi Features – TCC Mode<br />
§ For Windows Vista and higher systems<br />
§ Treat GPU as generic peripheral, not as graphics device<br />
§ Benefits:<br />
— Execution <strong>of</strong> compute apps over remote desktop<br />
— Better per<strong>for</strong>mance vs. WDDM<br />
— Fewer memory restrictions<br />
§ We recommend running compute work in TCC mode
Nvidia-smi – Example Output<br />
Timestamp : 09/20/2010 11:29:53 PM<br />
Driver Version : 260.68<br />
GPU 0:<br />
Product Name : Tesla C2050<br />
PCI Device/Vendor ID : 6d110de<br />
PCI Location ID : 0:3:0<br />
Display : Connected<br />
Temperature : 68 C<br />
Fan Speed : 30%<br />
Utilization<br />
GPU : 0%<br />
Memory : 3%<br />
ECC errors :<br />
Single bit :<br />
FB : 0<br />
RF : 0<br />
L1 : 0<br />
L2 : 0<br />
Total : 0<br />
Double bit :<br />
FB : 0<br />
RF : 0<br />
L1 : 0<br />
L2 : 0<br />
Total : 0
Nvidia-smi – Example Output<br />
Timestamp : Mon Sep 20 02:34:51 2010<br />
Unit 0:<br />
Product Name : S2050<br />
Product ID : -01--0001--001<br />
Serial Number : d345b21<br />
Firmware Ver : 6.2<br />
Intake Temperature : 21 C<br />
Power Capping:<br />
Power limit : 1200 watts<br />
Up event count : 0<br />
Down event count : 0<br />
Up latency : 20000ms<br />
Down latency : 100ms<br />
GPU 0:<br />
GPU 1:<br />
Product Name : Tesla S2050<br />
Serial : 0330510041162<br />
PCI Device/Vendor ID : 6de10de<br />
PCI Location ID : 0:7:0<br />
Bridge Port : 0<br />
Temperature : 56 C<br />
Product Name : Tesla S2050<br />
Serial : 0330510041163<br />
PCI Device/Vendor ID : 6de10de<br />
PCI Location ID : 0:8:0<br />
Bridge Port : 2<br />
Temperature : 49 C<br />
ECC errors :<br />
Fan Tachs:<br />
PSU:<br />
LED:<br />
Single Bit :<br />
FB : 0<br />
RF : 0<br />
L1 : 0<br />
L2 : 0<br />
Total : 0<br />
Double Bit:<br />
FB : 0<br />
RF : 0<br />
L1 : 0<br />
L2 : 0<br />
Total : 0<br />
#00: 3570 Status: NORMAL<br />
#01: 3432 Status: NORMAL<br />
#02: 3628 Status: NORMAL<br />
#03: 3474 Status: NORMAL<br />
#04: 3556 Status: NORMAL<br />
#05: 3492 Status: NORMAL<br />
#06: 3580 Status: NORMAL<br />
#07: 3410 Status: NORMAL<br />
#08: 3464 Status: NORMAL<br />
#09: 3508 Status: NORMAL<br />
#10: 3646 Status: NORMAL<br />
#11: 3450 Status: NORMAL<br />
#12: 3634 Status: NORMAL<br />
#13: 3388 Status: NORMAL<br />
Voltage : 11.98 V<br />
Current : 31.66 A<br />
State : Normal<br />
State : GREEN
Nvidia Healthmon<br />
§ Simple tool <strong>for</strong> assessing health <strong>of</strong><br />
GPU node.<br />
§ Per<strong>for</strong>ms:<br />
— Basic device query<br />
— Basic memory test (on ECC products)<br />
— PCIe Bandwidth test (host->device and<br />
device->host)<br />
§ 15 – 20 seconds
Nvidia Healthmon – Example Output<br />
<strong>NVIDIA</strong> Tesla Health Monitor v0.1<br />
Device Enumeration:<br />
1 devices detected<br />
Device 0: Tesla C2050<br />
Compute capability: 2.0<br />
Amount <strong>of</strong> memory: 2817720320 bytes<br />
ECC: enabled<br />
Number <strong>of</strong> SMs: 14<br />
Core clock: 1147 MHz<br />
Watchdog timeout: disabled<br />
Compute mode: default (supports multiple simultaneous contexts)<br />
GPU Functional Validation<br />
Device 0: Tesla C2050<br />
Allocated 2682684702 bytes<br />
Test PASSED<br />
PCIe Bandwidth<br />
Device 0: Tesla C2050<br />
Host-to-device bandwidth: 3142.090088 MB/s<br />
Device-to-host bandwidth: 2973.980469 MB/s<br />
Bidirectional device bandwidth: 4322.295898 MB/s<br />
Test PASSED
3rd Party <strong>Tools</strong> – Bright Computing<br />
§ Click to edit Master text styles<br />
— Second level<br />
— Third level<br />
§ Fourth level<br />
— Fifth level
3rd Party <strong>Tools</strong> – Bright Computing<br />
§ Click to edit Master text styles<br />
— Second level<br />
— Third level<br />
§ Fourth level<br />
— Fifth level
Future Directions<br />
§ Based on feedback from<br />
current & future customers<br />
§ Main areas <strong>of</strong> focus:<br />
— Programmatic interfaces<br />
— Monitoring/visibility<br />
— Out-<strong>of</strong>-band<br />
— SW ecosystem
Programmatic Interfaces<br />
§ Ship a new library with the driver, NVML<br />
§ Provide API that encapsulates nvidia-smi functionality, plus<br />
additional goodness<br />
§ Future nvidia-smi built on top <strong>of</strong> NVML<br />
§ Building block <strong>for</strong> 3rd party tools
Out-<strong>of</strong>-band Monitoring<br />
§ Move GPU monitoring <strong>of</strong>f CPU<br />
§ Thermals, utilization, ECC errors, etc<br />
§ Crash dumps<br />
§ Get some useful data even if GPU/driver is hung<br />
§ OEM engagement to build this in to real products
SW Ecosystem<br />
§ Lots <strong>of</strong> tools that we can enable or create ourselves<br />
— Not always clear which route is better<br />
— General philosophy is to enable others to create tools, e.g. with<br />
NVML<br />
§ Homegrown?<br />
— Windows Perf Counters<br />
— Drop-in WMI,SNMP, etc clients
GPUDirect<br />
San Jose, CA| September 21st
GPUDirect v1 Definition<br />
� Allows 3rd Party to share pinned system memory on Linux<br />
� Requires a Linux kernel patch to support<br />
get_driver_pages()<br />
� Requires 3rd Party drivers to add support <strong>for</strong><br />
get_driver_pages()<br />
� Initial support <strong>for</strong> Infiniband and Mellanox
GPUDirect v1 Motivation<br />
� Remove a copy in system memory<br />
� Handle the failure/teardown safely through a callback<br />
mechanism
GPUDirect v1 Improvements<br />
� Remove a copy<br />
� Allows MPI to use RDMA with CUDA pinned system memory<br />
� Improved scalability in clusters since the CPU will do fewer<br />
memory copies<br />
� AMBER sees ~ 6% improvement
We’d Love to Hear From You<br />
§ Feedback from our customers/collaborators helps us refine<br />
our ef<strong>for</strong>ts and focus.<br />
— Chat with us after this session<br />
— Cluster Management Pod @ table 22 (Back wall, Exhibit Hall)<br />
— Today 6 – 8pm<br />
— Wednesday 11am – 2pm & 6 – 8pm<br />
— Thursday 11am – 2pm