Multiplying and Dividing - The University of Auckland
Multiplying and Dividing - The University of Auckland
Multiplying and Dividing - The University of Auckland

Create successful ePaper yourself
Turn your PDF publications into a flip-book with our unique Google optimized e-Paper software.
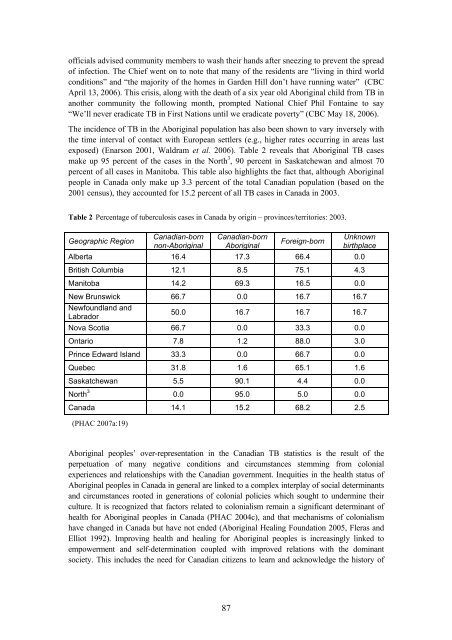
<strong>of</strong>ficials advised community members to wash their h<strong>and</strong>s after sneezing to prevent the spread<strong>of</strong> infection. <strong>The</strong> Chief went on to note that many <strong>of</strong> the residents are “living in third worldconditions” <strong>and</strong> “the majority <strong>of</strong> the homes in Garden Hill don’t have running water” (CBCApril 13, 2006). This crisis, along with the death <strong>of</strong> a six year old Aboriginal child from TB inanother community the following month, prompted National Chief Phil Fontaine to say“We’ll never eradicate TB in First Nations until we eradicate poverty” (CBC May 18, 2006).<strong>The</strong> incidence <strong>of</strong> TB in the Aboriginal population has also been shown to vary inversely withthe time interval <strong>of</strong> contact with European settlers (e.g., higher rates occurring in areas lastexposed) (Enarson 2001, Waldram et al. 2006). Table 2 reveals that Aboriginal TB casesmake up 95 percent <strong>of</strong> the cases in the North 3 , 90 percent in Saskatchewan <strong>and</strong> almost 70percent <strong>of</strong> all cases in Manitoba. This table also highlights the fact that, although Aboriginalpeople in Canada only make up 3.3 percent <strong>of</strong> the total Canadian population (based on the2001 census), they accounted for 15.2 percent <strong>of</strong> all TB cases in Canada in 2003.Table 2 Percentage <strong>of</strong> tuberculosis cases in Canada by origin – provinces/territories: 2003.Geographic RegionCanadian-bornnon-AboriginalCanadian-bornAboriginalForeign-bornUnknownbirthplaceAlberta 16.4 17.3 66.4 0.0British Columbia 12.1 8.5 75.1 4.3Manitoba 14.2 69.3 16.5 0.0New Brunswick 66.7 0.0 16.7 16.7Newfoundl<strong>and</strong> <strong>and</strong>Labrador50.0 16.7 16.7 16.7Nova Scotia 66.7 0.0 33.3 0.0Ontario 7.8 1.2 88.0 3.0Prince Edward Isl<strong>and</strong> 33.3 0.0 66.7 0.0Quebec 31.8 1.6 65.1 1.6Saskatchewan 5.5 90.1 4.4 0.0North 3 0.0 95.0 5.0 0.0Canada 14.1 15.2 68.2 2.5(PHAC 2007a:19)Aboriginal peoples’ over-representation in the Canadian TB statistics is the result <strong>of</strong> theperpetuation <strong>of</strong> many negative conditions <strong>and</strong> circumstances stemming from colonialexperiences <strong>and</strong> relationships with the Canadian government. Inequities in the health status <strong>of</strong>Aboriginal peoples in Canada in general are linked to a complex interplay <strong>of</strong> social determinants<strong>and</strong> circumstances rooted in generations <strong>of</strong> colonial policies which sought to undermine theirculture. It is recognized that factors related to colonialism remain a significant determinant <strong>of</strong>health for Aboriginal peoples in Canada (PHAC 2004c), <strong>and</strong> that mechanisms <strong>of</strong> colonialismhave changed in Canada but have not ended (Aboriginal Healing Foundation 2005, Fleras <strong>and</strong>Elliot 1992). Improving health <strong>and</strong> healing for Aboriginal peoples is increasingly linked toempowerment <strong>and</strong> self-determination coupled with improved relations with the dominantsociety. This includes the need for Canadian citizens to learn <strong>and</strong> acknowledge the history <strong>of</strong>87