1.4 Webber PDF.pdf
1.4 Webber PDF.pdf
1.4 Webber PDF.pdf

Create successful ePaper yourself
Turn your PDF publications into a flip-book with our unique Google optimized e-Paper software.
The Nexus of Energy & WaterAPS, Berkeley, CAMichael E. <strong>Webber</strong>, Ph.D.March 5, 2011
Control of Water Is Related to Economic,Governmental and Military Power• Hydrology theory of civilization implies connectionof civilization with massive waterworks• “The Chinese word for politics (zhengzhi) includesa character that looks like three drops of water nextto a platform or dyke.”– The Economist (4/11/09)http://chineseculture.about.comMichael E. <strong>Webber</strong>, Ph.D.Energy and Water 2March 5, 2011
Control of Water Is Related to Economic,Governmental and Military PowerRomans built vast water infrastructurehttp://www.princeton.edu/%7Ewilsonco/WilsonWeekly/pics/bridges2-PontDuGard.jpgMichael E. <strong>Webber</strong>, Ph.D.Energy and Water 3March 5, 2011
Control of Water Is Related to Economic,Governmental and Military PowerAngkor Wat is a temple at the middle of a vast water complexhttp://www.travellingvietnamtours.com/Michael E. <strong>Webber</strong>, Ph.D.Energy and Water 4March 5, 2011
Sustained Droughts Are Correlated withCollapsed CivilizationsChinese dynasties– Tang (907 CE), Yuan,Ming– Source: Science (11/08)Roman empire– Source:American Geo. Institute (3/09)Meso America– Maya (900 CE)– Source: Science (11/08)Khmer Empire– Peaked in 13 th century– Source: Nat Geo (July 2009)Michael E. <strong>Webber</strong>, Ph.D.Energy and Water 5March 5, 2011
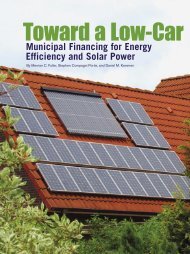
Energy and Water Are Also the Two LoomingCrises of the 21 st Century…National Geographic 3/2008Michael E. <strong>Webber</strong>, Ph.D.Energy and Water 6March 5, 2011
The Energy-Water Nexus: Can we solve bothcrises together?(Image courtesy of Scientific American Earth 3.0, 9/2008)Michael E. <strong>Webber</strong>, Ph.D.Energy and Water 7March 5, 2011
The Hydrological Cycle is GlobalMichael E. <strong>Webber</strong>, Ph.D.Energy and Water 8March 5, 2011
The Hydrological Cycle is Global• REVIEW: Global Hydrological Cycles and World Water Resources, TaikanOki1,2,3*† and Shinjiro Kanae1,4*, Science, August 25, 2006Michael E. <strong>Webber</strong>, Ph.D.Energy and Water 9March 5, 2011
Freshwater Is A Small Part of the Total SupplyLiquid Assets, Jill Boberg, RANDMichael E. <strong>Webber</strong>, Ph.D.Energy and Water 10March 5, 2011
There Are Four Main Points to Remember1. Energy and water are interrelated• we use energy for water and water for energy2. The energy and water relationship is already under strain• constraints in one resource introduce constraints in the other3. Trends imply these strains will be exacerbated• Population growth increases total demand• Economic growth increases per capita demand• Global climate change intensifies the hydrological cycle• Policy shifts towards increasing water-intensity of energy andenergy-intensity of water4. There are different policy actions that can help• Policy engagement on energy/water nexus is warrantedMichael E. <strong>Webber</strong>, Ph.D.Energy and Water 11March 5, 2011
Energy and Water are InterrelatedMichael E. <strong>Webber</strong>, Ph.D.Energy and Water 12March 5, 2011
Energy and Water are InterrelatedSource: EPRIMichael E. <strong>Webber</strong>, Ph.D.Energy and Water 13March 5, 2011
The Thermoelectric Power Sector is theLargest User of Water in the US• 48% of total water withdrawals (39% of freshwater withdrawals)• Withdrawal: 0.2 - 42.5 gal/kWh Consumption: 0.1 - 0.8 gal/kWhSource: USGSMichael E. <strong>Webber</strong>, Ph.D.Energy and Water 14March 5, 2011
There Are Two Main Cooling ApproachesOpen-Loop CoolingClosed-Loop CoolingMost water that is withdrawnis returned…but at a highertemperatureWithdraws more,consumes lessMost water that iswithdrawn is consumedWithdraws less,consumes more[Source: Stillwell, 2009]Michael E. <strong>Webber</strong>, Ph.D.Energy and Water 15March 5, 2011
The Thermoelectric Power Sector Uses Waterfor CoolingWithdrawalsConsumptionThermoelectric(National Average)Thermoelectric(with once-through cooling)Thermoelectric(with cooling tower)[gal/kWh][gal/kWh]21 0.540 0.251 1Hydroelectric 18 18• Aggregate National Average consumption: 2 gal/kWhMichael E. <strong>Webber</strong>, Ph.D.Energy and Water 16March 5, 2011
The Thermoelectric Power Sector is theLargest User of Water in the US[Source: Stillwell, 2009]FuelClosed-Loop(cooling tower)Withdrawals[gal/kWh]Consumption[gal/kWh]Withdrawals[gal/kWh]Open-LoopConsumption[gal/kWh]Nuclear 1.0 0.7 42.5 0.4Solar CSP 0.8 0.8 N/A N/ACoal 0.5 0.5 35.0 0.3Natural Gas(combined cycle)Natural Gas(combustion turbine)0.23 0.18 13.8 0.1negligible negligible negligible negligibleConsumption: ~0.1 to 0.8 gal/kWhWithdrawals: ~0.2 to 42.5 gal/kWhMichael E. <strong>Webber</strong>, Ph.D.Energy and Water 17March 5, 2011
Cooling Towers Are Large StructuresMichigan City, INCredit: M. <strong>Webber</strong>, 8/09Michael E. <strong>Webber</strong>, Ph.D.Energy and Water 18March 5, 2011
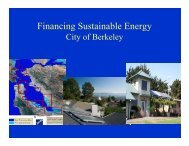
The Water Sector Uses a Lot of Energy• Energy is used to produce, move, heat and treat water– About 5% just for residential & commercial sectors– 250-300 MMT of CO2 emissions (~5% of total)• California is an extreme example– CA spends ~19% of its electricity on water• Primarily for end-use• SoCal uses a lot of energy for conveyance– similar story wherever water is scarceSource: Twomey (2011), CEC (2005)Michael E. <strong>Webber</strong>, Ph.D.Energy and Water 19March 5, 2011
Water/Wastewater Collection, Production,Treatment and Distribution Requires EnergyWaterWastewaterSource/Treatment TypeEnergy [kWh/Mgal]Surface Water 1,400Groundwater 1,800Brackish Groundwater 3,900-9,750Seawater 9,780-16,500Trickling Filter 955Activated Sludge 1,300Advanced Treatment w/o Nitrification 1,500Advanced Treatment w/ Nitrification 1,900[Source: Stillwell, 2009]Michael E. <strong>Webber</strong>, Ph.D.Energy and Water 20March 5, 2011
We Use Water From a Variety of Sources For aVariety of Purposes With a Variety of EnergyRequirementsSource: Twomey (2011), CEC (2005)Michael E. <strong>Webber</strong>, Ph.D.Energy and Water 21March 5, 2011
Americans Consume Vast Sums of Energy onWaterPublic restrooms usually use highquality drinking water to flush the toiletsDogs also get the highest qualitydrinking water• Texans consume ~135-250gallons of drinking water perperson per day• Water is often free or cheap atpoint of useCredit: Evelyn <strong>Webber</strong> 2009Michael E. <strong>Webber</strong>, Ph.D.Energy and Water 22March 5, 2011
The Energy-Water Relationship Is AlreadyUnder StrainMichael E. <strong>Webber</strong>, Ph.D.Energy and Water 23March 5, 2011
The Energy-Water Relationship Is AlreadyUnder Strain• Record heat wave in France in 2003– nuclear power plants dialed back because of inlet watertemperatures (less cooling capability) and rejection watertemperature limits• Droughts could close nuclear power plants: Southeast watershortage a factor in huge cooling requirements– Associated Press, January 23, 2008• Civil War Between Georgia and Tennessee?– Georgians want access to Tennessee water– The Tennessean, February 8, 2008– move the border 1 mile north to give GA access to theNickajack Reservoir on the dammed Tennessee riverMichael E. <strong>Webber</strong>, Ph.D.Energy and Water 24March 5, 2011
Las Vegas Running Out of Water MeansDimming Los Angeles Lights• The surface of Lake Mead has dropped 100 feet in six years. If itdrops 50 feet lower, Las Vegas could lose an intake that supplies 40percent of its water. Simultaneously, "Hoover Dam stops generatingelectricity– Denver Post, 1/29/2008Worst 10-year droughtin recorded historyHoover Dam provideselectricity to 750,000people in LABloomberg.com, 2/26/09A white "bathtub ring" on canyon walls at LakeMead National Recreation Area in July showsmineral deposits left by higher levels of water nearthe Arizona Intake Towers at the Hoover Dam.(Ethan Miller, Getty Images )Michael E. <strong>Webber</strong>, Ph.D.Energy and Water 25March 5, 2011
Trends Imply That Strain in the Energy-WaterRelationship Will Be ExacerbatedMichael E. <strong>Webber</strong>, Ph.D.Energy and Water 26March 5, 2011
Trends Imply That Strain in the Energy-WaterRelationship Will Be Exacerbated• Population growth– drives up total demand for energy & water• Economic growth– drives up per capita demand for energy & water• might be counteracted by efficiency• Climate change• Policy choices– movement towards energy-intensive water andwater-intensive energyMichael E. <strong>Webber</strong>, Ph.D.Energy and Water 27March 5, 2011
We Are Moving Towards More Energy-Intensive Water• Stricter water/wastewater treatmentstandards• Deep aquifer production• Desalination– Worldwide capacity to double by 2025– Middle East, London, San Diego, TX• Long-haul pipelines and inter-basin transfer– China, India, Texas• Desalination plus long-haul transfer Economist, June 7, 2008Michael E. <strong>Webber</strong>, Ph.D.Energy and Water 28March 5, 2011
We Are Moving Towards More Water-IntensiveEnergy• Nuclear power, Solar CSP– Note: also choosing water-lean energy forms• Solar PV, wind, natural gas• Future transportation fuels are especially thirsty– Unconventional fossil fuels (2-4x worse)– Natural Gas (better to 1-2x worse)– Electricity (2-3x worse)• Good with wind/solar PV, worse with nuclear– Hydrogen (1-500x worse)• Good with wind/solar PV, worse with nuclear– Biofuels (1-1000x worse)[Source: King & <strong>Webber</strong>, 2009]Michael E. <strong>Webber</strong>, Ph.D.Energy and Water 29March 5, 2011
There Are Some Solutions Being Developed• Integrating Energy, Air Quality & Water For Dispatching– $2M from NSF EFRI program• Pecan Street Project: Smart Grid, Smart Water– $30M smart grid demonstration project in Austin,TX (DoE, NSF, City of Austin,…)• with the local utility & 11 corporate partners– Smart Grid (for electricity) and Smart Water• Conservation and Reuse in the residential sector• Energy Recovery from WWTPsMichael E. <strong>Webber</strong>, Ph.D.Energy and Water 30March 5, 2011
There Are Some Solutions Being Developed• Dry-cooling To Spare Water Rights In TX• Incorporating Water Into Grid Planning– $4M study with the DoE• Water Treatment and Pumping As Dispatchable Load– Wind + water treatmentMichael E. <strong>Webber</strong>, Ph.D.Energy and Water 31March 5, 2011
There Are Policy Pitfalls At The Energy-WaterNexusMichael E. <strong>Webber</strong>, Ph.D.Energy and Water 32March 5, 2011
Example of Disaggregated Energy and WaterPolicymaking In the USA• Funding and oversight mechanisms are separate– Energy planners assume they have the water they need– Water planners assume they have the energy they need• Multitude of agencies, committees, etc. w/o clear authority• Hierarchy of policymaking is dissimilarEnergy: top-down• powerful federal energy agenciesWater: bottom-up• powerful local water agenciesMichael E. <strong>Webber</strong>, Ph.D.Energy and Water 33March 5, 2011
Water Data Are Sparse, Error-prone, andInconsistent in the USA• USGS data-collection is infrequent– last survey on water consumption: 1995– last survey on water withdrawals: 2000 (2005)• Errors in national databases (Egrid, etc.)– differences between state and federal reporting– unclear definitions:• use vs. withdrawal vs. consumption vs. diversion– different units• East: gallons• West: acre-feetMichael E. <strong>Webber</strong>, Ph.D.Energy and Water 34March 5, 2011
Timescales Do Not Match for Energy and WaterPolicymaking• Water– Water plans are 50-100 years• Austin, TX debated a water plant for 40 years– Water data are backwards-looking• Energy– Energy plans are 2-30 years– Energy data are backwards- and forwardlookingMichael E. <strong>Webber</strong>, Ph.D.Energy and Water 35March 5, 2011
There Are Policy Opportunities At The Energy-Water NexusMichael E. <strong>Webber</strong>, Ph.D.Energy and Water 36March 5, 2011
There Are Energy/Water Policy Tools Available• Collect, maintain and make available accurate,updated and comprehensive water data– IEA/EIA for energy data, who for water data?• Conduct integrated policymaking• Establish federal policy role for water quantity– For example, EPA is in charge of water qualityMichael E. <strong>Webber</strong>, Ph.D.Energy and Water 37March 5, 2011
There Are Energy/Water Policy Tools Available• Invest heavily in water-related R&D to matchincreases in energy-related R&D• Focus bioenergy R&D on feedstocks that do notrequire freshwater irrigation (cellulosics, algae)• Support reclaimed water use at powerplants,industry and agriculture• Fund R&D for dry cooling systems at powerplants– Infrastructure swap-outsMichael E. <strong>Webber</strong>, Ph.D.Energy and Water 38March 5, 2011
Good news: energy conservation and waterconservation are synonymous“Turnoffthewater,Daddy.Thescien6stsneed6me.”– Evelyn<strong>Webber</strong>,8yearsold,March2007• Conserving waterwill conserve energy• Conserving energywill conserve waterMichael E. <strong>Webber</strong>, Ph.D.Energy and Water 39March 5, 2011
Michael E. <strong>Webber</strong>, Ph.D.Associate DirectorCenter for International Energy & Environmental PolicyJackson School of GeosciencesAssistant ProfessorThermal Fluids Area, Mechanical EngineeringCockrell School of EngineeringCo-DirectorClean Energy Incubatorwebber@mail.utexas.eduhttp://www.webberenergygroup.comMichael E. <strong>Webber</strong>, Ph.D.Energy and Water 40March 5, 2011