Genetic parameters for pre-weaning traits in ... - ResearchGate
Genetic parameters for pre-weaning traits in ... - ResearchGate
Genetic parameters for pre-weaning traits in ... - ResearchGate

You also want an ePaper? Increase the reach of your titles
YUMPU automatically turns print PDFs into web optimized ePapers that Google loves.
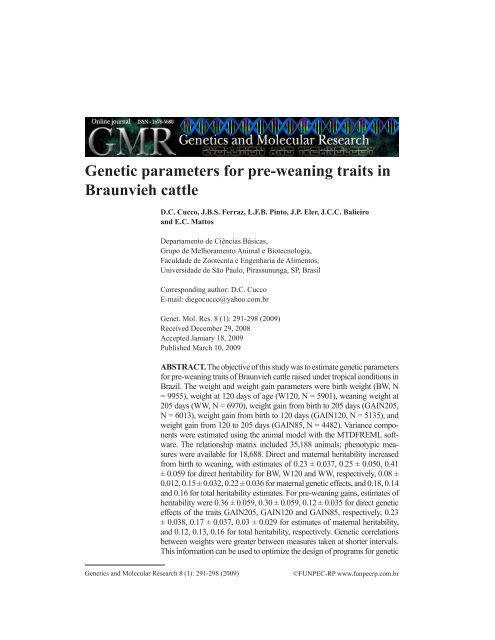
<strong>Genetic</strong> <strong>parameters</strong> <strong>for</strong> <strong>pre</strong>-<strong>wean<strong>in</strong>g</strong> <strong>traits</strong> <strong>in</strong>Braunvieh cattleD.C. Cucco, J.B.S. Ferraz, L.F.B. P<strong>in</strong>to, J.P. Eler, J.C.C. Balieiroand E.C. MattosDepartamento de Ciências Básicas,Grupo de Melhoramento Animal e Biotecnologia,Faculdade de Zootecnia e Engenharia de Alimentos,Universidade de São Paulo, Pirassununga, SP, BrasilCorrespond<strong>in</strong>g author: D.C. CuccoE-mail: diegocucco@yahoo.com.brGenet. Mol. Res. 8 (1): 291-298 (2009)Received December 29, 2008Accepted January 18, 2009Published March 10, 2009ABSTRACT. The objective of this study was to estimate genetic <strong>parameters</strong><strong>for</strong> <strong>pre</strong>-<strong>wean<strong>in</strong>g</strong> <strong>traits</strong> of Braunvieh cattle raised under tropical conditions <strong>in</strong>Brazil. The weight and weight ga<strong>in</strong> <strong>parameters</strong> were birth weight (BW, N= 9955), weight at 120 days of age (W120, N = 5901), <strong>wean<strong>in</strong>g</strong> weight at205 days (WW, N = 6970), weight ga<strong>in</strong> from birth to 205 days (GAIN205,N = 6013), weight ga<strong>in</strong> from birth to 120 days (GAIN120, N = 5135), andweight ga<strong>in</strong> from 120 to 205 days (GAIN85, N = 4482). Variance componentswere estimated us<strong>in</strong>g the animal model with the MTDFREML software.The relationship matrix <strong>in</strong>cluded 35,188 animals; phenotypic measureswere available <strong>for</strong> 18,688. Direct and maternal heritability <strong>in</strong>creasedfrom birth to <strong>wean<strong>in</strong>g</strong>, with estimates of 0.23 ± 0.037, 0.25 ± 0.050, 0.41± 0.059 <strong>for</strong> direct heritability <strong>for</strong> BW, W120 and WW, respectively, 0.08 ±0.012, 0.15 ± 0.032, 0.22 ± 0.036 <strong>for</strong> maternal genetic effects, and 0.18, 0.14and 0.16 <strong>for</strong> total heritability estimates. For <strong>pre</strong>-<strong>wean<strong>in</strong>g</strong> ga<strong>in</strong>s, estimates ofheritability were 0.36 ± 0.059, 0.30 ± 0.059, 0.12 ± 0.035 <strong>for</strong> direct geneticeffects of the <strong>traits</strong> GAIN205, GAIN120 and GAIN85, respectively, 0.23± 0.038, 0.17 ± 0.037, 0.03 ± 0.029 <strong>for</strong> estimates of maternal heritability,and 0.12, 0.13, 0.16 <strong>for</strong> total heritability, respectively. <strong>Genetic</strong> correlationsbetween weights were greater between measures taken at shorter <strong>in</strong>tervals.This <strong>in</strong><strong>for</strong>mation can be used to optimize the design of programs <strong>for</strong> genetic<strong>Genetic</strong>s and Molecular Research 8 (1): 291-298 (2009)©FUNPEC-RP www.funpecrp.com.br
D.C. Cucco et al.292improvement of Braunvieh cattle raised under tropical conditions.Key words: Beef cattle; <strong>Genetic</strong> and phenotypic correlation;Heritability; Maternal effect; Suizo cattle; Weight ga<strong>in</strong>INTRODUCTIONTo improve our genetic knowledge of cattle breeds, all phases of the development of theanimal should be studied <strong>in</strong> detail. This study supplies <strong>in</strong><strong>for</strong>mation that helps <strong>in</strong> the correct selectionof animals with better breed<strong>in</strong>g values. In this context, the <strong>pre</strong>-<strong>wean<strong>in</strong>g</strong> phase is of fundamentalimportance, where <strong>in</strong> this period the first records of per<strong>for</strong>mance can be collected and even thematernal ability and the maternal permanent environmental effects must be evaluated.Several per<strong>for</strong>mance <strong>traits</strong> are considered important from birth to <strong>wean<strong>in</strong>g</strong>. Birth weight(BW) is important because it can <strong>in</strong>dicate eventual problems <strong>in</strong> calv<strong>in</strong>g, where calves can be toobig or heavy. Studies <strong>in</strong> several breeds of beef cattle, <strong>in</strong>clud<strong>in</strong>g Braunvieh (Hagger and Hofer,1990), have <strong>in</strong>dicated that the selection of sires must avoid large breed<strong>in</strong>g values <strong>for</strong> birth weight,due to the high correlation with calv<strong>in</strong>g problems. Campos et al. (1986) studied the genetic andenvironmental effects on birth weight <strong>in</strong> Braunvieh-Guzerat animals and concluded that sex, ageof cow, and month and year of birth <strong>in</strong>fluence this weight.Dur<strong>in</strong>g this <strong>in</strong>itial development of the animal, when it still depends almost exclusively onthe cow’s ability to raise the calf, weight at 120 days (W120) is measured and this measure evaluatesthe maternal ability of the dam (Karsburg, 2003). The weight at this age is very dependent onmilk yield of the cow and it is little <strong>in</strong>fluenced by environment accord<strong>in</strong>g to Siqueira et al. (2003).However, there are not many studies on W120 <strong>in</strong> the literature.Wean<strong>in</strong>g, usually realized around seven months of age (around 205 days), <strong>in</strong>dicates theend of direct <strong>in</strong>fluence of the cow on the calf. It is very important to measure <strong>wean<strong>in</strong>g</strong> weight(WW) because approximately 50% of f<strong>in</strong>al weight is reached at <strong>wean<strong>in</strong>g</strong> (Everl<strong>in</strong>g et al., 2001).The growth of the calf is perhaps the most important factor <strong>for</strong> meat productivity <strong>in</strong> productionsystems (Corrêa et al., 2006). Weights and weight ga<strong>in</strong>s dur<strong>in</strong>g the <strong>pre</strong>-<strong>wean<strong>in</strong>g</strong> periodreflect the general ability of cows to raise their calves, but also reflect the capability of developmentof the animal (Mart<strong>in</strong>s et al., 2000).There are few reports about genetic <strong>parameters</strong> <strong>in</strong> Braunvieh cattle accord<strong>in</strong>g to Bennettand Gregory (1996). These authors published one of the only works with this breed;however, they reported results with an experimental herd. To get better results <strong>in</strong> selectionprograms, it is necessary to determ<strong>in</strong>e genetic <strong>parameters</strong> and per<strong>for</strong>mance of breed<strong>in</strong>g programs<strong>for</strong> each region (Cardoso et al., 2001).Thus, due to the shortage of studies <strong>in</strong> this area with Braunvieh cattle, especially <strong>in</strong> thetropics, and the need to estimate the genetic <strong>parameters</strong> <strong>for</strong> each population, this study aimed todeterm<strong>in</strong>e the heritability and genetic correlations <strong>for</strong> weights and weight ga<strong>in</strong>s <strong>in</strong> the <strong>pre</strong>-<strong>wean<strong>in</strong>g</strong>period <strong>in</strong> this breed. To better understand animal development and the maternal effects <strong>in</strong> the <strong>pre</strong><strong>wean<strong>in</strong>g</strong>period <strong>in</strong> Braunvieh cattle raised <strong>in</strong> the tropics, weight ga<strong>in</strong> was measured <strong>for</strong> differentperiods from weights determ<strong>in</strong>ed at 1, 120 and 205 days of age.MATERIAL AND METHODSThe dataset used came from the Nucleus of Braunvieh Breeders of Brazilian BreedersAssociation of Braunvieh and Brown Swiss Cattle - ABCGPS. Analyses were carried out <strong>in</strong> the<strong>Genetic</strong>s and Molecular Research 8 (1): 291-298 (2009)©FUNPEC-RP www.funpecrp.com.br
<strong>Genetic</strong> <strong>parameters</strong> <strong>for</strong> <strong>pre</strong>-<strong>wean<strong>in</strong>g</strong> <strong>traits</strong> <strong>in</strong> Braunvieh cattle293Animal Breed<strong>in</strong>g and Biotechnology Group of the College of Animal Science and Food Eng<strong>in</strong>eer<strong>in</strong>g,University of São Paulo, Brazil (GMAB - FZEA/USP).The databank conta<strong>in</strong>ed records from 28 farms located <strong>in</strong> Mato Grosso do Sul and SãoPaulo (tropical region) and Paraná and Santa Catar<strong>in</strong>a states (sub-tropical region) <strong>in</strong> a total of18,688 animals with records and 35,188 animals on pedigree (369 sires and 12,284 dams).Traits analyzed were BW, W120 and WW, and weight ga<strong>in</strong>s from birth to 205 days of age(GAIN205), from birth to 120 days of age (GAIN120) and from 120 to 205 days of age (GAIN85).The criteria <strong>for</strong> the standardization of weights and weight ga<strong>in</strong>s can be observed <strong>in</strong> the work ofCucco (2008). Descriptive statistics of all <strong>traits</strong> are <strong>in</strong> Table 1.Table 1. Descriptive statistics <strong>for</strong> weight and weight ga<strong>in</strong>s.Traits Records CG Mean Coefficient Standard M<strong>in</strong>imum Maximumof variation deviation phenotype phenotypeBW 9955 352 37.31 20.73 7.73 16.00 62.00W120 5901 320 136.79 24.70 33.79 49.00 235.00WW 6970 438 205.62 19.93 40.98 95.00 320.00GAIN205 6013 376 166.97 21.73 36.27 67.28 270.28GAIN120 5135 276 99.95 27.53 27.52 17.14 182.61GAIN85 4482 323 70.76 26.81 18.97 18.59 123.72Traits were measured <strong>in</strong> kg; CG = number of contemporary groups; M<strong>in</strong>imum and maximum value ofphenotype evaluated <strong>in</strong> dataset. BW = birth weight; W120 = weight at 120 days of age; WW = <strong>wean<strong>in</strong>g</strong> weightat 205 days; GAIN205, GAIN120, GAIN85 = weight ga<strong>in</strong> from birth to 205 days, from birth to 120 days, andfrom 120 to 205 days, respectively.Contemporary group (CG), class of age of the dam at calv<strong>in</strong>g, and breed<strong>in</strong>g type(embryo transfer or not) were considered <strong>in</strong> the model as fixed effects. Direct and maternalheterozygosity, and age of animal at measurement were used as covariates. The contemporarygroup at birth conta<strong>in</strong>ed farm, birth season, sex, and year of birth. The subsequent contemporarygroups had all these effects plus management group at measurement. All contemporarygroups with less than two sires and three animals were discarded due to lost of connectivity.Age of dams at calv<strong>in</strong>g was classified <strong>in</strong>to seven classes, divided by different ages ofthe dam. Age of recipients was also considered, because the maternal effect comes from themand not from the biological dam of the calf. This procedure aimed to better adjust the effectof maternal ability.All fixed effects and covariates were analyzed us<strong>in</strong>g the GLM procedure (SAS, 2004),where the level of significance was set at P < 0.05. In all <strong>traits</strong>, box plot diagrams (SAS, 2004)were applied, to elim<strong>in</strong>ate outliers from the dataset. The effects considered as random weredirect additive genetic, maternal additive genetic, maternal permanent environmental, and residualeffects. The mathematical model used was:(Equation 1)where y is the vector of dependent variables (BW, W120, WW, GAIN205, GAIN120, GAIN85);β is the vector of fixed effects; u is the vector of random effects of animal genetic value; m isthe vector of random effects of maternal genetic value, c is the vector of random maternal per-<strong>Genetic</strong>s and Molecular Research 8 (1): 291-298 (2009)©FUNPEC-RP www.funpecrp.com.br
D.C. Cucco et al.294manent environmental effect, and e is the vector of random residual effect. Incidence matricesX, Z, S, and W relate phenotype with β, u, m, and, c effects, respectively.S<strong>in</strong>gle- and two-trait analysis were carried out us<strong>in</strong>g MTDFREML - multiple trait derivativefree restricted maximum likelihood (Boldman et al., 1995). The convergence criterionwas simplex variance of 10 -9 . Several reboots were per<strong>for</strong>med with <strong>parameters</strong> estimated <strong>in</strong> the<strong>pre</strong>vious round until no change was observed <strong>in</strong> the last decimal of the log -2 λ <strong>for</strong> two consecutivereboots. Heritability <strong>for</strong> total genetic merit, h 2 , was obta<strong>in</strong>ed accord<strong>in</strong>g to Willham (1972).tRESULTS AND DISCUSSIONVariance components and genetic <strong>parameters</strong> <strong>for</strong> <strong>pre</strong>-<strong>wean<strong>in</strong>g</strong> weights are <strong>pre</strong>sented <strong>in</strong>Table 2. Maternal proportion of variance (c 2 ) effect was smaller at birth and <strong>in</strong>creased thereafter,reach<strong>in</strong>g a maximum value at <strong>wean<strong>in</strong>g</strong>, when maternal effect had accumulated. This should havebeen a consequence of the milk yield and maternal ability of the cow or the recipient cow.Table 2. Variance components and genetic <strong>parameters</strong> of weights from birth to <strong>wean<strong>in</strong>g</strong> <strong>in</strong> Braunvieh cattle.Parameter BW W120 WWVariance componentsσ 2 a4.18 97.94 256.36σ 2 m1.44 57.53 140.26σ a,m-1.16 -49.71 -151.84σ 2 c1.25 27.28 25.56σ 2 e12.17 252.74 357.61σ 2 p17.89 385.78 627.96<strong>Genetic</strong> <strong>parameters</strong>h 2 a0.23 ± 0.037 0.25 ± 0.050 0.41 ± 0.059h 2 m0.08 ± 0.012 0.15 ± 0.032 0.22 ± 0.036h 2 t0.18 0.14 0.16r a,m-0.47 ± 0.106 -0.66 ± 0.092 -0.80 ± 0.057c 2 0.07 ± 0.019 0.07 ± 0.029 0.04 ± 0.027e 2 0.68 ± 0.030 0.66 ± 0.040 0.57 ± 0.044σ 2 = the additive variance; a σ2 = the maternal variance; σ = the covariance between additive and maternal effects;m a,mσ 2 = the variance of maternal permanent environmental effect; c σ2 = the residual variance; e σ2 = the phenotypicpvariance; h 2 = the direct heritability; a h2 = the maternal heritability; m h2 = the total heritability; r = the genetict a,mcorrelation between direct and maternal effects; c 2 = the fraction of total variance that corresponds to maternalpermanent environmental effect; e 2 = the fraction of total variance that corresponds to environmental variance. Forother abbreviations, see legend to Table 1.The proportion of phenotypic variance due to direct genetic effect (h 2 ) was similar atbirth and at 120 days of age, but showed a notable <strong>in</strong>crease at <strong>wean<strong>in</strong>g</strong>. This result demonstratesthat the animals’ genes have a greater impact at this age, with the animals becom<strong>in</strong>gless dependent on the dam. The proportion of phenotypic variance due to maternal permanentenvironmental effect of the dam (c 2 ) rema<strong>in</strong>ed unchanged, with a slight decrease at <strong>wean<strong>in</strong>g</strong>,when calves are less dependent on dam when compared to <strong>pre</strong>vious periods.The analysis of the three weights resulted <strong>in</strong> negative covariances between direct andmaternal genetic effects, with <strong>in</strong>creased absolute value from birth to <strong>wean<strong>in</strong>g</strong>. Residual effects,ex<strong>pre</strong>ssed as the proportion of phenotypic variance due to residual (e 2 ), were similar at birth and at120 days of age, and reduced at <strong>wean<strong>in</strong>g</strong>, when they expla<strong>in</strong>ed 57% of the phenotypic variance.<strong>Genetic</strong>s and Molecular Research 8 (1): 291-298 (2009)©FUNPEC-RP www.funpecrp.com.br
<strong>Genetic</strong> <strong>parameters</strong> <strong>for</strong> <strong>pre</strong>-<strong>wean<strong>in</strong>g</strong> <strong>traits</strong> <strong>in</strong> Braunvieh cattle295Direct and maternal heritability estimates <strong>for</strong> BW were similar to those reported byMarques et al. (1999) <strong>in</strong> Simmental cattle. However, these authors <strong>pre</strong>sented a different value<strong>for</strong> total heritability (0.31). This was due to the larger genetic correlation between direct andmaternal effects estimated <strong>in</strong> the <strong>pre</strong>sent study. Direct heritability <strong>for</strong> BW close to 0.30 wasdescribed by Corrêa et al. (2006), <strong>in</strong> Devon cattle. Nevertheless, Wilson et al. (1986) reported0.19 <strong>for</strong> heritability of BW <strong>in</strong> Angus cattle, and they had doubts about the quality of the dataset<strong>for</strong> birth weight collected by breeders. This could have also happened <strong>in</strong> the <strong>pre</strong>sent study, asthe coefficient of variation was greater than 20%.For W120, estimates of direct and maternal heritability were similar to those observed<strong>in</strong> Santa Gertrudis cattle by Karsburg (2003), and total heritability was very close to the estimateof 0.12 obta<strong>in</strong>ed by Marques et al. (1999) <strong>in</strong> Simmental cattle. Total heritability wassimilar at all ages <strong>in</strong> this study, although heritability <strong>for</strong> direct additive genetic effect (h 2 ) <strong>in</strong>creasedwith age. This was due to the <strong>in</strong>crease <strong>in</strong> absolute values of the negative covariancesbetween direct and maternal effects, which affects estimation of total heritability.In a review paper about genetic <strong>parameters</strong> <strong>in</strong> cattle under tropical conditions, Lôboet al. (2000) reported an average heritability <strong>for</strong> weight at <strong>wean<strong>in</strong>g</strong> of 0.30, lower than that <strong>in</strong>the <strong>pre</strong>sent study. Maternal heritability <strong>for</strong> WW was higher than those reported by Koots et al.(1994). Eler et al. (1996) study<strong>in</strong>g <strong>wean<strong>in</strong>g</strong> weights <strong>in</strong> Nellore cattle raised <strong>in</strong> similar environmentsreported estimates <strong>for</strong> direct heritability of 0.29 and maternal heritability of 0.08, lowerthan the estimates of the <strong>pre</strong>sent research.Direct and maternal variance components and genetic <strong>parameters</strong> <strong>for</strong> weight ga<strong>in</strong>sare reported <strong>in</strong> Table 3. Larger covariance components <strong>for</strong> direct and maternal effects wereobserved <strong>for</strong> GAIN120, and a little lower <strong>for</strong> GAIN205, but a smaller estimate was found<strong>for</strong> GAIN85. This reduction <strong>in</strong> additive genetic variance <strong>for</strong> GAIN85 is a consequence of the<strong>in</strong>creased environmental effect <strong>in</strong> this period. Besides, with regard to the maternal effects, thecalves become less dependent on their dams after 120 days of age.Table 3. Variance components and genetic <strong>parameters</strong> of weight ga<strong>in</strong>s from birth to <strong>wean<strong>in</strong>g</strong> <strong>in</strong> Braunvieh cattle.Parameter GAIN205 GAIN120 GAIN85Variance componentsσ 2 a200.91 99.75 29.08σ 2 m128.93 57.77 7.06σ a,m-132.40 -56.82 2.36σ 2 c13.60 25.59 2.07σ 2 e351.98 208.12 192.47σ 2 p563.03 334.40 233.05<strong>Genetic</strong> <strong>parameters</strong>h 2 a0.36 ± 0.059 0.30 ± 0.059 0.12 ± 0.035h 2 m0.23 ± 0.038 0.17 ± 0.037 0.03 ± 0.029h 2 t0.12 0.13 0.16r a,m-0.82 ± 0.059 -0.75 ± 0.081 0.17 ± 0.385c 2 0.02 ± 0.029 0.07 ± 0.032 0.008 ± 0.036e 2 0.63 ± 0.045 0.62 ± 0.046 0.83 ± 0.038σ 2 = the additive variance; a σ2 = the maternal variance; σ = the covariance between additive and maternal effects;m a,mσ 2 = the variance of maternal permanent environmental effect; c σ2 = the residual variance; e σ2 = the phenotypicpvariance; h 2 = the direct heritability; a h2 = the maternal heritability; m h2 = the total heritability; r = the genetict a,mcorrelation between direct and maternal effects; c 2 = the fraction of total variance that corresponds to maternalpermanent environmental effect; e 2 = the fraction of total variance that corresponds to environmental variance. Forother abbreviations, see legend to Table 1.<strong>Genetic</strong>s and Molecular Research 8 (1): 291-298 (2009)©FUNPEC-RP www.funpecrp.com.br
D.C. Cucco et al.296Variance of maternal permanent environmental effect <strong>in</strong> <strong>pre</strong>-<strong>wean<strong>in</strong>g</strong> has a large<strong>in</strong>fluence on GAIN120, because the peak of milk yield occurs between 1 and 120 daysof lactation. After 120 days and up to 205 days, the permanent environmental effect onweight ga<strong>in</strong> is practically <strong>in</strong>significant. Meyer et al. (1992) emphasize that the importanceof this component <strong>in</strong>creases <strong>in</strong> breeds with more milk yield potential. A large negativecovariance between direct and maternal additive effects <strong>for</strong> GAIN205 and GAIN120 wasfound, but <strong>for</strong> GAIN85 this covariance was positive and small.Weight ga<strong>in</strong> from birth to 120 days needs more studies, because W120 is littlemeasured <strong>in</strong> most breeds. The results of this research can be biased by the large number ofembryo transferred calves <strong>in</strong> the dataset, nursed by crossbred recipients. As related to thetrait GAIN85, the coefficients of heritability <strong>for</strong> direct and maternal effects of 0.12 and0.03, respectively, were lower than that reported by Paneto et al. (2002) <strong>in</strong> Nellore cattle<strong>for</strong> weight ga<strong>in</strong> between 120 and 240 days of age, where they observed 0.32 and 0.13 <strong>for</strong>direct and maternal heritabilities, respectively.Direct and maternal estimates of heritability <strong>for</strong> GAIN205 are similar to thosereported by Meyer et al. (1992) <strong>in</strong> a review study. However, the results <strong>pre</strong>sented <strong>in</strong> thispaper were higher than those <strong>pre</strong>sented by Lôbo et al. (2000) <strong>in</strong> their review, as well as byFernandes et al. (2002) study<strong>in</strong>g Charolais cattle and Cardoso et al. (2001) with the Angusbreed. All these studies reported a negative correlation between direct and maternal effects,which was also found <strong>in</strong> the <strong>pre</strong>sent study.Accord<strong>in</strong>g to Fernandes et al. (2002), when the correlation between direct andmaternal effects is negative and high, the maternal heritability becomes substantial <strong>in</strong> thecontribution to total heritability, as can be observed <strong>in</strong> Table 3. However, many breed<strong>in</strong>gprograms set this covariance at zero <strong>in</strong> genetic evaluations (Cardoso et al., 2001). Thiscan expla<strong>in</strong> lower genetic ga<strong>in</strong>s <strong>in</strong> several breed<strong>in</strong>g programs and should be considered <strong>in</strong>Braunvieh cattle <strong>in</strong> Brazil.<strong>Genetic</strong> and phenotypic correlations among <strong>pre</strong>-<strong>wean<strong>in</strong>g</strong> weights are shown <strong>in</strong>Table 4. When measurements were closer <strong>in</strong> time, the genetic correlation observed washigh. Phenotypic correlation followed the behavior of genetic correlation, but with generallylower values. Similar results were reported <strong>in</strong> the review by Lôbo et al. (2000). Ingeneral, high correlations between the weights were as expected, s<strong>in</strong>ce the weight at theyoungest age is a component of the weight at later age.Table 4. <strong>Genetic</strong> correlation above diagonal and phenotypic correlation below diagonal <strong>for</strong> weights at different ages.Trait BW W120 WWBW - 0.73 ± 0.078 0.76 ± 0.069W120 0.60 - 0.91 ± 0.027WW 0.54 0.78 -For abbreviations, see legend to Table 1.The highest genetic correlations were observed between the weight ga<strong>in</strong> and theweight at the upper limit of weight ga<strong>in</strong> (Table 5). Similar results were reported by Lôbo etal. (2000) and Mascioli et al. (2000), namely estimated genetic correlations of 0.96 and 0.97,respectively, <strong>for</strong> the correlation between WW and GAIN205.<strong>Genetic</strong>s and Molecular Research 8 (1): 291-298 (2009)©FUNPEC-RP www.funpecrp.com.br
<strong>Genetic</strong> <strong>parameters</strong> <strong>for</strong> <strong>pre</strong>-<strong>wean<strong>in</strong>g</strong> <strong>traits</strong> <strong>in</strong> Braunvieh cattle297Table 5. <strong>Genetic</strong> (r 2 ) and phenotypic correlation g (r2 ) between weights and weight ga<strong>in</strong>s.pTrait GAIN205 r 2 g ; r2 p GAIN120 r2 g ; r2 p GAIN85 r2 g ; r2 pBW 0.70 ± 0.089 ; 0.50 0.65 ± 0.093 ; 0.53 0.28 ± 0.171 ; 0.10W120 0.88 ± 0.039 ; 0.69 0.99 ± 0.002 ; 0.85 0.33 ± 0.140 ; 0.09WW 0.99 ± 0.033 ; 0.88 0.88 ± 0.037 ; 0.75 0.67 ± 0.089 ; 0.58For abbreviations, see legend to Table 1.In selection <strong>for</strong> GAIN120 and GAIN205, it is necessary to observe the genetic value<strong>for</strong> birth weight of the selected animal, due to moderate genetic correlation between GAIN205and GAIN120 with BW, to avoid high birth weights.Lôbo et al. (2000) reported an average genetic correlation between BW and GAIN205of 0.39, lower than that observed <strong>in</strong> this study on Braunvieh cattle. In Angus cattle, Cardosoet al. (2001) estimated a genetic correlation between BW and GAIN205 of -0.06. For all <strong>traits</strong>analyzed, phenotypic correlations were lower than genetic correlations, thus demonstrat<strong>in</strong>gthe high importance of the genetic analysis be<strong>for</strong>e selection.CONCLUSIONFor <strong>pre</strong>-<strong>wean<strong>in</strong>g</strong> weights, the coefficients of direct and maternal heritability <strong>in</strong>creasedfrom birth to <strong>wean<strong>in</strong>g</strong>, while the permanent environmental effect decreased. Correlations betweendirect and maternal effect were always negative, and also <strong>in</strong>creased from birth to <strong>wean<strong>in</strong>g</strong>,contribut<strong>in</strong>g to lower total heritability, be<strong>in</strong>g higher at birth and lower at <strong>wean<strong>in</strong>g</strong>.Maternal effect was very important <strong>for</strong> GAIN120, and reduced <strong>for</strong> GAIN85. In thistrait, the residual effect on variance of GAIN85 was greater than maternal genetic effects.A large negative correlation between direct and maternal components <strong>for</strong> GAIN120 andGAIN205 was estimated, but that was not found <strong>for</strong> GAIN85.When measurements were closer, the genetic correlation observed was high. <strong>Genetic</strong>correlation between birth weight and other <strong>traits</strong> <strong>in</strong>dicates that caution is necessary <strong>in</strong>select<strong>in</strong>g to <strong>pre</strong>vent calv<strong>in</strong>g problems. Weight ga<strong>in</strong> was strongly <strong>in</strong>fluenced by the weight ofthe upper limit of the ga<strong>in</strong>. There<strong>for</strong>e, the greater the weight at a determ<strong>in</strong>ed age, the greaterthe weight ga<strong>in</strong> will be up to this age.This study will help to have a better knowledge about genetic aspects of <strong>pre</strong>-<strong>wean<strong>in</strong>g</strong>growth <strong>traits</strong> <strong>in</strong> Braunvieh cattle, especially raised <strong>in</strong> tropical and sub-tropical areas, allow<strong>in</strong>gnew selection criteria to be <strong>in</strong>cluded <strong>in</strong> breed<strong>in</strong>g programs of this breed.ACKNOWLEDGMENTSresearch supported by FAPESP (Fundação de Amparo à pesquisa do Estado de SãoPaulo), and the Nucleus of Braunvieh Breeders of Brazilian Breeders Association of Braunviehand Brown Swiss Cattle.REFERENCESBennett GL and Gregory KE (1996). <strong>Genetic</strong> (co)variances among birth weight, 200-day weight, and post<strong>wean<strong>in</strong>g</strong> ga<strong>in</strong> <strong>in</strong>composites and parental breeds of beef cattle. J. Anim. Sci. 74: 2598-2611.<strong>Genetic</strong>s and Molecular Research 8 (1): 291-298 (2009)©FUNPEC-RP www.funpecrp.com.br
D.C. Cucco et al.298Boldman KG, Kriese LA, Van Vleck LD and Kachman SD (1995). A Manual <strong>for</strong> Use of MTDFREML: a Set of Programsto Obta<strong>in</strong> Estimates of Variances and Covariances (DRAFT). USDA-ARS (United States Department of Agriculture- Agricultural Research Service), L<strong>in</strong>coln.Campos BES, Razook AG, Packer IH and Barbosa C (1986). Fatores genéticos e ambientais que afetam pesos ao nascer ea desmama de bezerros Suíço x Guzerá. Bol. Industr. Anim. 43: 197-207.Cardoso FF, Cardell<strong>in</strong>o RA and Campos LT (2001). Componentes de (co)variância e parâmetros genéticos para caracteresprodutivos à desmama de bezerros Angus criados no Estado do Rio Grande do Sul. Rev. Bras. Zootec. 30: 41-48.Corrêa MBB, Dionello NJL and Cardoso FF (2006). Estimation of genetic <strong>parameters</strong> and (co)variance components <strong>for</strong><strong>pre</strong><strong>wean<strong>in</strong>g</strong> productive <strong>traits</strong> <strong>in</strong> Devon Cattle <strong>in</strong> Rio Grande do Sul. R. Bras. Zootec. 35: 997-1004.Cucco DC (2008). Estimativa de Parâmetros Genéticos para Características de Crescimento e Perímetro Escrotal na RaçaPardo Suíço Corte. Master thesis, Faculdade de Zootecnia e Engenharia de Alimentos/Universidade de São Paulo,Pirassununga. Available at [http://www.teses.usp.br/teses/disponiveis/74/74131/tde-11032008-090556/publico/5581102.pdf]. Accessed november 25, 2008.Eler JP, Ferraz JBS and Silva PR (1996). Parâmetros genéticos para peso, avaliação visual e circunferência escrotal na raçaNelore, estimados por modelo animal. Arq. Bras. Med. Vet. Zootec. 48: 203-213.Everl<strong>in</strong>g DM, Ferreira GBB, Rorato PRN, Roso VM, et al. (2001). Heritability estimates and genetic correlation of growthcharacteristics <strong>in</strong> the <strong>pre</strong><strong>wean<strong>in</strong>g</strong> period and scrotal circumference measurement at yearl<strong>in</strong>g <strong>for</strong> Angus-Nelore Beefcattle. R. Bras. Zootec. 30: 2002-2008.Fernandes HD, Ferreira GBB and Nogara PR (2002). Tendências e parâmetros genéticos para características pré-desmamaem bov<strong>in</strong>os da raça Charolês criados no Rio Grande do Sul. Rev. Bras. Zootec. 31: 321-330.Hagger C and Hofer A (1990). <strong>Genetic</strong> analyses of calv<strong>in</strong>g <strong>traits</strong> <strong>in</strong> the swiss black and white, Braunvieh and Simmentalbreeds by REML and MAPP procedures. Livest. Prod. Sci. 24: 93-107.Karsburg JHH (2003). Estimativas de Parâmetros Genéticos de Características de Carcaça Medidas por Ultra-sonografiae de Desenvolvimento Ponderal em Bov<strong>in</strong>os da Raça Santa Gertrudis. Master thesis, Faculdade de Zootecnia eEngenharia de Alimentos/Universidade de São Paulo, Pirassununga. Available at [http://www.teses.usp.br/teses/disponiveis/74/74131/tde-20112003-141652/publico/3431938.pdf]. Accessed november 25, 2008.Koots KR, Gibson JP, Smith C and Wilton JW (1994). Analyses of published genetic parameter estimates <strong>for</strong> beefproduction <strong>traits</strong>. 1. Heritability. Anim. Breed. Abstr. 62: 309-338.Lôbo RNB, Madalena FE and Vieira AR (2000). Average estimates of genetic <strong>parameters</strong> <strong>for</strong> beef and dairy cattle <strong>in</strong>tropical regions. Anim. Breed. Abstr. 68: 433-462.Marques LFA, Pereira JCC, Oliveira HN, Pereira CS, et al. (1999). Componentes de (co)variância e parâmetros genéticosde características de crescimento da raça Simental no Brasil (Variance components and genetic <strong>parameters</strong> estimates<strong>for</strong> growth <strong>traits</strong> of Simmental cattle <strong>in</strong> Brazil). Arq. Bras. Med. Vet. Zootec. 51: 363-370.Mart<strong>in</strong>s GA, Filho RM, Lima FAM and Lôbo RNB (2000). Influence of genetic and environment factors on the grow<strong>in</strong>g<strong>traits</strong> of animals from Nellore breed at Maranhão State. R. Bras. Zootec. 29: 103-107.Mascioli AS, El Faro L, Alencar MM, Fries LA, et al. (2000). <strong>Genetic</strong> and phenotypic <strong>parameters</strong> and pr<strong>in</strong>cipal componentsanalyses <strong>for</strong> body weight ga<strong>in</strong>s <strong>in</strong> Canchim cattle. R. Bras. Zootec. 29: 1645-1660.Meyer K (1992). Variance components due to direct and maternal effects <strong>for</strong> growth <strong>traits</strong> of Australian beef cattle. Livest.Prod. Sci. 31: 179-204.Paneto JCC, Lemos DC, Bezerra LAF, Mart<strong>in</strong>s Filho R, et al. (2002). Study of quantitative growth <strong>traits</strong> from 120 to 550days of age <strong>in</strong> Nellore cattle. R. Bras. Zootec. 31: 668-674.SAS (Statistical Analysis Systems) (2004). User’s guide. Version 9.1. SAS <strong>in</strong>stitute Inc., Cary.Siqueira RLPG, Oliveira JA, Lôbo RB, Bezerra LAF, et al. (2003). Additive genetic variability analysis <strong>in</strong> the growthcharacteristics of Nellore breed. Rev. Bras. Zootec. 32: 99-105.Willham RL (1972). The role of maternal effects <strong>in</strong> animal breed<strong>in</strong>g. 3. Biometrical aspects of maternal effects <strong>in</strong> animals.J. Anim. Sci. 35: 1288-1293.Wilson DE, Berger PJ and Willham RL (1986). Estimates of beef growth trait variances and heritabilities determ<strong>in</strong>ed fromfield records. J. Anim. Sci. 63: 386-394.<strong>Genetic</strong>s and Molecular Research 8 (1): 291-298 (2009)©FUNPEC-RP www.funpecrp.com.br