Genetic parameters for pre-weaning traits in ... - ResearchGate
Genetic parameters for pre-weaning traits in ... - ResearchGate
Genetic parameters for pre-weaning traits in ... - ResearchGate

You also want an ePaper? Increase the reach of your titles
YUMPU automatically turns print PDFs into web optimized ePapers that Google loves.
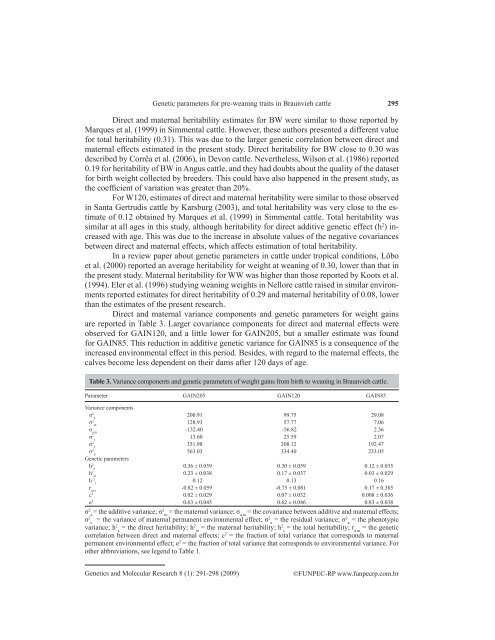
<strong>Genetic</strong> <strong>parameters</strong> <strong>for</strong> <strong>pre</strong>-<strong>wean<strong>in</strong>g</strong> <strong>traits</strong> <strong>in</strong> Braunvieh cattle295Direct and maternal heritability estimates <strong>for</strong> BW were similar to those reported byMarques et al. (1999) <strong>in</strong> Simmental cattle. However, these authors <strong>pre</strong>sented a different value<strong>for</strong> total heritability (0.31). This was due to the larger genetic correlation between direct andmaternal effects estimated <strong>in</strong> the <strong>pre</strong>sent study. Direct heritability <strong>for</strong> BW close to 0.30 wasdescribed by Corrêa et al. (2006), <strong>in</strong> Devon cattle. Nevertheless, Wilson et al. (1986) reported0.19 <strong>for</strong> heritability of BW <strong>in</strong> Angus cattle, and they had doubts about the quality of the dataset<strong>for</strong> birth weight collected by breeders. This could have also happened <strong>in</strong> the <strong>pre</strong>sent study, asthe coefficient of variation was greater than 20%.For W120, estimates of direct and maternal heritability were similar to those observed<strong>in</strong> Santa Gertrudis cattle by Karsburg (2003), and total heritability was very close to the estimateof 0.12 obta<strong>in</strong>ed by Marques et al. (1999) <strong>in</strong> Simmental cattle. Total heritability wassimilar at all ages <strong>in</strong> this study, although heritability <strong>for</strong> direct additive genetic effect (h 2 ) <strong>in</strong>creasedwith age. This was due to the <strong>in</strong>crease <strong>in</strong> absolute values of the negative covariancesbetween direct and maternal effects, which affects estimation of total heritability.In a review paper about genetic <strong>parameters</strong> <strong>in</strong> cattle under tropical conditions, Lôboet al. (2000) reported an average heritability <strong>for</strong> weight at <strong>wean<strong>in</strong>g</strong> of 0.30, lower than that <strong>in</strong>the <strong>pre</strong>sent study. Maternal heritability <strong>for</strong> WW was higher than those reported by Koots et al.(1994). Eler et al. (1996) study<strong>in</strong>g <strong>wean<strong>in</strong>g</strong> weights <strong>in</strong> Nellore cattle raised <strong>in</strong> similar environmentsreported estimates <strong>for</strong> direct heritability of 0.29 and maternal heritability of 0.08, lowerthan the estimates of the <strong>pre</strong>sent research.Direct and maternal variance components and genetic <strong>parameters</strong> <strong>for</strong> weight ga<strong>in</strong>sare reported <strong>in</strong> Table 3. Larger covariance components <strong>for</strong> direct and maternal effects wereobserved <strong>for</strong> GAIN120, and a little lower <strong>for</strong> GAIN205, but a smaller estimate was found<strong>for</strong> GAIN85. This reduction <strong>in</strong> additive genetic variance <strong>for</strong> GAIN85 is a consequence of the<strong>in</strong>creased environmental effect <strong>in</strong> this period. Besides, with regard to the maternal effects, thecalves become less dependent on their dams after 120 days of age.Table 3. Variance components and genetic <strong>parameters</strong> of weight ga<strong>in</strong>s from birth to <strong>wean<strong>in</strong>g</strong> <strong>in</strong> Braunvieh cattle.Parameter GAIN205 GAIN120 GAIN85Variance componentsσ 2 a200.91 99.75 29.08σ 2 m128.93 57.77 7.06σ a,m-132.40 -56.82 2.36σ 2 c13.60 25.59 2.07σ 2 e351.98 208.12 192.47σ 2 p563.03 334.40 233.05<strong>Genetic</strong> <strong>parameters</strong>h 2 a0.36 ± 0.059 0.30 ± 0.059 0.12 ± 0.035h 2 m0.23 ± 0.038 0.17 ± 0.037 0.03 ± 0.029h 2 t0.12 0.13 0.16r a,m-0.82 ± 0.059 -0.75 ± 0.081 0.17 ± 0.385c 2 0.02 ± 0.029 0.07 ± 0.032 0.008 ± 0.036e 2 0.63 ± 0.045 0.62 ± 0.046 0.83 ± 0.038σ 2 = the additive variance; a σ2 = the maternal variance; σ = the covariance between additive and maternal effects;m a,mσ 2 = the variance of maternal permanent environmental effect; c σ2 = the residual variance; e σ2 = the phenotypicpvariance; h 2 = the direct heritability; a h2 = the maternal heritability; m h2 = the total heritability; r = the genetict a,mcorrelation between direct and maternal effects; c 2 = the fraction of total variance that corresponds to maternalpermanent environmental effect; e 2 = the fraction of total variance that corresponds to environmental variance. Forother abbreviations, see legend to Table 1.<strong>Genetic</strong>s and Molecular Research 8 (1): 291-298 (2009)©FUNPEC-RP www.funpecrp.com.br