West Mojave Plan FEIR/S - Desert Managers Group
West Mojave Plan FEIR/S - Desert Managers Group
West Mojave Plan FEIR/S - Desert Managers Group

You also want an ePaper? Increase the reach of your titles
YUMPU automatically turns print PDFs into web optimized ePapers that Google loves.
CHAPTER THREEAFFECTED ENVIRONMENT3.1 PLANNING AND REGULATORY FRAMEWORKThe <strong>West</strong> <strong>Mojave</strong> planning area includes eleven cities and portions of four counties.These cities and counties have land use planning responsibility for the private lands locatedwithin their jurisdictions. Map 3-1 (see attached CD Rom) displays political boundaries and landownership within the planning area. Public lands within the western <strong>Mojave</strong> <strong>Desert</strong> are plannedfor and managed by the United States government (Bureau of Land Management, National ParkService and Department of Defense), and the State of California (CDFG, California Departmentof Parks and Recreation, and Caltrans). Land ownership political boundaries are displayed inMap 3-1. Table 3-1 lists the acreage of land within each political and land management entity(the acres given for the cities and towns do not include spheres of influence).The following discussion identifies, by jurisdiction, land use and development trends,planning, and management actions that may be affected by the proposed action.3.1.1 Bureau of Land Management3.1.1.1 California <strong>Desert</strong> Conservation Area <strong>Plan</strong>The BLM administers 3,263,874 acres of public lands within the planning area.Management is guided by the BLM’s California <strong>Desert</strong> Conservation Area <strong>Plan</strong>, adopted in 1980and amended on numerous occasions since then. Congress specifically directed the BLM toprepare the CDCA <strong>Plan</strong> the Federal Land Policy and Management Act of 1976. Finding that theCalifornia desert and its resources, “including certain rare and endangered species of wildlife,plants and fishes” are “seriously threatened by air pollution, inadequate Federal managementauthority, and pressures of increased use, particularly recreational use”, Congress stated that “theuse of all California desert resources can and should be provided for in a multiple use andsustained yield management plan to conserve these resources for future generations, and toprovide present and future use and enjoyment, particularly outdoor recreation uses, including theuse, where appropriate, of off-road recreational vehicles.” To accomplish this, BLM wasdirected to prepare a plan for the “management, use, development, and protection of public landswithin the California <strong>Desert</strong> Conservation Area” (of which the western <strong>Mojave</strong> <strong>Desert</strong> comprisesthe northwestern third). The plan would “take into account the principles of multiple use andsustained yield in providing for resource use and development, including, but not limited to,maintenance of environmental quality, rights of way, and mineral development.”Chapter 3 3-1
JURISDICTIONInyo Co.(Total Acreage)Kern Co.(Total Acreage)Kern Co.(Excluding Cities)Los Angeles Co.(Total Acreage)Los Angeles Co.(Excluding Cities)Riverside Co.(Total Acreage)San Bernardino Co.(Total Acreage)San Bernardino Co.(Excluding Cities)Table 3-1Acreage Summary by JurisdictionPRIVATE STATE LAND MILITARY BLM MAN- OTHER OTHER TOTALLAND (SUBDIVIDED) LAND AGED LAND FEDERAL PUBLIC ACREAGE30,057 12,658 – SLC 456,164 332,044 9 - NPS 174 831,221116 - USFS757,959 2,076 - SLC287,227 505,093 1,720 - USFS 1,568,64481 - CDFG14,489 – Parks593,766 [same] 281,577 494,306 [same] 1,388,014610,959 38 – SLC53,547 7,226 377 - USFS 684,60212,454 – Parks464,487 [same] 47,630 7,138 [same] 532,1259,231 2,784 – SLC10 – Parks1,621,024 53,503 – SLC3,861 - CDFG213 – Parks1,383,188 53,105 - SLC[same for others]41,815 208,170 - NPS 57 262,0661,870,508 2,377,671 84,510 – NPS91 - USFS167 - Tribal1,858,185 2.368,559 84,500 - NPS90 - USFS912 6,012,511807 5,748,7072 - TribalTulare Co. 1 25 26Adelanto (SB) 33,343 91 514 33,949Apple Valley (SB) 45,464 43 – SLC 1,347 59 46,912Barstow (SB) 19,027 40 – SLC 4,061 2,281 25,407California City (K) 84,519 4,757 89,276Hesperia (SB) 42,322 955 68 1 43,385Lancaster (LA) 60,592 60,592Palmdale (LA) 57,545 5,806 88 63,439Ridgecrest (K) 6,103 4,972 1,163 12,238Twentynine Palms (SB) 31,802 2,146 3,502 8 37,623Victorville (SB) 41,699 38 – SLC 5,030 346 47 47,160Yucca Valley (SB) 24,176 277 – SLC 1,052 2 25,508Total Acreage 3,029,23071,059 – SLC27,166 -Parks3,943 – CDFG2,667,445 3,263,874292,689 – NPS2,356 - USFS167 – Tribal1,143 9,359,070Chapter 3 3-2
The CDCA <strong>Plan</strong> assigns a “multiple use class” designation to each parcel of public land,and provides land use and management guidelines for each class. These classes include:• Class C – controlled use, that is, wilderness areas.• Class L -- limited use, protecting sensitive, natural, scenic, ecological, and culturalresource values. Public lands designated as Class L are managed to provide for generallylower-intensity, carefully controlled multiple use of resources, while ensuring thatsensitive values are not significantly diminished.• Class M -- moderate use, providing for a controlled balance between higher intensity usesand resource protection.• Class I -- intensive use, providing for concentrated use of lands and rresources to meethuman needs.Within the western <strong>Mojave</strong> <strong>Desert</strong>, 457,721 acres are designated Class C, 1,269,313 acres ClassL, 877,042 acres Class M and 378,467 acres Class I. About 281,331 acres are unclassified.The CDCA <strong>Plan</strong> also adopted 12 “plan elements.” Each element provides desert-wideplanning decisions that focus on a major resource or issue of public concern. Management ofsensitive plant and animal species, including the designation of BLM crucial habitat and habitatmanagement areas, is provided by the wildlife element. Procedures for establishing a motorizedvehicle access network are set forth in the motorized vehicle access element.3.1.1.2 Areas of Critical Environmental ConcernThirty areas of critical environmental concern have been established by the BLM withinthe western <strong>Mojave</strong> <strong>Desert</strong>. These were designated by the 1980 CDCA <strong>Plan</strong> or added bysubsequent amendments to that plan. Specific management plans have been prepared for most ofthese areas. The ACECs that would be affected by the <strong>West</strong> <strong>Mojave</strong> <strong>Plan</strong> are described below 1 .Afton Canyon (4,726 acres): This ACEC protects a sensitive <strong>Mojave</strong> River ripariancommunity and the scenic canyon in which it is located. An Afton Canyon Natural Areamanagement plan (1989) was prepared in cooperation with the CDFG under the Sikes Act andcovers a larger area than the ACEC. The plan protects the ACEC and the adjacent desert habitatin the Cady Mountains, which is occupied habitat for bighorn sheep and contains nest sites forprairie falcon and golden eagle. Visitor facilities include two campgrounds, an equestriancampground, the <strong>Mojave</strong> Road, and interpretative signs and kiosks.1 The <strong>West</strong> <strong>Mojave</strong> <strong>Plan</strong> would not affect the following ACECs: Amboy Crater, Bedrock Springs, BigMorongo Canyon, Soggy Dry Lake Creosote Rings, Upper Johnson Valley Yucca Rings and Whitewater Canyon.Chapter 3 3-3
The 1989 management plan recommended these amendments to the CDCA <strong>Plan</strong>:• Expansion of the boundary of the ACEC by 3,840 acres, and deletion of 480 acres,making the expanded ACEC 8,160 acres in size.• Withdrawal of all lands within the expanded ACEC boundary from mineral entry.• Changing the CDCA <strong>Plan</strong> multiple use class designations M to L on certain lands withinthe expanded ACEC.Barstow Woolly Sunflower (314 acres): BLM established a botanical ACEC northeastof Kramer Junction to protect the Barstow woolly sunflower. Although the area protects arelatively large population of this species, it represents only a small proportion of the overallrange, which is limited to the western <strong>Mojave</strong> <strong>Desert</strong>. The desert tortoise and Mohave groundsquirrel are also found within the ACEC. The State of California owns nine sections of land tothe east and west, which CDFG manages for protection of desert plants and animals.Bedrock Springs (785 acres): Bedrock Springs, located at the edge of the GoldenValley Wilderness, was established by the CDCA <strong>Plan</strong> to protect prehistoric values.Black Mountain (61,806 acres): The Black Mountain ACEC is one of the largest in thewestern <strong>Mojave</strong> <strong>Desert</strong> to protect the prehistoric and Native American values of this areanorthwest of Barstow. A management plan was approved in 1988. The ACEC lies entirelywithin the proposed Superior-Cronese and Fremont-Kramer DWMAs. The southeastern half iswithin the Black Mountain Wilderness. It includes critical habitat for the desert tortoise, andknown occupied habitat for the <strong>Mojave</strong> ground squirrel, LeConte’s thrasher, desert cymopterusand Barstow woolly sunflower. Nest sites are present for golden eagle and prairie falcon.Calico Early Man Site (898 acres): This National Register Property was established asan ACEC in 1980, and a management plan was prepared in 1984. The plan designated a vehicleroute network and specified ways to protect the evidence of ancient human occupation.Christmas Canyon (3,444 acres): The Christmas Canyon ACEC protects prehistoricvalues. Most of the ACEC lies within the Spangler Hills Open Area in San Bernardino County.The 1988 ACEC management plan prescribed ways that the archaeological resources could beprotected within an area open to recreational vehicle use.Cronese Basin (10,226 acres): The BLM designated the Cronese Lakes, north ofInterstate 15 between Barstow and Baker, as an ACEC to protect valuable cultural and naturalresources. Ephemeral wetlands are present on the lakes, which serve as stopover points formigratory waterbirds and nesting sites for many species during very wet years. Mesquitehummocks and desert willow washes add to the biological importance, and the dunes and sandsheets are occupied habitat for the <strong>Mojave</strong> fringe-toed lizard. The desert tortoise is found in lowdensities. A management plan was published in 1985.Chapter 3 3-4
<strong>Desert</strong> Tortoise Research Natural Area (25,695 acres): The CDCA <strong>Plan</strong> of 1980designated lands north of California City in Kern County as an ACEC and a Research NaturalArea. A management plan for the ACEC, prepared under authority of the Sikes Act, wasapproved in 1988. The ACEC is jointly managed by the BLM, CDFG and the <strong>Desert</strong> TortoisePreserve Committee, a non–profit group established to acquire and manage lands for protectionof the desert tortoise.Fossil Falls (1,667 acres): The Fossil Falls ACEC was established in 1980 to protectprehistoric values. A management plan was approved in 1986.Great Falls Basin (9,726 acres): The Great Falls Basin ACEC management plan wasprepared in 1987 in cooperation with the CDFG under the Sikes Act. It adjoins the Indian JoeCanyon Ecological Reserve and the northern portion is within the Argus Range Wilderness. Thesouthern portion is within a BLM wilderness study area. The western boundary is contiguouswith the China Lake Naval Air Weapons Station.The ACEC protects unique and valuable wildlife and scenic resources. Foremost amongthese are the dozens of seeps and springs that serve as habitat for the threatened Inyo Californiatowhee. Designated critical habitat for the towhee is present within the ACEC. In addition,large populations of quail and chuckar are present, as is a remnant population of bighorn sheep.Raptors nesting within the ACEC include golden eagle, prairie falcon, and long-eared owl.Potential habitat exists for the Panamint alligator lizard.• Harper Dry Lake (475 acres): The ACEC was established to protect the remnantmarshes at the southwestern edge of Harper Dry Lake. The marsh and alkali wetlandcommunity bordering Harper Dry Lake hold potential for discovery of several rare andrestricted-range plant species.The playa bordering the marshes supported nesting <strong>West</strong>ern snowy plovers in the past,and surveys conducted in 2001 found these birds to be present and probably nesting. HarperDry Lake is an area important for the conservation of <strong>West</strong>ern snowy plover nesting habitat.Harper Dry Lake is recognized as a Key Raptor Area by the BLM, which has designated223 such areas nationwide. Key Raptor Areas are places known to be significant habitats forselected species of birds of prey, and Harper Dry Lake is one of seven Key Raptor Areas in the<strong>Mojave</strong> <strong>Desert</strong>. The species known to utilize the habitat at Harper Dry Lake are northern harrier,short-eared owl, ferruginous hawk and long-eared owl.Harper Dry Lake has been improved as a Watchable Wildlife site, a program to provideaccess and facilities to visitors for birdwatching, photography and passive recreation.Arrangements are now being made to supply surface water to the remnant marsh, andinterpretative kiosks, restrooms, and trails have been installed.Jawbone/Butterbredt (187,486 acres): The 1982 Sikes Act <strong>Plan</strong> for JawboneButterbredt ACEC addressed the Sierra/<strong>Mojave</strong>/Tehachapi Ecotone Wildlife HabitatManagement Area, a designated “special area” in the CDCA <strong>Plan</strong>. The ACEC plan incorporatedChapter 3 3-5
all of the Rudnick Common Grazing Allotment and the vehicle management boundaryagreement between the BLM and the Rudnick Estate Trust. Motorized vehicle routes of travelwere designated within the ACEC, which includes both designated wilderness and the JawboneCanyon Open Area. The Pacific Crest Trail crosses the ACEC as well.The ACEC was established to manage and protect significant cultural and wildlife valuesof this transition zone between the mountains and the northwestern <strong>Mojave</strong> <strong>Desert</strong>. Among thewildlife habitats present are Butterbredt Springs, an important migratory bird stopover site,habitat for the yellow-eared pocket mouse in Kelso Valley, and the raptor and vulture migratorycorridor between the Kern River Valley and the <strong>Mojave</strong> River. Nearly the entire range of a <strong>West</strong><strong>Mojave</strong> endemic, the Kelso Creek monkeyflower, is located within the ACEC.Juniper Flats (2,528 acres): An ACEC was established for the Juniper Flats CulturalArea in 1980, and a management plan was prepared in 1988. The foothill area south of AppleValley containing springs and riparian habitat in a dense stand of junipers was an importantNative American habitation and special use site. Juniper Flats also provides important habitatfor the San Diego horned lizard and the gray vireo. The Willow fire in 2000 burned over theentire ACEC, leading to a temporary closure of the area until vegetative recovery had begun.Juniper Flats is an important equestrian riding area and provides access to the Deep Creek hotsprings in the San Bernardino National Forest.Last Chance Canyon (5,913 acres): The CDCA <strong>Plan</strong> designated Last Chance Canyonin the El Paso Mountains as an ACEC in 1980. A <strong>Plan</strong> Amendment in 1984 adjusted theboundaries to include additional prehistoric sites. This amendment implemented arecommendation of the ACEC management plan, which was completed in 1982. Thearchaeological sites are part of a larger archaeological district placed on the National Register ofHistoric Places in 1971.Manix (2,897 acres): The Manix ACEC, located 20 miles northeast of Barstow alongthe <strong>Mojave</strong> River, was established in 1990 to protect paleontological and cultural resources.This site contains blowsand habitat for the <strong>Mojave</strong> fringe-toed lizard. No management plan hasbeen prepared.<strong>Mojave</strong> Fishhook Cactus (628acres): A CDCA <strong>Plan</strong> Amendment established the<strong>Mojave</strong> fishhook cactus ACEC in 1984. The ACEC is composed of two separate parcels in theBrisbane Valley. The purpose of the ACEC is to protect the yellow-spined form of the <strong>Mojave</strong>fishhook cactus. Subsequent studies have shown that this area may be important to the Mohavemonkeyflower as well. A management plan was completed in 1990, which designated motorizedvehicle routes within the ACEC.Rainbow Basin (4,087 acres): This ACEC, established in 1980, lies ten miles north ofBarstow. It includes two campgrounds, a scenic loop drive, hiking trails and an interpretive trail.The area is popular with visitors who come to see the colored geological formations. The ACECprotects two nest sites for the prairie falcon. The ACEC management plan, completed in 1991,addressed both the ACEC and a larger surrounding area where route designation wasaccomplished and recommendations were made for campground and trail improvements andChapter 3 3-6
closure to target shooting. Hunting is allowed.Red Mountain Spring (717 acres): This area was designated as an ACEC by theCDCA <strong>Plan</strong> to protect prehistoric values. A 1982 CDCA <strong>Plan</strong> Amendment listed this area asclosed to vehicle travel. A management plan was completed in 1987. This ACEC was includedin the route designation inventory and designation process for the Red Mountain subregion. Itwas formerly called Squaw Spring.Rodman Mountains Cultural Area (6,204 acres): A 1988 CDCA <strong>Plan</strong> Amendmentestablished this ACEC to protect cultural resources. Most of it is within the Rodman MountainsWilderness. Portions outside the wilderness are part of the Ord-Rodman route designationsubregion. The site contains raptor nests and limited desert tortoise habitat. No managementplan has been prepared.Rose Springs (859 acres): An area surrounding Rose Springs in Inyo County wasdesignated as an ACEC by the CDCA <strong>Plan</strong> to protect prehistoric values. Access is limited by agate, which has been vandalized in the past. A management plan was prepared in 1985. Itrecommended closure of the ACEC to motorized vehicles. Access is via a transmission line roadand the Los Angeles Aqueduct road.Sand Canyon (2,609 acres): The Sand Canyon ACEC was established to protectriparian habitat and wildlife in a canyon on the eastern slope of the Sierra Nevada Mountains. Itis one of the most diverse areas in the <strong>West</strong> <strong>Mojave</strong> for species of small mammals and supports awide variety of reptiles and birds. Two species nearly endemic to the <strong>West</strong> <strong>Mojave</strong> are foundwithin the ACEC: the Ninemile Canyon phacelia and the yellow-eared pocket mouse. Theriparian habitat is important to migratory birds, including the willow flycatcher. An ACECmanagement plan was prepared in 1989.Short Canyon (754 acres): The Short Canyon ACEC was established by an amendmentto the CDCA <strong>Plan</strong> in 1988. Most of the ACEC lies within the Owens Peak Wilderness. Thepurpose of the ACEC is to protect the unusual vegetation and diverse flora. Short Canyon isknown to support occurrences of Charlotte’s phacelia (Phacelia nashiana), a limited-range plantwhose distribution falls almost entirely within the western <strong>Mojave</strong> <strong>Desert</strong>. In addition, asignificant population of the state-listed <strong>Mojave</strong> tarplant (Deinandra [Hemizonia] mohavensis)was detected in the canyon in 1998. A management plan was prepared in 1990. The primarymanagement action was to exclude grazing from the ACEC. This measure has beenimplemented through fencing and placement of cattle guards.Steam Well (41 acres): This ACEC protects historic and prehistoric values. It lieswithin the Golden Valley Wilderness in San Bernardino County.Trona Pinnacles (4,055 acres): The 1989 management plan for the Trona PinnaclesACEC focused on protection of the outstanding scenery and geological features of this area tenmiles south of Trona. The site is used for commercial filming and sightseeing. At least oneprairie falcon nest site was reported within the ACEC, but falcons have not been recorded therefor the past ten years.Chapter 3 3-7
<strong>West</strong>ern Rand Mountains (17,877 acres): The <strong>West</strong>ern Rand Mountains ACECformerly supported high densities of desert tortoises, though tortoise numbers have declinedsubstantially from historical levels. The ACEC is believed to support the Mohave groundsquirrel, and is known to harbor the burrowing owl and the LeConte’s thrasher. A RandMountains Fremont Valley Management <strong>Plan</strong> was completed in 1993. This plan, which alsoaddressed surrounding lands such as Koehn Lake and lands to the northeast, was prepared incooperation with the CDFG under authority of the Sikes Act. It received a “no jeopardy”Biological Opinion from the USFWS. The plan recommended several amendments to theBLM’s CDCA <strong>Plan</strong>:• Expand the <strong>West</strong> Rand Mountains ACEC by 13,120 acres• Change Class M lands in the ACEC expansion and adjacent alluvial fan areas to Class L.• Withdraw 32,590 acres within the Rand Mountains – Fremont Valley management areafrom mineral location and entry. The 6,090-acre Koehn Lake and an additional 8,320acres within the management area will remain as class M and open to mineral entry.• Close the entire management area to off highway vehicle use except for 129 miles ofdesignated open routes.• Categorize portions of the Rand Mountains – Fremont Valley management area as <strong>Desert</strong>Tortoise Category I habitat. These lands lie on both sides of the Randsburg-<strong>Mojave</strong> Roadsouthwest of Red Mountain and are shown on Illustration #9 illustrated in the 1993management plan.The Rand Mountains Fremont Valley Management <strong>Plan</strong> reduced the number of openroutes by 90%. Signs were installed to identify open and closed routes of travel. All open routesand many, but not all, closed routes were signed. In selected areas, hay bails and plastic safetyfencing have been used to stop motorcycle use on closed routes or to stop cross-country travel.Hay bales and fencing have been more effective in reducing non-compliance that signs alone.The plan established a goal of ranger patrols eight hours per week plus eight hours eachweekend from March 1 to June 30, September 1 to November 1, and holiday weekends. Rangerstaffing levels have not increased sufficiently to fully achieve this goal over the entire periodsince the plan was approved in 1993. During 2002, one Ranger was assigned primary patrolresponsibilities for the Rand Mountains, Fremont Valley and the <strong>Desert</strong> Tortoise Natural Area.Patrol effort for the region is now meeting the management goal.3.1.1.3 Wilderness AreasBy enacting the California <strong>Desert</strong> Protection Act of 1994, Congress designated 69wilderness areas in southern California and directed that they be administered by the BLMpursuant to the Wilderness Act of 1964. Seventeen of these areas are within or partially withinthe planning area. Table 3-2 lists these 17 wilderness areas, together with the amount andChapter 3 3-8
percentage of public land ownership within each. For a detailed description of each wildernessarea, see Appendix E.WILDERNESSNUMBERTable 3-2Wilderness Areas Within The<strong>West</strong>ern <strong>Mojave</strong> <strong>Plan</strong>ning AreaWILDERNESS PERCENT PUBLIC LANDAREA PUBLIC LAND ACRESTOTAL ACRES55 Argus Range 95.8 17,493 18,26223 Bighorn Mountain 99.6 26,681 26,79039 Black Mountain 98.2 20,542 20,92944 Bright Star 97.3 7,824 8,04222 Cleghorn Lakes 82.6 32,857 39,79863 Coso Range 94.2 49,295 52,32065 Darwin Falls 92.0 7,935 8,62043 El Paso Mountains 97.5 23,675 24,27841 Golden Valley 99.9 36,487 36,51540 Grass Valley 91.1 29,904 32,83545 Kiavah 87.9 18,201 20,70335 Newberry Mountains 73.2 20,300 27,74651 Owens Peak 95.4 46,733 49,00931 Rodman Mountains 86.8 29,782 34,31554 Sacatar Trail 99.8 33,078 33,13220 San Gorgonio 61.2 25,403 41,52821 Sheephole Valley 96.3 32,625 33,891TOTAL 90.1 458,814 508,715The purpose of wilderness, as defined in section 2(a) of the Wilderness Act, is “...toassure that an increasing population, accompanied by expanding settlement and growingmechanization, does not occupy and modify all areas in the United States ... leaving no landsdesignated for preservation and protection in their natural condition....”. Further, wilderness isdefined in Section 2(c) of the Wilderness Act to be areas “...where the earth and its communityof life are untrammeled by man, where man himself is a visitor who does not remain. An area ofwilderness is further defined to mean in this Act an area of undeveloped Federal land retainingits primeval character and influence, without permanent improvements or human habitation,which is protected and managed so as to preserve its natural conditions…”Section 4(c) of the Wilderness Act prohibits certain uses of wilderness. Theseprohibitions include commercial enterprise, permanent roads, temporary roads, use of motorvehicles, motorized equipment or motorboats, landing of aircraft, use of other forms ofmechanical transport, and structures or installations. There are three classes of exceptions tosome or all of the prohibitions. These include private existing rights (e.g., rights associated witha lease for a microwave tower that existed at the time of wilderness designation), actionsnecessary to meet the minimum requirements for the administration of the area, (e.g., use ofmotorized equipment to remove hazardous materials), and “Special Provisions” (e.g., livestockgrazing that was established prior to designation).Chapter 3 3-9
The California <strong>Desert</strong> Protection Act, at Title I for BLM Wilderness, provides formotorized vehicle access for (1) fish and wildlife management activities by appropriate Stateagencies and (2) law enforcement. At Title VII, the CDPA establishes explicit federal waterrights, allows access for Indian religious purposes, and provides mandates and procedures foracquiring State and private inholdings.Wilderness areas include important habitat of several <strong>West</strong> <strong>Mojave</strong> species of concern.Foremost among these are the bighorn sheep, prairie falcon, and golden eagle. The majority ofthe known golden eagle and prairie falcon nest sites are within Wilderness. <strong>Desert</strong> tortoises arefound at the edges of several wilderness areas, such as the Newberry Mountains and RodmanMountains.Five of the 17 Wilderness Areas are encompassed or partially encompassed withincritical tortoise habitat. These include the Rodman Mountains, Newberry Mountains, BlackMountain, Grass Valley and portions of Golden Valley wilderness areas. The overlap ofwilderness areas with critical habitat for other species is not yet determined, but the acreage isestimated to be small.3.1.1.4 Land Tenure Adjustment ProgramIn January 1991, BLM adopted a “<strong>West</strong>ern <strong>Mojave</strong> Land Tenure Adjustment Program,”(LTA Program) developed jointly with Edwards Air Force Base and the County of San Bernardino.The purpose of the LTA program was to address potential conflicts surrounding the development ofprivate lands adjacent to public lands and beneath airspace utilized by EAFB. The agencies wereconcerned (1) that such development could impact the management of natural resources on adjacentpublic lands, and (2) that Air Force use of airspace above high-density residential developments onprivate land could lead to public noise and safety complaints.To prevent these conflicts from arising, the LTA Program proposed a voluntary landacquisition program based on the exchange of scattered parcels of public lands near urban centers forprivate inholdings in more remote areas. The LTA Program identified Consolidation Zones whereexchange-based land acquisition would be focused, Disposal Zones composed of scattered publicland parcels to use as an “exchange base”, and Retention Zones, wherein the current land ownershippattern would be maintained.The 1991 Record of Decision indicated BLM’s intent to dispose 105,000 acres of publicland, acquire 255,000 acres and retain 417,000 acres. Of the 672,000 acres of public lands either tobe retained or acquired, 620,000 would be classified as “Multiple Use Class L”, and 52,000 acreswould be classified as “Multiple Use Class M”; no unclassified lands would remain within the LTAproject area. By mid-2001, BLM had acquired 61,247 acres within the LTA project area. Thesewere obtained through exchanges for public lands within the Disposal Zone, such as mineralizedpublic lands in and adjacent to the U. S. Borax mine at Boron. (Bureau of Land Management,Annual Report to Edwards Air Force Base, August 15, 2001.)Chapter 3 3-10
As of March 2004, BLM had acquired 61,247 acres through the LTA program. In exchange,BLM has provided 18,359 acres to non-government entities.3.1.2 Other State and Federal Agencies3.1.2.1 United States National Park ServiceThe National Park Service manages 294,500 acres within the southern reach of theplanning area. This is the northern half of Joshua Tree National Parkwhere <strong>Mojave</strong> <strong>Desert</strong>vegetation and wildlife prevail before entering the transition to the somewhat different conditionsfound in the Colorado <strong>Desert</strong> subdivision of the Sonoran <strong>Desert</strong>. Conservation managementwithin JTNP is important for protection of the adjacent Pinto DWMA for the desert tortoise,bats, the <strong>Mojave</strong> fringe-toed lizard, the Little San Bernardino Mountains gilia, bighorn sheep,and a diversity of more common desert plants and wildlife.3.1.2.2 California Department of Fish and GameCDFG has acquired lands throughout the western <strong>Mojave</strong> <strong>Desert</strong> by direct purchase forwildlife conservation or by acceptance of mitigation and compensation lands from landdevelopers. CDFG owns a total of 14,550 acres within the planning area. The location andstatus of these lands is described below.Camp Cady Wildlife Area (1,552 acres): Camp Cady is a riparian oasis on the <strong>Mojave</strong>River, located between Barstow and Afton Canyon. The CDFG manages this site for wildlifeprotection, and it serves as a refugium for the endangered <strong>Mojave</strong> tui chub, an endemic fish. Themesquite thickets and riparian forest support a number of declining bird species, includingLucy’s warbler, yellow-breasted chat, yellow warbler, summer tanager and LeConte’s thrasher(Schroeder, 1993, Tennant, 2002). The highest numbers of Lucy’s warbler within the western<strong>Mojave</strong> <strong>Desert</strong> occur at Camp Cady, and this site is important for nesting and wintering raptors,including golden eagle, prairie falcon, and ferruginous hawk. The western portion of CampCady contains sand dunes and hummocks supporting the <strong>Mojave</strong> fringe-toed lizard.Studies of the vegetation and hydrology at Camp Cady have shown a decline in the vigorof the riparian habitat, including stress and failure in reproduction of mesquite thickets.Lowering of the groundwater table during the spring is the identified cause (Lines, 1999).Fremont Valley Ecological Reserve (1,090 acres): The CDFG owns five propertieswithin desert tortoise critical habitat in the Fremont Valley. The lands are managed forconservation of the desert tortoise and Mohave ground squirrel. Other species, includingLeConte’s thrasher, Barstow woolly sunflower and desert cymopterus may occur, but have notbeen verified.Hinkley Conservation Easement (7.5 acres): CDFG owns a conservation easement ona parcel near Hinkley Road south of Highway 58 about nine miles west of Barstow.Chapter 3 3-11
Indian Joe Spring Ecological Reserve (546 acres): The Indian Joe Spring EcologicalReserve consists of a parcel in a canyon of the Argus Range in Inyo County. This area containssignificant riparian habitat and protects the endangered Inyo California towhee. Other riparianbirds utilize the canyon during migration and for nesting, and both nesting and communal roosthabitat is present for the long-eared owl. The surrounding lands provide nest sites for prairiefalcon and golden eagle, and the water in the canyon supports a healthy population of quail andchuckar.Indian Wells Valley Mitigation Lands (80 acres): CDFG obtained a parcel adjacent toLittle Dixie Wash in Kern County with known occupied habitat for the desert tortoise, Mohaveground squirrel, and LeConte’s thrasher.King Clone Ecological Reserve (488 acres): A reserve was established to protectancient creosote bush vegetation, including the oldest known specimen, a circular shrubestimated to be 11,700 years old. This reserve is surrounded by the BLM’s Johnson Valley OpenArea north of Lucerne Valley and has been fenced.<strong>West</strong> <strong>Mojave</strong> <strong>Desert</strong> Ecological Reserve (11,817 acres): CDFG owns 22 propertiesnorth of Highway 58 between Barstow and Kramer Junction. These lands are within deserttortoise critical habitat and the Fremont-Kramer DWMA. The reserve contains occupied habitatfor desert tortoise, Mohave ground squirrel, LeConte’s thrasher and Barstow woolly sunflower.Other target species (e.g. desert cymopterus) may occur but have not been verified.3.1.2.3 California Department of Parks and RecreationThe California Department of Parks and Recreation owns 25,400 acres that it operates asState Parks in four separate units. In addition, the CDPR’s Division of Off-highway Vehiclescontributes funds annually to maintain and monitor BLM Open Areas. The conservation landsaffording protection to species addressed by the <strong>West</strong> <strong>Mojave</strong> <strong>Plan</strong> are described below.Antelope Valley California Poppy Reserve: Located within Los Angeles County 15miles west of Lancaster, the 1,750 acre Antelope Valley California Poppy Reserve protectsextensive wildflower fields and receives thousands of visitors annually. The park is fenced toexclude grazing and prescribed burns are conducted to maintain the habitat. The reserve alsosupports nesting burrowing owls and provides wintering habitat for a variety of raptors,including the golden eagle, prairie falcon, northern harrier, and ferruginous hawk.Red Rock Canyon State Park: The Park encompasses the southwestern portion of theEl Paso Mountains, and was established for protection of outstanding scenic values and wildlifehabitat. Within the 26,000-acre park is the majority of the range of two narrow endemic plantspecies, the Red Rock poppy and the Red Rock tarplant. The tarplant is listed as endangered bythe State of California. The mountainous terrain contains nest sites for prairie falcons, and twounique alkali seeps support the alkali mariposa lily. Red Rock Canyon State Park provides alinkage between BLM lands to the east and west, and lies within the proposed Mohave GroundSquirrel Conservation Area.Chapter 3 3-12
Ripley Joshua Tree Woodland: The state established the 566 acre Ripley reserve toprotect a Joshua tree and juniper woodland. This natural community has nearly disappeared inthe Antelope Valley. Most of the site is fenced, and restoration efforts are underway.Saddleback Butte State Park: Protection of Joshua tree woodland was the reason forestablishing the 3,336-acre Saddleback Butte State Park. The desert floor surrounding the butteshas blowsand soils that support the westernmost population of the <strong>Mojave</strong> fringe-toed lizard andexhibits an outstanding display of wildflowers in wet years. Birds of prey nest on the buttes, andthe Mohave ground squirrel is found on some of the surrounding lands to the north.3.1.2.4 California Department of TransportationCaltrans has been a major provider of protected habitat in the state for the past severalyears. Caltrans purchases replacement habitat as compensation for loss due to highwayimprovements, including some of the CDFG lands northeast of Kramer Junction. Thesecommitments normally are specified as terms and conditions of biological opinions from theUSFWS to the Federal Highways Administration (FHWA), which provides federal funding tomajor Caltrans projects, and as requirements associated with 2081 permits from CDFG.3.1.3 Local JurisdictionsCounties, cities and towns have land use planning authority over private lands in the<strong>West</strong> <strong>Mojave</strong> planning area. California law requires that local jurisdictions adopt and maintain ageneral plan as a guide to future development within their communities. The general planincludes a land use element that describes the distribution and intensity of land uses expected todevelop within the jurisdiction over time, as well as a conservation element that establishespolicy for the management of natural resources, including biological resources.Cities and counties are required to conduct environmental review of developmentprojects proposed within their jurisdictions pursuant to the California Environmental QualityAct. This review includes an assessment of the proposed development’s affect on biologicalresources. In addition, some jurisdictions have adopted ordinances that establish biologicalmitigation requirements for ministerial permits not subject to CEQA. Figure 3-1 provides anoverview of the existing review process for development projects that have the potential to affectlisted or sensitive species. This process may vary somewhat by jurisdiction.Following is a summary of existing development patterns, land use and conservationpolicies directing future development in the <strong>West</strong> <strong>Mojave</strong>’s cities and counties.3.1.3.1 Inyo CountyMost of the private land available for development is located along the Highway 395corridor. According to the county’s 1984 General <strong>Plan</strong> Land Use Element, future populationgrowth is expected to occur primarily in the Owens Valley. The Olancha area, at the verynorthern end of the planning area, has been designated by the General <strong>Plan</strong> as an urbanizing areaChapter 3 3-13
with a full range of urban land use types including residential, commercial and industrial uses.The highest residential densities planned for this area are Rural High (one acre minimum parcelsize) and Rural Medium (2 ½ acre minimum parcel size). Existing and planned development atHaiwee, Dunmovin, Coso Junction, and Little Lake is oriented towards highway servicecommercial, residential densities of one-acre minimum parcel size and greater, and agriculturalactivities. The Homewood Canyon area of the county has been designated for residential use atdensities ranging from one dwelling unit per five to ten acres.Land use goals for the county include creating opportunities for reasonable expansion ofcommunities in a logical and contiguous manner, while providing and protecting open spaceareas; guiding growth to areas where services can accommodate urban growth; providing a rangeof commercial and industrial land uses to meet future needs; promoting recreation and a diversetourist industry; and maintaining and expanding the county tax base.The 1981 Conservation and Open Space Element of the county general plan, at page 22,has the following goal pertinent to biological resources: “Protect, conserve, develop and utilizenatural resources, while at the same time protecting the environment.”The Inyo County General <strong>Plan</strong> also provides for the designation of EnvironmentalResource Areas (ERA) where special management attention is provided to protect the mostimportant and critical environmental resources. Several sites within the planning area have beendesignated as ERAs including the Argus Bighorn Sheep Range, Haiwee Botanical Area, ChinaLake Naval Weapons Center, Rose Spring, and Little Lake-Fossil Falls. Residential densities forprivate lands within these areas are limited to one dwelling unit per 40 acres. Several generalplan policies are established for the ERAs that support cooperation between public agencies,encourage additional wildlife studies, encourage development and maintenance of fisheries,retention of riparian vegetation and management of riparian areas under principles of multipleuse. (Conservation and Open Space Element of Inyo County <strong>Plan</strong> at pages 31 through 37.)3.1.3.2 Kern CountyMost of the urbanized development within the unincorporated desert area of the countyoccurs around <strong>Mojave</strong>, Rosamond, and the Indian Wells Valley area near Ridgecrest. The LandUse, Open Space and Conservation Element of the County General <strong>Plan</strong> calls for thedevelopment of urban densities only in areas reasonably capable of receiving public services oralternative septic systems and encourages (1) higher density residential in urban areas nearcommercial facilities, (2) a variety of housing types and price ranges; and (3) the clustering ofdevelopment as a means of preserving open space. A density bonus of 20% over general plandensities is allowed for residential development that provides complete public infrastructureimprovements (County General <strong>Plan</strong> Land Use, Open Space, and Conservation Element at 5-2through 5-3). Lower density residential, resource and agricultural uses exist throughout most ofthe remaining area.The Kern County General <strong>Plan</strong>, at page 8-5, has the following policy pertinent tobiological resources: “Habitats of threatened or endangered species should be protected to thegreatest extent possible.” The county general plan also provides for sensitive wildlife protectionChapter 3 3-14
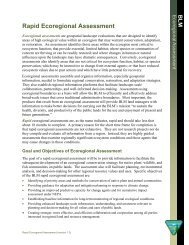
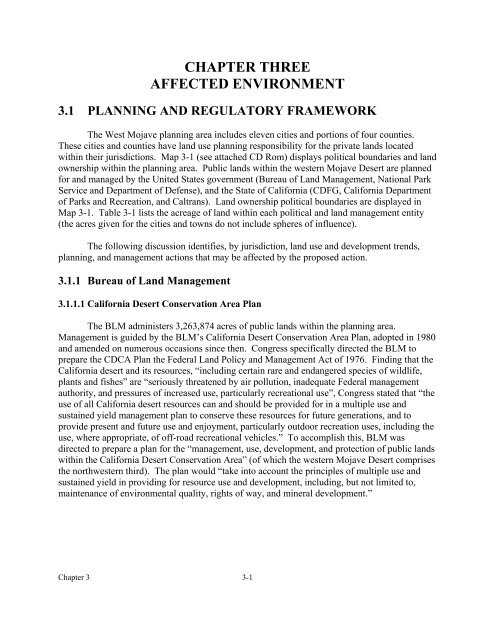
through “resource use” designation. Three resource areas list wildlife and botanical preservesamong their primary permitted uses: Resource Reserve, Extensive Agriculture and ResourceManagement Areas. The Resource Management Areas include important open space lands andwildlife habitat (page 8-3). These areas are primarily for “recreational activities, livestockgrazing…ranching facilities, wildlife and botanical preserves … one single-family dwelling unit”(page 8-3). The resource designations limit development to one dwelling unit per 20 acres (page6-1). There are twelve areas zoned for Specific <strong>Plan</strong>s within Kern County. These areas requiresurveys and mitigation for impacts on biological resources.3.1.3.3 Los Angeles CountyAntelope Valley Areawide General <strong>Plan</strong>: The 1986 Antelope Valley AreawideGeneral <strong>Plan</strong> anticipates that most urban growth in Los Angeles County would continue near theurban centers of Lancaster and Palmdale. Quartz Hill is the largest of the unincorporatedcommunities and the plan recognizes the predominately semi-urban character of the area bydesignating moderate residential densities for the areas already so developed, and lesser densitiesto the northeast and southwest of the community (Antelope Valley Areawide General <strong>Plan</strong> atpage III-2). In addition, the General <strong>Plan</strong> provides for the protection of the existing rural lowdensitylifestyle of several rural communities including Acton, Crystalaire, Lake Hughes-Elizabeth Lake, Leona Valley, Littlerock, Pearblossom, Lake Los Angeles and Sun Village.Several very low-density rural villages are scattered throughout the Antelope Valley such asJuniper Hills and Antelope Acres (Id. at page III-2). According to the general plan, the principalelements that have shaped the pattern and intensity of land uses in the Antelope Valley includethe major transportation corridors, Edwards Air Force Base, the future Palmdale InternationalAirport, the U.S. Air Force <strong>Plan</strong>t 42, and Fox Field (Id. at page III-1).Chapter 3 3-15
Figure 3-1Typical processing Steps for Projects on Private Land with Potential for Endangered,Threatened or Sensitive SpeciesDevelopment applicationis submitted to the localjurisdiction.STARTIf project is within an area with potential for threatened, endangeredor sensitive species, a biological survey is required prior toacceptance of the application for processing by the jurisdiction.Applicant hires a biologist to perform a biological survey ofthe property based on protocol established by the wildlifeagencies. The survey may need to be performed during acertain time of the year, potentially delaying the timing ofthe survey.Survey performed andsubmitted to the localjurisdiction.Application accepted forprocessing.Environmental review is conducted for the project. Thebiological survey is reviewed and the potential impact tobiological resources is analyzed in the initial study.EIR preparedMay have Significant EffectNo SignificantEffectNegative Declaration or MitigatedNegative Declaration with conditionsestablished for biological resources.Local jurisdiction takes action onproject and imposes conditions ofapproval that must be met prior toissuance of permits.Applicant complies with conditions of approval, including mitigation measures for biological resources that mayinclude, but are not limited to, one or more of the following:• Redesign project to avoid the resource.• Establish an easement on the property to protect the resource.• Provide compensation by purchasing mitigation land at a ratio established by the wildlife agencies. It wouldbe applicant’s responsibility to locate and purchase the land for mitigation.• Obtain a Section 10(a) and/or 2081 permit. (See Figure 3.______ for flow chart of Section 10[a] process.)• Hire a biologist to perform a clearance survey prior to grading or construction.• Monitor the site during construction, and/or during operation of activities on site; fence the site; adhere toestablished speed limits for construction and/or operation vehicles; train on-site workers and constructionworkers; other potential mitigation as determined necessary during the review and public hearing process.Localjurisdictionissues permitChapter 3 3-16
Significant Ecological Areas: There are a number of areas designated by the AntelopeValley Areawide General <strong>Plan</strong> as “Significant Ecological Areas” due to their unique plant and/oranimal resources. Development within these areas is permitted by the general plan at very lowintensities subject to standards providing for the protection of the resources. The general planrecommends that several areas be acquired by an appropriate public agency as permanentecological preserves, including the Little Rock Wash, Big Rock Wash, Portal Ridge/LiebreMountain, Tehachapi Foothills SEAs, and areas adjacent to the Califonia Poppy Preserve amongothers (Id. at pages III-3 and 4). There are 13 SEAs within the planning area. These include:• SEA #47 – Edwards Air Force Base.• SEA #48 – Big Rock Wash.• SEA #49 – Little Rock Wash.• SEA #50 – Rosamond Lake.• SEA #51 – Saddleback Butte State Park.• SEA #52 – Alpine Butte.• SEA #53 – Lovejoy Butte.• SEA #54 – Piute Butte.• SEA #55 – <strong>Desert</strong>-Montane Transect.• SEA #56 – Ritter Ridge.• SEA #57 – Fairmont and Antelope Buttes.• SEA #58 – Portal Ridge/Liebre Mountain.• SEA#60 – Joshua Tree woodland habitat.The SEAs at Big Rock Wash, Piute Butte, Alpine Butte, and Portal Ridge/Liebre Mountainprovide important linkages and wildlife corridors.The County is revising its general plan, and a proposal to combine the SEAs into threelarger units is being reviewed. One SEA, Kentucky Springs, near the southwest boundary of theplanning area, would be deleted. Formal action on the SEA proposals would not take place untilafter the <strong>West</strong> <strong>Mojave</strong> <strong>Plan</strong> is completed, and may consist of retention of the existing boundariesand land use standards, adoption of the consultant’s recommendations, or revisions to therecommendations and standards as a result of public input and staff analysis. These new SEAproposals include the following:• Antelope Valley: The Antelope Valley SEA would combine nine existing SEAs(<strong>Desert</strong>-Montane transect, Big Rock Wash, Little Rock Wash, Piute Butte, Alpine Butte,Saddleback Butte State Park, Lovejoy Butte, Rosamond Lake and Edwards Air ForceBase) into a single designation. This area would extend from the Los Angeles-SanBernardino County line near Llano west to Little Rock Creek and from the Forest Serviceboundary north to Saddleback Butte State Park and just north of the southern boundary ofEdwards Air Force Base. Portions of the SEA along Little Rock Creek, Big Rock Creekand Mescal Creek would extend into the Angeles National Forest. The proposed areacomprises 222,325 acres, including 197,634 acres of unincorporated Los AngelesCounty, 9,887 acres within Angeles National Forest, 11,074 acres within the City ofPalmdale and 3,730 acres within the City of Lancaster. Acreage of the recommendedChapter 3 3-17
SEA within EAFB was not specified, and a small unspecified acreage of BLM managedlands is also included. The County would have no permitting or land use authority overlands outside the unincorporated area.The recommended SEA was designed to protect watersheds supplying the Rosamond andRogers Lake playas as well as the desert buttes in the eastern Antelope Valley. The SEAcontains riparian habitats, mesquite bosques, playa lakes, and seasonal pools. Portions ofthe SEA overlap the proposed Alkali Mariposa Lily Conservation Area and the Big RockCreek Conservation Area, where gray vireo, San Diego horned lizard, short-jointbeavertail cactus, and a number of riparian birds are found.Wildlife corridors and habitat linkages between the San Gabriel Mountains and theAntelope Valley desert areas are included within the proposed SEA. The buttes supportnesting birds of prey, including prairie falcon. The SEA would protect occupied habitatand the ecosystem processes of sand transport for the <strong>Mojave</strong> fringe-toed lizard.• Joshua Tree Woodland: A proposed SEA of 4,732 acres would include undisturbedportions of existing SEA Number 60 (Joshua Tree woodland habitat) and make boundarycorrections. All of the land is within uncorporated Los Angeles County, and is privatelyowned, with the exception of the California Aqueduct.This proposed SEA would include remnant stands of Joshua tree woodland, and containspotential habitat for burrowing owl and known foraging habitat for several species ofraptors, including prairie falcon, golden eagle, and ferruginous hawk.• San Andreas Rift Zone: The proposed San Andreas Rift Zone SEA extends from thewesterly foothills of the Tehachapi Mountains in a southeasterly direction along the SanAndreas Fault to include the foothills of Liebre Mountain and Sawmill Mountain, most ofPortal Ridge, Leona Valley, Ritter Ridge, Fairmont and Antelope Buttes, AnaverdeValley and Lake Palmdale. A separate area surrounds Barrel Springs. It covers 89,698acres, including 68,722 acres in unincorporated Los Angeles County, 15,285 acres inAngeles National Forest, 5,476 acres within the City of Palmdale and 215 acres withinthe City of Lancaster. The state Antelope Valley California Poppy Reserve is includedwithin the SEA. Three small BLM managed parcels on Portal Ridge are also included.The County would have no permitting or land use authority over lands outside theunincorporated area.The proposed SEA would combine and modify the existing SEAs for Ritter Ridge,Fairmont and Antelope Buttes and Portal Ridge/Liebre Mountain.The SEA would include occupied habitat for the red-legged frog, southwestern pondturtle, short-joint beavertail cactus, San Diego horned lizard, burrowing owl, least Bell’svireo and potentially other target species of the <strong>West</strong> <strong>Mojave</strong> <strong>Plan</strong>. An important linkagebetween the Angeles National Forest and the Antelope Valley California Poppy Reservewould be included. Uncommon or rare wetland communities, wildflower fields, andnative grasslands are also present.Chapter 3 3-18
Wildlife and Wildflower Sanctuaries: The Los Angeles County Department ofRegional Parks owns several scattered tracts of land that are managed as wildlife and wildflowersanctuaries and are zoned as open space. Some of these sanctuaries are within existing SEAs orthe proposed Antelope Valley SEA. Others are within the proposed Big Rock Creek or Mohaveground squirrel conservation areas, and one is within a proposed DWMA.• Butte Valley Wildflower Sanctuary – 320 acres within proposed SEA and MGS CA• Gerhardy Wildlife Sanctuary – 320 acres• Payne Wildlife Sanctuary – 320 acres within existing SEA #55• Mescal Wildlife Sanctuary– 100 acres within existing SEA #55• Alpine Butte Wildlife Sanctuary– 320 acres within existing SEA #52• <strong>Desert</strong> Butte Wilderness –within existing SEA #53• Pinyon Hills Wildlife Sanctuary –within existing SEA #55• East Bob’s Gap Nature Preserve• Longview Wildlife Sanctuary• Littlerock Wildlife Sanctuary• Phacelia Wildlife Sanctuary –within proposed SEA and DWMA3.1.3.4 San Bernardino CountyDevelopment and land disturbance within the unincorporated areas is located primarilyaround the incorporated cities, near the foothills of the San Bernardino Mountains (Phelan, OakHills, Pinion Hills, Lucerne Valley), in the Morongo Basin and areas south of the Marine CorpsAir Ground Combat Center at Twentynine Palms, and east of Barstow in the Newberry SpringsArea.San Bernardino County General <strong>Plan</strong>: The San Bernardino County General <strong>Plan</strong>divides the desert region of the county into five subregional planning areas that are coterminouswith the boundaries of five Regional Statistical Areas (RSAs) for the desert portion of SanBernardino County. The County General <strong>Plan</strong> anticipates very little growth to occur within theBaker Subregional <strong>Plan</strong> Area (RSA31). The plan cites the lack of infrastructure facilities as amajor constraint to development in this subregion, and expects the little growth that occurs to bearound the existing communities of Newberry Springs, and the Searles Valley (San BernardinoCounty General <strong>Plan</strong> at page III-D1-1). Within the Barstow Subregional <strong>Plan</strong>ning Area (RSA32a), the plan anticipates most of the future growth to occur in the incorporated City of Barstowand in Lenwood and other adjacent unincorporated communities (Id. III-D2-1). The SanBernardino County General <strong>Plan</strong> identifies the Victor Valley Subregional <strong>Plan</strong>ning Area (RSA32b) as one of the fastest growing areas in San Bernardino County, with most of the growthoccurring within the incorporated cities with long term development potential identified for theunincorporated areas of Phelan and Lucerne Valley (Id. at page III-D3-1). Most of thedevelopment within the Morongo Basin Subregional <strong>Plan</strong>ning Area (RSA 33) is concentrated inthe Town of Yucca Valley and the city of Twentynine Palms, with scattered developmentoccurring within the unincorporated areas (Id. at page III-D4-1). General <strong>Plan</strong> land usedesignations and densities generally reflect the growth patterns described above. Densities rangefrom urban residential (maximum of 16 dwelling units per acre) to resource conservation with aChapter 3 3-19
maximum density of one dwelling unit per 40 acres. Much of the unincorporated area isdesignated for low-density residential use ranging from one dwelling unit per 2.5 acres to onedwelling unit per 40 acres.The County General <strong>Plan</strong> also includes mapping which ties allowable land uses to theavailability of the basic infrastructure required for development (roads, water and wastewaterfacilities). “Required levels of service are established for all areas ranging from the most intenseurban areas (IL 1) to the least intense rural areas (IL 5). Development can be permitted to thedegree allowed by a site’s official land use designation only when infrastructure facilities are orplanned to be in place at levels consistent with the designated IL areas.” (San Bernardino CountyGeneral <strong>Plan</strong> at II-D6-36.)The San Bernardino County General <strong>Plan</strong> lists the following goals and policies pertinentto biological resources:• Preserve rare and endangered species and protect areas of special habitat value; and• Establish plans for long-term preservation and conservation of biological resources (SanBernardino County General <strong>Plan</strong> at II-C1-4).San Bernardino County Development Code: The San Bernardino CountyDevelopment Code also provides for the designation of a Biological Resource Overlay Districtwhere special management is provided for unincorporated areas in the county for the protectionof important flora/fauna habitat. Surveys and mitigation measures are required for any newdevelopment or expansion of an existing land use by 25% or more (Development Code atSection 85.030220). The County has categorized desert tortoise habitat as one, two, and three;indicated Mohave ground squirrel range; and identified bald eagle roosts and habitat on theBiotic Resource Overlay. (San Bernardino County General <strong>Plan</strong> at II-C1-4 to 6).Surveys of biotic resources on site and adjacent parcels and mitigation measures toreduce impacts to the identified resources are required in the Biotic Resource Overlay Districtsfor all proposed land use map changes and for discretionary land use proposals. Thesedevelopment policies are not restricted to those areas within the Biotic Resource OverlayDistrict, but may be applied to any areas where there are listed or candidate species and theirhabitat. A monitoring program is also required. Survey results, mitigation and monitoring mustbe documented in a Biological Resources Report.<strong>Mojave</strong> Narrows Regional Park: The <strong>Mojave</strong> River flows through the Victor Valley,forming the boundary between the cities of Victorville and Apple Valley. At the Narrows,groundwater is forced to the surface by underlying bedrock and a permanent stream supportsextensive riparian forest. This oasis provides habitat for many <strong>West</strong> <strong>Mojave</strong> target species,particularly birds. The concentration of species at this location makes the <strong>Mojave</strong> NarrowsRegional Park a biological hotspot, where 17 sensitive species are found together. The park isowned by the state Wildlife Conservation Board and is operated by San Bernardino CountyDepartment of Regional Parks. It comprises 850 acres, with 450 acres devoted to habitat.Chapter 3 3-20
<strong>Mojave</strong> River Forks Regional Park: At the junction of Deep Creek and the <strong>Mojave</strong>River in Hesperia, San Bernardino County manages a campground park through a contractor.Much of this facility is vacant land providing undisturbed habitat.3.1.3.5 City of AdelantoThe City of Adelanto is located within San Bernardino County on the northern side of theVictor Valley. The city is bisected by U.S. 395, which runs north/south through the city. TheCity of Adelanto General <strong>Plan</strong> (1994) characterizes the city as having a very pro-active citygovernment that is not only pro-growth, but that has provided leadership in establishing apositive environment for investment within the city (City of Adelanto General <strong>Plan</strong> Update at I-3). The general plan for the city anticipates a high rate of growth over the next several decades.The areas along U. S. Highway 395, Palmdale Road and the eastern segment of El Mirage Roadare planned for general commercial uses. The land area located between <strong>Mojave</strong> Drive and AirBase Road is planned for manufacturing and industrial uses. Residential areas in the southernportion of the city are planned at a density of about four dwelling units per acre. Multiple familyresidential areas are planned west of Highway 395 north of Air Base Road, intermingled withsingle-family densities at four dwelling units per acre. Low-density residential development(one dwelling unit per 2.5 to 5 acres) is planned for the area generally east of Koala Road andnorth of Air Base Road. The plan also designates 871 acres of land within the city as OpenSpace/Public Land/Schools (Id. at III-12).The Conservation/Open Space Element of the Adelanto General <strong>Plan</strong> establishes the goalof assuring “…adequate protection and conservation of all native vegetation and wildlifehabitats” (Id. at VII-26). General <strong>Plan</strong> policies indicate: “…the City will only allowdevelopment which minimizes the destruction of biotic resources within the City, such as the<strong>Mojave</strong> River Corridor.” Other policies calls for retaining areas of the Shadow Mountains asopen space to protect their integrity as a unique habitat as well as a wildlife movement corridor,and for maintaining major stream courses as open space to be managed as wildlife movementcorridors. The General <strong>Plan</strong> suggests use of preferential assessments on real property as anincentive for retaining open space or conservation easements to protect sensitive species andtheir habitats (Id. at VII-27 through 29).3.1.3.6 Town of Apple ValleyThe Town of Apple Valley is located within San Bernardino County, south and east ofInterstate 15 in the Apple Valley. The town is directly east of the city of Victorville andnortheast of the city of Hesperia. Highway 18 bisects the city. The 1991 Town of Apple ValleyGeneral <strong>Plan</strong> characterizes the town as “…primarily a community of homes, many of which arelocated on lots of approximately half-acre or more.” (Town of Apple Valley General <strong>Plan</strong> at page25.) Residential densities ranging from one dwelling unit per 0.9 acres to one dwelling unit per1.0 to 2.5 gross acres predominate in the central and southern portions of the town, while low tovery low density areas (one dwelling per one to five gross acres or more) exist in thenortheastern and southernmost portions of the community. Commercial development is focusedalong Highway 18 and Bear Valley Road. A significant portion of the northern part of the townis designated as Community Reserve, which encourages the development of mixed-use or large-Chapter 3 3-21
scale developments through specific plans with a residential density not to exceed two dwellingunits per gross acre (Id. at page 9).The Open Space/Conservation Element of the town general plan establishes a goal to“…conserve and protect natural resources within the planning area.” Goal OSC-2 states: “TheTown will make every effort to preserve significant mature native trees, native vegetation,landforms and wildlife habitat within the planning area” (Id. at page 9 and 10). Rock knolls inthe town, Bell Mountain, Fairview Mountain, Apple Valley Country Club and the <strong>Mojave</strong> RiverValley are identified as Open Space and are planned to remain in a natural condition (Id. at page17). The objectives of Open Space Districts (OSD) include “the preservation of … nativevegetation … and wildlife habitat” and “the preservation of the integrity, function, productivityand long-term viability of environmentally sensitive habitats” (Apple Valley Code at Section9.55.020). The Apple Valley Code allows the designation of both Conservation and RecreationOSDs. Conservation OSDs are intended in part to “assure the continued existence of adequatewildlife habitat and foster the free movement of wildlife within the desert” (Id. at Section9.55.020).The Lewis Science Center is a regional educational facility located on the north side ofthe <strong>Mojave</strong> River in Apple Valley. The Center provides training for teachers from throughoutthe western portion of San Bernardino County and hosts many classroom visits. Riparian andadjacent upland habitat is protected at this location, including rock outcrops and portions of alevee that support the endemic <strong>Mojave</strong> shoulderband snail.3.1.3.7 City of BarstowThe City of Barstow is located in San Bernardino County along the <strong>Mojave</strong> River at theintersection of Interstates 15 and 40. The Land Use Element of the City of Barstow General <strong>Plan</strong>(1996) identifies six Principal Growth Areas where most of the city growth over the next 20years is expected to take place. The city has set general plan designations to accommodate thisgrowth. The growth areas are as follows (City of Barstow General <strong>Plan</strong> at Part B, I.18 and 19):• Growth Area 1: Most of the expected residential and associated neighborhoodcommercial activity is expected to occur adjacent to Barstow Road, between RimrockRoad and the southerly city limits. Barstow Community College and the CaliforniaVeterans Home are located in this area.• Growth Area 2: “Wholesale to the public” retailing outlets are expected to expand tothe south along the east side of Interstate 15 from the existing outlet malls at LenwoodRoad and 1-15.• Growth Area 3: The Lenwood Specific <strong>Plan</strong> area located on either side of LenwoodRoad, north of Interstate 15 is planned for new industrial and commercial activity.• Growth Area 4: The area along the railroad between Highway 58 and <strong>West</strong> Main Streetis expected to have commercial and industrial growth. Distribution activities and visitorChapter 3 3-22
oriented commercial uses are expected to predominate.• Growth Area 5: The area north of the <strong>Mojave</strong> River in proximity to Highway 58 isexpected to have commercial activity adjacent to the freeway access point, with lowdensityresidential developments nearby.• Growth Area 6: The area just north of the <strong>Mojave</strong> River and east of Interstate I-15 hasthe potential for a golf course with associated “executive estate” homes.The city’s general plan identifies several goals pertinent to biological resources. Thesegoals include seeking to preserve the remaining biological resources in the planning area;conserving suitable habitat for threatened and endangered species whenever possible;establishing corridors for movement of wildlife between DWMAs and between tortoise criticalhabitat; striving to maintain native riparian and associated natural habitats along the <strong>Mojave</strong>River; and maintaining the <strong>Mojave</strong> River as a travel and watershed corridor to maintain the linkbetween the natural areas to the north and south of the city. The general plan also identifies theneed to perform site-specific studies prior to development to determine the mitigation necessaryto preserve and enhance biological resources (City of Barstow, General <strong>Plan</strong> – Part B, II.9).3.1.3.8 City of California CityCalifornia City is located in Kern County, north of Highway 58 and east of Highway 14.Nearly all of the existing development and population exists in an area comprising about twelvesections of land in the southwest corner of the city. Very limited development has occurred tothe northeast in the vicinity of Twenty-Mule Team Road (California City General <strong>Plan</strong> 2012 atpage 3). The general plan indicates that “approximately ninety percent of the subdivided landhas been sold and more than ninety-five percent of the total land area remains empty, except forbladed roads and, in some cases, partial utilities.” (Id. at page 22.)Residential land use densities planned for the city range from Estate Density Residentialdensities of 2 to 5 dwelling units per acre, to high density residential (6 to 40 dwelling units peracre). General Commercial designations are shown along California City Boulevard, withNeighborhood Commercial dispersed in residential areas. Industrial development is planned inthe western part of the city, primarily north of California City Boulevard near the airport.Several conservation areas are shown on the general plan, scattered throughout the easternportion of the city. The General <strong>Plan</strong> text supports urban growth with emphasis placed on infilldevelopment of the central core. (Id. at page 24.)The City is currently proposing a detachment of 12,450 acres in the northeastern part ofthe city; 1,846 acres adjacent to the <strong>Desert</strong> Tortoise Natural Area; and 4,144 acres in the southeastern part of the city. Coupled with the detachment is a request to annex 18,778 acres at thewestern end of the city stretching from the current city limits south to Highway 58. (FinalEnvironmental Impact Report – Redevelopment Area Expansion, Detachment, Annexation, andAutomotive Test Course Project, California City, October 4, 2002 at Figure 2.1-2-A.)Chapter 3 3-23
The Open Space and Conservation Element of the California City General <strong>Plan</strong> lists thefollowing goals and policies regarding biological resources:• Preserve and protect conservation resources of sensitive plant and wildlife species thatare unique to California City environs (California City <strong>Plan</strong> at page 43).• Protect sensitive plant and wildlife species, in accordance with State and federal laws andregulations, and provide for maintenance of supportive habitat for such species in balancewith the needs of humans (Id. at page 44).3.1.3.9 City of HesperiaThe City of Hesperia is located in the Victor Valley region of San Bernardino County,along Interstate 15, south of the City of Victorville and Town of Apple Valley. The City ofHesperia General <strong>Plan</strong> (at page L-6) indicates that most of the existing residential lots are locatedwithin the core area of the town, generally bounded by Maple Avenue and the <strong>Mojave</strong> River, andby Bear Valley Road and Ranchero Road. Within this area, lot sizes have historically rangedfrom 18,000 square feet to one acre in size. In 1991, the average residential lot size withinHesperia was approximately 39,000 square feet (CIC Research Inc., A Citizen’s <strong>Plan</strong>ning Surveyfor Hesperia, June 1989). Large expanses of land within the core area were subdivided into halfacre, acre and two-acre tracts prior to incorporation of the city. Many of these lots areconfigured in a way that makes further subdivision infeasible and densities are anticipated toremain fairly low (City of Hesperia General <strong>Plan</strong> at page L-9). Residential general plandesignations range from Rural Estate (0.1 to0-.4 dwelling units per acre) to High Residential (8to 15 dwelling units per acre). The general plan identifies a trend towards more traditional sizedsingle family residential (3 to 6 dwelling units per acre) in the western portions of the city westof Maple Avenue (Id. at page L-7). Specific plans for large-scale planned developments havebeen approved for the southern portions of the city in Summit Valley.General <strong>Plan</strong> Land Use Goals for the city emphasize the protection of quality of life;accommodating growth “…within the limits of the natural environment and the capacity of itsinfrastructure” and “…managing the use of land so that development occurs in an orderly andbeneficial manner…” (Id. at L-4 and 5.)The City of Hesperia General <strong>Plan</strong> goals relative to biological resources call forpreservation of sensitive or protected desert vegetation and animal species, and habitat areasthroughout the planning area; conducting a biological assessment to identify sensitive habitatareas; and a site specific assessment of the impacts of a proposed development on biologicalresources (Id. at CN-26-27). The general plan also indicates that “biological resourceconservation measures, including preparation of a habitat conservation plan for endangeredspecies, designated preserve areas, and protection of Joshuas and other unique species, will be anintegral part of planning within the City.” (Id. at CN-7.)The city has initiated a habitat conservation plan in cooperation with Caltrans, RanchoLas Flores and Summit Valley Ranch. The HCP would address potential impacts to threespecies, the arroyo toad, the southwestern willow flycatcher, and the Least Bell’s vireo. TheChapter 3 3-24
HCP would include mitigation measures for the entire areas of the two specific plans as well asfor the effects of the expansion of State Highway 138 to a four-lane road. As the specific plansand the State highway project were initiated and evaluated independently from the <strong>West</strong> <strong>Mojave</strong><strong>Plan</strong>, mitigations would be applied outside of the parameters of the <strong>Plan</strong>, in accordance with theHCP and the indivisual environmental documentation for each project.3.1.3.10 City of LancasterThe City of Lancaster is located in the Antelope Valley region of Los Angeles Countyalong Highway 14. Urbanized development in the city is concentrated in the central area ofLancaster and in the area surrounding the Quartz Hill community. The approval of large-scaledevelopments in the eastern and western portions of the city has “set the stage for thedevelopment of several isolated nodes.” The General <strong>Plan</strong> notes, “There is a considerableamount of undeveloped land between these development nodes and the urbanized areas of theCity.” These undeveloped lands are generally divided into 2.5 and 5.0-acre parcels, a landpattern that makes infill difficult. An area of mixed land uses is found in South Lancaster. Ruralresidential communities are found in the outlying areas of the city. (City of Lancaster General<strong>Plan</strong> at page VIII-2.)The general plan specifies a range of residential land use densities from NonurbanResidential (up to 1 dwelling unit per 10 acres) to High Density Residential (15.1 to 30.0dwelling units per acre). Land use goals include establishing a variety of land uses which furtherLancaster’s transition from a suburb of Los Angeles to a community with a full range of urbanand community services; managing growth to create a comprehensive urban structure;encouraging infill development; protecting rural areas from urban encroachment; creating anaesthetically pleasing environment; and promoting a regional perspective in land use decisions.(Id. at pages VIII-5 through 38.)The City of Lancaster General <strong>Plan</strong> (at page II-20) establishes an objective pertinent tobiological resources to “Identify, preserve and maintain important biological systems within thestudy area, and educate the general public about these resources, which include the Joshua Tree –California Juniper Woodlands, areas that support endangered or sensitive species, and othernatural areas of regional significance.” Policies call for comprehensive management ofprograms for significant biological resources; cooperation with others in the development of the<strong>West</strong> <strong>Mojave</strong> <strong>Plan</strong>; the initiation of area wide studies to identify sensitive biological resources;protection of Prime <strong>Desert</strong> Woodlands through acquisition or other means; establishing standardsfor the development of property in Prime <strong>Desert</strong> Woodlands; and the preservation of significantdesert wash areas and open space lands in and around the Poppy Preserve (Id. at pages II-20through 27). There is one wash area (Little Rock Creek Wash) within the City limits, and it isdesignated Open Space.The City is establishing a Joshua Tree Woodland Preserve. Forty acres have beenacquired for the preserve, and 45 additional acres are being purchased. This area would serve asan educational outreach facility. It is not currently known what species are found at the Preserve.In 1991, the City passed Ordinance 577, which established fees for removal of native vegetationwithin defined Vegetative Management Areas. The fees collected under this ordinance are usedChapter 3 3-25
to offset the costs associated with acquiring sites within the Prime <strong>Desert</strong> Woodland.3.1.3.11 City of PalmdaleThe City of Palmdale is located in the Antelope Valley region of Los Angeles County,south of the City of Lancaster. The developed portions of the City “…occupy an area generallybounded by the Littlerock Wash on the east, the California Aqueduct on the south, and 70 thStreet <strong>West</strong> on the west.” Littlerock Wash forms a natural boundary between urban residentialdensities in the City and more rural development in the unincorporated community of Littlerock.“The northern extent of urban development in Palmdale follows an irregular path from AvenueM in the northwest portion of the City, around existing rural residential areas in the north centralportion of the <strong>Plan</strong>ning Area, and south of the airport land along Avenue P.” (City of PalmdaleGeneral <strong>Plan</strong> at page L-40.) The large expanse of airport land (over 22,000 acres) in the northand northeastern portions of the city have helped to shape growth patterns. The airport land islargely vacant except for Air Force <strong>Plan</strong>t 42, minor agricultural uses and sewage treatmentfacilities, but if future airport uses occur, the land would provide economic developmentopportunities for the City and is designated for manufacturing land uses by the general plan. (Id.at page 42.)The City General <strong>Plan</strong> identifies the following development trends for the city:• “New housing for first time buyers will be constructed on the east side of Palmdale (eastof 47 th Street).”• “Residential Development will continue to expand south into the Barrel Springs andVincent Hills Areas.”• “…The southwest portion of the City between Verde Ridge and the southern sphere line,west of Hwy 14 to City Ranch will be a target for urban development if infrastructure isprovided.”• “City Ranch and Ritter Ranch will begin construction on initial phases adjacent toElizabeth Lake Road.”• “The City will complete annexation of many of the County island areas within the coreareas.”• The City will encourage infill of vacant land and reuse of existing buildings in urbanizedareas…” (City of Palmdale General <strong>Plan</strong> at pages L-48 and L-49.)Biological resources are addressed in the City’s General <strong>Plan</strong> Goal ER2, which calls forprotecting “…significant ecological resources and ecosystems, including, but not limited to,sensitive flora and fauna habitat areas.” Significant Ecological Areas are identified at Big RockWash, Little Rock Wash, Ritter Ridge, Portal Ridge and Alpine Butte. Biological surveys arerequired for any new development in these areas, and significant environmental resources arerequired to be considered and preserved to the extent feasible. The plan also calls for thepreservation of natural drainage courses and riparian areas containing significant concentrationsof ecological resources, as well as significant Joshua tree woodlands.Chapter 3 3-26
3.1.3.12 City of RidgecrestThe City of Ridgecrest is located in northeastern Kern County in the southern portion ofthe Indian Wells Valley. Scattered residential land uses predominate in the city with linearcommercial land uses occurring along Inyokern Road, China Lake Boulevard, Norma Street, andRidgecrest Boulevard. (City of Ridgecrest General <strong>Plan</strong> at page I-3.) The General <strong>Plan</strong> limitsthe residential categories of medium density (up to 25 units per gross acre), low density (6,000square feet to 5 acres per parcel), and recreational uses to the urban areas of the community. Theless intensive uses such as open space and rural residential (minimum parcel size of 5 acresgross) make up the fringe areas west, south and east of the community. (Id. at page 1-5.)The Conservation Element of the City’s General <strong>Plan</strong> includes policies relative to habitatand wildlife that call for promoting the survival of native wildlife species and the preservation oftheir natural habitat; prohibiting off-highway vehicle use in designated habitat preservationareas; and supporting the concept of the Cerro Coso Community College’s (CCCC) Natural Areaas designated by BLM and CCCC. (City of Ridgecrest General <strong>Plan</strong> at page 5-5.) The plan alsoencourages the retention of natural desert flora to control soil erosion; supports education as ameans to reduce impacts to natural resources; and encourages participation in BLM planning forpublic lands near the city (Id. at pages 5 through 12).3.1.3.13 City of Twentynine PalmsThe City is located in central San Bernardino County, in the Morongo Basin portion ofthe <strong>Mojave</strong> <strong>Desert</strong>. Twentynine Palms Highway bisects the community (east-west), and most ofthe commercial areas are along this highway and Adobe Road, which runs in a north-southdirection. Multi-family (up to 8 dwelling units per acre) and higher density single-familydevelopment (at 4 dwelling units per acre) generally surrounds the downtown commercial area,with less dense development in the outlying portions of the City. (City of Twentynine PalmsGeneral Land Use <strong>Plan</strong> at Section IV.) The stated purpose of the City’s Land Use <strong>Plan</strong> “…is toprovide efficiency in land use, ensure development of quality neighborhoods with housingopportunities for all citizens, enhance the business district, provide a “tourist friendly” settng,and afford an opportunity for industrial development, while protecting natural resources andpreserving the quality desert lifestyle.” (Id. at Section II.) General <strong>Plan</strong> policies support infilldevelopment with limited densities in the outlying areas of the city. (City of Twentynine PalmsGeneral <strong>Plan</strong> – Conservation <strong>Plan</strong>, Program 1.2.1.)The City’s Conservation <strong>Plan</strong> identifies the primary purpose of the Conservation <strong>Plan</strong> tocommit “…the City to a responsible plan of action in carrying out its role in environmentalprotection.” (Id. Section XII B.) Program 1.1.3 in the Conservation <strong>Plan</strong> requires protection ofthe unique habitat in the Oasis of Mara. Goal 6 of the Conservation <strong>Plan</strong> calls for thepreservation of the biological resources of the Mesquite Dunes, including the Mesquite DunesBosque and Playa Lakebed. The plan provides programs requiring specific review of projectsoccurring in the Mesquite Dunes, including limitations on grading, restrictions on sand extractionand removal of Honey Mesquite trees, and a requirement for a detailed clearance survey fordesert tortoise.Chapter 3 3-27
3.1.3.14 City of VictorvilleThe City of Victorville is located along Interstate 15 in the Victor Valley region of SanBernardino County, at the southern end of the <strong>Mojave</strong> <strong>Desert</strong>. The City General <strong>Plan</strong> establishesthirteen planning areas for purposes of land use designation and analysis. City land use goalsinclude maintaining a balanced community with a diversified economic base, providing adequatecity services and maintaining an aesthetically pleasing community. (City of Victorville General<strong>Plan</strong> Land Use Element at pages 51 through 54.) Residential land use designations allow fordevelopment densities ranging from one dwelling unit per five acres (Open Space and RuralResidential) to twenty dwelling units per acre (Very High Density Residential). Developmentdensities for industrial and commercial uses range from 40 to 60% site coverage.Resource management goals identified within the General <strong>Plan</strong> indicate that the Citywould monitor new information regarding the status of sensitive floral and faunal species torevise its biotic inventory; would continue to require preservation of native Joshua treewoodlands and specimens where possible; would continue to require preservation of the <strong>Mojave</strong>River riparian habitat; would continue to participate in a cooperative effort with other agencies tomonitor and review the management of resources; and would continue to cooperate and consultwith federal, state, county and local agencies in resolving regional resource management issues.(City of Victorville General <strong>Plan</strong> – Resource Element at pages 48 through 52.) The City hasdesignated areas along the <strong>Mojave</strong> River as Open Space. The General <strong>Plan</strong> indicates that theCity requires that a survey be conducted by a qualified biologist to determine whether tortoisehabitat exists prior to issuance of grading permits for undisturbed sites. (Id. at page 44.) Theplan further indicates that the City has established a “no survey” area within the City based onthe results of 370 completed biological surveys. This “no survey” area was established afterconsultation with the USFWS.Rockview Nature Park: A small but important educational facility operated by the Cityof Victorville is located at the Lower Narrows of the <strong>Mojave</strong> River. School classes are hostedfor educational programs, and the site protects rocky outcrops, Joshua tree woodland, and aportion of the <strong>Mojave</strong> River riparian habitat. Trails are present providing access to the river.3.1.3.15 Town of Yucca ValleyThe Town of Yucca Valley is located in the south central portion of San BernardinoCounty, in the Morongo Basin. Existing development in the town is focused along StateHighway 62. Nearly all of the commercial development in the town is focused along thiscorridor, with residential development occurring to the north and south at progressively lowerdensities. Development in the area is constrained by the topography, and only about 25% of thelands in the town were developed as of 1995. [Yucca Valley Comprehensive General <strong>Plan</strong>, DraftEnvironmental Impact Report at page II-1]. Residential densities under the General <strong>Plan</strong> rangefrom densities of one dwelling unit per 20 acres to 14 dwelling units per acre [Id. at I-9]. Otherland use designations (Commercial, Industrial) limit development at varying levels of intensity[Id. at I-13]. A total of 511 acres are zoned Open Space for park lands, lands that pose a humanhazard and biologically sensitive areas [Id. at I-9].Chapter 3 3-28
It is a goal of the town’s general plan to “… protect and preserve the Town’s biologicalresources, especially those sensitive rare, threatened or endangered species of wildlife and theirhabitats. Policies of the General <strong>Plan</strong> include specific steps to preserve the long-term viability ofsensitive habitat and species.” [Id. at III-74.] The General <strong>Plan</strong> further requires thatdevelopment in areas with sensitive species and habitat be at a compatible intensity, andaddresses the need for protection of Covington Wash as a wildlife corridor. [Id. at III-74 and 75.]3.1.4 Federal Endangered Species Act3.1.4.1 BackgroundThe federal Endangered Species Act of 1973 (FESA) is intended “to provide a meanswhereby the ecosystems upon which Endangered species and Threatened species depend may beconserved, [and] to provide a program for the conservation of such endangered species andthreatened species...” (FESA Section 2(b).) FESA requires that all federal agencies “seek toconserve endangered species and threatened species and shall utilize their authorities in furtheranceof the purposes of this chapter.” (Section 2(c)(1).) FESA assigns to the Secretary of the Interior theresponsibility to maintain a list of threatened and endangered species and to designate critical habitatfor these species (Section 4).It is unlawful for any person to “take” a federally listed fish or wildlife species. (Section9(a)(1)(B).) “Take” means to harass, harm, pursue, hunt, shoot, wound, kill, trap, capture, or collect.(Section 3(18).) Take includes significant habitat modification or degradation that actually kills orinjures wildlife (Babbitt v. Sweet Home Chapter, 515 U.S. 687).3.1.4.2 Listed SpeciesSpecies listed as threatened or endangered by USFWS and found within the western <strong>Mojave</strong><strong>Desert</strong> are identified in Table 3-3.Chapter 3 3-29
Table 3-3Species Listed by USFWS as Threatened or EndangeredSPECIES STATUS DATE LISTEDArroyo toad (Bufo californicus) Endangered January 17, 1995Bald eagle (Haliaeetus leucocephalus)EndangeredThreatenedMarch 11, 1967August 11, 1995California red-legged frog (Rana aurora draytonii) Threatened May 20, 1996Cushenbury milkvetch (Astragalus albens) Endangered August 24, 1994Cushenbury buckwheatEndangered August 24, 1994(Eriogonum ovalifolium var. vineum)Cushenbury oxytheca (Oxytheca parishii var. goodmaniana) Endangered August 24, 1994<strong>Desert</strong> tortoise (Gopherus agassizii) Threatened April 2, 1990Inyo California towhee (Pipilo crissalis eremophilus) Threatened August 3, 1987Lane Mountain milkvetch (Astragalus jaegerianus) Endangered October 6, 1998Least Bell’s vireo (Vireo bellii pusillus) Endangered May 2, 1986<strong>Mojave</strong> tui chub (Gila bicolor mohavensis) Endangered October 13, 1970Parish’s daisy (Erigeron parishii) Threatened August 24, 1994Southwestern willow flycatcher (Empidonax traillii extimus) Endangered March 29, 19953.1.4.3 Recovery <strong>Plan</strong>sUSFWS has completed recovery plans for six of these federally listed species. The mostimportant recommendations of these recovery plans are summarized below.• Bald Eagle (August 25, 1986). Recovery of the bald eagle was addressed on a regional basisand the Pacific Bald Eagle Recovery <strong>Plan</strong> presented criteria for downlisting to threatenedstatus, which were achieved in 1994. No recovery objectives or standards are applicable tothe <strong>West</strong> <strong>Mojave</strong>, though the plan addresses the wintering population in the San BernardinoMountains. Many of the eagles wintering at Lake Silverwood, Lake Arrowhead, and BigBear Lake utilize a night roost at Las Flores Ranch, which is within the <strong>West</strong> <strong>Mojave</strong>planning area. This property is included in the Summit Valley HCP, a multispecies plan thatis being prepared by the City of Hesperia. In 1999, the USFWS proposed delisting of thebald eagle because the national and regional goals for recovery were met (USFWS 1999). Adecision is pending.• <strong>Desert</strong> tortoise (June 28, 1994): Recovery of the desert tortoise to a point where it can bedelisted depends on actions within specified recovery units, which are considered separately.The recommended conservation measures are based on establishment of DWMAs withineach recovery unit, including the <strong>West</strong> <strong>Mojave</strong> Recovery Unit. Conservation actions toreduce impacts to tortoises from grazing, off-highway vehicle use, ravens, and incompatibleland uses are recommended for each DWMA. In addition, a program of monitoring andenvironmental education is suggested.Chapter 3 3-30
• Inyo California Towhee (April 10, 1998): Recovery and delisting of the Inyo Californiatowhee can be achieved with protection, management and enhancement of occupied riparianhabitat in the Argus Mountains. Habitat enhancement includes the removal of invasivevegetation, removal of wild burros and limitations on off-highway vehicle access. TheRecovery <strong>Plan</strong> also calls for monitoring of the habitat and towhee populations anddevelopment of a public outreach program.• <strong>Mojave</strong> tui chub (September 17, 1984): The <strong>Mojave</strong> tui chub can be downlisted to threatenedstatus after establishment of three additional self-sustaining populations. For delisting, reintroductionand establishment of viable populations into a majority of the historic habitat inthe <strong>Mojave</strong> River is necessary. This fish is currently maintained at small refugia at ChinaLake NAWS, Zyzzyx, and Camp Cady.• Southwestern Arroyo Toad (July 24, 1999): Protection of 20 occupied drainages andadjacent upland habitat in northern, southern and desert slope recovery units is necessary forthe arroyo toad to be downlisted to threatened. Protection of an additional 15 populations inthese recovery units is necessary for delisting. A portion of the desert slope recovery unit iswithin the <strong>West</strong> <strong>Mojave</strong> planning area, and includes Little Rock Creek in Los AngelesCounty and Deep Creek, Little Horsethief Creek and the <strong>Mojave</strong> River in San BernardinoCounty. Most occurrences of the arroyo toad are within the San Bernardino and AngelesNational Forests, with a small extension of occupied habitat extending onto private and BLMlands in the western <strong>Mojave</strong> <strong>Desert</strong>.• Southwestern willow flycatcher (August 30, 2002): Delisting of the southwestern willowflycatcher would require population increases and stabilization at specified river reacheswithin six Recovery Units. The Basin and <strong>Mojave</strong> Recovery Unit is found within the <strong>West</strong><strong>Mojave</strong> <strong>Plan</strong> area, and contains two focus areas for management attention and conservationefforts: 1) the <strong>West</strong> Fork of the <strong>Mojave</strong> River from its headwaters to <strong>Mojave</strong> Forks dam(Hesperia area) and 2) the <strong>Mojave</strong> River between Spring Valley Lake and Bryman(Victorville-Apple Valley and San Bernardino County). The population size within theseunits must increase from the current level of 13 territories to 25 territories. Recommendedhabitat enhancement measures include removal of invasive riparian plants, such as Russianolive and saltcedar and trapping of brown-headed cowbirds, which parasitize flycatchernests.• California Red-legged Frog (May 28, 2002): Delisting can be considered after five criteriaare met. The first is protection of 35 core areas. Within the <strong>West</strong> <strong>Mojave</strong> are two core areas:the San Gabriel Mountains and the Forks of the <strong>Mojave</strong> River. The San Andreas Rift Zoneat the southwest edge of the planning area contains occupied habitat for this species, and theupper <strong>Mojave</strong> River contains suitable (and historical) habitat where the frog could be reestablished.The remaining criteria are stability of the populations, sufficient geographicaldistribution, successful establishment in historical habitat and needed research completed.Recovery <strong>Plan</strong>s for other species (Least Bell’s vireo, carbonate endemic plants) have beenpublished in draft format and are awaiting public comment and finalization by USFWS.Chapter 3 3-31
3.1.4.4 Critical HabitatCritical habitat has been designated for the desert tortoise and Inyo California towhee.Critical habitat designations for the least Bell’s vireo and southwestern willow flycatcher do notextend into the <strong>West</strong> <strong>Mojave</strong> planning area. Designations for the arroyo toad and red-legged froghave been vacated by recent judicial decisions. On October 30, 2002, the United States DistrictCourt for the District of Columbia set aside the critical habitat designation for the arroyo toad andordered the Service to publish a new final rule by July 30, 2004 (Building Industry Legal DefenseFoundation, et al., v. Gale Norton, Secretary of the Interior, et al., and Center for BiologicalDiversity, Inc. and Defenders of Wildlife, Inc. Civil Action No. 01-2311 (JDB) (U.S. District Court,District of Columbia)). A similar ruling in a different case was made for the red-legged frog. Adiscussion of each of these designations follows.• Carbonate endemic plants: Critical habitat for four of the five listed carbonate endemicplant species was designated in the <strong>West</strong> <strong>Mojave</strong> on December 14, 2002. Several distinctareas on the north slope of the San Bernardino Mountains near Lucerne Valley weredesignated to include known occupied habitat for Cushenbury milkvetch, Cushenburybuckwheat, Cushenbury oxytheca and Parish’s daisy. A total of 1,585 acres of BLM landcomprise the critical habitat, along with a smaller acreage of private land. [DesignatedDecember 2002, Federal Register 67(247):78570-78610.]• <strong>Desert</strong> Tortoise: Critical habitat for the desert tortoise occupies substantial portions of thecentral and southeastern <strong>West</strong> <strong>Mojave</strong> planning area (USFWS 1994a). The designationincludes parts of three military bases and covers much of three of the four participatingcounties, with an extension into Riverside County within Joshua Tree National Park.[Designated February 1994, Federal Register 59(26):5820-5866.]• Inyo California Towhee: Critical habitat for the Inyo California towhee lies entirely withinInyo County and surrounds springs and seeps occupied by this endangered bird. Themajority of critical habitat is located on the China Lake NAWS. [Designated 1987, FederalRegister 52:28780-28788.]3.1.4.5 Exceptions to FESA’s Take ProhibitionTake may be allowed in certain cases where it is incidental to the carrying out of anotherwise lawful activity. These cases include: (1) FESA Section 7 consultation procedures, forprojects authorized, funded or carried out by a federal agency (“federal actions”); and (2) issuanceby USFWS of an incidental take permit, for non-federal actions. Each is discussed below.Incidental Take Permits: The USFWS may authorize, by permit, takings of an animallisted by USFWS as threatened or endangered, which are incidental to, and not the purpose of, thecarrying out of an otherwise lawful activity that is not a federal action. (FESA Section 10(a)(1)(B).)These “Section 10(a)” permits may be issued if an applicant for a permit submits to USFWS a“conservation plan” that satisfies the following permit issuance criteria:Chapter 3 3-32
(i) The taking will be incidental;(ii) The applicant will, to the maximum extent practicable, minimize and mitigate the impacts of suchtaking;(iii) The applicant will ensure that adequate funding for the plan will be provided;(iv) The taking will not appreciably reduce the likelihood of the survival and recovery of the speciesin the wild; and,(v) The measures, if any, required under [1539(a)(2)(A), “such other measures that the Secretary mayrequire as being necessary or appropriate”] will be met, and [the Secretary] has received such otherassurances as he may require that the plan will be implemented.... [Id. At Section 10(a)(2)(B).]These criteria do not explicitly require that a conservation plan (also known as a habitatconservation plan, or HCP) contribute to the recovery of a listed animal species. Rather, an HCPneed only ensure that the “likelihood of the survival and recovery of the species in the wild” will notbe appreciably reduced.Listed plants on private lands are treated somewhat differently. Section 10(a) permits and“no surprises” assurances cannot be issued for listed plants. Permit issuance procedures do,however, provide indirect protection for plants. This is because an HCP’s conservation programmay not jeopardize the continued existence of any listed species, including plants. If this couldoccur, the permit would not be issued.The Section 10(a) permit applies to the federal Endangered Species Act only. Acomparable permit (the “Section 2081 permit”) applies to the California Endangered Species Act,and is issued by CDFG for species listed as threatened or endangered by the State of California(see discussion below, at Section 3.1.5.3 of this document).The Section 10(a)(1)(B) incidental take permit should not be confused with the separateSection 10(a)(1)(A) permit, which is issued to scientists working with threatened or endangeredspecies on federally-authorized research projects where take of the species is intentional.Nine habitat conservation plans have been approved for lands within the planning area.These include the following:• Cushenbury Sand and Gravel• Hi <strong>Desert</strong> Power Project• Miller Church Site• Sunland Communities• Wildwash Sand and Gravel Site• Sunwest Homes• Kern County Waste Management (Boron, Ridgecrest, and <strong>Mojave</strong>/Rosamond SanitaryLandfills)• Department of Corrections Electrified Fence Project (California City State Prison)• U. S. Borax 1940 Acre ExpansionSection 7 Consultations: A different procedure governs projects and activities that areChapter 3 3-33
“authorized, funded or carried out” by the federal government, including those located on publiclands under BLM, National Park Service or Department of Defense jurisdiction. FESA requires thatfederal agencies shall, “in consultation with and with the assistance of [USFWS] insure that any[such] action ... is not likely to jeopardize the continued existence of any Endangered species orThreatened species or result in the destruction or adverse modification of [critical] habitat of suchspecies...” (FESA Section 7(a)(2).) The term “jeopardize” means to “engage in an action that wouldreasonably be expected, directly or indirectly, to reduce appreciably the likelihood of both thesurvival and recovery of a listed species in the wild by reducing the reproduction, numbers ordistribution of that species.” (50 Code of Federal Regulations (CFR) Section 402.02.)Accordingly, a federal lead agency “consults” with the USFWS if it determines that a project“may affect” a threatened or endangered species. Consultation is initiated when the federal leadagency submits a biological assessment or similar document to the USFWS that describes theproject, its anticipated impacts, and proposed mitigation. USFWS evaluates the informationprovided and determines if the effect can be avoided or if the effects are wholly positive. If so, only“informal consultation” will be carried out and the USFWS issues written concurrence that theproject is not likely to adversely affect listed species or designated critical habitat. If an adverseeffect cannot be avoided, “formal consultation” is required, and the USFWS issues a biologicalopinion that states whether the proposed project will jeopardize the continued existence of thespecies or will destroy or adversely modify critical habitat. If jeopardy is found, USFWS mustsuggest “reasonable and prudent alternatives” that could be implemented to prevent the species’existence from being jeopardized or critical habitat being destroyed. A “no jeopardy” opinion willprovide “reasonable and prudent measures” to ensure that take is minimized. “Terms andconditions” are issued to provide specific guidance for implementing the reasonable and prudentmeasures. Because of this, no terms and conditions can be issued for listed plant species. Only nonbindingconservation recommendations can be issued for plants.If critical habitat is designated after issuance of a no jeopardy opinion, the federal agencyis required to re-initiate consultation to obtain a determination of “no adverse modification” tothe critical habitat. Because of the frequent time lag between species listing and critical habitatdesignation, several projects have been required to re-initiate consultations under Section 7 of theESA.Consultations Conducted Within the <strong>Plan</strong>ning Area: A total of 234 biologicalopinions authorizing 263 California and Nevada projects having the potential to affect tortoiseswere issued between 1990 and 1995. Of the 133 biological opinions issued in California, 101 ledto ground disturbance when projects were developed, resulting in the loss of 53 tortoises (LaRueand Dougherty 1998) 2 . For these projects, terms and conditions were implemented that resultedin 919 tortoises being moved from harm’s way at the time of construction (Circle MountainBiological Consultants 1996, LaRue and Dougherty 1998). Because no comprehensive analysishas been completed for federal biological opinions since 1995, the following discussion isrestricted to these 1990 - 1995 projects. Table 3-4 shows the project types, number of tortoises2 During the same time, only four Section 10(a) permits were issued. Nine Section 10(a) permits have beenissued to date for tortoises in California (Bransfield, pers. comm.).Chapter 3 3-34
handled, and number accidentally killed during construction of the 101 projects.Table 3-4Numbers Of Tortoises Handled And Accidentally Killed During Construction Of 101Federally Authorized Projects In California Between 1990 And 1995PROJECT TYPE PROJECTS TORTOISES DEAD TOTOISESChapter 3 3-35HANDLEDPipeline 19 583 38Transmission Line 15 227 7Military 7 14 5Mining 19 59 2Highway 10 16 1Tract/Parcel 13 13 0Programmatic 13 5 0Miscellaneous 2 2 0Landfill 2 0 0Hazardous Materials 1 0 0Total 101 919 53This summary shows that long, linear projects (transmission lines and pipelines) wereresponsible for most of the harassment and mortality take of tortoises in California. Althoughthese two project types comprised only a third of the authorized projects (34 of 101 projects),they were responsible for 88% of the harassment take (810 of 919 tortoises handled) and 85% ofthe mortality take (45 of 53 tortoises accidentally killed). The study also identified the federallead agencies associated with these 101 projects, as summarized in Appendix L.BLM Consultation Procedures: Actions undertaken by, or permitted by, the BLM arefederal actions that may require informal or formal consultation under Section 7 with theUSFWS. BLM’s consultation procedures are described below, using a crude oil pipelineproposal as an example.A project proponent wishing to install a pipeline across public lands is required to obtaina right-of-way grant from the BLM. The proponent may also be required to obtain additionalpermits and authorizations from other federal agencies (e.g. Corps of Engineers). The federalagencies jointly identify a federal lead agency, usually the entity with the highest level ofinvolvement. In the case of a crude oil pipeline crossing significant miles of public lands, BLMis likely to be identified as the federal lead agency. This can be the case even if the projectproponent is a private entity and some or most of the lands crossed are private lands.Both take authorization and compensation are based on the entire alignment, regardless ofland ownership. In the case of the 70-mile Morongo Basin water pipeline, constructed betweenHesperia and Landers in the mid-1990s, the biological opinion applied to the entire projectalthough the alignment crossed fewer than five linear miles of BLM land. Tortoises wereauthorized to be moved out of harm’s way, the proponent was obligated to revegetate all nonaccessareas within the right-of-way, and compensation was based on the width of the newlyimpacted area multiplied by the 70-mile length, which included private lands.Based on presence-absence survey results and other available information submitted by
the proponent, the BLM determines if the project may affect a listed species. If BLM determinesthat a project will not affect a listed species it does not have to consult, either formally orinformally with the USFWS. BLM may ask the USFWS to concur in its no-effect determination,but it is not required to. If BLM makes a “may affect” determination, formal consultation will berequired. The USFWS has 45 days to review materials provided by the BLM and projectproponent, 90 days to draft a biological opinion, and an additional 45 days to deliver it. Thebiological opinion outlines reasonable and prudent measures and terms and conditions tominimize take of listed fish and wildlife on-site and compensate through land acquisition, habitatrehabilitation, and other measures off-site.Minimization measures have proven effective to alleviate impacts at the time ofconstruction (LaRue and Dougherty 1998). Clearance surveys are standard parts of takeavoidance measures. The proponent is obligated to delineate the work zone and restrict allimpacts to that area, maintain a litter-free environment to minimize the attraction of tortoisepredators (feral dogs, coyotes, ravens, etc.), and keep vehicle speeds below a certain level.Construction personnel are given awareness programs to avoid crushing tortoises or theirburrows.In addition to take avoidance measures to be implemented on-site, protecting orenhancing habitats off-site is often required to compensate impacts. Between 1990 and 1995,land acquisition was required by 44% percent of the biological opinions issued in California(LaRue and Dougherty 1998). For BLM projects, the proponent typically pays a compensationfee to offset the impact to tortoises ($700/acre), and may also be required to pay endowmentfunds to the CDFG ($230/acre), although this latter cost has not been consistently applied toevery federal project. Alternatively, the proponent may purchase and deed to the BLM or CDFGcompensation lands that meet with the approval of the BLM, and occasionally the CDFG. Insuch cases, field staff completes a Proposed Lands For Acquisition Form (PLFAF).A compensation ratio, developed for the interagency desert tortoise managementoversight group (MOG) in 1991, uses seven variables to determine a multiplying factor that isapplied to the acreage lost to development (<strong>Desert</strong> Tortoise Compensation Team 1991). Therange of compensation rates for various BLM habitat categories is given as follows (<strong>Desert</strong>Tortoise Compensation Team 1991): Category I = 3 to 6, Category II = 2 to 5, and Category III =1 (the standard in all areas). This means that the compensation ratio may be as high as 6:1,indicating that six acres of conservation habitat would be purchased for each acre of impact. Forexample, 40 acres of impact would be compensated by acquiring 240 acres of conservation land,or alternatively, paying $168,000 to BLM (240 acres at $700/acre).Chapter 3 3-36
3.1.5 California Endangered Species Act3.1.5.1 BackgroundCESA (Cal. Fish and Game Code 2050 et seq) is administered by the CDFG as thetrustee for fish and wildlife resources in the State of California. CESA authorizes the CaliforniaFish and Game Commission to establish a list of endangered and threatened species, and statesthat “no person shall...take...any species...that the commission determines to be an endangeredspecies or a threatened species … except as otherwise provided in this chapter, the Native <strong>Plan</strong>tProtection Act … or the Calfiornia <strong>Desert</strong> Native <strong>Plan</strong>ts Act.” (Section 2080.) The State maydesignate plant species as rare, pursuant to the California Native <strong>Plan</strong>t Protection Act, which hasthe same protection status as threatened or endangered species. That Act, however, allows thoseundertaking activities described in Section 1913, subdivision (a) and (b), to change the land usewhen they have been notified a rare or endangered plant is present as long as they give 10 daysnotice to CDFG to allow for salvaging the plant.3.1.5.2 Listed SpeciesSpecies listed as threatened or endangered by CDFG are identified in Table 3-5.Table 3-5Species Listed by CDFG as Threatened or EndangeredSPECIES STATUS DATE LISTEDBald eagle (Haliaeetus leucocephalus)EndangeredEndangered (Rev.)June 27, 1971October 2, 1980<strong>Desert</strong> tortoise (Gopherus agassizii) Threatened August 3, 1989Inyo California towhee (Pipilo crissalis eremophilus) Endangered October 2, 1980Least Bell’s vireo (Vireo bellii pusillus) Endangered October 2, 1980Mohave ground squirrel (Spermophilus mohavensis) Threatened June 27, 1971<strong>Mojave</strong> tarplant (Hemizonia [= Deinandra] mohavensis) Endangered August 1981<strong>Mojave</strong> tui chub (Gila bicolor mohavensis) Endangered June 27, 1971Red rock tarplant (Hemizonia Deinandra] arida) Rare July 1982Southwestern willow flycatcher (Empidonax traillii extimus) Endangered January 2, 1991Swainson’s hawk (Buteo swainsoni) Threatened April 17, 1983<strong>West</strong>ern yellow-billed cuckoo (Coccyzus americanusoccidentalis)3.1.5.3 Incidental Take PermitThreatenedEndangeredJune 27, 1971March 26, 1988Section 2081(b) of CESA authorizes the CDFG to allow, by permit, the take of anendangered, threatened or candidate species. Such a “Section 2081 permit” may be issued onlyif the following permit issuance criteria are met:(1) The take is incidental to an otherwise lawful activity.(2) The impacts of the authorized take shall be minimized and fully mitigated. The measuresChapter 3 3-37
equired to meet this obligation shall be roughly proportional in extent to the impact of theauthorized taking on the species. Where various measures are available to meet this obligation,the measures required shall maintain the applicant’s objectives to the greatest extent practicable.All required measures shall be capable of successful implementation. For purposes of this sectiononly, impacts of taking include all impacts on the species that result from any act that would causethe proposed taking.(3) The permit is consistent with any regulations adopted pursuant to Sections 2112 and 2114.(4) The applicant shall ensure adequate funding to implement the measures required by paragraph(2), and for monitoring compliance with, and effectiveness of, those measures. [CESA Section2081(b), emphasis added.]CESA further requires that no incidental take permit may be issued if issuance of thepermit would jeopardize the continued existence of the species, a determination that CDFG mustmake based on the best scientific and other information that is reasonably available. This mustinclude consideration of the species’ capability to survive and reproduce in light of knownpopulation trends, known threats to the species, and reasonably foreseeable impacts on thespecies from other related projects and activities.The Section 2081 permit applies only to CESA. It does not excuse an applicant fromobtaining a FESA Section 10(a) permit, issued by USFWS for species listed as threatened orendangered by the United States (see Section 3.1.4.5, above).3.1.6 Acquiring Incidental Take Permits: Procedures and CostsSeveral steps are currently necessary to determine whether Section 10(a) and Section2081 incidental take permits are needed. This section reviews those procedures, and the costsassociated with them. The permit procedures for the desert tortoise are used as a representativeexample of how the process works.Overview: The project proponent’s first step is to perform a tortoise “presence-absence”survey. This is usually done with the assistance of a trained consultant. If no tortoises are found,the developer can proceed with development. If tortoise sign is found, the developer must firstobtain Section 10(a) and Section 2081 permits. The USFWS’s regulations do not specify a timeframe for issuing Section 10(a) permits, so a permit may take a year or more to process andissue. Section 2081 permits may require between six months and a year to obtain. A permittypically will require the permittee to: (1) mitigate with land purchase, (2) employ an authorizedbiologist to conduct a “clearance survey” and to monitor construction, and (3) provideendowment funds to CDFG.Presence and Absence Survey Costs: Tortoise surveys are performed at about 4acres/hour, for between $35 and $125 per hour, so that a presence-absence survey on 40 acreswould cost between $350 and $1,250, depending on the consultant. When costs are included fortravel, mileage, per diem, report writing and overhead, the final report for that 40-acre site mayrun between $500 and $5,000. If no tortoise sign is found, there are rarely other costs relative tothreatened and endangered species, although Streambed Alteration Agreements, mitigation toavoid nesting birds and native plant salvage are occasionally separate permitting issues. Iftortoise sign is found, the proponent must secure State and federal incidental take permits.Chapter 3 3-38
Obtaining an Incidental Take Permit: Information on the nine Section 10(a) permitsissued for the desert tortoise in the planning area is available. These include the followingprojects: (1) California City Prison, (2) Cushenbury Sand and Gravel Mine, (3) High <strong>Desert</strong>Power Project, (4) Kern County Waste Management Project, (5) Miller Church Sites, (6)Statewide Electrified Fence Project, (7) Sunland Communities, (8) U.S. Borax Mine Expansion,and (9) Wildwash Sand & Gravel Mine. The Table 3-6 summarizes some of the pertinentaspects of eight of these projects; no information was available for the electrified fence project.Appendix G identifies the sources of the information displayed in this table.PROJECTNAMECaliforniaCity PrisonCushenburySand andGravelHigh <strong>Desert</strong>Power ProjectKern CountyWasteManagementMiller ChurchSitesSunlandCommunitiesU.S. BoraxMineExpansionWildwashGravel PitTotal: 8ProjectsTable 3-6Section 10(a) Permits Previously Issued In <strong>Plan</strong>ning AreaAs Of November 2002ACRES &LOCATION70 acres,Calif.City115 acres, SLucerneValley175 acres, NAdelanto40 acresRosamond20 acres Boron121 acresRidgecrest5 acres, YuccaValley160 acres,Victorville1,940 acres,BoronDATE ANDTIME FORISSUANCE1997, 6 to 9months1993-4, 3-4years35 acres, N ofVictorville months2,647 acres 6 months – 5yearsavg = 3 yearsREPORTCOSTSChapter 3 3-39COMPENSATIONRATIO & COSTTORTOISES“TAKEN”Unknown 1:1 @ $1,600,000 None taken between 1998and 1999, when completed$7,500 1:1 @ $103,500 - None; only +/- 15 acres$115,000 developed, but habitatmarginal, few expected1999, 3 years $70,000 1:1, $900,000 None; tortoises werehandled on the Section 7portion of this project, butnot on the 10a portion1997, 5 years Unknown 3:1, Unknown Cost None; no tortoises havebeen handled oraccidentally killed1993, 18months$3,500 1:1 @ $9,000 None; only tortoise scatfound at construction1994, 3 years $7,500 2:1 @ $220,000 None; project notdeveloped as of 20021996, +/- 2 $250,000 1:1 @ $969,900 None; 10 authorized, butyears includingnone taken as of 2002other docs1995, 11 $6,200 1:1 @ Unknown None; only tortoise scat$3,500-$250,000cost found at construction1:1 up to 3:1 No tortoise handled oraccidentally killed on anyprojectCompensation Cost, in the 5 th column, includes both land acquisition costs and endowment funds that were reportedby the main information sources for each projectTo obtain a Section 10(a) permit, the project proponent must submit a permit application,habitat conservation plan, environmental assessment or impact statement, and implementationagreement to the USFWS. The CDFG’s Section 2081 permit application is very similarincluding sections identifying the applicant, listing species to be covered, project description andlocation, listed species to be taken, impact analysis, jeopardy analysis, mitigation andminimization measures, monitoring and reporting program, funding, and certification. A
consultant is generally enlisted to draft these documents, which may cost from several thousanddollars to hundreds of thousands of dollars, depending on the complexity of the project. Costs ofmost small and larger projects range from $5,000 to $65,000.Drafting the HCP and supporting documents is a small percentage of the cost; mitigationand compensation are the major expenses. For example, it cost about $3,500 in 1993 to draft theHCP and associated documents for a five-acre church site in Yucca Valley (Tierra MadreConsultants, Inc. 1993) and $6,200 in 1995 for the documents associated with a 35-acre gravelmine site north of Victorville (Circle Mountain Biological Consultants 1995). U.S. Boraxindicated that the Section 10(a) permit issued around 1996 for expansion of the U.S. Borax minesite at Boron allowed for expansion into 1,940 acres of marginal tortoise habitat. Theapproximate cost to draft the environmental documents, including documents relative to theirConditional Use Permit and SMARA requirements, was about $250,000.Months or even years may pass between submittal of a permit application and issuance ofthe permit. For example, it took 18 months for the 1993 Section 10(a) permit to be issued for afive-acre impact by two church sites (Tierra Madre Consultants, Inc. 1993) and three years forthe 1994 Sunland Communities Section 10(a) permit to be issued (Tierra Madre Consultants, Inc.1994). By the time this latter permit was issued, there was no market for this proposed tracthome development; despite the expenditure of $220,000 in mitigation funds, this residentialproject remains undeveloped as of 2002. Given backlogs, current workloads, and limitedUSFWS staffing, a one to two-year waiting period is likely for issuance of a new Section 10(a)permit. CDFG may issue a Section 2081 permit in six months to a year.Clearance Survey: Section 10(a) and Section 2081 permits invariably require clearancesurveys, where tortoises are moved out of harm’s way immediately prior to mechanicalvegetation removal. It takes a biologist about twice as long to clear the site of tortoises as toconduct a presence-absence survey. Thus the cost of a clearance survey is about $1,000 to$10,000 (compared to $500 to $5,000).Mitigation/Compensation: Incidental take permits invariably have a land compensationcomponent. Depending on the location of the land and size of the parcel, compensation landmay cost between $500 and $1,300/acre, although the prison constructed in the northeasternportion of California City cost $5,000/acre (J. Stewart, pers. comm.) In addition, CDFGtypically requires an endowment. Most Section 10(a) permits have been compensated at 1:1,although Kern County Waste Management reported a compensation ratio of 3:1 for threelandfills. Sunland Communities purchased 320 acres of compensation land to partially offset theimpacts to tortoises on the 160-acre parcel that was to be developed. The total mitigation costwas $220,000 for the 160-acre site, or about $1,375/acre (excluding document preparation ormonitoring costs). The mitigation cost for California’s first tortoise Section 10(a) permit was$9,000 for 5 acres, or about $1,800/acre (Tierra Madre Consultants, Inc. 1993). Dave Weiss(pers. comm. Nov 2002) indicated that U.S. Borax was required to compensate at a 1:1 ratio,replacing 1,940 acres of marginal habitat with more suitable, manageable habitats. DennisBoyle, also of U.S. Borax, indicated that the compensation costs were $969,900, or about$500/acre. This cost did not include on-site compliance, biological monitoring, and otherassociated costs.Chapter 3 3-40
Monitoring: Monitoring is often the most expensive of all environmental protectioncosts. Depending on the project, an authorized biologist may remain on site for an hour, as asmall parcel is brushed, or up to months and years, as an interstate pipeline is installed or ahighway widened. Revegetation costs may also be very high, requiring the purchase of nativeseeds and the labor of contractors to broadcast and imprint the seed and to salvage cactus andyuccas. At present (2002), most monitoring costs are about $35 to $50/hour. Monitoring costs,then, may run from several hundred dollars for a day, up to $1,400 to $2,000 per week, $5,600 to$8,000 per month and, for long-term monitoring, $291,200 to $416,000 annually.Consultation and Incidental Take Permit Processes Compared: The comparisonsgiven above for eight Section 10(a) permits indicates that tortoises were neither handled(harassment take) nor accidentally killed (mortality take) during construction and operation onthe sites. Given the delay between the presence-absence tortoise survey and permit issuance,which was found to be about three years, it is likely that tortoises were extirpated in the interim.Alternatively, tortoises still occur in adjacent areas but were not directly affected by the project.As such, under current management compensation fees ranging from $500 to $5000/acre haveserved to compensate lost habitat where tortoises have not been directly affected, and has donelittle to minimize the indirect impacts that are likely to affect the tortoises in adjacent areas.Most of the existing development outside city limits occurs on private lands, where therehave been only nine Section 10(a) permits issued in California in the past 12 years. For example,of the 47,538 structures digitized from 1995 aerials, 46,150 (97%) were found on private lands.Most of this land occurs within the known historic range of the tortoise, and much of it (i.e.,3,079,403 acres (4,812 mi 2 ) of Survey Areas on public and private lands outside DWMAs) isexpected to continue to support tortoises. In fact, of 78 tortoise surveys performed in urbanizingareas, LaRue reported finding tortoise sign on 25 sites, or about a third (32%) of those surveyed.For comparison, only 1,388 of the 47,538 structures (3%) in 1995 occurred on public landsadministered by the BLM, where there had been 50 biological opinions issued between 1990 and1995.In addition to BLM’s 50 biological opinions, 42 were issued to the Department ofDefense, NASA, and U.S. Army Corps of Engineers (Circle Mountain Biological Consultants1996, LaRue and Dougherty 1998). During the same period, only three or four Section 10(a)permits were issued for private development. Relative private and public land acreage cannotexplain this disparity between Section 7 and Section 10(a) authorizations. The disparity appearsto be due to several other factors (see also discussion in LaRue 1994):• Many private land developers have opted to abandon projects when faced with mitigationcosts and permitting delays. Examples include the 160-acre Carl Jones site in AppleValley, and the 52-mile long Copper Mountain Mesa pipeline, which was originallyintended to be 102 miles long (LaRue, pers. comm.). The costs of permitting underSection 7 are invariably less because a consultant is not needed to draft the HCP,environmental assessment or impact statement, implementing agreement and otherassociated documents. In addition, Section 7 implementing regulations require theissuance of the biological opinion in 135 days, while no such time limit exists forprocessing a Section 10(a) permit.Chapter 3 3-41
• Because the Section 7 is cheaper and faster, project proponents select that alternativewhenever federal lands, even a very small proportion of project lands, or other regulatoryoversight is involved. This results in projects that cover large acreages of private landsand small to moderate amounts of federal lands being addressed under Section 7procedures.• The federal standard of “may affect” has a lower threshold for authorization than thestandards for a private Section 10(a) permit. For Section 7, both direct and indirectimpacts “may affect” tortoises, whereas authorization under Section 10(a) is requiredonly if actual take will result.• When construction or land disturbance on private land involves only ministerial permits, oris not subject to the jurisdiction’s permitting authority (e.g.. agriculture), it is typically leftto the project proponent and the USFWS to determine whether take will occur. Suchprojects, however, are individually minor enough that the wildlife agencies seldom becomeinvolved and the project proponent does not normally conduct biota surveys. The highcosts involved with the Section 10(a) permitting process may contribute to the reluctance oflocal jurisdictions to incorporate additional oversight of ministerial projects into theirzoning ordinances relative to biological resources.Many of the differences between Section 7 and Section 10(a) permitting have beendescribed and compared in LaRue (1994). In general, relative to Section 10(a), Section 7 has thefollowing advantages for project proponents: (a) it is quicker; (b) it facilitates project completion;(c) it avoids interagency conflicts; and, (d) it is less expensive. Cumulatively, each of these factorshas contributed, along with those given above, to more Section 7 authorizations as compared toSection 10(a). Recommendations were made to the USFWS in 1994 to expedite the issuance ofsmall-project Section 10(a) permits: (a) provide meaningful direction to the private developmentcommunity; (b) set a time limit for Section 10(a) permit review; (c) localize the review process;(d) ensure consistency; and, (e) ensure continuity (LaRue 1994).One problem associated with development of private lands is the inconsistent approachesamong the many different jurisdictions. In one city, for example, the planning department requirestortoise surveys on single-family residential lots, which are covered by ministerial permits in otherjurisdictions and therefore not subject to biota surveys. Some cities have identified areas wheretortoise surveys are no longer being performed. There are several examples where the biologicalconsultant erroneously concluded that a few tortoise scat and/or old burrows did not constituteoccupied habitat. Based upon the consultant’s conclusion, jurisdictions did not require applicantsto obtain necessary permits and, in several cases, tortoises were later found on site. There arenumerous cases where the project proponent completed a focused tortoise survey, and thejurisdiction (or regulatory agency) later required the applicant to conduct additional focusedsurveys for burrowing owl, LeConte’s thrasher, and Mohave fringe-toed lizards.There are significant problems associated with the current regulatory process fordetermining and mitigating take of the Mohave ground squirrel. Fewer than a dozen biologists arepermitted by CDFG to trap the MGS, and the trapping period (generally between March and May)Chapter 3 3-42
is so restrictive that project delays are common. In fact, most project proponents forego trappingand assume presence, obtain Section 2081 permits, and complete appropriate mitigation andcompensation (CDFG, pers. comm. 21 August 2002).The cost of trapping studies depends on the size of the project area, and can exceed the costto mitigate and compensate impacts. If the trapping result is negative, there is no need for issuanceof a 2081 permit; if positive, the proponent would need the take permit and pay associated costs.Although this has resulted in CDFG having to issue more permits, including projects where theMGS may not occur, there have not been substantial delays, as current staff are issuing permits in atimely manner (i.e., within a few months).3.2 AIR QUALITY, SOILS AND WATER3.2.1 Climate and Air QualityThe climate and air quality of the western <strong>Mojave</strong> <strong>Desert</strong> is discussed briefly below. Amore detailed discussion can be found in Appendix H.3.2.1.1 ClimateThe <strong>West</strong> <strong>Mojave</strong> planning area is a desert characterized by hot summer temperatures(average daily highs above 100 degrees Fahrenheit) and low annual precipitation (approximately5 inches). Snow can occur during the winter. Probably more important than the averages is theextreme variability in the weather. Daily temperatures ranges of 40 degrees can occur.Precipitation extremes are also common: variations of 80% in annual precipitation can occur.Summer thunderstorms can drop more precipitation on a site in one event than the meanprecipitation for that location. High winds can occur. Peak wind velocities above 50 miles perhour (MPH) are not uncommon and winds of 100 MPH occur every year.Temperature: Extremes of temperature are common in the planning area. Below ornear freezing temperatures are common at most weather stations. Seven of thirteen stations haveaverage low temperatures below freezing in December and January. El Mirage has the lowestaverage temperatures in the planning area and Twentynine Palms has the highest averagetemperatures. Average daily temperature variation is 29 degrees for all stations. Seasonalvariations are high. Ridgecrest, for example, has recorded highs of 118 degrees and lows of 0degrees since the middle 1980s.Precipitation: <strong>Desert</strong>s are noted for their low rainfall and the <strong>Mojave</strong> <strong>Desert</strong> is noexception. The blocking nature of the mountains on the western and southern boundaries of thedesert results in a rain shadow on the desert side of the mountains where precipitation is far lessthan on the coastal side. Weather patterns and their resulting precipitation follow the seasonalwind patterns and changes. This results in winter precipitation generally arriving from thesouthwest and spreading eastward across the desert. Winter precipitation volumes normally arethe highest in the western <strong>Mojave</strong> <strong>Desert</strong> and diminish toward the east. This is illustrated in themean precipitation for western locations such as Lancaster and <strong>Mojave</strong> (over 6 inches) andChapter 3 3-43
eastern cities such as Twentynine Palms (4 inches) (see also precipitation tables in Appendix H).All of the weather stations in the planning area receive some of their precipitation assnow. The total average snowfall ranges from under one inch in Trona to over three inches atHaiwee reservoir and Lancaster.A cyclic weather phenomenon called the El Nino brings increased precipitation toportions of the eastern Pacific Rim. This is especially true in the western <strong>Mojave</strong> <strong>Desert</strong>.Weather Bureau records indicate that there have been 23 El Nino years since 1931. These 23years represent approximately 1/3 of the years, but on the western edge of the desert, those yearsaccount for 65% of the precipitation. This east to west variability is also reflected in thepronounced east to west difference in the influence of the El Nino years. In Twentynine Palms,for example, only 44% of the precipitation falls in El Nino years as opposed to 65% along thewestern edge of the desert.During the summer the western edge of the <strong>Mojave</strong> <strong>Desert</strong> is heavily influenced by thedry southwest airflows resulting in typically very dry weather. The influence of the southwestwinds diminishes toward the eastern <strong>Mojave</strong> <strong>Desert</strong>. This results in a more continental influenceand its resulting monsoonal weather patterns. This is illustrated by comparing Randsburg (alongthe western edge of the planning area) with Needles (in the eastern <strong>Mojave</strong>). In Randsburg, onlytwo percent of the Julys and six percent of Augusts have more than 1 inch of precipitation. Bycomparison, in Needles, more than 1 inch of monthly precipitation falls in sixteen percent of theJulys and twenty-seven percent of the Augusts. Even sites within the eastern portion of theplanning area (such as Twentynine Palms) average more precipitation in July and August thanthey do in January and February.The consistent occurrence of two wet seasons in the eastern portion of the planning areais reflected in the vegetation. There is a distinction between plants having most of theirphotosynthetic activity during the late spring and summer (warm season plants) and plantshaving most photosynthetic activity during the winter (cool season plants). The vegetation in theeastern <strong>Mojave</strong> <strong>Desert</strong> includes warm season plants such as <strong>Mojave</strong> yucca (Yucca schidigrea),galleta grass species (Pleuraphis spp.) and others in addition to the cool season plants. Thewarm season plants are absent from the western edge of the desert. The break between the warmseason area and the cool season area follows a north south line along the <strong>Mojave</strong> River and justwest of Harper Dry Lake. The cool season areas are the Indian Wells and Searles Valleys souththrough the Antelope Valley and east to near the <strong>Mojave</strong> River.Extreme variability is another characteristic of the precipitation. Some locations such as<strong>Mojave</strong> have a mean precipitation of 6.06 inches and a standard deviation of 4.04 inches. Thismeans that the normal precipitation ranges from a low of 2.02 inches to 10.10 inches. This is an80 % variation in precipitation volumes.Drought: When precipitation is below average, it is considered a drought. The PalmerDrought Severity Index (PDSI) has become the semi-official drought index. The PDSI usesprecipitation and other moisture data to develop a dryness index. The index uses “0” as normalfor a site and negative numbers to indicate severity of a drought and positive numbers to indicateChapter 3 3-44
excess moisture. A minus 4 is considered a severe drought. The NOAA Drought InformationCenter has used instrument data in combination with tree ring data to construct a table of PDSIfor the period of 1700 to 1995. One of the sites for which data has been collected is just east ofBarstow. Using that data in combination with other PDSI data, Figure 3-2 was constructed toillustrate the long-term trend for this site. In addition a moving average was added to the chart toshow the trend. From the chart it is apparent that a drought occurred from 1951 through 1979that was the longest duration the current time and is the most severe in the last 300 years (seeAppendix H).3.2.1.2 Air QualityAir Basins: The <strong>West</strong> <strong>Mojave</strong> planning area falls within portions of three different airbasins. These are the Great Basin Valleys Air Basin (GBVAB), the <strong>Mojave</strong> <strong>Desert</strong> Air Basin(MDAB) and the Salton Sea Air Basin (SSAB) (see Map 3-2). The Great Basin Valleys AirBasin includes all of Inyo and Mono Counties. The <strong>Mojave</strong> <strong>Desert</strong> Air Basin includes the desertportions of Kern, Los Angeles, San Bernardino Counties and the Paloverde Valley portion ofRiverside County. The Salton Sea Air Basin includes the Coachella Valley portion of RiversideCounty and Imperial County. The United States Environmental Protection Agency (USEPA)breaks these air basins into planning areas based upon various emission problem or watershedboundaries.Air Quality Management Districts: The management/enforcement of the air qualitystandards falls on several different jurisdictions. The USEPA has the primary responsibilitiesunder the Federal Clean Air Act (CAA). The USEPA had transferred a number ofresponsibilities to the states and in most cases, regional air quality management districts. The<strong>West</strong> <strong>Mojave</strong> planning area falls within five different regional air districts (see Map 3-3):• The desert portions of San Bernardino County and the Palo Verde Valley portion ofEastern Riverside County are within the <strong>Mojave</strong> <strong>Desert</strong> Air Quality Management District(MDAQMD).• Inyo and Mono Counties are within the Great Basin Unified Air Pollution ControlDistrict (GBUAPCD).• The Antelope Valley Portion of Los Angeles County is in the Antelope Valley AirQuality Management District (AVAQMD).• The Coachella Valley portion of Riverside County is within the South Coast Air QualityManagement District (SCAQMD).• The eastern (desert) portion of Kern County is within the Kern County Air PollutionControl District (KCAPCD).Air Quality Overview: Much of the time, air quality in the western <strong>Mojave</strong> <strong>Desert</strong> isgood. There are, however, times that localized areas have not met air quality standards due tolocally generated and/or transported in pollutants. The entire planning area has been classified asnon-attainment areas for PM 10 (Map 3-4), ozone (Map 3-5), sulfates and/or hydrogen sulfideunder the state and/or national standards (see Table 3-7). In addition, there is concern forvisibility reducing particles and PM10 precursor emissions including oxides of nitrogen (NOx),Chapter 3 3-45
oxides of sulfur (SOx) and reactive organic gases (ROG). The designation of attainment/nonattainmentareas for the new PM2.5 and 8-hour ozone standards will occur in the future. Thestate Air Resources Board has recommended to the USEPA that most of the <strong>Mojave</strong> <strong>Desert</strong> AirBasin be classified as federal ozone nonattainment areas under the new 8 hour standard.The CAA and the California Clean Air Act contain the primary provisions relating to airquality. Among the most important provisions are the sections relating to the establishment ofthe National and State Ambient Air Quality Standards, nonattainment areas, the development ofstate implementation plans (SIP), prevention of significant deterioration (PSD), air toxics andfederal conformity. The USEPA and the California Air Resources Control Board have issuedrules to implement the federal and California Clean Air Acts.The federal and state Clean Air Acts regulate certain forms of pollution under three maincategories. These are criteria pollutants, air toxics and global warming and ozone-depletinggases. There is also regulation of a more general category of emissions that reduce visibility.These come under the titles of regional haze, prevention of significant deterioration (PSD) andvisibility reducing particulates (VRP).The definitions used in determining whether or not an area meets air quality standards arefound in the federal and state Clean Air Acts and their associated ambient air quality standards.Criteria pollutants are defined as those pollutants for which the federal and state governmenthave established ambient air quality standards, or criteria, for concentrations in order to protectpublic health. Under the federal Clean Air Act, the USEPA has established National AmbientAir Quality Standards (NAAQS) for seven criteria pollutants (ozone, respirable particulatematter (PM 10 ), fine particulate matter (PM 2.5 ), carbon monoxide, nitrogen dioxide, lead andsulfur dioxide). These standards are used to classify all areas as to whether they are inattainment, in nonattainment or are unclassified for any of the NAAQS. California hasestablished California Ambient Air Quality Standards for the same federal criteria pollutants plusan additional 3 pollutants (visibility reducing particulates, sulfates and hydrogen sulfide). TheAmbient Air Quality Standards for California are stricter than the federal standards (see Table 3-7).Chapter 3 3-46
Air BasinsN190I n y o C o395Ridgecrest178Ke r n C o14California City395155814LancasterPalmdale138Lo s A n g e l e s C o15BarstowAdelantoVictorville Apple ValleyHesperia18Sa n B e r n a r d i n o C o2474066LegendHighwaysCounty Lines<strong>Plan</strong> BoundaryAir BasinsGreat Basin<strong>Mojave</strong> <strong>Desert</strong>Salton SeaYucca ValleyTwentynine Palms62R i v e r s i d e C o10/12/04<strong>West</strong> <strong>Mojave</strong> <strong>Plan</strong> <strong>FEIR</strong>/SMap 3-2Scale: 1 : 1,750,0000 10 20 30Km0 10 20 30Miles
Air Quality Management DistrictsN190395GreatBasinUnifiedAPCDI n y o C o .178K e r n C o .Kern CountyAPCD14395<strong>Mojave</strong> <strong>Desert</strong>AQMD155814S a n B e r n a r d i n o C o .Antelope ValleyAQMD154066138L o s A n g e l e s C o .1824762LegendHighways<strong>Plan</strong> BoundaryAQMD BoundariesR i v e r s i d e C o .SouthCoastAQMD10/12/04<strong>West</strong> <strong>Mojave</strong> <strong>Plan</strong> <strong>FEIR</strong>/SMap 3-3Scale: 1 : 1,750,0000 10 20 30 Km0 10 20 30 Miles
Federal PM10 <strong>Plan</strong>ning AreasN190OwensValleyI n y o C o395CosoJunctionIndian WellsValley178TronaK e r n C o1439558<strong>Mojave</strong> <strong>Desert</strong>1514S a n B e r n a r d i n o C o401566138L o s A n g e l e s C o1824762LegendCounty LinesHighways<strong>Plan</strong> BoundaryPM10 AreasR i v e r s i d e C o10/13/04<strong>West</strong> <strong>Mojave</strong> <strong>Plan</strong> <strong>FEIR</strong>/SMap 3-4Scale: 1 : 1,750,0000 10 20 30Km0 10 20 30Miles
Federal Ozone <strong>Plan</strong>ning AreasN190I n y o C o .395178K e r n C o .S a n B e r n a r d i n o C o .1439515581440156613818L o s A n g e l e s C o .24762LegendCounty Lines<strong>Plan</strong> BoundaryEastern Kern AQMASouthwestern <strong>Desert</strong> Modified AQMAR i v e r s i d e C o .7/29/04<strong>West</strong> <strong>Mojave</strong> <strong>Plan</strong> FEISMap 3-5Scale: 1 : 1,750,0000 10 20 30Km0 10 20 30Miles
POLLUTANTOzone (O 3 )RespirableParticulateMatter(PM 10 )FineParticulateMatter(PM 2.5 )CarbonMonoxide(CO)NitrogenDioxide(NO 2 )LeadSulfurDioxide(SO 2 )VisibilityReducingParticulatesTable 3-7Ambient Air Quality StandardsAVERAGING CALIFORNIA STANDARDSFEDERAL STANDARDSTIMEPrimarySecondary1 hour 0.09 ppm (180 µg/m 3 ) 0.12 ppm (235 µg/m 3 ) Same as Primary Standard8 hourAnnual geometric____Mean 20 µg/m 3 Same as Primary StandardAnnual Arithmetic____ 50 µg/m 324 hour 50 µg/m 3 150 µg/m 3Mean24 hour 65 µg/m 3Annual ArithmeticSame as Primary StandardMean 12 µg/m 3 15 µg/m 38 hour1 hour8 hour(Lake Tahoe)Annual Arithmetic____ 0.053 ppm (12 µg/m 3 )Mean1 hour 0.25 ppm (470 µg/m 3 )Chapter 3 3-51NoneSame as Primary Standard30 day average 1.5 µg/m 3Calendar quarter 1.5 µg/m 3 Same as Primary StandardAnnual Arithmetic0.030 ppm (80 µg/m 3 )Mean24 hour 0.04 ppm (105 µg/m 3 ) 0.14 ppm (365 µg/m 3 )3 hour 0.5 ppm (1300 µg/m 3 )1 hour 0.25 ppm (655 µg/m 3 )8 hourIn sufficient amount to produce an(10 am toextinction coefficient of 0.23 per6 pm, PST) kilometer ___ visibility of ten miles orNomore (0.07_30 miles or more for LakeTahoe) due to particles when the relativeFederalhumidity is less than 70 percent.Method: ARB method V (8/18/89)Standards1 hour 0.03 ppm (42 µg/m 3 )Sulfates 24 hour 25 µg/m 3HydrogenSulfideAreas that are classified as nonattainment by the USEPA are required to prepare andimplement a State Implementation <strong>Plan</strong> (SIP) that identifies and quantifies sources of emissionsand presents a comprehensive strategy to control and reduce locally generated emissions.Air quality quality degradation and exceedances of the ambient air quality standards havebeen episodal in nature. High PM 10 concentrations that violated the National Ambient AirQuality Standards peaked in the early 1990s. In recent years, good monitoring data has led toreclassification requests to the USEPA for most of the region. Implementation of dust controlrules and controls on a number of critical sources have led to the reductions in PM 10concentrations. The numbers of violations of the NAAQS for ozone has declined, but violationshave continued. Rules establishing controles for Ozone precursor enissions have beenimplemented, but overwhelming transport of pollutants from the South Coast Air Basin and theSan Joaquin Valley Air Basin continually impacts the desert. Both the South Coast and the SanJoaquin Valley are both classified as serious nonattainment areas (see Table 3-8). The SouthernCalifornia Association of Governments (SCAG) has projected population growth and future
pollution levels through 2025. The projections are for a population increase of over 50% areduction in ozone precursor levels over 30% and increases in PM 10 levels of nearly 30%.AIRBASINAIR QUALITYDISTRICTTable 3-8Attainment Status By Air Basin and Air DistrictPOLLUTANTPLANNINGAREA NAMEFEDERALDESIGNATIONSTATEDESIGNATIONGBVAB GBUAPCD PM 10 (federal) Owens Valley SevereNonattainmentPM 10 (federal) Rose Valley ModerateNonattainmentPM 10 (state) GBVAB NonattainmentAll others GBVAB Unclassified/attainmentAttainmentMDAB KCAPCD PM 10 (federal) Indian WellsValleyModerateNonattainmentPM 10 (state) MDAB NonattainmentOzone Eastern Kern Nonattainment(federal) County*Ozone (state) MDAB NonattainmentAll othersEastern KernCountyUnclassified/attainmentMDAQMD PM 10 (federal) Searles Valley ModerateNonattainmentPM 10 (federal) <strong>Mojave</strong> <strong>Desert</strong> ModerateNonattainmentOzone(federal)Ozone (state)<strong>Mojave</strong> <strong>Desert</strong>modifiedSan BernardinoCo. WideNonattainmentAttainmentNonattainmentSulfates (state) Searles Valley NonattainmentHydrogen Searles ValleyNonattainmentSulfide (state)PM 10 (state) San BernardinoCo. wideNonattainmentAll othersMDAQMDWideUnclassified/attainmentNonattainmentAVAQMDOzone(federal)<strong>Mojave</strong> <strong>Desert</strong>modifiedNonattainmentPM 10 (state) Basin wide NonattainmentOzone (state) Basin wide NonattainmentAll Others Basin wide Unclassified/attainmentNonattainmentChapter 3 3-52
AIRBASINAIR QUALITYDISTRICTPOLLUTANTSSAB SCAQMD Ozone(federal)Chapter 3 3-53PLANNINGAREA NAMECoachella ValleyFEDERALDESIGNATIONNonattainmentSTATEDESIGNATIONPM 10 (state) SSAB NonattainmentOzone (state) SSAB NonattainmentAll others SSAB Unclassified/attainmentAttainmentRespirable Particulate Matter (PM 10 ): PM 10 is the most important air pollutant in the<strong>West</strong> <strong>Mojave</strong> planning area. PM 10 in the atmosphere can be caused by both environmentalfactors and human activities. Human activities that contribute to the PM 10 emissions includecombustion sources such as stack emissions, diesel exhaust and smoke from prescribed fire andwild fire, fugitive dust sources such as construction and demolition activities, off highwayvehicle (OHV) travel, unpaved public roads and parking lots, industrial activities, OHV openareas and military activities. The combustion sources tend to produce smaller particulates (lessthan 5 µ) while fugitive sources tend to produce larger particulates (larger than 5µ).One of the reasons for the concern with PM 10 emissions is their adverse effect on humanhealth. All of the PM 10 particles are considered respirable particulate because they can beinhaled into the nose, throat and/or lungs. The fine PM 10 particles are the largest threat to healthbecause they tend to deposit in the air sacks. In addition, many of the fine particles are fromprecursor emissions many of which are toxic or carcinogenic. Fugitive dust is primarily coarseparticulate that is not as likely to contain toxic materials. The newest studies report that a 100µgm/m 3 increase in daily PM 10 concentrations would increase mortality by 10%. The state PM 10standards are considered public health goals. The USEPA has established new NAAQSstandards for PM 2.5 emissions. These standards are for particles at or below 2.5 µ. These fineparticles have been implicated as an increased health risk and consist of chemical compoundsthat mostly result from combustion processes.Nearly all of the planning area has recorded concentrations of PM 10 in excess of thenational and state ambient air quality standards for PM 10 emissions. The USEPA has classifiedfive areas within the <strong>West</strong> <strong>Mojave</strong> planning area as federal PM 10 nonattainment areas. The fivecurrent federal nonattainment areas are: the Owens Valley PM 10 <strong>Plan</strong>ning Area, the CosoJunction PM 10 <strong>Plan</strong>ning Area, the Indian Wells Valley PM 10 <strong>Plan</strong>ning Area, the Trona PM 10<strong>Plan</strong>ning Area and the San Bernardino County PM 10 Area. The Owens Valley planning area isone of five serious federal nonattainment PM 10 planning areas in the nation. Southeast KernCounty and northeastern Los Angeles County (Antelope Valley) are currently listed asunclassified by the USEPA.The Antelope Valley Area has recorded levels above the national threshold, but has notbeen classified as nonattainment by USEPA yet. The air quality management district has beenworking directly with USEPA to successfully reduce the PM 10 concentration levels and avoidhaving the Antelope Valley <strong>Plan</strong>ning Area designated as a federal nonattainment area. Part ofthis effort is through the adoption and implementation of rules to control fugitive dust that
constituted a majority of the total PM 10 emissions.The original Searles Valley PM 10 <strong>Plan</strong>ning Area abutted the Owens Valley PM 10 <strong>Plan</strong>ningarea on the north and included Rose Valley, Indian Wells Valley and Searles Valley. TheUSEPA recently broke the federal nonattainment area into three separate nonattainment areasbased upon the county lines. These three new federal nonattainment areas are called the CosoJunction, the Indian Wells Valley and the Trona PM 10 nonattainment areas. Emission sourcesidentified in the SIP include construction/demolition, public unpaved roads, paved roads, mobilesources, unplanned fires, public disturbed areas, fuel combustion (cogeneration boiler and stacksat Trona), North American fugitive, industrial roads, agricultural fields and military activities. In1990 there was an estimated 3.98, 4.76 and 9.18 tons/day of PM 10 emissions in the CosoJunction, Indian Wells Valley and Trona nonattainment areas respectively. Activities on BLMlands are estimated to contribute 8% of the total PM 10 emissions in the Trona nonattainment area.The primary source of BLM emissions is OHV activity and unpaved road travel in the SpanglerHills Open Area and surrounding areas. The Trona PM 10 SIP targets the BLM emissions for a20% reduction. The Kern County APCD and <strong>Mojave</strong> <strong>Desert</strong> AQMD have developed rules toimplement the SIPs. Current monitoring data has not indicated any recent exceedances of theNAAQS in any of these three nonattainment areas. As a result, documents have been preparedfor the three areas requesting a reclassification from nonattainment to maintenance.The USEPA classified the San Bernardino County desert area as a PM 10 non-attainmentarea on January 20, 1994. The <strong>Mojave</strong> <strong>Desert</strong> AQMD prepared a “Particulate Matter (PM 10 )Control Strategy <strong>Plan</strong>” and submitted it to the state for inclusion into the state SIP. The USEPArecently disapproved the plan and returned it to the <strong>Mojave</strong> <strong>Desert</strong> AQMD for revision. Emissionsources identified in the plan include construction/ demolition, city and county unpaved roadstravel and wind erosion, paved road entrainment, city and county disturbed areas and industrialactivities. Four BLM open areas (Stoddard Valley, Johnson Valley, Rasor, and El Mirage) arewithin the nonattainment area and the <strong>West</strong> <strong>Mojave</strong> planning area. The draft plan called forBLM to prepare a Dust Control <strong>Plan</strong> for activities within the core problem area of thenonattainment area. At the present time there is no approved SIP for the nonattainment area toguide actions there. Currently new rules are being drafted to come into compliance withUSEPA. These new rules will likely require BLM to prepare dust control plans for the entirefederal nonattainment area.Ozone: The South Coast Air Basin and the San Joaquin Valley Air Basin are bothfederal non-attainment areas for ozone. Much of the ozone pollution in the desert has beentransported in from those two areas. Several studies have looked at the ozone pollution problemin the desert areas. The studies show that the peak ozone levels do not correspond to the peaktemperatures and ultraviolet (UV) levels, but are occurring much later in the day indicating thatthe ozone is being formed down wind and is being transported into the area from its source bythe prevailing winds. Heavily impacted areas by ozone transport include the Victorville-Barstowarea, the Antelope Valley and Joshua Tree National Park. The NAAQS for ozone do notrecognize transport as a factor in their standards. As a result, the USEPA has classified most ofthe Salton Sea and <strong>Mojave</strong> <strong>Desert</strong> Air Basins as non-attainment areas for ozone. The onlyexception is a strip along the northern and eastern edge of San Bernardino County that isexcluded from the federal ozone nonattainment area. The state standards allow for theChapter 3 3-54
subtraction of transported ozone in determining attainment / nonattainment areas. However, thestate standards are much tighter. As a result, all of the <strong>West</strong> <strong>Mojave</strong> planning area outside ofInyo County is in nonattainment of the California ozone standards.Conformity Determination: The classification of an area as a federal nonattainmentarea brings an additional requirement for federal agencies. Section 176(c) of the Clean Air Act(CAA), as amended (42 U.S.C. 7401 et seq.), and regulations under 40 CFR, part 93,subpart W,state that “no department, agency or instrumentality of the Federal Government shall engage in,support in any way or provide financial assistance for, license or permit, or approve any activitywhich does not conform to an applicable implementation plan.” This means that under the CAA176(c) and 40 CFR, part 93, subpart W, (conformity rules), federal agencies must make adetermination that proposed actions in federal nonattainment areas conform to the applicableimplementation plan (SIP) before the action is taken.3.2.2 Geology and SoilsRegional Geologic Overview: The <strong>West</strong> <strong>Mojave</strong> planning area is mainly in the <strong>Mojave</strong><strong>Desert</strong> geomorphic province (<strong>Mojave</strong> Block) of California. However, it takes in a substantialportion of the Basin and Range province to the north, and overlaps with the Sierra Nevadaprovince to the northwest and the Transverse Ranges to the southwest. The geomorphology ofthe province is dominated by broad basins filled with sediments shed from adjacent highlandsand mountains, burying the old topography. The region may once have been a part of the Basinand Range province until separated from it when the Garlock Fault became active in the early tomid Tertiary Period. Although Paleozoic and early Mesozoic-age rocks are present, the desertitself is a Cenozoic-age feature, formed as early as the Oligocene, presumably from movementsrelated to the San Andreas and the Garlock faults. During the Pleistocene (Ice Ages) this regionof California had a cooler average temperature and lesser evaporation rate than present. Whilenever a wet climate, it nonetheless once contained many small lakes, and the <strong>Mojave</strong> River stillhad water in it. The majority of the surface in the planning area is covered by Quaternary-ageunconsolidated surficial deposits. These deposits are comprised primarily of alluvial, fluvial,lacustrine and aeolian derived material.The <strong>Mojave</strong> <strong>Desert</strong> province can be divided into western and eastern portions. The“western <strong>Mojave</strong>” lies within the wedge where the San Andreas and Garlock faults meet, and isbounded on the east by the <strong>Mojave</strong> River and a line running northwest from Barstow to RedRock Canyon (Sharp, p.28). Uplifts along the two major fault systems include the El PasoMountains along the northwest side of the Garlock fault, and the San Gabriel and San BernardinoMountains along the southwest side of the San Andreas fault. The western <strong>Mojave</strong> consists ofgreat expanses of gentle surface with isolated knobs, buttes, ridges, and local hilly areas. The“eastern <strong>Mojave</strong>” consists of alluvial filled basins (downthrown blocks) between mountainranges separated by normal faults, but includes thrust-fault-emplacement basin and ranges. Inthe southern half, the mountain ranges have a general northwest trend, whereas in the northernhalf these features have no consistent orientation. For more detailed geology, the reader isreferred to the Geologic Map of California, San Bernardino Sheet (Bortugno and Spittler, 1986).Chapter 3 3-55
Basin and Range province is a geologic term referring to the structure of this province'svalleys (basins) and mountains (ranges) aligned roughly north to south. The province extendsfrom the Wasatch Mountains of Utah to the eastern side of the Sierra Nevada in California. Thispart of North America is a region where the earth's crust has been extended (stretched thinner)from east to west, and mountain ranges in this province are generally bounded by faultsassociated with this thinning and stretching. The planning area north of the El Paso Mountainsand east of U.S. Highway 395 is part of the Basin and Range province. This includes the CosoMountains, the Argus Mountains, the Slate Mountains and their adjacent valleys. The CosoMountains consist largely of igneous/volcanic rocks, including pumice, basalts, cinders andobsidian, and is tectonically active with frequent, very small earthquakes. The Argus and SlateRanges are mostly igneous/granitic rocks, with some volcanic rocks and exposures of limestoneformations. Searles Valley is well known for its deposits of sodium minerals, which are theremnant of a Pleistocene lake that once formed the terminus of the Owens River.The Transverse Range region is one of eastward-trending mountain ranges and valleys.It is so named because this trend is transverse to the generally northwesterly trending features ofsouthern California. The lowlands of the San Bernardino and Los Angeles plains of the easternpart of this region rise abruptly northward to the San Bernardino and San Gabriel Mountains,respectively, two of the most rugged and highest ranges in southern California. The rock units ofthe Transverse Range region may be divided into two main groups, (a) crystalline basementcomplex composed of metamorphic and plutonic rocks, and (b) sedimentary and volcanic rocks.The metamorphic rocks of this complex include, from oldest to youngest, Precambrian gneissand marble, Precambrian Pelona Schist, Paleozoic metasedimentary rocks hosting goldmineralization, and marble/limestone used for cement, specialty fillers and extenders, chickengrit, and aggregate, and Pre-Cenozoic rock (Dibblee, 1970, p. 36).In summary, the age of the rocks within the area ranges from Precambrian to Recent andis characterized by great diversity including marine and nonmarine sedimentary rocks and a widevariety of volcanic and intrusive igneous rocks. The geologic events include those related toplate collision, metamorphism, and faulting. This diversity of rock types, long history of igneousactivity, and the complex structural and geomorphic development of the region have resulted inthe formation of a wide variety of mineral assemblages and their concentration to form the oredeposits that are present in the study area. Characteristics of favorable geologic environments, or“permissive terrains”, for the potential occurrence of mineral resources in the area are discussedin an unpublished U.S. Geological Survey report (Tosdal, et al, 1992, 21 p.).Soils: Soil surveys have been completed by the United States Department of Agriculture,Natural Resource Conservation Service on less than half of the planning area. Published soilsurveys include the Southeastern Part of Kern County, San Bernardino County <strong>Mojave</strong> RiverArea, Fort Irwin National Training Center, Edwards Air Force Base, and the Marine Corps AirGround Combat Center Twentynine Palms. Because of the large area within the <strong>Mojave</strong><strong>Plan</strong>ning Area and incomplete soil survey coverage, general soil information will be used andextrapolated in areas that are not covered by soil surveys for this analysis.Chapter 3 3-56
The general soil information and maps provide information on broad areas that have adistinctive pattern of soils, relief, and drainage. Many different kinds of soil have formedthought the planning area. Ongoing soil forming processes are evident in desert soils. Severalprocesses are involved in the formation of soils. These processes are the accumulation oforganic matter, the formation of and translocation of silicate clay, the accumulation of silica andlime, weathering of parent material and the formation of desert pavement. General soils aredivided into mapping units that represents a unique natural landscape. Typically a mapping unitconsists of one or more major soils or miscellaneous areas and some minor soils. The soils inany map unit may differ from place to place in slope, depth, drainage, and other characteristicsthat affect management. The general map units have been grouped for broad interpretivepurposes.The San Bernardino County <strong>Mojave</strong> River Area is comprised of three groups:• Soils of the <strong>Mojave</strong> <strong>Desert</strong> on flood plains, alluvial fans, and terraces and in basins aredominantly in low positions in arid areas and are comprised of seven map units. Slopesare nearly level to strongly sloping. Elevation ranges from about 1,700 feet to about4,000 feet. Soils are very deep and shallow and are moderately to somewhat excessivelydrained. The surface layer is sand, loamy sand, loamy fine sand, sandy loam, loam, andclay. Soils are used mainly for irrigated crops, homesite development, wildlife habitat,and livestock grazing.• Soils of the <strong>Mojave</strong> <strong>Desert</strong> on old terraces that have a desert pavement and on alluvialfans, foothills, and mountains are dominantly on scattered rock desert uplands onadjacent high terraces in the central and northern parts of the survey area. Elevationranges from about 1,800 to 4,500 feet. The four mapping units in this group range indepth form very shallow, shallow, moderately deep to very deep. They are well drainedwith the surface layer is gravelly sand, very gravelly sand, cobbly sandy loam, gravellysandy loam, sandy loam, and loam. Soils are used for wildlife habitat, grazing, and asource of gravel.• Soils of the San Gabriel and San Bernardino Mountains on mountains, foothills, alluvialfans, and terraces are gently sloping to steep and range in elevation from 3,400 to 6,200feet. The four mapping units in this group are moderately deep and very deep and arewell drained and somewhat excessively drained. The surface layer is sandy loam andloamy fine sand. Soils are used for wildlife habitat, grazing, homesite development,irrigated crops and pasturelands.The Southeastern Part of Kern County Soil Survey is comprised of two groups within the<strong>West</strong> <strong>Mojave</strong> <strong>Plan</strong>ning Area:• Soils of the <strong>Mojave</strong> <strong>Desert</strong> occupy several different landscapes that range from lowbasins to high mountain ridges. Seven mapping units are incorporated into this group.Soils are nearly level to very steep ranging from 2,000 to 4,200 feet elevation and areshallow, deep, or very deep, and well to excessively drained. Surface layers range fromChapter 3 3-57
sand to clay loam. Soils are used for rangeland, recreation, or wildlife habitat. Wherewater is available, a few of the soils are used for cropland or homesites.Soil limitations include a high susceptibility to soid blowing of the sand surface layersand excessive erosion hazard due to slopes with inadequate plant cover.• Soils on the Eastern Foot Slopes of the Sierra Nevada and Tehachapi Mountains aredominantly strongly to very steep with some soils in mountain valleys that are nearlylevel. Elevation ranges from 2,000 to 8,000 feet. Soils are shallow to very deep and welldrained to somewhat excessively drained. Surface layers are gravelly sandy loam,gravelly loam, or sandy loam. Four mapping units in this group are used for woodland,rangeland, recreation, and wildlife habitat. Those soils in the more level mountain valleysare used irrigated cropland.The Fort Irwin National Training Center Soil Survey is comprised of five groups and canbe used to extrapolate information about soils for surrounding areas:• Soils in basins and on basin rims are comprised of one mapping unit occupying alluvialflats, fan skirts, and playas landforms. Soils are somewhat poorly to excessively drained,very deep soils formed in mixed alluvial or lacustrine materials on nearly level to gentleslopes. Surface layers are sandy loam to fine sandy loam, coarse sand, loamy coarse sand,silty clay loam, silty clay or clay.• Soils on alluvial fans and alluvial fan remnants are comprised of four mapping units. Thesurface layer is composed of sand, coarse sand, loamy coarse sand, sandy loam, loamysand, loam, or silt loam. Soils are well drained and very shallow to very deep and aregently to strongly sloping.• Soils on granitic pediments and inselbergs are comprised of one mapping unit somewhatexcessively drained, very shallow over granitic bedrock soils formed in residuum. Thesurface layer is coarse sandy loam or sandy loam. Slopes are undulating to steep.• Soils on fan remnants, erosion remnants, and ballenas are comprised of two mappingunits. Landforms are undulating to hilly with very shallow to very deep, well-drainedsoils. Surface layers are loamy coarse sand, coarse sandy loam, sandy loam, or loam.• Soils on hills and mountains are comprised of three mapping units. Landforms arerolling to very steep with very shallow to shallow well drained to excessively welldrainedsoils. Surface layers are sand clay loam, sandy loam, or loam.Soils within the training center are used for military exercises and wildlife habitat. Soilsoutside the training center are most likely used for grazing, wildlife habitat, recreation, andhomesite development.Chapter 3 3-58
The Marine Corps Ground Combat Center Twentynine Palms are comprised of threegroups:• Soils on bolson floors are comprised of one mapping unit with very deep, clayey orcoarse loamy, salt affected soils formed in lacustrine deposits. The landform setting issmooth lake plains and playas. Elevation ranges from 600 to 2,900 feet. Soils aresomewhat poorly drained to well drained.• Soils on fan piedmonts are comprised of five mapping units located on fan remnants,alluvial fans, and fan aprons. Soils are very shallow to very deep, well to excessivelydrained. Elevation is 1,800 to 4,000 feet with gently to moderately steep slopes. Surfacelayers are coarse sand, loamy sand, loamy fine sand, loamy coarse sand, sandy loam,extremely gravelly sand, very gravelly sandy loam.• Soils on mountains and hills are comprised of three mapping units. Soils are veryshallow to bedrock, well drained to somewhat excessively drained. Elevation is 800 to4,600 feet with moderate to steep slopes. Surface layers are extremely gravelly sand,very cobbly fine sandy loam, very gravelly loamy coarse sand, or extremely stony sandyloam.The Edwards Air Force Base Soil Survey is comprised of three basic geomorphic units.These include the hills and rock pediments are scattered throughout the area and are surroundedby fan piedmonts and sand sheets, which for the most part internally drained to the alluvial flatsand ultimately to the playas.• The hills and rock piedments tend to be moderately steep, to steep. Soils are shallow ormoderately deep; therefore, water runoff is somewhat high.• The fan piedmonts and sand sheets are rarely flooded during thunderstorms when watermoved from the surrounding hills and rock pediments down slope toward to the playas.Drainage of soils on these landscapes is somewhat to excessively drained.• The alluvial flats between the playas and surrounding fan piedmonts and sand sheets aresubject to occasional flooding as water moves down slope to the playas. Pondingoccasionally occurs on the alluvial flats. Soils on the alluvial flats are dominantlymoderately well drained.Soil blowing is a major hazard in the survey area; especially those with coarse-texturedsurface layer of loamy fine sand and sand and are susceptible to soil blowing. Wind erosionoccurs whenever bare, loose, dry soil is exposed to wind of sufficient speed to cause soilmovement. The process will be accelerated whenever the natural equilibrium between climate,soils, and vegetation is disturbed. Wind speeds as low as 13 to 15 miles per hour one foot abovethe soil surface can initiate soil blowing under highly erodible conditions. The mere passing ofvehicle tires or tracks over an erodible surface provides sufficient energy to initiate soil blowing.As medium size particles are detached they may enter the wind stream momentarily but then areChapter 3 3-59
pulled back by gravity. This causes them to impact other particles and set them into motions andcan account to 50 to 80 percent of total soil movement. (NRCS, 29Palms)3.2.3 WaterThe planning area is one of the most arid areas in the nation; the potential annual waterloss through evapotranspiration exceeds the annual water gain from precipitation even at thehigher elevations. On the valley floor the evaporation exceeds the precipitation by at least 25:1.Prominent mountain ranges have an important influence on moisture distribution withinthe plan area. As moist, unstable air masses from the Pacific Ocean rise up the windward slopesof the Southern Sierra, San Gabriel and San Bernardino Mountains, the air is cooled and watervapor condenses and falls as rain, snow, or ice. When these air masses descend the leewardslopes, they become warmer and more stable and thus retain most of the remaining moisture.Consequently, precipitation amounts are much greater on the windward slopes of the mountainranges, whereas arid conditions prevail leeward of the mountains. All of the study area, exceptthe Kelso Creek area is on the leeward side of these major mountain areas.Because of the arid nature of the study area, water supply is the single most importantresource. The presence or absence of a reliable supply of good quality water has determined thepattern of agricultural, urban, and industrial development and will continue to do so.Groundwater withdrawn by wells furnishes nearly all of the developed water. Many of the Stateor federally listed or BLM sensitive species, discussed elsewhere in this document, aredependent upon the presence of groundwater either directly or for their habitat.Surface water is very scarce. Streams that originate high in surrounding mountains on thewest and south may have perennial flow in the higher altitudes; at the lower altitudes andthroughout the area virtually no water exists in streambeds or riverbeds, except locally afterinfrequent, heavy cloudbursts. The playas may be covered by water from the runoff for as longas two months a year. There are many locally important springs and seeps most of which areassociated with the mountain areas.3.2.3.1 Groundwater BasinsThe water yielding materials in this area are in valleys and basins, and consist primarilyof unconsolidated alluvial-fan deposits, although locally flood plain and lacustrine (lake) beachdeposits may yield water to wells. The valleys and basins are internally drained; that is, waterfrom precipitation that falls within the basin recharges the aquifer and ultimately discharges tothe land surface and evaporates within the basin. Ground water is generally under unconfined, orwater table, conditions at the margins of the basins, but as the unconsolidated deposits becomefiner grained toward the centers of the basins, the water becomes confined. Rarely, basins mightbe hydraulically connected in the subsurface by fractures or solution openings in the underlyingbedrock. These multiple-basin systems end in a terminal discharge area, or sink, from whichwater leaves the flow system by evaporation. Along the <strong>Mojave</strong> River several basins or valleysare hydraulically connected, and ground water flows between the basins, mostly through theunconsolidated alluvial stream/flood plain sediments of the present and ancient river.Chapter 3 3-60
The most permeable basin-fill deposits are present in the depressions created by lateTertiary to Quaternary block faulting and can be classified by origin as alluvial fan, lake-bed, orfluvial deposits. At the time of major deposition, the climate was more humid than the modernclimate. Lakes were in most of the closed basins and streams connected some basins. In general,the coarsest materials (gravel and boulders) were deposited near the mountains, and the finermaterials (sand and clay) were deposited in the central parts of the basins or in the lakes.Occasionally, torrential storms produced heavy runoff that carried coarse material farther fromthe mountains and resulted in the interfingering of fine and coarse material. The distribution ofsediment size is directly associated with distance from the mountains. Three geomorphiclandforms can be distinguished on the basis of the gradient of the land surface. Alluvial fansborder the mountains and have the steepest surface slopes and the coarsest sediments. Basinward, individual alluvial fans flatten, coalesce, and form alluvial slopes of moderate gradient. Aplaya, or dry lakebed with a flat surface, is present in the lowest part of the basin, usually at ornear the center of the basin, and most of the sediment deposited on the playa is fine grained.Parts of some of the valleys become encrusted to a depth of several inches with alkaline salts,which cover the surface as a powdery crust.The most important hydrologic features of the basins are the alluvial fans. The basin fillreceives most of its recharge through the coarse sediments deposited in the fans. These highlypermeable deposits allow rapid infiltration of water as streams exit the valleys that are cut intothe almost impermeable rock of the surrounding mountains and flow out onto the surface of thefans. The coarse and fine sediments within the alluvial fans are complexly interbedded andinterfingered because the position of the distributary streams that transported the sedimentscontinually shift across the top of the fan as a result of scour or deposition of sediment duringfloods.Material deposited in perennial lakes or in playas consists principally of clay and silt withminor amounts of sand and is present in all of the basins. In most places, these sediments includesome salts deposited by evaporation. The clay and salt deposits merge laterally into coarsegraineddeposits of the alluvial slopes. Minor well-sorted beach sand and gravel are in thesubsurface near the shores of once perennial lakes.Except for the <strong>Mojave</strong> River that has a complex surface water/groundwater relationship,water is not discharged to major surface water bodies but is lost solely throughevapotranspiration. Each basin has essentially the same characteristics: the impermeable rocks ofthe mountain ranges serve as boundaries to the flow system, and the majority of the ground waterflows through basin-fill deposits. Most recharge to the basin-fill deposits originates in themountains as snowmelt, and, where the mountain streams emerge from bedrock channels, thewater infiltrates into the alluvial fans and replenishes the basin-fill aquifer. Intense thunderstormsmay provide some direct recharge to the basin-fill deposits, but, in most cases, any rainfall thatinfiltrates the soil is either immediately evaporated or taken up as soil moisture; little waterpercolates downward through the unsaturated zone to reach the water table in the valleys.Antelope Valley: Antelope Valley, Calif., which is in the Southwest corner of the planarea, is an example of a single, undrained, closed basin. Antelope Valley occupies part of astructural depression that has been down faulted between the Garlock and the Cottonwood--Chapter 3 3-61
Rosamond Faults and the San Andreas Fault Zone.Alluvium and interbedded lacustrine deposits of Quaternary age are the importantaquifers within the closed basin and have accumulated to a thickness of as much as 1,600 feet.The alluvium is unconsolidated to moderately consolidated, poorly sorted gravel, sand, silt, andclay. Older units of the alluvium are more compact and consolidated, somewhat coarser grained,more weathered, and more poorly sorted than the younger units. The rate at which water movesthrough the alluvium (the hydraulic conductivity of the alluvium) decreases with increasingdepth.Two aquifers, which are separated by the lacustrine deposits, are in the alluvial material.The upper aquifer is the principal and most used aquifer and contains water under unconfined, orwater table, conditions. Where the lower, or deep, aquifer underlies lacustrine deposits, itcontains water under confined, or artesian, conditions. Elsewhere, unconfined conditions prevail.The use of ground water for agriculture in Antelope Valley began about 1880, whenwells were drilled near the center of the valley and yielded flowing water in quantities sufficientfor irrigation. In 1891, more than 100 wells were in use, but most had stopped flowing. About1915, intense use of ground water began when a large number of wells were drilled and equippedwith pumps. The maximum rate of withdrawal of about 400,000 acre-feet per year is about 10times the estimated annual recharge to the basin. Water removed from storage in the aquifers wasa major part of the ground-water withdrawals, and severe water-level declines resulted. By about1950, studies showed that ground-water withdrawals in the valley were greatly in excess ofnatural recharge and withdrawals were curtailed. The Antelope Valley-Eastern Kern WaterDistrict is still serviced by ground water.Antelope Valley illustrates the potential for overdraft in the groundwater basins in theplan area.Water Quality: Although there are vast quantities of water within the ground waterbasins, some of the water is of poor quality. The mineral quality of the ground water within thestudy area varies greatly. The geologic setting of the basins directly affects the degree of groundwater mineralization. In general, basins near the source of recharge are less mineralized thanthose that are more distant.Very short flow paths generally characterize small local flow systems, usually no morethan a few miles in length. Springs connected to these systems are usually located in or near themountains and have highly variable annual ranges in discharge which respond to theprecipitation that year or a few years previous. Discharge waters have small concentrations ofdissolved sodium plus potassium and chloride plus sulfate, large concentrations of tritium, andwater temperatures that commonly approach average air temperatures.Large local flow systems are characterized by interbasin flow or flow confined to onebasin with longer flow paths. Springs connected to these systems have moderate concentrationsof the major salts, no significant concentrations of tritium and water temperatures from 50 to 60degrees Fahrenheit.Chapter 3 3-62
Surface water was and is the major transport agent of the rock material from themountains to the alluvial fans to the valleys. The intense short duration storms result in rapidfloodwaters that have the energy to transport rock material both in the water column and alongthe beds of the arroyos. Longer duration storms with less intensity will still have the energy totransport finer sediment materials. All ephemeral streams in this area will have naturally highsediment concentrations. Flows resulting from groundwater sources will have low sedimentconcentrations until the runoff water predominates the flow. Playa water will usually have ahigh concentration of very fine sediment mixed into the column by wind action and will havevarying salt concentrations depending on the geology of the area.3.2.3.2 <strong>Mojave</strong> RiverThe <strong>Mojave</strong> River originates near the southern boundary of the plan area. Majorwatersheds in San Bernardino or San Gabriel Mountains contribute to the streamflow in the area.Sheep Creek originates in the San Gabriel Mountains. The <strong>West</strong> fork of the <strong>Mojave</strong> River andDeep Creek originate in the San Bernardino Mountains and are the headwaters of the <strong>Mojave</strong>River.The Cajon Fan is at the southern edge of the <strong>Mojave</strong> <strong>Desert</strong>, in the southwestern part ofthe study area. It is a broad surface of coalescing alluvial fans and terraces. Part of the Cajon Fanis called Baldy Mesa. The Cajon Fan formed in sediment eroded from the San Gabriel and SanBernardino Mountains. The fan extends form the base of the mountains for 10 to 15 miles to the<strong>Mojave</strong> River east of Hesperia to Adelanto and to Mirage Lake. The center part of the upperedge of the Cajon Fan no longer joins the mountains. Tectonic activity in the surrounding areaand subsequent erosion have truncated the upper edge to form the Inface Bluffs. Broad washes ofthe desert, such as the OroGrande Wash, at one time drained large watersheds and are alsotruncated at the Inface Bluffs.The <strong>Mojave</strong> River flows along the eastern edge of the Cajon Fan. The river originateswhere the <strong>West</strong> Fork of the <strong>Mojave</strong> River joins Deep Creek, and it flows northward and theneastward past Barstow. The flood plain of the <strong>Mojave</strong> River is 0.5 to 1 mile wide along most ofthe river. The soils on the flood plain are nearly level. In some places, such as at UpperNarrows where the river cuts through hard rock, there is no flood plain. East of Barstow, theflood plain and river terraces form the broad <strong>Mojave</strong> Valley.The <strong>Mojave</strong> River has only 3 major tributaries within the desert – the Fremont Wash,Buckthorn Canyon, and Oro Grande Wash. These Tributaries flow only after intense storms.The water-bearing alluvial deposits of the <strong>Mojave</strong> River are a major source of groundwater in the study area. Hard rock formations along the river divide the coarse river deposits intonumerous subsurface basins. Water from the river recharges these basins.The above ground flow of the <strong>Mojave</strong> River is intermittent in most places. Along most ofits course, water flows above ground only after storms. Perennial flows occur near Victorville,in the vicinity of Camp Cady and in Afton Canyon. In these places hard rock barriers forceground water to the surface. Other basins in the area from which considerable ground water isChapter 3 3-63
emoved are in the area of Lucerne Valley, El Mirage, and Harper Lake.The amount of water in the <strong>Mojave</strong> River varies greatly from year to year. As measuredat the Forks, it has been more than 300,000 acre-feet one year and less than 10,000 acre-feetanother.The <strong>Mojave</strong> Water Agency was formed by an act of the State legislature in 1960 to findways to supplement the natural water supply. The agency has contracts with the State ofCalifornia that entitle the agency to purchase as much as 50,800 acre-feet of water per year fromthe California Water Project. The California Aqueduct delivers the water. Three turnouts forwater delivery were constructed.3.3 BIOLOGICAL RESOURCESThe California <strong>Desert</strong> Conservation Area was inventoried for its flora and fauna in thelate 1970s by the BLM <strong>Desert</strong> <strong>Plan</strong> staff. A total of 1836 vascular plant species in 116 familiesand 635 species of vertebrate animals were recorded. The <strong>West</strong> <strong>Mojave</strong> planning area was nottabulated separately, but contains a high proportion of the total. The diversity reflects the variedtopography and landforms within the planning area. Investigations of invertebrates, such asinsects, mollusks and fairy shrimp have been completed for only a few groups, but showwidespread endemism and specialization to unique substrates, host plants and water sources.Thousands of additional invertebrate species are present.The western <strong>Mojave</strong> <strong>Desert</strong> historically contained the highest densities of the deserttortoise and the only known populations of the Mohave ground squirrel, the focal species of thisHabitat Conservation <strong>Plan</strong> and CDCA <strong>Plan</strong> Amendment. It supports one of the largestpopulations of the prairie falcon. The region contains at least four endemic animals and thirteenendemic plants. A number of disjunct localities exist where plants and animals range into theplanning area far from their primary distribution.Many of the rare species of the western <strong>Mojave</strong> <strong>Desert</strong> are concentrated at special sites,where unique substrates, water sources, or topography are present. Several areas have highbiodiversity because of location at the desert-mountain transition zone. In addition, the vast openspace in much of the western <strong>Mojave</strong> <strong>Desert</strong> provides room for species to survive in the harshdesert climate.The eastern and southern Sierra Nevada Mountains extend into the <strong>West</strong> <strong>Mojave</strong> andrepresent areas of very high biodiversity. In the east Sierra canyons, riparian habitat and springsattract large numbers of nesting and migratory birds, including several target species. Thesecanyons are known to harbor rare salamanders, endemic springsnails, and a high diversity ofrodents and reptiles. The Owens Peak area stands out as a region of high endemism for plants. Inthe southern Sierras, the Middle Knob region is outstanding for its intact assemblage of predatorsand the Kelso Valley harbors endemic plants, and includes an important migratory flyway forturkey vultures, Cooper’s hawks, and Swainson’s hawks.Chapter 3 3-64
A relatively small number of introduced wildlife species (excluding insects) is found inthe western <strong>Mojave</strong> <strong>Desert</strong>. A few of these species have very significant effects on the nativeenvironment, particularly feral burros, bullfrogs, and brown-headed cowbirds. In addition, feraldogs are a problem in several areas, where they may kill desert tortoises or Mohave groundsquirrels. Although common ravens are “natural” predator of tortoises, population levelsapparently increased by as much as 1,500% between 1968 and 1988 (BLM 1990). Increasedraven populations are likely associated with new water sources (cattle troughs, agricultural fields,wildlife guzzlers), increased scavenging potential (refuse in urbanizing areas, animal carcassesfound along highways), and more nesting substrates (transmission lines and a multitude ofhuman structures like houses, abandoned vehicles). The number of invasive introduced plants ishigher and in many respects more of a threat to the natural ecosystem. Riparian pests includetamarisk, Russian olive and Phragmites, which consume a lot of water and crowd out nativewillows and cottonwoods. Weedy annuals such as storksbill, several species of brome grass,Sahara mustard and others compete with native wildflowers and provide a nutritionally deficientfood plant for the desert tortoise.Following is a description of the natural communities of the western <strong>Mojave</strong> <strong>Desert</strong>, andthe life history and status of the desert tortoise, Mohave ground squirrel, and other speciesaddressed by the <strong>West</strong> <strong>Mojave</strong> <strong>Plan</strong>. The summaries of species other than the tortoise andground squirrel are based on the Species Accounts prepared for this planning effort in 1998 plussubsequent information. Copies of the full species accounts are included on the compact diskattached to this final EIR/S.3.3.1 Natural CommunitiesThe western <strong>Mojave</strong> <strong>Desert</strong> comprises a distinct area of the <strong>Mojave</strong> <strong>Desert</strong> biome, wherethe flora and fauna has adapted to the local conditions and formed distinct natural communities,including species found nowhere else (i.e. “endemics”). It also incorporates the transitionalecotones from the Sierra Nevada, Tehachapi, San Gabriel, and San Bernardino Mountains andthe Colorado <strong>Desert</strong>.The predominant aspect of the <strong>West</strong> <strong>Mojave</strong> is a flat, sparsely vegetated regioninterspersed with mountain ranges and dry lakes. The area is a part of the high desert, largeportions of which lie at elevations between 2500 and 4000 feet. Freezing temperatures arelimited to a few days in the winter in most of the region, while summer temperatures regularlyexceed 100 degrees Fahrenheit. The characteristic creosote bush and saltbush plant communitiesare covered with wildflowers in years of above-normal winter rainfall, and up to 90% of the floraare composed of annual plants.The central and southeastern regions reflect the Pleistocene history of the <strong>Mojave</strong> River,which flows from the San Bernardino Mountains north to Barstow, then east to Silver Lake andthe <strong>Mojave</strong> National Preserve. In the last Ice Age, extending from 30,000 to 10,000 years ago,the <strong>Mojave</strong> River discharged to the south into the <strong>Mojave</strong> Valley, Lavic Lake, Dale Lake, BristolLake, and other playas extending nearly to the Colorado River. The river (now dry) and playassupported species of invertebrates, fish, amphibians, and pond turtles, and attracted migratoryChapter 3 3-65
irds dependent on water. Remnant populations of these animals are still present today, andcomprise many of the rare species in need of conservation. The ancient river and lakes formedsandy beaches and prevailing winds carried the finer particles to the east, forming hummocksand dunes. These blowsand areas now support unique species of insects, plants, and reptiles,including the <strong>Mojave</strong> fringe-toed lizard, whose entire distribution can be traced to the formerpath of the ancient <strong>Mojave</strong> River and Amargosa River.On the west, the western <strong>Mojave</strong> <strong>Desert</strong> exhibits communities reflecting the increasedaridity on the east side of the Sierra Nevada and Tehachapi mountains, and the northern flank ofthe San Gabriel and San Bernardino mountains. These ranges capture rainfall from stormsoriginating in the Pacific Ocean and falling over the coast and inland valleys and prevent all butthe larger storms from reaching the desert. The western <strong>Mojave</strong> <strong>Desert</strong> is not influenced to agreat extent by the summer thundershowers characteristic of the Sonoran <strong>Desert</strong> and the East<strong>Mojave</strong>, though infrequent episodic events from summer storms can cause flash flooding, playafilling, and redirection of stream flow on alluvial fans.The mountainous transition zones within the western <strong>Mojave</strong> <strong>Desert</strong> extend downhillfrom open forests of blue pine in the north and pinon pine in the south, through a chaparral zone,to a diverse mixed woody scrub vegetation at lower elevations, often characterized by densestands of Joshua trees. Of interest is the presence of many unique plant species in the southernSierra Nevada, and Central Valley elements of the flora and fauna found in the Antelope Valley,Middle Knob, and Kelso Valley along the west-central boundary of the planning area.The north and northeastern bioregions exhibit many elements of the Great Basin biome.Sagebrush scrub and plants associated with both the Owens Valley and Death Valley ecosystemsextend into the planning area to a limited extent.A limited expression of the Colorado <strong>Desert</strong> flora and fauna also extends into the <strong>West</strong><strong>Mojave</strong> east of Twentynine Palms and south through Joshua Tree National Park and MorongoValley and is prevalent in the proposed Pinto Mountain DWMA. However, the characteristicsmoke trees, ocotillos and barrel cacti associated with the low desert are restricted to smallregions along the <strong>West</strong> <strong>Mojave</strong> boundary.Noteworthy landforms within the <strong>West</strong> <strong>Mojave</strong> include five major lava flows at Pisgah,Amboy, the Rodman Mountains, Black Mountain and Fossil Falls, the largest and flattest playain the world at Rogers Lake, and sand dunes in several places, including Olancha, along the<strong>Mojave</strong> River, in the <strong>Mojave</strong> Valley, and at Twentynine Palms. Deposits of limestone andcarbonate rock in the San Bernardino Mountains support several unique species of plants andsome of the largest mines in the country. Alkaline seeps, springs, and meadows associated withthe San Andreas and other earthquake faults are havens for unusual plants and invertebrates,while occasional fresh water springs support a variety of wildlife, including bighorn sheep.Thirty-two distinct plant communities are found within the western <strong>Mojave</strong> <strong>Desert</strong>. Byfar the most common communities are creosote bush scrub and saltbush scrub, which occupy75% of the natural lands. <strong>Mojave</strong> mixed woody scrub accounts for 13% of the native vegetation.The remaining 29 plant communities are found in isolated areas with unique conditions, such asChapter 3 3-66
freshwater or alkali wetlands, or occur along the south and west edges of the planning area, inthe desert-mountain transition. Table 3-9 lists the natural communities and the acreage of each.Map 3-23, found on the attached CD-ROM, illustrates the location of the natural communities.Localized areas having special biological importance are described below.Alkali wetland sites: CDFG and USFWS botanists, the California Native <strong>Plan</strong>t Societyand noted conservation biologist Reed Noss reviewed and discussed conservation plant speciesin the <strong>West</strong> <strong>Mojave</strong> during the planning process. Protection of alkali wetland communities,including seeps, springs, meadows and playas was identified as a top priority. These sites arevery likely to result in new discoveries of disjunct and endemic species of rare plants. Inaddition, the unique conditions that support these communities, including faultline alterations tothe water table, hot springs, and local enclosed basins require consideration of protection ofecosystem processes.Two specific locations, Rabbit Springs and Paradise Springs, are relatively undisturbedalkali seeps known to support many rare species and represent botanical hotspots. Harper DryLake is a unique alkali marsh, a community found at few other sites in the <strong>Mojave</strong> <strong>Desert</strong>, mostnotably in Death Valley. Other sites along the Helendale Fault, San Andreas Fault and borderingmajor desert playas have high potential for discovery of unique elements of the desert flora.Landforms and Soils: Some distinctive landforms and soil types found within the <strong>West</strong><strong>Mojave</strong> that provide habitat for unique or listed species include:• Sand dunes at Saddleback Butte, Dale Lake, <strong>Mojave</strong> River, <strong>Mojave</strong> Valley, TwentyninePalms, El Mirage, Alvord Mountain, and Pisgah Crater form habitat for <strong>Mojave</strong> fringetoedlizard (Dean, 1978).• Sand sheets at the east edges of playas constitutes habitat for desert cymopterus east ofCuddeback, Rogers, and Harper dry lakes.• The remnant Pleistocene glacial surfaces at Middle Knob, termed “pebble plains” providehabitat for the extremely rare Kern buckwheat.• Carbonate rock and soil on the north face of the San Bernardino Mountains provideshabitat for several endemic plants, including four listed species.Chapter 3 3-67
Table 3-9Natural Communities and Ownership In The <strong>West</strong> <strong>Mojave</strong> (In Acres)COMMUNITY PRIVATE NPS BLM STATE MILITARY TOTALAlkali seep 59 0 0 0 0 59Alkali sink scrub 5,429 0 5,408 59 16,019 26,915Big sagebrush scrub 706 0 8,571 144 106,267 114,982Blackbush scrub 37,576 59,183 35,312 531 73,042 205,644Chamise chaparral 26,426 0 2,167 0 53 28,646Cottonwood-willow riparian5,350 0 6,183 0 0 11,533forestCreosote bush scrub 1,554,339 48,765 2,350,012 72,304 1,658,226 5,683,646<strong>Desert</strong> holly scrub 1,935 0 19,781 0 4,843 26,559<strong>Desert</strong> wash scrub 14,067 468 19,894 66 47,182 81,677Fan palm oasis 33 0 0 0 0 33Freshwater seep 388 0 0 0 0 388Gray pine-oak woodland 2,576 0 102 0 0 2,678Greasewood scrub 706 0 2,780 175 0 3,661Hopsage scrub 0 0 0 0 5,503 5,503Interior live oak woodland 556 0 33 0 0 589Jeffrey pine forest 1,150 0 662 0 0 1,812Joshua tree woodland 6,755 0 3,275 353 18,443 28,826Juniper woodland 47,453 0 13,926 154 1,453 62,986Mesquite bosque 2,977 39 3,688 407 467 7,578<strong>Mojave</strong> mixed woody scrub 174,672 127,236 377,250 10,431 409,019 1,098,608<strong>Mojave</strong> riparian forest 4,638 0 28 20 242 4,928Northern mixed chaparral 475 0 517 0 0 992Pinyon-juniper woodland 73,087 53,943 56,332 601 0 183,963Pinyon pine woodland 3,135 0 15,151 486 18,956 34,593Montane meadow 964 0 2 0 8 974Montane riparian scrub 1377 0 851 0 134 2,362Native grassland 3,146 0 229 0 0 3,375Rabbitbrush scrub 7,750 0 0 92 0 7,842Scrub oak chaparral 22,624 0 13,761 0 0 36,385Saltbush scrub 393,748 16 193,012 5,138 210,787 802,701Semi-desert chaparral 108,488 0 19,527 215 0 128,230Shadscale scrub 162 2 37,457 981 3,656 42,258TOTAL 2,502,747 289,652 3,185,911 92,157 2,574,300 8,640,926State includes State Lands Commission, State Parks, and Department of Fish and Game.Other owners: Unknown = 1,844; County = 1,142; Bureau of Indian Affairs = 166.Chapter 3 3-68
3.3.2 <strong>Desert</strong> Tortoise3.3.2.1 Regulatory StatusThe <strong>Mojave</strong> population of the desert tortoise includes those animals living north and westof the Colorado River in the <strong>Mojave</strong> <strong>Desert</strong> of California, Nevada, Arizona, southwestern Utah,and in the Colorado <strong>Desert</strong> in California. On August 4, 1989, the USFWS published anemergency rule listing the <strong>Mojave</strong> population of the desert tortoise as endangered (54 FederalRegister 32326). In its final rule, dated April 2, 1990, the USFWS determined the <strong>Mojave</strong>population of the desert tortoise to be threatened (55 Federal Register 12178). The USFWSdesignated critical habitat for the desert tortoise in portions of California, Nevada, Arizona, andUtah in a final rule, published February 8, 1994 (59 Federal Register 5820). (USFWS 2002.)The tortoise was also listed as threatened throughout its known range in California by theCalifornia Fish and Game Commission in 1989.The desert tortoise is the official California State reptile, and has been protected byspecial State legislation that prohibits the taking or harming of the species since the 1930s. In1983, the <strong>Desert</strong> Tortoise Council petitioned the CDFG to list the desert tortoise as a threatenedspecies. The petition was withdrawn later, pending the federal status review by the USFWS. InAugust 1987, the <strong>Desert</strong> Tortoise Council resubmitted the petition to the California Fish andGame Commission (Commission). In November 1987, the Commission accepted the petition forreview, and in June 1989, the Commission designated the desert tortoise as a threatened species.(BLM and CDFG 1992.)The desert tortoise was designated a “sensitive species” in California in 1979 by BLM,which is authorized to designate species on public lands as “sensitive” after consultation withCDFG. The purpose of the designation was to provide increased management attention toprevent population and habitat declines that might result in federal or State listing as endangeredor threatened. The designation raises the level of concern for desert tortoises in theenvironmental review process. No particular habitat or population management action isrequired or prohibited by the sensitive species designation, although other federal statutes (suchas FESA and CESA) apply. (BLM and CDFG 1992.)3.3.2.2 Tortoise Habitat DesignationsDuring the past two decades, the BLM and USFWS have identified habitats that areimportant to tortoise management, conservation, and recovery. This section describes theestablishment of management areas to protect these habitats (see Table 3-10), their intent andfunction, and relationships to other land designations.Chapter 3 3-69
NAMETable 3-10Current And Historic Tortoise Management AreasDATENOTESESTABLISHEDCrucial Habitat 1980 California <strong>Desert</strong> Conservation Area <strong>Plan</strong> DesignationCategory I, II, and III 1993 California <strong>Desert</strong> Conservation Area <strong>Plan</strong> DesignationCritical Habitat 1994 Designation pursuant to FESARecovery <strong>Plan</strong> 1994 Suggests that DWMAs be establishedBLM Crucial Habitat: <strong>Desert</strong> tortoise crucial habitat was first identified in the BLM’s1980 CDCA <strong>Plan</strong> (Map 4, CDCA <strong>Plan</strong>, 1980). The crucial habitat area was considered to be“…essential to the continued existence of the species.” The BLM (1987) described crucialhabitat as follows: “Crucial habitat includes portions of the habitats of officially designatedBLM sensitive species that if destroyed or adversely modified could result in their being listed asthreatened or endangered pursuant to Section 4 of the Endangered Species Act of 1973, asamended.”Within the planning area, the CDCA <strong>Plan</strong> recognized two areas of tortoise crucial habitat:(a) <strong>West</strong>ern <strong>Mojave</strong> <strong>Desert</strong> Crucial Habitat, which included most of the proposed Fremont-Kramer DWMA, the western portions of the Superior-Cronese and Ord-Rodman DWMAs, andthe <strong>Desert</strong> Tortoise Research Natural Area; and (b) two small polygons located near the northernand central portions of the Johnson Valley Open Area (see Map 4, CDCA <strong>Plan</strong>).BLM Category I, II, and III Habitat: In 1992, the BLM and CDFG adopted aCalifornia Statewide <strong>Desert</strong> Tortoise Management Policy. The crucial habitat designation wasexpressly dropped in 1992 in favor of BLM tortoise Category I, II, and III habitat areas (BLMand CDFG 1992). This policy included management goals for Category I, II, and III tortoisehabitats, as follows: Category I: maintain stable, viable populations and increase populationswhere possible; Category II: maintain stable, viable populations; Category III: limit declines tothe extent possible using mitigation measures. In April 1993, the BLM amended the CDCA planto delineate these three categories of desert tortoise habitat on public lands (Map 1A, CDCA<strong>Plan</strong>, as amended, 1999).The BLM’s and CDFG’s long-range goals for the management of desert tortoises in thesethree categories were given as follows (BLM and CDFG 1992): (a) Restore and maintain stable,viable tortoise populations within designated Category I and II habitats in the species’ existingnatural range in the California <strong>Desert</strong>; (b) Minimize impacts to tortoises in Category III Habitatthrough humane, low-level mitigation and compensation requirements; (c) Reduce non-naturalmortality to the extent possible; (d) Prevent deterioration and promote restoration of Category Iand Category II habitats; (e) Acquire private lands within Category I and Category II habitatsthrough purchase or exchange and through compensation for habitat losses in Category I, II, andIII habitats; (f) Maintain and increase populations through translocation of wild tortoises intosuitable unoccupied or depleted habitats within the historic range; (g) Achieve interagencycoordination and demonstrate commitment necessary to maintain viable tortoise populations inthe California <strong>Desert</strong>; and, (h) Develop and implement a monitoring program to determineChapter 3 3-70
progress toward meeting the overall management goal of maintaining viable tortoise populationsin the California <strong>Desert</strong>.USFWS Critical Habitat: Critical habitat is defined as (a) the specific areas within thegeographical area occupied by the species at the time it is listed on which are found thosephysical or biological features which are essential to the conservation of the species and whichmay require special management considerations or protection; and (b) specific areas outside thegeographic area occupied by the species at the time it is listed upon a determination by theSecretary of the Interior that such areas are essential for the conservation of the species (FESASection 3(5)(A)). In 1994, the Service designated four critical habitat units in the planning area:Fremont-Kramer (518,000 acres), Superior-Cronese (766,900), Ord-Rodman (253,200), andPinto Mountain (171,700) units (USFWS 1994a) (see Table 3-11)ENTITYTable 3-11<strong>Desert</strong> Tortoise Critical HabitatACRES IN CRITICALHABITATPERCENT OF CRITICALHABITATFederal Government Department of the InteriorNational Park Service 27 mi 2 1%Bureau of Land Management 1,533 mi 2 59%Federal Government Department305 mi 2 12%of DefenseState of California 51 mi 2 2%Private 696 mi 2 26%TOTAL 2,612 mi 2 100%USFWS Recovery Units and <strong>Desert</strong> Wildlife Management Areas: The <strong>Desert</strong>Tortoise (<strong>Mojave</strong> Population) Recovery <strong>Plan</strong> (USFWS 1994b) established recovery goals andobjectives for six “recovery units.” The <strong>West</strong>ern <strong>Mojave</strong> Recovery Unit is conterminous withthe <strong>West</strong> <strong>Mojave</strong> planning area. The Recovery <strong>Plan</strong> stated that recovery units are “...essential tothe long-term recovery, viability, and genetic diversity of the species.” The Recovery <strong>Plan</strong> alsorecommended that <strong>Desert</strong> Wildlife Management Areas be established within each recovery unit.DWMAs were characterized as areas in which “...recovery actions will be implemented toprovide for the long-term persistence of viable desert tortoise populations and the ecosystemsupon which they depend.”The Recovery <strong>Plan</strong> recommended that DWMAs should: (a) be “...somewhere between200 and 5,000 square miles...” with “...at least 1,000 square miles...recommended as the targetsize” (page 33); (b) have “…boundaries ... drawn to include the best examples of desert tortoisehabitat in specific vegetation regions ... heterogeneous terrain, soil types, and vegetation withinDWMAs will best provide protection for the entire ecosystem upon which healthy desert tortoisepopulations depend” (page 48); (c) contain “…the largest possible blocks of good tortoise habitatin an area, containing the most dense desert tortoise populations, should be included withinDWMA boundaries” (page 48); and (d) consist of “…round or square patches of habitat are moreChapter 3 3-71
likely to retain desert tortoise populations than elliptical or rectangular ones. Long, linear stripsare least desirable” (page 49).The Recovery <strong>Plan</strong> suggested that at least three of four potential DWMAs be establishedwithin the <strong>West</strong>ern <strong>Mojave</strong> Recovery Unit. These particular DWMAs were recommended forthe following reasons (USFWS 1994b, page F28):The <strong>West</strong>ern <strong>Mojave</strong> recovery unit is the largest and most heterogeneous of the recovery units interms of climate, vegetation and topography. It includes three major vegetation types - the<strong>West</strong>ern <strong>Mojave</strong>, Central <strong>Mojave</strong>, and Southern <strong>Mojave</strong> - each of which has significant anddistinctive elements...Four DWMAs within the <strong>West</strong>ern <strong>Mojave</strong> recovery unit represent thediversity. The Fremont-Kramer DWMA represents the <strong>West</strong>ern <strong>Mojave</strong> region; the Superior-Cronese DWMA represents the Central <strong>Mojave</strong> region; and the Ord-Rodman DWMA representsthe Southern <strong>Mojave</strong> region. The Joshua Tree DWMA [Pinto Mountain], the fourth within thisrecovery unit, contains Southern <strong>Mojave</strong> and Eastern Colorado elements. The tortoises haveresponded to this habitat heterogeneity with different food habits and behavior in each of theseareas. Thus, three DWMAs are essential in this recovery unit to preserve the heterogeneity[emphasis added]. Secure, large reserves are especially critical because of the severe populationdeclines and heavy human use in these areas.It is important to note that the Recovery <strong>Plan</strong> is advisory; federal agencies are notrequired to adopt its suggestions. The Recovery <strong>Plan</strong> recommends the general areas whereDWMAs should be located, but leaves the task of delineating the DWMA boundaries to the landmanagement agencies, in coordination with USFWS, CDFG, local stakeholders, and otherinterested parties. The principle agency mechanism for implementing recovery plan tasks isthrough amendments to existing resource management plans (BLM) or through the developmentof broader bioregional plans in collaboration with local government.Relationships Among Tortoise Habitat Designations: Public lands designated ascritical habitat were generally the same as those earlier delineated by the CDCA <strong>Plan</strong> as crucialhabitat, with the following exceptions. The northern half of Brisbane Valley, most of theStoddard Valley Open Area, and two 50-square mile areas in Johnson Valley Open Area wereconsidered crucial habitat but were not designated as critical habitat. Areas south of Fort Irwinand Edwards Air Force Base, and most of the area east of Highway 247, which are now criticalhabitat, were not identified as crucial habitat. Similarly, BLM lands designated as critical habitatgenerally corresponded to Category I and II tortoise habitats.The Recovery <strong>Plan</strong> (USFWS 1994b, page 56) distinguished DWMAs and critical habitat,noting that critical habitat does not accomplish the same goals or have as dramatic an effect upontortoise conservation as does a recovery plan because critical habitat does not apply managementprescriptions to designated areas. However, designation of critical habitat does provideprotection of desert tortoise habitat until such time as the <strong>Desert</strong> Tortoise Recovery <strong>Plan</strong> isimplemented and DWMA management is employed.Existing Areas of Relatively Higher Tortoise Densities: The preceeding discussionpertains to official designations by one or more of the federal or State agencies. Based onsurveys between 1998 and 2002, regions were identified as having “above average” or “higherdensity” tortoise occurrence. Although not an official designation, the differentiation betweenChapter 3 3-72
“higher density” and “lower density” tortoise areas is an important one relative to the plan’seffectiveness of minimizing and mitigating take.3.3.2.3 Tortoise Life HistoryThe following life history information is taken from U.S. Fish and Wildlife Service(2002c). The desert tortoise is a large, herbivorous reptile found in portions of the California,Arizona, Nevada, and Utah deserts. It also occurs in Sonora and Sinaloa, Mexico. In California,the desert tortoise occurs primarily within the creosote, shadscale, and Joshua tree series of<strong>Mojave</strong> <strong>Desert</strong> scrub, and the lower Colorado River Valley subdivision of Sonoran desert scrub.Optimal habitat has been characterized as creosote bush scrub in which precipitation ranges from2 to 8 inches, diversity of perennial plants is relatively high, and production of ephemerals ishigh (Luckenbach 1982, Turner and Brown 1982, Schamberger and Turner 1986). Soils must befriable enough for digging of burrows, but firm enough so that burrows do not collapse. InCalifornia, desert tortoises are typically associated with gravelly flats or sandy soils with someclay, but are occasionally found in windblown sand or in rocky terrain (Luckenbach 1982).<strong>Desert</strong> tortoises occur in the California desert from below sea level to an elevation of 7,300 feet,but the most favorable habitat occurs at elevations of approximately 1,000 to 3,000 feet(Luckenbach 1982, Schamberger and Turner 1986).Chambers <strong>Group</strong> (1994) has reported that, in the Alvord Slope area, tortoises were mostcommon on low to moderate slopes of 0 to 10%. They were most abundant on valley floors,bajadas, and lower portions of hills. Preferred substrates included sand, gravel, and desertpavement in plains, washes, fans, and hills.Adult desert tortoises are most active in California during the spring and early summerwhen annual plants are most common although juvenile tortoises have been observed outsideburrows throughout the year, including December through January when adults are generally in astate of hibernation (Dave Morafka, pers. comm.). Additional adult activity occurs duringwarmer fall months and occasionally after summer rainstorms. Adult desert tortoises spend mostof the remainder of the year in burrows, escaping the extreme conditions of the desert. Furtherinformation on the range, biology, and ecology of the desert tortoise can be found in Burge(1978), Burge and Bradley (1976), Hovik and Hardenbrook (1989), Luckenbach (1982),Weinstein et al. (1987), and USFWS (1994b).Tortoise activity is heavily influenced by the amount and timing of rainfall. Annualplants, which make up most of the tortoise’s diet in the western <strong>Mojave</strong> <strong>Desert</strong>, vary dependingon the timing of winter precipitation and the ensuing temperatures. Annual forbs, which arerelatively more nutritionally balanced for tortoises, generally emerge following early winter rainswith relatively warmer temperatures preceding and during the spring growing season. If winterrains do not come until late January or February, and temperatures are relatively cooler, nativeand non-native annual grasses will often emerge instead of native forbs. Such forage,particularly non-native grasses, offers little nutritional quality to tortoises.Chapter 3 3-73
Male tortoises may be more active during the fall, when their testosterone and viablesperm levels are higher than during the spring. Dr. Kristin Berry (pers. comm.) has shown thatmale sperm counts and viability are both relatively higher in the fall than in the spring of a givenyear. Data collected between 1998 and 2001, which were mostly restricted to the summer andfall periods (i.e., July through October), show that twice as many males were encountered ineach of the three survey years as compared to females. Over the three-year period where gendercould be determined, a total of 73 males and 35 females (2:1 ratio) were found, representing 26%and 13%, respectively, of the animals found (WMP data).This was not observed during distance sampling, where surveys were performed in thespring. In 2001 and 2002, 87 males (40% of all animals where gender could be determined) and69 (32%) females (1:1.26 ratio) were observed. Gender could not be determined for 60 tortoises,including 32 sexually immature animals. This probably indicates that males were somewhatmore detectable than females in the summer and fall months when males are actively courtingand mating with female tortoises, which is supported by numerous field observations.Tortoises may be active throughout the year. Dr. David Morafka has shown that juveniletortoises regularly emerge from burrows throughout the winter when conditions are favorable.Tortoises have recently been observed aboveground in early November west of California City(LaRue, pers. obs. 2002) and in late November at the DTNA (Michael Connor, pers. comm.2001). Several were observed in early January 2003 in the Fremont Valley (Bob Parker, per.comm. 2003). Those animals may have opportunistically taken advantage of rain that fell inNovember and the early production of annual plants in January. Tortoises regularly emergethroughout the year at Edwards in response to several days of unseasonably warm temperature(Mark Hagan, pers. comm. 2003). These anecdotal accounts may represent a small fraction ofadult animals in the population, and most animals may remain in their burrows through thewinter.Freilich et al. (2002) and Duda et al. (1999) have shown that tortoises are relatively moreactive in wetter years when compared to drier years. This observation is supported by distancesampling data collected in the Fremont-Kramer and Superior-Cronese DWMAs during thesprings of 2001 (relatively wet year) and 2002 (“driest year in recorded history”). In the 2001,wet year, a total of 104 tortoises was encountered, including 29 (28%) in burrows and 75 (72%)in the open; in 2002, the dry year, of 112 tortoises observed, 57 (51%) were observed in burrowsand 55 (49%) in the open. This indicates that about a quarter of the observed tortoises were inburrows in the wetter year, compared to about half of those observed in the dry yearFood resources for desert tortoises are dependent on the availability and nutritionalquality of annual and perennial vegetation, which is greatly influenced by climatic factors, suchas the timing and amount of rainfall, temperatures, and wind (Beatley 1969, 1974, Congdon1989, Karasov 1989, Polis 1991 in Avery 1998). In the <strong>Mojave</strong> <strong>Desert</strong>, these climatic factors aretypically highly variable; this variability can limit the desert tortoise’s food resources.<strong>Desert</strong> tortoises will eat many species of plants. However, at any time, most of their dietoften consists of a few species (Nagy and Medica 1986, Jennings 1993 in Avery 1998).Additionally, their preferences can change during the course of a season (Avery 1998) and overChapter 3 3-74
several seasons (Esque 1994 in Avery 1998). Possible reasons for desert tortoises to alter theirpreferences may include changes in nutrient concentrations in plant species, the availability ofplants, and the nutrient requirements of individual animals (Avery 1998). In Avery’s (1998)study in the Ivanpah Valley, desert tortoises consumed primarily green annual plants in spring;cacti and herbaceous perennials were eaten once the winter annuals began to disappear. Medicaet al. (1982 in Avery 1998) found that desert tortoises ate increased amounts of green perennialgrass when winter annuals were sparse or unavailable; Avery (1998) found that desert tortoisesrarely ate perennial grasses.Recent work by Dr. Olav Oftedahl, of the Smithsonian Institution, has shown thattortoises may selectively forage on plants that have a high Potassium Excretion Potential (PEPIndex) (Oftedahl 1996). Tortoises do not have salt glands or other physiological means ofgetting rid of high levels of potassium, although they may rid their systems of potentially lethallevels of potassium by voiding their bladders. It is speculated that water loss during droughtconditions could be lethal to tortoises voiding their bladders, unless additional rainfall becomesavailable shortly thereafter. Oftedahl’s studies have shown that tortoises regulate potassiumlevels by selecting plants that are high in water content and protein (nitrogen), which he refers toas “High PEP plants.” These plants are generally restricted to native, annual forbs such as desertdandelion (Malacothrix glabrata) and many legumes such as species in the Astragalus and Lotusgenera. As such, most of the High PEP plants are restricted in their availability to the springfollowing a winter of sufficient rainfall. In some years, no such plants are available, and mayresult in imbalances in potassium and other elements, which in turn could result in waterimbalance and other physiological stresses to tortoises.Oftedahl (pers. comm., Nov. 2002) expressed his concern that pervasive land uses, suchas cattle grazing, may have severely reduced or eliminated the seed bank and germinationpotential for High PEP annual plants. He suggested that removing cattle from grazing allotmentsmight not be sufficient to support new growth of these essential plants if they have already beeneliminated or replaced by non-native forb and grass species. There may be the need toreintroduce some of these species back into heavily impacted tortoise conservation areas.<strong>Desert</strong> tortoises can produce from one to three clutches of eggs per year. On rareoccasions, clutches can contain up to 15 eggs; most clutches contain 3 to 7 eggs. Multi-decadestudies of the Blanding’s turtle (Emydoidea blandingii), which, like the desert tortoise, is longlived and matures late, indicate that approximately 70 percent of the young animals must surviveeach year until they reach adult size; after this time, annual survivorship exceeds 90 percent(Congdon et al. 1993). Research has indicated that 50 to 60 percent of young desert tortoisestypically survive from year to year, even in the first and most vulnerable year of life. We do nothave sufficient information on the demography of the desert tortoise to determine whether thisrate is sufficient to maintain viable populations; however, it does indicate that maintainingfavorable habitat conditions for small desert tortoises is crucial for the continued viability of thespecies.<strong>Desert</strong> tortoises typically hatch from late August through early October. At the time ofhatching, the desert tortoise has a substantial yolk sac; the yolk can sustain them through the falland winter months until forage is available in the late winter or early spring. However, neonatesChapter 3 3-75
will eat if food is available to them at the time of hatching; when food is available, they canreduce their reliance on the yolk sac to conserve this source of nutrition. Neonate desert tortoisesuse abandoned rodent burrows for daily and winter shelter, which are often shallowly excavatedand run parallel to the surface of the ground.Neonate desert tortoises emerge from their winter burrows as early as late January to takeadvantage of freshly germinating annual plants; if appropriate temperatures and rainfall arepresent, at least some plants will continue to germinate later in the spring. Freshly germinatingplants and plant species that remain small throughout their phenological development areimportant to neonate desert tortoises because their size prohibits access to taller plants. As plantsgrow taller during the spring, some species become inaccessible to small desert tortoises.Neonate and juvenile desert tortoises require approximately 12 to 16 percent proteincontent in their diet for proper growth. <strong>Desert</strong> tortoises, both juveniles and adults, seem toselectively forage for particular species of plants with favorable ratios of water, nitrogen(protein), and potassium. The potassium excretion potential model (Oftedal 2001) predicts that,at favorable ratios, consumption of plants with water and nitrogen allows desert tortoises toexcrete high concentrations of potentially toxic potassium, which is abundant in many desertplants. Oftedal (2001) also reports that variation in rainfall and temperatures cause thepotassium excretion potential index to change annually and during the course of a plant’sgrowing season. Therefore, the changing nutritive quality of plants, combined with theirincrease in size, further limits the forage available to small desert tortoises to sustain theirsurvival and growth.In summary, the ecological requirements and behavior of neonate and juvenile deserttortoises are substantially different than those of sub-adults and adults. Smaller desert tortoisesuse abandoned rodent burrows, which are typically more fragile than the larger ones constructedby adults. They are active earlier in the season. Finally, small desert tortoises rely on smallerannual plants with greater protein content to be able to gain access to food and to grow.3.3.2.4 Tortoise PopulationsTortoise population changes may be detectable using information gathered from BLMpermanent study plots, distance sampling surveys and sign count surveys. Current data can becompared with older data to see, in general, if there have been declines or increases in abundanceof tortoises or their sign. Population changes can also be detected through carcass observations.This section addresses (1) permanent tortoise study plots, (2) desert tortoise field surveys, and (3)desert tortoise distribution.3.3.2.4.1 Permanent Study PlotsTable 3-12 summarizes Dr. Kristin Berry’s tortoise density estimates (for adults only atthe 95% confidence interval, with associated ranges) for the nine permanent study plots found inthe <strong>West</strong> <strong>Mojave</strong> planning area between 1979 and 1996. Estimates are for the years that markrecapturestudies were performed (source: 1996 memorandum from Dr. Berry to BLM then-Chapter 3 3-76
Assistant District Manager Molly Brady) 3 .Table 3-12Tortoise Density Estimates at Five Study Plots in the <strong>West</strong> <strong>Mojave</strong>.STUDY PLOT YEARSURVEYEDESTIMATED DENSITIES OFADULT TORTOISESRANGEFremont ValleyDTNA InteriorDTNA InterpretiveCenter - InsideDTNA InterpretiveCenter - OutsideFremont PeakKramer HillsStoddard ValleyLucerne ValleyJohnson Valley1981 116 (89-152)1987 78 (47-127)1991 33 (12-85)1979 154 (117-202)1982 238 (184-308)1988 157 (121-204)1992 15 (5-39)1996 13 (5-33)1979 181 (151-218)1985 179 (155-206)1989 81 (62-107)1993 47 (26-86)1979 137 (106-178)1985 105 (82-134)1989 50 (32-78)1993 22 (14-38)1980 70 (23-209)1985 38 (23-64)1989 27 (14-50)1993 5 (2-15)1980 109 (78-153)1982 114 (85-152)1987 67 (43-103)1991 44 (26-75)1995 34 (19-61)1981 86 (58-125)1987 124 (89-172)1991 81 (57-116)1980 93 (66-132)1986 75 (53-107)1990 64 (43-95)1994 65 (45-95)1980 69 (41-115)1986 49 (13-183)1990 15 (6-39)1994 16 (8-32)3 Data from study plot surveys since 1996 at the DTNA and Fremont Valley by the <strong>Desert</strong> Tortoise PreserveCommittee are currently unavailable. In her presentation at the <strong>Desert</strong> Tortoise Disease Workshop at Zzyzx in mid-November 2002, Dr. Berry presented additional data indicating additional declines on these study plots, although themagnitude of these declines remains unknown.Chapter 3 3-77
Using Dr. Berry’s same data, Table 3-13 shows the percent declines observed at eachof the study plots, the dates of the first and last surveys, and the elapsed time between thesurveys (in parenthesis). Study plots are shown in descending order of observed tortoisedecline, with the highest declines shown at the top and the lowest at the bottom.Table 3-13Percent Declines in Tortoise Numbers at Nine Permanent Study Plotsin the <strong>West</strong> <strong>Mojave</strong> <strong>Plan</strong>ning Area, 1979 - 1996STUDY PLOT FIRST - LAST SURVEY DATES PERCENT DECREASE(ELAPSED YEARS)Fremont Peak 1980 - 1993 (13) 93%DTNA Interior 1979 - 1996 (17) 91%DTNA IC Outside 1979 - 1993 (14) 84%Johnson Valley 1980 - 1994 (14) 77%DTNA IC Inside 1979 - 1993 (14) 74%Fremont Valley 1981 - 1991 (10) 72%Kramer Hills 1980 - 1995 (15) 69%Lucerne Valley 1980 - 1994 (14) 30%Stoddard Valley 1981 - 1991 (10) 5%These data indicate that tortoise declines have ranged from as much as 93% at theFremont Peak study plot to as little as 5% at the Stoddard Valley study plot. In the past, therehas been some criticism of extrapolating declines found at the study plots to surrounding areas.Tortoise sign count surveys conducted between 1998 and 2002 for the <strong>West</strong> <strong>Mojave</strong> <strong>Plan</strong>,however, have demonstrated that these regional declines indeed have occurred, and are notrestricted to the permanent study plots. Moreover, the pattern of decline recorded at Dr. Berry’sstudy plots mirrors the findings of the regional field surveys. Above average tortoise sign countsoccur in regions that encompass the three plots where declines were least severe (Kramer Hills,Lucerne Valley, and Stoddard Valley). The plots where tortoise declines were between 93% and72% (Fremont Peak down to Fremont Valley) occurred outside the above-average tortoise signcount polygons.3.3.2.4.2 <strong>Desert</strong> Tortoise Field SurveysMany types of focused desert tortoise surveys have been conducted:• Since 1990, “presence-absence” surveys have been required by cities and counties todetermine if tortoises would be adversely affected by a proposed project or land use.• Since 1990, “clearance” surveys have been authorized under Section 7 and Section10(a)(1)(B) of FESA to remove tortoises from harm’s way during otherwise lawfulactivities.• During 2001 and 2002, “distance sampling” surveys have been completed throughout thefour proposed DWMAs, which are intended, over a relatively long period of time (i.e., 30years), to estimate tortoise densities and population trends at the DWMA level.Chapter 3 3-78
• Since 1975, federal land managers (BLM and the military bases) have used “tortoise signcount” surveys to determine relative tortoise abundance and distribution over regionallandscapes.<strong>Desert</strong> Tortoise Presence-Absence Surveys (1990 - 2002): Since the tortoise was listedas threatened in 1990, city and county planning departments have required focused tortoisesurveys on undeveloped lands as per USFWS (1992) protocol. Such sites have been surveyedalong transects spaced at 30-foot intervals, which is intended to result in 100 percent coverage ofthe site and a determination of presence or absence of tortoises.In 1998, about 250 consultant’s reports for presence-absence tortoise surveys wereobtained from San Bernardino County. Of these, 234 reported either presence or absence oftortoise sign. An additional 595 presence-absence surveys associated with specific projects inSan Bernardino County and elsewhere were obtained in 2002 by the planning team, have beendigitized for GIS analysis, and are used in this analysis.There have been at least five other, recent programmatic surveys or summaries ofprevious surveys for tortoise occurrence within urban areas: (1) 225 square miles in Lancaster(Tierra Madre Consultants, Inc. 1991); (2) 200 square miles encompassing portions of Adelanto,Apple Valley, Hesperia, and Victorville (Tierra Madre Consultants, Inc. 1992); (3) 100 squaremiles in Palmdale (Feldmuth and Clements 1990); (4) 38 square miles in Ridgecrest andInyokern (Circle Mountain Biological Consultants 1997); and (5) 38 square miles in YuccaValley (Tierra Madre Consultants, Inc. 1993).Distance Sampling Surveys in the <strong>West</strong> <strong>Mojave</strong> <strong>Plan</strong>ning Area (2001 – 2002): Unlike thepresence-absence surveys discussed above and sign count surveys discussed below, distancesampling surveys are intended to look only for animals. Carcass information is also collected,but is not used to determine tortoise densities. These data are collected in the spring when adulttortoises are most likely to be active, depending on climatic factors, particularly rainfall. Theyprovide an independent look at tortoises during the spring (which can be compared to thesummer-fall observations of tortoises that were incidentally observed during sign count surveys).Using information collected during the 2001 survey, “encounter rates” were determinedfor each of the four proposed DWMAs. An encounter rate of 0.15 tortoises/kilometer indicatesthat the surveyors, on average, had to walk about 10 kilometers (about 6 miles) to see a tortoise.Encounter rates for the four DWMAs follow: 0.178 in the Ord-Rodman, 0.156 in PintoMountain, 0.145 in the Fremont-Kramer, and 0.115 in the Superior-Cronese. Higher encounterrates indicate that tortoises are seen relatively more often for the same unit area surveyed.Encounter rates are only a small part of determining tortoise densities. Althoughdensities were calculated for the 2001 distance sampling effort, they have wide-ranging“coefficients of variation,” which indicates that the estimates are very rough. For example, thenumber of tortoises per square kilometer was determined to be 11.66 for the Ord-Rodman, 10.31for the Pinto Mountain, and 9.58 for the Fremont-Kramer and 7.59 for the Superior-CroneseDWMAs (source: Memo distributed at MOG TAC meeting in about June 2001). Thecorresponding coefficients of variation were 14.46, 26.69, 15.38, and 18.21, respectively. ForChapter 3 3-79
Pinto Mountain, with the highest coefficient of variation (26.69), the density estimate of 10.31tortoises/km 2 has a possible range of 6.12 to 17.38 tortoises/km 2 . The variation becomesimportant when one considers the large size of the regions involved.The high degree of variation is primarily due to small sample size, in this case, one year.As such, it is too soon to interpret the distance sampling data for the <strong>West</strong> <strong>Mojave</strong>, as the densityestimates derived from one year are far too variable. Relatively accurate density estimates maynot be available until completion of the fifth consecutive year 4 .<strong>Desert</strong> Tortoise Sign Count Surveys (1975 - 2002): Unlike the study plot (markrecapture)and distance sampling methodologies, sign count surveys are focused on tortoise scatand burrows rather than animals. Dr. Berry coordinated most of the earliest surveys in the mid-1970s until the late 1980s; LaRue coordinated the same-method surveys between 1998 and2002 5 .Between about 1988 and 1998, most sign count surveys were performed on militaryinstallations. BLM public lands had not been surveyed for nearly 20 years. The most recentBLM sign count surveys had been conducted between 1975 and 1982 when 1,678 transects weresurveyed within the CDCA, including 894 transects within the <strong>West</strong> <strong>Mojave</strong> planning area (seeBLM 1999). In 1990 a BLM survey was conducted over a 150 square mile area at a density ofthree transects per square mile, throughout the DTNA, Fremont Valley, and Spangler Hills(including portions of the BLM Open Area).The maps published in Berry and Nicholson (1984) were the most recent geographicportrayal of tortoise densities and distribution on public lands outside installations, until 1998,when new sign count surveys were conducted (Map 3-6). However, the 1984 range map (Map 3-7) was based, in part, on the early BLM surveys, and there have been documented declines intortoise numbers in much of the <strong>West</strong> <strong>Mojave</strong> since the data were collected (Berry 1990, asamended; Corn 1994).The data were used to identify only the relative abundance of tortoises (as judged by highversus low sign counts) and general distribution, given the imprecision inherent in using signcount data to determine tortoise densities (see Appendix L), rather than precise tortoise numbers.The results presented throughout this analysis equate each transect with one square mile (i.e.,4 In Washington County, Utah, in support of the Washington County HCP at the Red Cliffs <strong>Desert</strong> Reserve, AnnMcLuckie has supervised distance sampling over a consecutive five-year period, from 1998-2002. Looking at anygiven year, the coefficient of variation for Zone 3, for example, ranged from 15.86 up to 18.16 (McLuckie et al.2002). However when the data are combined over the four-year period, the pooled coefficient of variation wasgiven as 7.34, which a little more than two times more accurate than the estimates given for any one year.5 Methodologies used between 1975 and 2002 were essentially the same (Berry and Nicholson 1984), where onetransect was surveyed along a 1.5-mile equilateral triangle on a given square mile. The focus of the surveys hasalways been tortoise sign (hence, “sign count” surveys), although incidental sightings of live animals and carcasseswere also recorded. Observable human disturbances were also tallied along each sign count transect. Disturbancedata collected since 1998 have included: vehicles (paved roads, dirt roads, trails, tracks), garbage, shooting(shooting areas, individual shell casings), mining (test pits, markers), campsites, sheep sign, cattle sign, domesticdog sign, fence lines and posts, utility lines, denuded habitat, partially denuded habitat, old buildings, and ordnance.Chapter 3 3-80
“52 mi 2 of higher density tortoise areas,” “12 mi 2 of higher density vehicle-based impacts,” etc.).Dr. Krzysik has calculated that each sign count transect is sufficient to survey about 1.3% of agiven square mile. As such, data collected along transects are best used as an index, not anabsolute census of the population or its characteristics. Data from any one or two transectswould have very low predictive value for the square mile(s) being characterized.However, importantly, on a regional scale when all transects are combined, distributionpatterns and relative occurrences (i.e., “above” versus “below” average concentrations) oftortoises are revealed. And even more importantly, they are corroborated by distance samplingdata, and are consistent with trends reported on Dr. Berry’s study plots.Sign count survey data were used to: (a) refine proposed DWMA boundaries (e.g.,determine whether DWMA status was appropriate for the Iron Mountains, an area outside ofcritical habitat and north of Helendale/Silver Lakes where surveys identified significant amountsof tortoise sign); (b) determine the best places to close routes to minimize impacts in areas wheretortoises most likely occur; and (c) determine alternative DWMA boundaries and compare EIR/Salternatives.Sign count surveys conducted since 1988 (see Map 3-6) provide the most recent,available data on the distribution of tortoise sign, which Dr. Anthony Krzysik (2002a, b, c) hasshow to be positively correlated to incidence of tortoises. Over 8,100 transects have beensurveyed on more that 6,300 square miles within the <strong>West</strong> <strong>Mojave</strong> planning area. These surveyefforts are summarized in Appendix LMost of the best available data on current tortoise distribution and observable humandisturbances are encompassed in the 1998, 1999, and 2001-2002 data sets, when 3,372 transectswere surveyed for the <strong>West</strong> <strong>Mojave</strong> planning effort. Relevant information is described below:• 1998 <strong>West</strong> <strong>Mojave</strong> Regional Survey: This was the first regional sign count surveyundertaken on BLM lands in the western <strong>Mojave</strong> <strong>Desert</strong> in nearly 20 years. Surveyswere completed between July and September 1998 on 856 square miles.• 1999 <strong>West</strong> <strong>Mojave</strong>-Fort Irwin Regional Survey: Conducted under the direction of theBLM, USFWS, and Army, biologists surveyed various Fort Irwin expansion alternativeareas and remaining portions of the planning area, particularly in proposed DWMAs.Between July and September 1999 biologists surveyed 1,553 transects on 1,291 squaremiles around Fort Irwin and California City, among other places.• 2001-2002 <strong>West</strong> <strong>Mojave</strong> Regional Survey: Biologists surveyed BLM lands within theplanning area that were not surveyed in 1998 and 1999, might support significantaggregations of tortoises outside the proposed DWMAs (such as Searles, Indian Wells,and Rose valleys to the north), and could confirm areas of expected low-density (areaencompassed by I-15, I-40, Troy Dry Lake, and the eastern planning boundary).Between July 2001 and January 2002, a total of 1,329 square miles meeting one or moreof these criteria was surveyed.Chapter 3 3-81
Tortoise Sign Count Surveys Since 1988NI n y o C oK e r n C oS a n B e r n a r d i n o C oL o s A n g e l e s C oLegendCounty LinesHighways<strong>Plan</strong> BoundaryTortoise Survey PointsR i v e r s i d e C o7/29/04<strong>West</strong> <strong>Mojave</strong> <strong>Plan</strong> <strong>FEIR</strong>/SMap 3-6Scale: 1 : 1,750,0000 10 20 30Km0 10 20 30Miles
1984 Tortoise Range and Density MapNLegendCounty LinesHighways<strong>Plan</strong> BoundaryPlayasAreas > 4,500 ft ElevationTortoise Range Boundary (1984)No./sq. mile (est.)1-2020-5050-100100-250>25010/18/04<strong>West</strong> <strong>Mojave</strong> <strong>Plan</strong> <strong>FEIR</strong>/SMap 3-7Scale: 1 : 1,750,0000 10 20 30Km0 10 20 30Miles
1998 –2001 Survey Results: During the three years 3,362 transects covering 3,378 mi 2were surveyed, typically at a density of one transect per square mile. Of the 3,362 transects,1,405 (42%) did not have any tortoise sign, with some tortoise sign found on the remaining 1,957(58%) transects. The distribution of above-average sign counts reveals that higher densitytortoise areas occur on a northeast-southwest axis, between Fort Irwin and south of Edwards AirForce Base (Map 3-8). There were three higher concentration areas in the Ord-Rodman DWMA,and none was observed in the Pinto Mountain DWMA. No higher density tortoise areas werefound in the northern and western portions of the Fremont-Kramer and Superior-CroneseDWMAs, respectively.Tortoise Occurrence in Burrows versus Aboveground: During sign count surveys in thesummer-fall, 275 tortoises were observed, including 202 (73%) in burrows and 73 (27%)aboveground. During distance sampling in the spring, 216 tortoises were observed, including 86(40%) in burrows and 130 (60%) aboveground. For the survey period of 1998 to 2002, tortoiseswere mostly found in burrows (73%) in the summer-fall and mostly found aboveground (60%) inthe spring. These data indicate that tortoises were relatively more active (i.e., aboveground, outof burrows) in the spring and relatively less active in the fall, which is consistent with theliterature.Male versus Female Tortoise Encounters: The seasonal activity patterns described abovealso affected the number of male versus female tortoises encountered. Of the 108 sign counttortoises observed where gender could be determined, 73 (68%) were males and 35 (32%) werefemales, which is a 2:1 ratio of males to females. Comparatively, of the 156 distance-samplingtortoises where gender could be determined, 87 (56%) were males compared to 69 (44%)females, which is a 1.26:1 ratio of males to females. These data suggest that, relative to females,male tortoises are twice as likely to be encountered in the fall, and males and females areencountered at about equal rates in the spring. The difference is apparently due to increasedmale (or decreased female) activity in the fall. The data indicate a 1:1 ratio of males to femalesencountered, which suggests a 1:1 ratio within the surveyed population.Adult versus Subadult Tortoise Encounters: Of the 275 tortoises encountered during signcount surveys, both in burrows and aboveground, 238 (87%) were adults and 37 (13%) weresubadults 6 . Of the remaining 178 (i.e., 83% of 216) tortoises where age class was determined,146 (82%) were adults and 32 (18%) were subadults, which is very similar to the sign countobservations. Combined, there were 453 tortoises where age class could be determined,including 384 (85%) adults and 69 (15%) subadults. The age classes for 38 of the 216 (17%)tortoises encountered during distance sampling were recorded as “unknown.”6 Surveyors used a cutoff of 180 mm to determine age class; carapace lengths of less than 180 mm characterizedsubadults, and adults were 180 mm or greater in length. Although age class determinations were affected byseasonal activity of tortoises, age class was also determined from burrow widths. In general, the width of a tortoiseburrow opening is equal to the length of the tortoise constructing the burrow. As such, the age class for tortoises inburrows could be ascertained by measuring the width of the burrow opening. However, it is well documented thatsubadult tortoises are notoriously difficult to find, and generally under-represented in regional surveys.Chapter 3 3-84
Higher Density Tortoise Sign Count Areas(1998-2002)395I n y o C oN17814K e r n C o3951558S a n B e r n a r d i n o C o40156613818L o s A n g e l e s C o247LegendCounty LinesHighways<strong>Plan</strong> BoundaryProposed DWMAsAbove Average TCSFort Irwin Expansion AreaMilitary LandsR i v e r s i d e C o6210/14/04<strong>West</strong> <strong>Mojave</strong> <strong>Plan</strong> <strong>FEIR</strong>/SMap 3-8Scale: 1 : 1,300,0000 10 20 30Km0 10 20 30Miles
Although these data indicate subadults comprised about 15% of the tortoise encounters, itdoes not necessarily indicate that subadults comprise 15% of the population. Subadults likelycomprise more than 15% of the population because they are regularly under-represented inregional surveys, but how much more is unknown. In Boarman and Sazaki’s (1996) studypopulation south of Highway 58, the subadult component was estimated to be 20%. Theseobservations are significant with regards to conservation management scenarios compared inChapter 4. Alternative E, for example, would focus management on eliminating common ravensand disease impacts on tortoise in DWMAs. Effective raven management would provide mostbenefits for tortoises under 110 mm in length, which may comprise 10% or less of the DWMApopulation 7 .Krzysik Analysis of Tortoise Survey Results: Dr. Anthony Krzysik has analyzed theresults of the recent tortoise sign count surveys (see Appendix K). Dr. Krzysik found that (a)desert tortoises are closely associated with their sign (i.e., burrows and scats); there is a highlysignificant correlation of live tortoises with burrows, scats, and Total Corrected Sign (TCS); (b)transects associated with live tortoises are typically also associated with appreciable sign counts;(c) both tortoise densities and tortoise mortality rates are similar in the four DWMAs analyzed;and (d) that the four DWMAs appear to be similar to one another in their tortoise and sign countdensities, and therefore, of similar value as desert tortoise conservation areas.Evidence of Tortoise Population Declines Between 1980 and 2002: Comparing signcount data collected prior to 1984 (“older data”) with those of 1998-2002 (“newer data”) shows adecline in the abundance of tortoise sign per transect. There were 213 older and 3,362 newertransects surveyed throughout the planning area. Comparisons are given in Table 3-14.TCSCATEGORIESTable 3-14Tortoise Total Corrected Sign Found in <strong>West</strong> <strong>Mojave</strong> <strong>Plan</strong>ning AreaBetween 1975 to 1982 and Between 1998 to 2002PREVALENCE OF TOTAL CORRECTED SIGN1975 to 1982 Transects 1998 to 2002 TransectsTotal No. % Of Total Total No. % Of Total0 38 18 1,405 421 to 3 57 27 1,113 334 to 8 45 21 583 179 to 16 46 22 195 617 to 28 20 9 56 129 to 50 6 3 10 50 1 0 0 0Totals 213 100% 3,362 100%7 The 10% figure assumes that the subadult cohort in the surveyed population is 20% (i.e. 5% more than observed toaccount for lower detectability of this age class). It also assumes that many of the subadults encountered werebetween 120 and 180 mm, and therefore less vulnerable to ravens. There is no way to census (i.e., count everyanimal) subadult populations, and the data generally do not include measured lengths (i.e., more often recorded as“subadult” than measured), so these numbers are hypothetical.Chapter 3 3-86
When data for the three lowest sign count categories (i.e., 0 to 8) are combined, a total of140 older transects (66% of 213) and 3,101 newer transects (92% of 3,362) were included.When data for the three highest categories (9 to 50) are combined, a total of 73 older (34%) and261 newer (8%) transects were included. One sees that there has been a shift in the abundanceof observed tortoise sign, with relatively few sign on proportionately more transects recentlysurveyed, corresponding to relatively more sign on proportionately more transects surveyed 20years ago. In other words, there has been a proportional decline in the abundance of tortoise signobserved on transects between 1980 and 2002, indicating a decline in the abundance of tortoisesbetween 1980 and 2002 (see Krzysik 2002a, b, c).Regions of Higher and Lower Tortoise Concentrations: Regions within the DWMAswere identified relative to above average (higher density) and below average (lower density) signcounts. Polygons were established to encompass all areas meeting two criteria. The two criteriaincluded: (1) There must be at least four contiguous square miles of above-average tortoise signbefore a polygon could be established; and, (2) polygon boundaries must not span more than onelinear mile not surveyed or having below-average sign counts. While this approach eliminatedsubjectivity from delineating polygon boundaries, it also resulted in encompassing some squaremiles where there were no data or the sign counts were lower than average.The results of this analysis are depicted in Map 3-8, and are displayed in Table 3-15.Three regions were identified in the Fremont-Kramer DWMA, seven in the Superior-CroneseDWMA, and five in the Ord-Rodman DWMA that support above-average occurrences oftortoise sign (and therefore tortoises; see Krzysik 2002a, b, c). None was found in the PintoMountain DWMA.Table 3-15Above-Average Tortoise Sign Counts ObservedIn Proposed DWMAs between 1998 and 2001DWMA SIZE AND %PROPOSED DWMA NUMBER OFABOVE-AVERAGEPOLYGONSSIGN COUNTS 8 ABOVE-AVERAGEFremont-Kramer 3 142 mi 2 779 mi 2 (18%)Superior-Cronese 7 147 980 (15%)Ord-Rodman 5 69 388 (18%)Pinto Mtn. 0 0 173 (0%)TOTAL 15 258 2,320 (15%)Fremont-Kramer DWMA: There are three tortoise concentration areas on about 142 mi 2 ,comprising about 18% of the 779 mi 2 Fremont-Kramer DWMA, which are shown on Map 3-8.Two of the three tortoise concentration areas occur mostly south of Highway 58, and the thirdone occurs in a 9 mi 2 area north of Highway 58, near the northwest corner of Harper Dry Lake.8In using the two rules to establish polygons, higher density tortoise areas included some square miles of lowerdensities and those that were not surveyed, as depicted on Map 3-7. However, only those square miles supportinghigher sign counts within the polygons are included in the tallies shown in the table. “Above-average” or “higherdensity” areas were derived by excluding all transects with no sign and determining the average of the remainingvalues. In this comparison, only transects surveyed in DWMAs are included. As such, “above-average”transects/square miles are actually “average and above” transects found in DWMAs.Chapter 3 3-87
Importantly, no higher density polygons were found at the <strong>Desert</strong> Tortoise Natural Area andFremont Valley, where tortoise densities in the early 1980’s were 181-238 tortoises/mi 2 at theDTNA and 116 tortoises/mi 2 in the Fremont Valley. No higher density areas were found in theregions where Dr. Berry reported declines up to 90% on the associated study plots. Althoughtortoises certainly occur in areas north of Highway 58, it appears that many animals have diedthroughout the region since the late 1970’s, a conclusion supported by the carcass data, describedbelow.Superior-Cronese DWMA: There are seven tortoise concentration areas on about 147 mi 2 ,comprising about 15% of the 980 mi 2 Superior-Cronese DWMA, which are shown on Map 3-8.The core area occurs north of Barstow and Hinkley, east of Harper Lake, and west of IrwinRoad, in the Mud Hills-Water Valley area. Other concentrations are found in “Coyote Corner,”which is southwest of Fort Irwin, and in the Cronese Lakes area, southeast of Fort Irwin. All, ora portion of, three higher density areas comprising 17 mi 2 , are found in the Fort Irwin expansionarea. There were also 34 mi 2 of higher density areas on Fort Irwin south of the UTM 9-0 lineand adjacent areas, mostly to the northwest. The Fort Irwin expansion, then, would affect about51 mi 2 of all higher tortoise areas. No higher concentration areas were observed north of HarperLake to China Lake or in the western portions of Superior Valley. Some of these areascorrespond to recent die-off regions, where numerous recently dead tortoises have been found(see discussion below).Ord-Rodman DWMA: There are five tortoise concentration areas on about 69 mi 2 ,comprising about 18% of the 388 mi 2 Ord-Rodman DWMA, which are shown on Map 3-8.These concentration areas are included in three general regions: (1) northern portion of StoddardValley along Lenwood Wash, extending north over Daggett Ridge to near Barstow; (2) northernLucerne Valley; and (3) in the northwest corner of the DWMA, north of the Johnson ValleyOpen Area and east of Box Canyon, bordering the Twentynine Palms Marine Corps Base. TheOrd Mountains physically separate these three subregions, so that the absence of sign through themiddle part of the DWMA may be due to natural causes (i.e., fewer tortoises in elevations above4,500 feet), or may not have been surveyed. Relatively less tortoise sign was found in StoddardValley east of Highway 247, where Dr. Berry’s 1984 range map showed that concentrations wereat one time in excess of 250 tortoises/mi 2 (Map 3-7).It is noteworthy that two of the nine BLM permanent study plots occur in the Ord-Rodman DWMA, both in areas of relatively higher density sign counts. The Lucerne Valley plotis located in the northern Lucerne Valley, in the southern tortoise concentration area, and theStoddard Valley plot is located west of Daggett Ridge, in the northwestern concentration area.Dr. Berry’s studies found a 30% decline on the Lucerne Valley plot and a 5% decline on theStoddard Valley plot, which is relatively small compared to declines in excess of 75% in thenorthern and northwestern Fremont-Kramer DWMA.Pinto Mountain DWMA: There were no above-average tortoise areas in the 173 mi 2Pinto Mountain DWMA. Population densities appeared to be low, although few carcasses werefound during sign count surveys performed since 1998. There also appeared to be no older ormore recent die-off regions within this area.Chapter 3 3-88
Occurrence of Tortoises Relative to Higher Density Sign Count Areas: Much of thepreceding discussion relies on the assumption that relatively more tortoises are found in higherdensity sign count areas. One test of this assumption is to see what percentage of the tortoisesobserved during recent surveys occurred in these areas. Of the 275 tortoises observed during signcount surveys, UTM coordinates were available for only 261. Of these 261 tortoises, 101 (39%)were found within the higher density areas and 160 (61%) were found outside them, which isdepicted on Map 3-9.The comparison is more meaningful when the relative area of higher density and lowerdensity sign counts are compared to DWMA size. Within the three DWMAs (i.e., 2,147 mi 2excluding Pinto Mountain), there were 358 mi 2 (17% of the three DWMAs) of higher sign countareas and 1,789 mi 2 (83%) of lower sign count areas. Of the 261 tortoises, 101 (39%) werewithin higher sign count areas, compared to 160 (61%) lower sign count areas. One can see,then, that 39% of all tortoises were observed in 17% (i.e., higher density areas) of the threeDWMAs; the remaining 61% of all tortoises were in 83% (i.e., lower density areas) of the threeDWMAs. These findings suggest that tortoises are relatively concentrated in areas ofconcentrated sign counts.Locations of live tortoises, segregated into subadult (i.e.,
Distribution of Live Tortoises Observed Relative toHigher Density Sign Count AreasI n y o C oN17814K e r n C o3951558S a n B e r n a r d i n o C o401566138L o s A n g e l e s C o18LegendCounty LinesHighways<strong>Plan</strong> BoundaryMilitary LandsProposed DWMAsHigher Density TCS AreasLive Tortoises ObservedAdultsSubadults247R i v e r s i d e C o6210/14/04<strong>West</strong> <strong>Mojave</strong> <strong>Plan</strong> <strong>FEIR</strong>/SMap 3-9Scale: 1 : 1,350,0000 10 20 30Km0 10 20 30Miles
Regional Declines in the Four DWMAs: In comparing the earliest survey efforts withlater ones, it appears that there have been substantial declines in tortoise numbers in thenorthwest portion of the Fremont-Kramer DWMA. This area is bounded by Highway 58 to thesouth, Red Mountain to the north, Fremont Peak to the east, and the DTNA to the west. Itencompasses the three DTNA study plots and those at Fremont Peak and Fremont Valley, whereDr. Berry documented tortoise declines ranging from 93% at Fremont Peak to 72% at theFremont Valley study plot. No above-average tortoise sign polygons were identified anywherewithin this region. Although there were a few transects with above-average tortoise sign, thesewere insufficiently concentrated for the polygon criteria to be met.The analysis found above-average tortoise sign polygons to be oriented on a northeast-tosouthwestaxis, from about Fort Irwin to the northeast to areas south-southeast of Edwards AirForce Base (Map 3-8) in areas identified as having above-average tortoise sign; the JohnsonValley plot is east of this area. It is noteworthy that the Kramer Hills, Lucerne Valley, andStoddard Valley study plots showed the smallest population declines during the 10 to 15 yearsthey were surveyed (1996 Berry Memorandum), and are included in three regions that currentlysupport higher sign count areas.3.3.2.4.3 <strong>Desert</strong> Tortoise DistributionRevised Tortoise Range Map: Survey data were used to produce an updated tortoiserange map of current tortoise distribution (See Map 3-10). The 1984 range map (Map 3-7)identified approximately 11,255 mi 2 (7,203,107 acres) of tortoise habitat, whereas 11,134 mi 2(7,125,842 acres) are identified in the 2002 Tortoise Range Map 9 , which represents a reductionof about 121 mi 2 .Map 3-10 depicts three regions within the 2002 tortoise range: reduction areas, expansionareas, and areas requiring more surveys. These areas are discussed in detail in Appendix L.9 Each of these figures over-estimates occupied tortoise habitat, as dry lake playas, elevations above about 4,500feet, and other marginal or unsuitable habitats are included within both range lines. Nor do they imply anythingabout the relative of densities occurring in the older and more recent ranges.Chapter 3 3-91
2002 Tortoise Range MapN190I n y o C o395178K e r n C o14395155814S a n B e r n a r d i n o C o40156613818L o s A n g e l e s C o247LegendCounty LinesHighways<strong>Plan</strong> BoundaryPlayasAreas > 4,500 ft Elevation2002 Tortoise Range1984 Tortoise Range BoundaryR i v e r s i d e C o6210/14/04<strong>West</strong> <strong>Mojave</strong> <strong>Plan</strong> <strong>FEIR</strong>/SMap 3-10Scale: 1 : 1,750,0000 10 20 30Km0 10 20 30Miles
Tortoise Distribution within the Revised Range: The TCS distribution map (Map 3-11on attached CD Rom) was generated exclusively based on 1998 to 2002 sign count surveys.Map 3-11 uses TCS categories that have been traditionally used to estimate tortoise densities,which are useful to determine relative tortoise abundance and distribution. These categoriesinclude: 0, 1 to 3, 4 to 8, 9 to 16, 17 to 28, and 29 to 50 TCS/transect (i.e., which is mostlyreported as “TCS/mi 2 ). For convenience, the six categories are occasionally segregated into twocategories of relatively low sign counts (0 to 8) or relatively high sign counts (9 to 50). Theaverage number of TCS in DWMAs was found to be 5 mi 2 , which was used as the demarcationto differentiate above- and below-average density areas.This map reveals that there are few regions within DWMAs where tortoises arecompletely extirpated, or for other reasons, do not occur. It identifies areas where high signcounts were found on 261 transects, or conversely, no sign was found (transects along the SierraNevada, west of the aqueduct). In many cases, low-density areas may be adjacent to orsurrounded by relatively higher density areas.Natural Absences of Tortoises: Several safe assumptions can be made about tortoisedistribution in the western <strong>Mojave</strong> <strong>Desert</strong> since the 1970s:• Tortoises are mostly absent from dry lakebeds.• Tortoises are absent from areas above 5,000 feet elevation, and nearly so at 4,500 feet. In1999, only 5 of 609 (0.8%) transects with tortoise sign occurred above 4,000 feet;similarly, in 2001, only 12 of 991 (1.2%) transects with tortoise sign occurred above4,000 feet. In 1998, all 875 transects were located below 4,500 feet.• Tortoises may be naturally sparse in the northern portion of the range, from the AvawatzMountains, through China Lake Naval Air Weapons Station, up to Rose Valley alongHighway 395. Much of this area is protected on military installations or otherwiseinaccessible to most casual desert visitors, yet no surveys since the 1970's have foundsignificant areas of above-average tortoise sign. Weinstein (1989) found that latitude wasa contributing factor to tortoise occurrence, and that in general densities decreased withincreasing northern latitudes.There are also places where local geological and hydrological factors may be responsiblefor relatively low tortoise numbers. The lavic flows associated with Black Mountain, north ofHarper Lake, may be sufficiently unsuitable that tortoises are naturally uncommon, althoughthere is an apparent abundance of tortoises at Pisgah Crater, a similar formation. During 1994,on the south-central and southwestern portions of Edwards Air Force Base (between SouthRogers Dry Lake and Rosamond Dry Lake, including Buckhorn Dry Lake), the only tortoisesfound were restricted to a small hill that rose above the surrounding saltbush scrub, which wasvegetated by the only creosote bush scrub observed in the region (LaRue, pers. obs.).The more difficult question is, what is the evidence that tortoises occupied all areaswhere they are now presumed extirpated (missing)? Tortoises are extirpated from large portionsChapter 3 3-93
of the Lucerne and Victor valleys and from the entire western portion of Antelope Valley; whatis the evidence that they ever occurred there? Lucerne Valley is relatively straightforwardbecause a few tortoises can still be found along the base of the San Bernardino Mountains, southof the developed portion of the community. They are documented to the north, east, and west, soit is clear that Lucerne Valley once supported suitable habitat, if not fully occupied by tortoisesprior to recent development.The Victor Valley’s southern demarcation of natural tortoise absence (from westernLucerne Valley through southern Hesperia, Oak Hills, Baldy Mesa, to Phelan) cannot be welldefined with existing data, which have mostly been collected since the 1990 listing. With theexception of two questionable data points near the southwestern corner of Hesperia, no tortoisesign has been found south of Highway 18 from Apple Valley to Highway 395 since 1990 (seeMap 3-6). Highways 18 and 138 generally separate areas to the south where tortoises areapparently absent from areas to the north, where habitats are substantially degraded and only afew residual aggregations occur 10 .In 1990, it was judged that only about 90 square miles within the 225-square mile City ofLancaster and its sphere of influence still supported potential occupied tortoise habitat (TierraMadre Associates, Inc. 1991). Only three carcasses were found during surveys along 330 linearmiles of transects (LaRue, pers. obs.). No evidence of living tortoises was found, nor has anybeen found over the last 12 years during surveys required by the City of Lancaster (BrianLudicke, pers. comm.). Even so, these carcasses, and numerous accounts documented by Berryand Nicholson (1984) show that the Antelope Valley, west of Highway 14 was historicallyoccupied. Data were found for only four or five surveys in the southern half of the AntelopeValley, west of Lancaster. No 1975-1982 BLM data were collected there.Carrying Capacity: Carrying capacity is the inherent ability of the land to support agiven number of tortoises per unit area. The tortoise carrying capacity of any area cannot bestated with precision, except for certain lands (such as playas and lands above 5,000 feetelevation) where the carrying capacity is zero. Based on Dr. Berry’s study plot data, there wereas many as 238 adult tortoises per square mile at the DTNA in 1982 and as many as 70 atFremont Peak in 1979. These are more accurately described as 1979-1980 baseline populationnumbers for two square miles and an unknown contiguous area containing similar vegetation,and are not reflective of the carrying capacity of the two regions in which they occurred. Nor dothey reflect trends in the population that preceded the 1970’s, when the baseline studies werefirst conducted. The declines observed on these two plots between 1980 and 1996, however, doapparently reflect declines that were occurring on a regional scale during that time.These studies do not reflect how many tortoises may have occurred in the region in the1950s, for example, or in 1900. Had high tortoise populations existed and suffered catastrophicdie-offs, sufficient time would have elapsed for all carcasses to disintegrate in the interim,leaving no indication of tortoise populations even 20 years before the first study plots weresurveyed.10 For example, tortoise sign was found on only 1.5 mi 2 in a 20 mi 2 area surveyed in this region in 2002.Chapter 3 3-94
Boarman (pers. comm., Nov 2002) has suggested that the lower rainfall levelsexperienced in the second half of the 20 th Century may have reduced productivity, therebyreducing the capacity of the land to sustain as many tortoises are previously. Oftedahl (pers.comm., Nov 2002) has suggested that long-term cattle grazing may have depleted the naturalseed bank of plants with a high potassium excretion potential (see discussion above) and that itmay be impossible to regain that seed bank, even if grazing is discontinued.Nor does the Recovery <strong>Plan</strong> indicate how or when the baseline population numbersshould be established. In fact, that baseline is currently being established through line distancesampling surveys, which were initiated in the western <strong>Mojave</strong> <strong>Desert</strong> in 2001. It may take up tofive years to determine a statistically valid baseline population. If so, the baseline wouldrepresent a snap shot of tortoise densities in the year 2005.3.3.2.5 Threats to Tortoises: Mortality FactorsAvailable literature presents many threats that are known or suspected to affect tortoisesand their habitats. Dr. William Boarman (2002) identified 22 impacts that may affect tortoisesthroughout the listed population: agriculture, collecting, construction, disease, drought, energyand mineral development, fire, garbage and litter, handling and manipulation, invasive weeds,landfills, livestock grazing, military operations, noise, non off-highway vehicle recreation, offhighwayvehicles, predation, roads and highways, urbanization and development, utilitycorridors, vandalism, and wild horses and burros. Dr. Boarman’s analysis is included in itsentirety as Appendix J.Dr. Boarman’s discussion of threats is general and is not restricted to physical impactsand miscellaneous threats that are known to occur in the <strong>West</strong> <strong>Mojave</strong> planning area. Thefollowing discussion focuses on threats present within the planning area. It addresses (1) directand indirect anthropogenic (i.e. human-caused) mortality factors, (2) natural mortality factors,and (3) carcass observations and die-offs suggested by recent data. The relationship between offhighway vehicles and tortoises, an issue that has received a high level of public interest, isaddressed separately in Section 3.3.2.6 (below).A detailed analysis of carcass observations is presented in Appendix L. The reader isencouraged to review that analysis as an adjunct to summary carcass observations presented inthe following sections.3.3.2.5.1 Direct and Indirect Anthropogenic Mortality FactorsThere are both direct and indirect anthropogenic mortality factors (see Boarman 2002 fordiscussion). Direct mortality factors have immediate results (incidental mortality duringconstruction, removal of animals from the desert), whereas indirect mortality factors occur overtime, and are not always easily associated with the direct mortality factors from which they arise.Direct Anthropogenic Mortality Factors: These include blading a pipeline right-ofway,tract home development, and similar land disturbances where native vegetation is removedand tortoises residing in the area are either crushed or forced to move into adjacent areas ofChapter 3 3-95
suitable habitat. Direct mortality factors also include crushing tortoises along paved andunpaved roads; intentional vandalism, such as shooting tortoises; pet collection; poaching forfood or ceremonial purposes; loss of animals to fire; trampling by cattle; and animals lost tomilitary maneuvers. Not all direct mortality factors are manmade; prolonged drought, wildfirescaused by lightning, and naturally unsuitable geographical features (e.g., playas) are either directmortality factors or natural features that directly affect tortoise densities and distribution (seeSection 3.3.2.5.2, below).Direct mortality factors are often researched in scientific studies, but such studies aretypically limited in scope, for example, to a given cattle allotment or specific motorized raceevent. Such studies should not be dismissed, but they fail to identify either the geographicalextent or severity of mortality factors on a regional scale.To better understand both the distribution and severity of direct mortality factors on aregional scale, data recently collected in the field were used. These included 19 disturbancecategories: Vehicles (Paved Roads, Dirt Roads, Trails, Tracks), Garbage, Shooting (BulletCasings and Shooting Areas), Mining (e.g., test pits, markers), Campsites, Livestock (Sheep andCattle), Wild Horses or Burros, Domestic Dogs, Fence lines and Posts, Utility Lines, DenudedHabitat, Partially Denuded Habitat, Old Buildings, and Military Ordinance. These data represent“observable human disturbances” and in many cases direct mortality factors. They are the basisfor the following discussion.The data have been used to to see where such impacts have occurred and are likely topersist or increase in the absence of proactive management. They allow the identification ofareas where observable human impacts tend to be clustered or, alternatively, are uncommon. Forexample, the data clearly show that in DWMAs the most concentrated areas of cross-countryvehicle tracks are adjacent to BLM open areas (particularly El Mirage and Johnson Valley) anddesert communities (e.g., Silver Lakes). Data show that cattle are not constrained to allotments,as cow dung has been recorded up to several miles outside allotment boundaries. Illegaldumping is most common adjacent to urbanizing areas, as are domestic dogs. These data havebeen used to identify areas where focused management can further assess and remedy problems.Direct mortality factors were recorded during both the 1998-2001 tortoise sign-countsurveys and the 2001-2002 distance sampling surveys. Of 148 tortoises found dead where thesuspected cause of death was given, 76 (51%) were attributed to mammalian predation (coyotes,kit foxes, occasionally feral dogs), 42 (28%) were identified as crushed by off-highway vehicles,13 (9%) due to raven predation, 9 (6%) due to gunshot wounds, and 9 (6%) due to other causes.Urbanization: Urbanization poses serious direct impacts to tortoises, and has resulted inregional extirpations, particularly within the southern and southwestern portion of its range.Historical records and anecdotal evidence indicate that tortoises once occupied all areas fromeastern Antelope Valley, through Lancaster and Palmdale, Pearblossom, Lake Los Angeles,Hesperia, Victorville, Apple Valley, to Lucerne Valley. Current data for these areas show thatChapter 3 3-96
tortoises are either extirpated (Lancaster, western Palmdale, southern Apple Valley, central andeastern Victorville, all of Hesperia) or very nearly so (remaining areas) 11 .Indirect effects of urbanization are less clear than the direct effects of mechanicallyremoving 10 acres of occupied tortoise habitat, but, cumulatively, they remove tortoises from thelandscape as effectively as heavy equipment. Wide-spread dumping, sheep grazing, unregulatedoff highway vehicle traffic, release of hazardous materials (i.e., motor oil drained on the ground,discarded paint, etc.), tortoise collection, loss of tortoises and habitat degradation by feral and petdogs, and increased raven numbers are just a few of the impacts associated with urbanization thatextend far into the desert. Where residential communities are immediately adjacent to tortoisehabitat (Barstow, northern Lucerne Valley, Silver Lakes/Helendale, Hinkley, Twentynine Palms,etc.) the impact may be even more threatening to core aggregations of tortoises.Between 1990 and 2001, LaRue surveyed 78 different project sites in urbanizing areas forevidence of tortoises. Urbanizing areas included in the survey, among others, were AppleValley, Baldy Mesa, Barstow, California City, Hesperia, Joshua Tree, Lake Los Angeles,Lancaster, Landers, Lucerne Valley, Newberry Springs, Palmdale, Phelan, Ridgecrest,Rosamond, Silver Lakes/Helendale, Victorville, Yermo, and Yucca Valley. Table 3-16 reportsthe prevalence, in descending order, of observable direct impacts associated with these (andother) urbanizing areas.Table 3-16Disturbances Observed on 78 Projects in Urbanizing AreasDISTURBANCE CATEGORY NUMBER OF PROJECTS WITHDISTURBANCEDISTURBANCE ON 100% OFTRANSECTSCross-country OHV travel 74 (95%) 39 (50%) project sitesDumping 72 (92%)Domestic dog sign 69 (88%) 20 (26%) project sitesDirt roads 67 (86%) 28 (36%) project sitesShotgun shells 59 (76%)Misc. ground disturbance 24 (31%)Evidence of sheep grazing 19 (24%)Cross-country OHV tracks, dumping, domestic dog sign, and dirt roads are prevalent inthese urbanizing areas. The third column reports the number and percentage of the 78 siteswhere the indicated disturbance was observed on 100% of transects surveyed. Thus, 39 of the 78projects (50%) had vehicle tracks, 28 of 78 (36%) had dirt roads, and 20 of 78 (26%) had dogsign on 100% of all transects surveyed.These data are comparable to those collected by LaRue and others in 1991 in the 225 mi 2Lancaster planning area, where tortoises historically occurred but are now extirpated (TierraMadre Consultants, Inc. 1991). In that study, aerial photographs revealed that only 90 of the 22511 Each of the following reports has identified extensive areas where tortoises no longer occur: (a) 225 square milesof Lancaster (Tierra Madre Consultants, Inc. 1991); (b) 200 square miles encompassing portions of Adelanto, AppleValley, Hesperia, and Victorville (Tierra Madre Consultants, Inc. 1992); (c) 100 square miles of Palmdale(Feldmuth and Clements 1990); and (d) 38 square miles of Ridgecrest and Inyokern (Circle Mountain BiologicalConsultants 1997).Chapter 3 3-97
mi 2 within the planning area supported vegetation communities that may still support tortoises.The remaining 135 mi 2 were developed for residential, industrial, commercial, and agriculturalpurposes, and no longer constituted suitable habitats. Table 3-17 reports the prevalence of thedisturbances listed above in Table 3-17 that were observed on 72 mi 2 in the Lancaster sphere oninfluence (2 nd column) and 18 mi 2 within Lancaster’s city limits (3 rd column), which comprisedthe 90 mi 2 of potential tortoise habitat.Table 3-17Disturbances Observed in the Lancaster <strong>Plan</strong>ning Area in 1991DISTURBANCECATEGORYPERCENT OCCURRENCE IN THESPHERE OF INFLUENCEPERCENT OCCURRENCE WITHIN THECITY LIMITSCross-country OHV travel 81% 88%Dumping 92 100Domestic dog sign 77 72Dirt roads 60 72Shotgun shells 97 89Misc. ground disturbance 7 16Evidence of sheep grazing 100 100Several attempts have been made to determine if there is a statistical relationship betweenincreased human disturbances and decreased numbers of tortoises, with limited success (Dr. RossKiester, pers. comm. 2000). Fifty-eight of LaRue’s 78 surveys recorded the total number ofhuman disturbances observed on each transect, and either the presence or absence of tortoisesign. Tortoise sign was found on 25 project sites (43%) and absent from 33 (57%) of them.Table 3-18 shows the average number of disturbances observed (of the 10 categories given) pertransect for each of these categories.Table 3-18Human Disturbance Levels Observed25 Sites Where Tortoise Sign Was Found and 33 Sites Where Sign Was Not FoundDISTURBANCE CATEGORYPREVALENCE OF DISTURBANCES PER TRANSECTTortoise Sign Present(25 sites)Tortoise Sign Absent(33 sites)Cross-country OHV travel 2.40 2.83Domestic dog sign 1.37 2.59Dirt roads 1.56 2.04Dumping 0.72 1.50Shot gun shells 0.63 0.57Evidence of sheep grazing 0.59 0.44Misc. ground disturbance 0.40 0.26These data show that cross country travel, domestic dogs, dirt roads, and dumping wererelatively more prevalent on urban sites where tortoise sign was absent. Both direct and indirectimpacts associated with these human uses result in degraded habitats and loss of tortoises.In Table 3-19, data collected between 1998 and 2002 on 1,572 transects in the Fremont-Kramer and Superior-Cronese DWMAs are compared to disturbances observed on the 78 urbanChapter 3 3-98
sites surveyed by LaRue between 1990 and 2001. These two DWMAs were chosen for theirrelative proximity to the urban and rural sites surveyed by LaRue.Table 3-19Comparison of Disturbances: DWMAs and Urbanizing AreasNUMBER (%) OF PROJECTS AND TRANSECTS WITH DISTURBANCEDISTURBANCE ON 78 SITES IN URBAN ON 1,572 TRANSECTS IN TWO DWMASCATEGORYAREASOff-road OHV tracks 74 (95%) 833 (53%)Dumping 72 (92%) 27 (2%)Domestic dog sign 69 (88%) 6 (< 1%)Dirt roads 67 (86%) 702 (45%)Shotgun shells 59 (76%) 326 (21%)Misc. ground disturbance 24 (31%) 26 (2%)Sheep grazing 19 (24%) 200 (13%)Human disturbances on the rural and urban sites surveyed by LaRue were significantlymore prevalent than the same disturbances observed in two of the proposed conservation areas.Unimproved, dirt roads (53%) and OHV cross-country travel (45%) were the two most prevalenthuman disturbances observed in the proposed conservation areas. Domestic dog sign (< 1%),dumping (2%), and miscellaneous ground disturbance (i.e., denuded and partially denuded areas)(2%) were negligible in DWMAs compared to urbanizing areas (i.e., 88%, 92%, and 31%,respectively).Maintained Roads: Trombulak and Frissell (2000) concluded that maintenance and useof roads contribute at least five different general classes of chemicals to the environment: heavymetals, salt, organic molecules, ozone, and nutrients. They found that most studies indicate thatcontamination declines within 65 feet (20 meters) but that elevated levels of heavy metals oftenoccur 650 feet (200 meters) or more from the road. However, there is no evidence thatchemicals are used on roads in the <strong>Mojave</strong>,Nor are the effects of these contaminants on tortoises known. Dr. Berry, in collaborationwith Dr. Bruce Homer, has suggested that heavy metals may be involved in the tortoise shelldisease known as cutaneous dyskeratosis. The relationship between contaminants and cutaneousdyskeratosis is not understood, nor is the lethality of the shell disease. It was associated with aregion-wide die-off of tortoises on the Chuckwalla Bench (i.e., decline from 225 tortoises in1982 to 85 in 1992), but not necessarily the cause of it. The Chuckwalla Bench die-off wascoincident with the 1988-89 die-off at the <strong>Desert</strong> Tortoise Natural Area, although 200 milesseparate the two areas.Tortoises often dig their burrows in the berms of roads, particularly along those that arenot frequently used, and where there is little vehicle stray (LaRue, pers. obs., Copper MountainMesa, between Yucca Valley and 29 Palms). An erosion ditch found along Highway 395apparently attracted at least one tortoise near that highway (LaRue 1992). Tortoises in suchburrows would be in immediate harm’s way during road maintenance that involved recontouringroad shoulders, erosion ditches, and berms.Chapter 3 3-99
There are places, such as one lightly used road in the Copper Mountain Mesa area, where15 active tortoise burrows were found in the berms of a 1.5-mile long stretch of this road.However, this may be an exception. For example, only 1 occupied burrow of 202 found duringsign count surveys was recorded as occurring in the berm of a road.Lovich and Bainbridge (1999) reported that increased water availability from pavementrunoff and increased retention of moisture under the pavement are probably responsible for theobserved increase in plant vigor along roadsides. Vollmer et al. (1976) reported thatproductivity, diversity, and cover of <strong>Mojave</strong> <strong>Desert</strong> vegetation have been found to increase alongroadsides. One problem associated with these “greenbelts” is that tortoises may be attracted tothe vegetation and be crushed by normal use of the road, primarily, but also occasionally bymaintenance activities. Boarman et al. (1996) indicated that tortoises are probably attracted to theedges of highways because increased water from rain collects along the shoulder facilitatinggrowth of plants, some of which are species preferred by tortoises. Nicholson (1976) reportedthat tortoises might be attracted to roadsides, especially during a dry year, by the denservegetation growing there.Indirect Anthropogenic Mortality Factors: By their nature, indirect mortality factorsare more difficult to quantify, and are in effect extensions of direct mortality factors.Cattle and sheep grazing, cross-country OHV travel, blading rights-of-way for newconstruction, and agriculture (direct mortality factors) promote soil conditions that favor plantspecies that are not native to the desert, such as European weed species. Poor nutritionalqualities of weeds may result in physiological conditions that leave tortoises more susceptible todisease and drought. Jennings (1997) summarized impacts of exotic plants as follows: (a) exoticplants are spread by roads and along utility lines; (b) exotic plants may pose threats to deserttortoises by competitively reducing or excluding important native forage species, compromisingnutrition and health, and by contributing to the frequency and severity of fires in a region wherefire was previously rare; (c) annual exotic grasses, Schismus sp., may be relatively deficient inkey nutrients and may contain higher levels of metals than native plants.Avery (1998) has found, during experimental tortoise foraging studies, that sometortoises prefer Schismus, an exotic, to all other native and non-native species he provided.Avery (1998) further found that dietary nitrogen in exotic plants was assimilated at significantlylower rates; tortoises were physiologically more capable of utilizing native vegetation comparedto exotic vegetation; tortoises fed exotic plants lost body mass; and native vegetation was morenutritionally beneficial to desert tortoises than exotic vegetation [(see also Nagy et al. 1998, andHazard et al. 2001)]. Johnson and Belnap (1996) found that shifts in vegetation resulting inexotic dominated stands could alter soil biota compositions and create conditions unfavorable tonative plants.Not all studies have found that tortoises prefer non-native forage. Jennings (1992) foundthat tortoises he studied at the DTNA preferred native species. Avery et al. (1997, 1998) foundthat tortoises consumed some exotic annuals (i.e., Schismus barbatus and Erodium cicutarium)but did not prefer them. Krzysik (1994) concluded that tortoises forage on exotic annuals, butthe impact of these exotics on native ecosystems is unknown, and may remain unknown becauseChapter 3 3-100
aseline data are lacking. Grasses provide much lower quantities of protein than do forbs (Nagyet al 1998, Hazard et al. 2001), and may be relatively more abundant in habitats degraded bygrazing, fire, and other ground disturbances.These weeds in turn serve as fuel for wildfires. Lovich and Bainbridge (1999) reportedthat exotic annual plants, particularly red brome (Brooks 1998, Oldemeyer 1994), increase thefuel load and frequency of fire in desert communities, which are poorly adapted to fire. Redbrome, split grass, Russian thistle, and mustards (particularly in fallow agricultural fields)provide fuels that burn hotter and carry flames between shrubs, thereby promoting the spread offire and relatively more damage to native shrubs. (Brown & Minnich 1986; Brooks 1999.)Minnich (1994) reported that flames are carried by exotic species, notably Bromus rubens,Schismus barbatus, and Brassica tournefortii, which form a continuous, cured layer of flashyfuels; and that the greatest short-term impact of desert fires is the destruction of Larreatridentata (creosote bush).Ravens represent a direct impact to juvenile tortoise populations, but they are also anindirect impact (or symptom) of urbanization. Ravens are as common as they are because ofincreased opportunities provided by humans. Roads provide a ready source of raven food in thecarcasses of small mammals and reptiles that result from vehicle collisions; increased nestingopportunities are provided by human structures; water is readily available at pastures, farmlands,sewage ponds, and wildlife guzzlers. Yet, ravens are often identified as “natural” predators oftortoises. In fact, ravens are subsidized predators, possibly preying on tortoises and otheranimals to get them through the summer and winter when resources are less plentiful (Boarman1993).The denuded hillsides that result from OHV hill climbs are extremely susceptible toerosion (indirect mortality factor), particularly if mechanized vehicles continue to frequent thearea (a direct mortality factor). Both forage and shrub cover, which are critical to tortoisenutrition and denning, respectively, are adversely affected. In time, tortoises may abandon thearea or suffer ill side effects from poor nutrition (i.e., malnourished, suppressed immune systems,etc.) or reduced denning potential (i.e., resulting in more exposure to predators and additionalvehicle impacts).Indirect mortality factors may occur far into the future and are often unforeseen. Forexample, the direct impact of a water pipeline is immediately mitigated and compensated,tortoises are moved from harm’s way with appropriate take permits, and the project is effectivelycomplete, but the indirect effects are just beginning. Dozens of residents each year excavatetheir own ancillary pipeline trenches to connect into the main water line; these go unmonitoredand tortoise protection is relegated to whoever is digging the trench. Such projects are theinfrastructure that is intended to promote human population growth that will eventually eliminateanimals from those regions. Mechanically denuded rights-of-way are often used for vehicletravel and may provide new access to tortoise populations that were not previously accessible tonon-four-wheel drive vehicles. This was the case for extensive stretches of the Meade-Adelantotransmission line that was installed in 1995. Not only were 174 tortoises handled and 3accidentally killed (LaRue 1996), but the line passed through areas where no previous utilitieshad passed, thereby opening new access to many areas.Chapter 3 3-101
Noise: Krzysik (1994) stated: “…noise and vibrations associated with live-fire exercises[at Fort Irwin] are detrimental to wildlife populations,” but did not provide any data to supportthe conclusion. The Recovery <strong>Plan</strong> (USFWS 1994) listed the following potential impacts, againwithout any data to support the conclusions. Noise impacts may cause disruption ofcommunication and damage to the auditory system, which may affect an individual’s ability toeffectively communicate and respond in appropriate ways. In several places, the Recovery <strong>Plan</strong>referred to “noise pollution” or listed noise as one of the potential impacts, but provided nospecific data.In his threats analysis, Dr. Boarman (2002) reiterated the information given in theRecovery <strong>Plan</strong>, which is recited above, plus the following observations. A study conducted byBowles et al. (1999) showed very little behavioral or physiological effect on tortoises of loudnoises that simulated jet over flights and sonic booms. They also demonstrated that tortoisehearing is fairly sensitive (mean = 34 dB SPL) and was most sensitive to sounds between 125and 750 Hz, well within the range of the fundamental frequency of most of their vocalizations.The authors concluded that tortoises probably could tolerate occasional exposure to sonic boomlevel sounds (140 dB SPL), but some may suffer permanent hearing loss from repeated longtermexposure to loud sounds such as from OHV and construction blasts. Boarman (2002) alsoindicated noise or vibration might affect tortoises that live alongside railroads, but found therewere no studies to document the impact. He concluded, it is not known if train noise negativelyaffects the behavior, audition, or reproductive success of these tortoises.Habitat Recovery Rates: Lovich (1992) reported that recovery to pre-disturbance plantcover and biomass may take from 50-300 years while complete ecosystem recovery may requireover 3,000 years. Webb et al. (1983), citing Lathrop and Archbold (1980), predicted a recoverytime of a century for pipeline berms and trenches, pipeline road edges, and powerline pylons androad edges. They state that an estimate of recovery based on vegetative composition could be “atleast three times greater” than the estimate for biomass, again assuming that recovery follows alinear trend. These researchers were referring to natural rehabilitation of unused sites. There islittle or no opportunity for perennial plants to become re-established on road shoulders, erosionditches, etc. that are regularly maintained.3.3.2.5.2 Natural Mortality FactorsThis section addresses “natural” mortality factors, including predators, drought anddisease. The term “natural” does not, however, mean that these occur independently of man.Although some mortality factors may naturally occur, they are often exacerbated by humanactivities that have affected the natural balance that likely existed prior to man’s use of thedesert. Disease is discussed in this section, although its origin in wild tortoises (i.e. a naturaloccurrence) or pet populations (i.e. introduced by man) remains unknown. Natural predators ofpost-hatching tortoises include golden eagle, common raven, badger, coyote, kit fox (Berry 1990,Boarman 2002).Chapter 3 3-102
Canine Predators: This includes coyotes, kit foxes, and feral dogs, the latter of which isnot a “natural” predator 12 . In 1982, Luckenbach concluded coyotes were probably the majorpredator of adult desert tortoises. Turner et al. (1997) determined that most failed tortoise nestswere excavated by coyotes or kit foxes, but no data were presented (Boarman 2002). Turner andBerry (1985) reported that 76 of 159 (48%) tortoise nests at the Goffs Study plot in the East<strong>Mojave</strong> were lost to kit foxes and other predators. During his three-year study at the DTNA inthe early 1990's, Peterson (1994) concluded that coyote predation was the main mortality factorobserved. In 1998 and 1999, 47% and 12%, respectively, of nests studied at Twentynine PalmsMarine Corps Base were dug up, probably by kit foxes (Bjurlin and Bissonette 2001). Predationby kit foxes and coyotes on tortoises may increase during periods of drought, when their normalprey base of small mammals is no longer available (Peterson 1993, 1994; Karl 2002).Feral dogs also injure and kill desert tortoises, and are relatively more common adjacentto urban and rural communities than elsewhere. Domestic dog sign was found on 88% of thesites surveyed in urbanizing areas (LaRue, unpublished data) and on 75% of the transectssurveyed in Lancaster (Tierra Madre Consultants, Inc. 1991). Comparatively, dog sign wasobserved on only 6 of 1,572 (i.e.,
agricultural fields, were the most common concentration areas. Only three of 17 sewage pondsshowed consistent use by ravens.Based on Breeding Bird Surveys (Robbins 1986) conducted by the USFWS, BLM (1990)estimated that the number of ravens in the <strong>Mojave</strong> <strong>Desert</strong> had increased by 1,528% between1968 and 1988. Boarman (1992) felt that the increase was likely much higher in the <strong>West</strong><strong>Mojave</strong>. Knowles et al. (1989a, 1989b) surveyed 801 linear miles of roads, 12 landfills, and 11sewage ponds in the <strong>West</strong> <strong>Mojave</strong>, every two weeks throughout 1989. They found ravensconcentrated around landfills, sewage ponds, agricultural fields, and urbanized areas. Thehighest density areas (i.e., between 250 and 1,000 ravens/100 mi 2 ) included the Victor Valley,Lancaster-Palmdale area, and around Ridgecrest (reported in Chambers <strong>Group</strong>, Inc. 1990).Increased Raven Populations in Response to Human Resources: Boarman (1992)described ravens as “…predatory animals that survive and perhaps grow in part due to food,water, or other limiting resources provided by or associated with human activities. As a result oftheir association with humans, the populations are allowed to grow well beyond the naturalcarrying capacity of the habitat.” Raven populations have likely increased due to increasedavailability of foods (e.g., landfills, sewage ponds, dumpsters, highways, cities) and water (e.g.,sewage ponds, agricultural fields, golf courses), which sustain more individuals during times oflow natural resource availability, such as winter and summer. Such artificial food sources mayfacilitate larger clutch sizes or increased frequencies of clutches and greater fledging success. Inaddition, human-made structures have increased numbers and distribution of perches and nestsites (e.g., power and telephone poles, bridges, billboards, freeway overpasses, etc.). (Boarman1992, USFWS 1994b).Prevalence of Raven Predation in the <strong>West</strong> <strong>Mojave</strong> Compared to Elsewhere: Boarman(2002) reported that the extent of raven predation could be estimated by evaluating juveniletortoise carcasses found throughout the desert. He found that Campbell (1983) had reported 136shells along the perimeter fence at the DTNA, which he attributed to raven predation. Over afour-year period in the early to mid-1980s, Woodman and Juarez (1988) found 250 tortoisecarcasses beneath one raven nest near the Kramer Hills. Mean carapace length of the carcassesbecame progressively smaller over the four years (Woodman, pers. comm.), suggesting thatravens had removed most of the relatively larger animals, and were beginning to seek outsmaller, harder to find tortoises. Krzysik (1994) reported that raven predation accounted for 4.5%of the tortoise mortality observed at Fort Irwin. During 1988 and 1990 surveys of various FortIrwin expansion area alternatives, however, Chambers <strong>Group</strong>, Inc. observed no evidence ofraven predation.Between 1998 and 2002, of the 1,033 tortoise carcasses found throughout the WMP,cause of death was determined for 104 (10%) of them (WMP, unpublished data). Of these 104carcasses, raven predation (or scavenging) was identified for 10 (9%) of them. These results aresimilar to those collected during distance sampling in the Fremont-Kramer and Superior-CroneseDWMAs in 2001 and 2002: cause of death was determined for 44 of 764 (6%) carcasses, andraven predation (or scavenging) was identified for 7% (i.e., 3 of the 40 carcasses). Thus, twoindependent data sets from the same region and time period attributed raven predation (orscavenging) to 9% (13 out of 148) of the carcasses found where the cause of death was given.Chapter 3 3-104
The spatial distribution of 12 of 13 raven-predated carcasses (see Map 3-12) relative tohigher density areas reveals an interesting relationship. Of the 12 carcasses where coordinateinformation was available, 9 (75%) were within or immediately adjacent to tortoiseconcentration areas. It was reported previously that 43% of observed subadult tortoises areassociated with these tortoise concentrations, which occur in only 17% of the surveyed areas.This provides clear direction that raven management should be focused on these higherconcentration areas to maximize its effectiveness.Boarman and Hamilton (in prep.) found 266 shells under an unknown number of ravennests throughout the <strong>Mojave</strong>. Boarman (2002) points out that not all of these tortoises definitelydied from predation, as ravens are also scavengers and may have scavenged carcasses rather thankilled living animals (see discussion below). Between 1991 and 1997, the most shells found at asingle nest in one year were 28 (this occurred in the East <strong>Mojave</strong>). Berry (1990, as amended)reported that among juvenile and small immature carcasses found throughout the <strong>Mojave</strong> <strong>Desert</strong>,72% of the deaths were attributed to raven predation (Boarman 2002). Berry (1985) evaluated403 juvenile tortoise shells found on 27 desert tortoise study plots throughout the <strong>Mojave</strong> <strong>Desert</strong>,and determined that ravens killed about 35% (i.e., 141) of them.Observations of Raven Foraging: In the East <strong>Mojave</strong>, Camp et al., (1992) foundvertebrates comprised half of the total weight of raven food items, with mammals being the mostimportant taxa. Reptiles were unimportant in terms of biomass, but occurred in almost 76% ofall pellets, with iguanid lizards being most common. Invertebrates occurred in 90% of all pellets,and consisted primarily of ants and beetles. Human refuse occurred in almost a quarter of thepellets. (Boarman 2002).Sign count and distance-sampling data suggest that in the <strong>West</strong> <strong>Mojave</strong> tortoises may betwice as active in wetter years than in drier years. These findings may be significant relative toraven management. Presumably, ravens are more likely to predate subadult tortoises that areaboveground. There are no reported accounts of ravens entering burrows to remove tortoises.Given that subadult tortoises are more likely to be aboveground in wetter than drier years, it isplausible that raven predation may affect relatively more tortoises in wetter years.Chapter 3 3-105
Tortoise Carcass DistributionI n y o C oN17814K e r n C o3951558S a n B e r n a r d i n o C o401566138L o s A n g e l e s C o1824762LegendCounty LinesHighways<strong>Plan</strong> BoundaryMilitary LandsProposed DWMAsCarcasses Where Cause of Death Was DeterminedPredator (73)Crushed (43)Raven (13)Gunshot (10)Tank (3)Mine Shaft (2)R i v e r s i d e C o10/14/04<strong>West</strong> <strong>Mojave</strong> <strong>Plan</strong> <strong>FEIR</strong>/SMap 3-12Scale: 1 : 1,320,0000 10 20 30Km0 10 20 30Miles
Predation Versus Scavenging of Juvenile Tortoises: Ravens are both scavengers (i.e.,feeding on carcasses of animals they did not kill), and predators (i.e., killing and feeding onanimals).The Recovery <strong>Plan</strong> (USFWS 1994b) cited three types of evidence that ravens prey on,and not just scavenge, juvenile tortoises: (a) Ravens have been observed killing juveniletortoises; (b) Large numbers of juvenile carcasses show signs consistent with raven predation;and, (c) large numbers of juvenile carcasses are found in and at the base of raven nests, as well asnear perches. Boarman and Hamilton (in prep.) concluded ravens prey on tortoises throughoutthe <strong>Mojave</strong> <strong>Desert</strong>, but probably not all ravens nesting in tortoise habitat prey on tortoises.Available data suggest that ravens prey on tortoises that are 110 mm (about 4 inches) orless in length [Berry 1985, Boarman and Hamilton (in prep)]. The 136 carcasses Campbell(1983) found at the DTNA were between 36 and 103 mm. Farrell’s (1989) raven-predatedcarcasses in the East <strong>Mojave</strong> ranged in size from 42 to 110 mm. Intact, adult carcasses are rarelyreported beneath raven nests; finding parts of larger tortoises at raven nests probably signifiesscavenging rather than predation.Effects of Ravens on Regional Tortoise Populations: Although the above anecdotalevidence and focused studies have found that ravens do predate (and scavenge) tortoises, andthat predation may be locally common, the relative impact of ravens on regional tortoisepopulations remains unknown. There are no data available to accurately determine tortoisepopulation levels, so there is no ready means of determining what percent of the population isaffected. Available data indicate that about 9% of the tortoise carcasses found where cause ofdeath could be determined were attributed to raven predation.Available information suggests that ravens are opportunistic predators of small tortoises,and that some individuals or pairs of birds are likely to be responsible, rather than the entireraven population. It is apparent for many predators that they seek out prey items that arerelatively abundant, and that they will switch from one prey species to another if preferred preypopulations diminish. This is suggested by the observations of Woodman and Juarez. In theircase, the first carcasses found beneath the nest were relatively larger than the smaller carcassessubsequently found. A plausible explanation is that the pair of ravens selected relatively larger,more easily found carcasses until they were depleted. Then, gradually, they adjusted their searchimage to find smaller tortoises, which are presumably more difficult to locate.If this scenario proves to be true, raven predation would most likely occur where subadulttortoises are abundant, which coincides with the higher density areas, according to sign countdata. However, the relative impact of ravens may be more significant in depleted tortoisepopulations, where every subadult is relatively more important to the future survival of that localor regional population.Dr. Boarman, probably the foremost expert on raven predation in this population,concluded, “In the sense of hard science, these observations [of raven predation] do not consistof proof that ravens are causing significant harm to tortoise populations, but they do support thehypothesis” (Boarman 1992). In their synopsis, National Ecology Research Center (1990)Chapter 3 3-107
concluded, “Conflicting evidence and incomplete data sets make analysis of raven-tortoiseinteractions a difficult task. We cannot determine the effect of ravens on tortoise populationsthroughout the <strong>Mojave</strong> <strong>Desert</strong>. However, it appears that ravens may decrease juvenile tortoisenumbers in localized areas.” BLM (1990) concluded, “At this point the contribution of avianpredation to tortoise population mortality remains unknown… Whether they [common ravens]can significantly depress a tortoise population is open to question.”Efficacy of Raven Management Previously Applied: BLM implemented the first focusedraven reduction program in 1989, using firearms and poison to eradicate ravens at two sites inthe <strong>West</strong> <strong>Mojave</strong> (Rado 1990). In 1989, between 106 and 120 ravens were poisoning withStarlicide-treated baits at the 29 Palms Marine Corps Base landfill (Rado 1990). Radoconcluded that the BLM’s raven control program had substantially reduced the number of ravensat both the base landfill and at the DTNA. However, there have been no follow-up studies to seewhat current raven populations are in these two places, so long-term effects of the reduction areunknown.Boarman (1992) has reported that covering refuse with at least 6 inches of soil, thereplacement of open landfills with enclosed transfer stations, and other measures would result inless available food, and may lead to reduced raven numbers. He felt that the most effectivecontrol for long-term raven management must address anthropogenic food sources and requirelow maintenance (Boarman 1992).Drought: Boarman (2002) concluded that drought might cause episodic tortoisemortality that is punctuated by periods of low mortality during years with more abundantrainfall). He speculated that drought-induced stress in concert with other threats (e.g., disease,predation) might have resulted in significant mortality (Peterson 1994a).One obvious effect of drought is the lack of available water for tortoises and other desertadaptedwildlife. Boarman (2002, pers. comm. from Dr. Kenneth Nagy) reported that tortoisescan probably survive one to two years without drinking water but will start dying of dehydrationafter that. In very dry years, there is no production of annual plant species, which provide asubstantial portion of a tortoise’s annual intake of water. In somewhat wetter years, annualproduction may be restricted to a few species, or there may be only a few individual plants of awide array of species that germinate. The nutritional quality of these species becomes relativelymore important when they are in limited supply and comprise a tortoise’s entire dietary intakefor a given season. Boarman (2002) reports that Turner et al. (1984) and Avery (1998) foundthat tortoises might survive drought periods by eating less nutritious cacti and shrubs.<strong>Desert</strong> Washes and Drought: The 261 tortoises observed during sign count surveyswere observed in only six different plant communites. Tortoise occurrence within each of the sixcommunities and the percent of the planning area occupied by each community (WMP 1996vegetation map) are given in Table 3-20 (listed in descending order of tortoise occurrence):Chapter 3 3-108
Table 3-20Prevalence of Tortoises in the Six <strong>Plan</strong>t Communities Where ObservedPLANT COMMUNITY% PLANNING AREAOCCUPIED BY PLANTCOMMUNITYNO. SIGN COUNTTORTOISESOBSERVED 1998-2002% TORTOISESDIVIDED BY% COMMUNITY<strong>Mojave</strong> Creosote Bush Scrub 63% 242 (92.7%) 1.5<strong>Desert</strong> Saltbush Scrub 9% 14 (5.4%) 0.6<strong>Mojave</strong> <strong>Desert</strong> Wash Scrub 0.3% 2 (0.7%) 2.3<strong>Mojave</strong> Mixed Woody Scrub 11% 1 (0.4%) 0.4Shadscale Scrub 0.5% 1 (0.4%) 0.8Stabilized, Partially Stabilized Sand0.3% 1 (0.4%) 1.3DunesTotal 84.1% 261 (100%) N/AThe data indicate that 261 observed tortoises occurred in six plant communities, whichcover about 84% of the planning area. About 98% of the tortoises (256 of 261) occurred increosote bush and saltbush scrub, which encompass 72% of the area. The key observation (andreason these data are given in this section) is that two tortoises were observed in <strong>Mojave</strong> <strong>Desert</strong>Wash Scrub, which occupies only 0.7% of the planning area. One can see in the fourth column,where the percent of tortoises is divided by the percent occurrence of each plant community, thatthe highest ratio (2.3) was observed in <strong>Mojave</strong> <strong>Desert</strong> Wash Scrub. This may suggest thattortoise occurrence in wash scrub is relatively more common when one considers how little ofthe planning area is occupied by this plant community.There may be compounding circumstances, or synergistic effects, between the impacts ofdrought and the use of desert washes by both tortoises and recreational users. In relatively dryyears it is common to see a wide swath of green shrubbery growing along washes in an otherwisegray-brown landscape. A creosote bush growing alongside a wash may be bright green andtwice the size of all the creosote bushes within 100 feet of the wash. There are times when theonly place where annual germination occurs is along the margins of washes (LaRue, pers. obs;Dave Morafka, pers. comm.). Tortoises have been documented to use washes as travel corridorsseeking what appeared to be preferred, native forage (Jennings 1997). Wash resources supportboth sensitive bird and bat species. Water is nearest to the surface where washes and dry lakesoccur. As a drought progresses, the last places remaining green in the absence of supplementalrainwater are along washes.Recent evidence suggests tortoises may concentrate along washes in time of drought. Forexample, in the southeastern California desert, near Blythe, all tortoises found during one surveywere restricted to several large tributaries along McCoy Wash and adjacent upland areas out toseveral hundred feet (Circle Mountain Biological Consultants 2000). Importantly, much of thesite was below 600 feet elevation, which is about 400 feet below the “typical” 1,000 feet lowerelevation threshold observed in many places for tortoises. Circle Mountain concluded that thewash, with its thick palo verde growth, provided sufficient resources for several animals to livein an otherwise inhospitable environment.Chapter 3 3-109
In October 2002, on a 100-acre site in eastern Twentynine Palms, four of five tortoises(including a hatchling and one-year old tortoise) were found in relatively thick growth of biggalleta (a perennial grass) alongside two intermittent streams (Circle Mountain BiologicalConsultants, 2002.). Scat and burrows were found throughout the site, but four of five tortoiseswere clearly associated with washes. More recently (November 2002) during a training exerciselocated west of California City and east of Highway 14, 11 tortoises were observed, 10 of whichwere located within or immediately adjacent to Cache Creek (LaRue, pers. obs).Based on the above observations, it is plausible that tortoises may concentrate aroundwashes during drought conditions, which would put them at heightened risk if vehicles wereconcurrently using the washes. In extreme conditions, presumably even the wash-adapted plantswill become dry. Given the relative denseness of the plant growth along washes, this may putthem at some heightened risk for vehicle-caused fires. Certainly, there is no way to avoiddrought, however restricting vehicle travel in washes may be the only mechanism available tominimize drought-related vehicle impacts to tortoises that are relying on washes for sustenanceand cover.Disease: Boarman (2002) provided the following summary on tortoise diseases (see hisliterature cited section for full references). Diseases can weaken individuals, reduce reproductiveoutput, and cause mortality. Epidemic outbreaks of some diseases can become catastrophic,particularly in small or declining populations (Dobson and Meagher 1996, Biggins et al. 1997,Daszek et al. 2000). Upper Respiratory Tract Disease (URTD; Jacobson et al. 1991) andcutaneous dyskeratosis affecting the shell (Jacobson et al. 1994) are the two diseases most oftenimplicated in tortoise declines. A third disease, a herpesvirus, was recently identified and mayhave population-level consequences, but very little is known about its relative mortality oninfected tortoises (Berry et al. 2002, Origgi et al. 2002).URTD has been found in several populations that have experienced high mortality rates,including some in the <strong>West</strong> <strong>Mojave</strong> (Jacobson et al. 1996, Berry 1997). Brown et al. (1994a)showed definitively that URTD could be caused by the bacterium, Mycoplasma agassizii. Asecond species, to be named “Mycoplasma cheloniae,” was found in 2001 in tortoises in northernLucerne Valley and at the DTNA (Kristin Berry, pers. comm.).URTD, also referred to as “mycoplasmosis,” is likely transmitted by contact with adiseased individual or through aerosols infected with M. agassizii or M. cheloniae. Theorganism attacks the upper respiratory tract causing lesions in the nasal cavity, excessive nasaldischarge, swollen eyelids, sunken eyes, and in its advanced stage, lethargy and probably death(Jacobson et al. 1991, Schumacher et al. 1997, Homer et al. 1998, Berry and Christopher 2001).It must be noted, however, that some of these clinical signs may also be characteristic of otherhealth conditions such as dehydration, allergy, or infection with herpesvirus or the bacteriaChlamydia or Pasteurella (e.g., Pettan-Brewer et al. 1996, Schumacher et al. 1997).Malnutrition is known to result in immunosuppression in humans and turtles (Borysenkoand Lewis 1979) and is associated with many disease breakouts. It is possible that nutritionaldeficiency in tortoises caused by human-mediated habitat change and degradation may be partlyresponsible for the apparent spread of URTD and its perceived impact on tortoise populationsChapter 3 3-110
(Jacobson et al. 1991, Brown et al. 1994a). Short-term droughts may temporarily reduceimmune reactions and increase susceptibility to URTD (Jacobson et al. 1991), although this isspeculative. Whereas animals may become debilitated by chronic immune stimulation, nobiochemical indicators of stress have been identified in diseased compared to non-diseasedturtles (Borysenko 1975, Grumbles 1993, Christopher et al 1993, 1997).Although evidence indicates a correlation between high rates of mortality and incidenceof URTD within populations (Berry 1997), there is little direct evidence that URTD is the causeof the high rates of loss. In two preliminary analyses (Avery and Berry 1993, Weinstein 1993),animals exhibiting clinical signs of or testing positively for URTD were no more likely to dieover a one year period in the western <strong>Mojave</strong> <strong>Desert</strong> than were those not exhibiting signs ortesting positive. This may be because factors other than disease caused much of the mortality ormany animals not showing clinical signs of disease in the field were still infected.A shell disease, cutaneous dyskeratosis (CD), has been identified in desert tortoisepopulations (Jacobson et al. 1994). CD consists of lesions along scute sutures of the plastron andto a lesser extent on the carapace. Over time, the lesions spread out onto the scutes. This diseasemay be caused by the toxic effect of chemicals in the environment, but evidence is lacking to testthis hypothesis. Naturally occurring or human-introduced toxins such as selenium, chlorinatedhydrocarbons, organophosphates, nitrogenous compounds, and alkaloids have all beenimplicated (Homer et al. 1998), but there are no data showing a direct link. The disease may alsobe caused by a nutritional deficiency (Jacobson et al. 1994). It is not known whether or not CDis caused by an infectious pathogen or if secondary pathogens act to enhance the lesions (Homeret al. 1998, Homer pers. comm.). It is unclear if the disease is actually lethal or responsible fordeclines in infected tortoise populations (Homer et al. 1998).If the shell diseases are toxicoses, toxic responses to environmental toxins (e.g., heavymetals, chlorinated hydrocarbons, organophosphates, and selenium), then there may be a directlink between these diseases and human activities unless the toxin is a natural component of thephysical environment. Chaffee et al. (1999) found no significant correlation between elevatedlevels of metals in organs of ill tortoises and in the soil where the tortoises came from.There is some recent, albeit weak, preliminary evidence linking heavy metals to diseasein tortoises. In necropsies of 31 mostly ill tortoises, Homer et al. (1994, 1996) found elevatedlevels of potentially toxic metals and minerals in the liver or kidney of one or more of theanimals. Since most of the animals were ill to begin with, an association was made between thepresence of the toxicants and presence of the disease. However, that study is strictly correlative,and fails to demonstrate a cause and effect relationship. Berry (1997) claims, “the salvagedtortoises with cutaneous dyskeratosis had elevated concentrations of toxicants in the liver,kidney, or plasma...and/or nutritional deficiencies.” Homer (pers. comm.) has foundsignificantly reduced levels of calcium in the livers of tortoises with CD, which suggests anutritional deficiency may be involved in the disease.Several other diseases and infections have been identified in desert tortoises (Homer et al.1998). These include a poorly known shell necrosis, which can result in sloughing of entirescutes; bacterial and fungal infections; and urolithiasis, a solid ball-like deposition of urateChapter 3 3-111
crystals in the bladder (i.e., bladder stones; Homer et al. 1998). There is no evidence to suggestthat any of these diseases are at this time widespread, threatening population stability, orhindering population recovery.During sign count surveys in the fall and winter of 1998 through 2002, disease symptomswere observed in 7 of the 275 (2.5%) tortoises inspected. During distance sampling surveys inthe spring of 2001 and 2002 in the Fremont-Kramer and Superior-Cronese DWMAs, 6 of the 216(2.8%) tortoises inspected showed clinical evidence of disease. These very similar,independently derived results (i.e., 2.5% versus 2.8% of the tortoises observed) are summarizedin Appendix L.Evidence of URTD and possible cutaneous dyskeratosis was recorded for 13 adulttortoises. Clinical symptoms were not observed on any of the 69 subadult tortoises encountered(i.e., although the number in burrows that could not be observed has not been determined). Onecan see that all 13 of the tortoises were adults. Nine exhibited suspected signs of URTD, andfour were identified as having cutaneous dyskeratosis (see footnote). Eight males (89%) and onefemale (11%) had URTD-like symptoms, and one male (25%) and three females (75%) appearedto have cutaneous dyskeratosis.The spatial distribution for 12 of these 13 tortoises reveals that they were not clustered inany given region. Two were found south of Highway 58 in the Fremont-Kramer DWMA; fourin the Superior-Cronese DWMA; two in the Ord-Rodman DWMA; and four outside DWMAs.Seven were inside or within a mile of higher tortoise concentration areas, and five were in lowerconcentration areas 13 .Six of the 12 tortoises (50%) observed with disease-like symptoms were inside oradjacent to newer tortoise die-off regions discussed below. Two of these six tortoises areproximate to recent die-off regions in the Fremont-Kramer DWMA south of Highway 58 (i.e.,two with cutaneous dyskeratosis), and the other four (i.e., all with URTD-like symptoms) areproximate to newer die-off areas throughout the Superior-Cronese DWMAs.13 Sample sizes are too small to conclude how prevalent disease may be in the population. Nor are diseasesymptoms easily observed on all tortoises encountered, although the timing of surveys facilitates observations forclinical signs. Thus, 156 (72%) of the 216 tortoises encountered in the spring during distance sampling could beobserved, compared to only 90 (33%) of 275 animals observed during sign count surveys in the summer-fall. Themain difference appears to be the prevalence of tortoises in burrows that could not be observed in the summer-fall,compared to above-ground animals found during the spring, which were more readily observed. Even in the spring,60 animals could not be clearly observed, likely because they withdrew into their shells before the surveyor couldget a good look at them.Dr. Francesco Origgi (pers. comm., Nov 2002) has found that herpesvirus lesions in tortoises may only bevisible for about a 72-hour period, after which time the lesions disappear. Origgi’s work has shown that the animalmay be infected with no obvious clinical signs. This is also true for both clinical signs and laboratory assays (i.e.,ELISA tests) of URTD-infected tortoises. Tortoises that have clinical signs or test positive for exposure tomycoplasma on one occasion are asymptomatic and test negative on subsequent occasions. Therefore, it would bemisleading to draw conclusions about the prevalence or distribution of disease in the <strong>West</strong> <strong>Mojave</strong> population basedsolely on these dataChapter 3 3-112
3.3.2.5.3 Older and Newer Die-off RegionsA total of 1,033 carcasses were found during the 1998-2002 sign count surveys. Adetailed carcass observation analysis is presented in Appendix L. In the following discussion,carcasses are described relative to how recently the tortoises died: “older” refers to tortoisesdying more than four years prior to being found; “newer” refers to those dying within four yearsof being found 14 . Similarly, “older die-off regions” are comprised of older carcasses, and “newerdie-off regions” consist of newer carcasses, although there is some overlap, as described.With three exceptions, all older die-off regions occur in the Fremont-Kramer DWMA.All older die-off regions, including the three in the Superior-Cronese, are located north ofHighway 58 (Map 3-13). Newer regions are scattered throughout the older ones. Highway 58bisects two substantially larger new areas. In the Superior-Cronese DWMA, there are threesmall older regions, but most carcasses and regions are of recent origin. Three broadly spacednewer regions occur within and adjacent to the Ord-Rodman DWMA. None was observed in thePinto Mountain DWMA, which is not further discussed.Fremont-Kramer DWMA: The seven die-off regions within the Fremont-Kramer arecharacterized in Table 3-21. Regions and subregions are identified alpha-numerically in thesubsequent tables and throughout the text, and are displayed on Map 3-13.14 Both sign count and distance sampling data are included in subsections describing locations of 12 symptomaticanimals and 142 carcasses where the cause of death was given. As in other places, summaries include only squaremiles surveyed (i.e., number of transects), not the sizes of polygons. For example, there are 63 mi 2 within theDTNA die-off region (i.e., Region FK1 on Map 3-13), but only 50 mi 2 were surveyed. So, all data and subsequentdiscussion are relative to the 50 mi 2 , not 63 mi 2 .Chapter 3 3-113
Tortoise Die-off Regions17814FK1395FK2SC558FK3FK4SC1FK5SC2SC3SC4SC6SC7SC815FK6FK7OR140OR215138LegendCounty LinesHighways<strong>Plan</strong> BoundaryMilitary LandsProposed DWMAsNewer (4 years) Die-off Regions18OR324710/14/04N<strong>West</strong> <strong>Mojave</strong> <strong>Plan</strong> <strong>FEIR</strong>/SMap 3-13Scale: 1 : 980,0000 10 20 30Km0 10 20 30Miles
Table 3-21Characteristics of Older and Newer Die-Off RegionsIn the Fremont-Kramer DWMAREGIONAGE OF NO. MI 2 NO. RANGE AVERAGENO. & NAME DIE-OFFCARCASSESOLDER REGIONS NORTH OF HIGHWAY 58FK1. DTNAOlder 50 72 1 to 5 2.7Newer 13 30 1 to 5 1.8Subtotal63 1022.0FK2. Cuddeback Lake Older 36 53 1 to 4 2.2Newer 5 11 1 to 4 1.8Subtotal41 641.9FK3. California CityOlder 22 21 1 to 3 1.4Newer 5 5 1 to 2 1.3Subtotal27 261.4FK4. NE Kramer Jct. Older 15 24 1 to 4 1.4Newer 6 7 1 to 2 2.2Subtotal21 311.9TOTALSOlderNewer4 Areas123 (81%)29 (19%)152 mi 2 170 (76%)53 (24%)2231 to 3/1 to 51 to 2/1 to 51 to 2/1 to 51.82.11.9NEWER REGION BISECTED BY AND SOUTH OF HIGHWAY 58FK5. N of HWY 58 bisect Newer 32 37 1 to 4 1.7FK6. S of HWY 58 bisect Newer 19 26 1 to 5 1.4FK7. Edwards Bowl Newer 4 4 1 1.0TOTALSNewerOlder3 Areas45 mi 20 (0%)45 (100%)670 (0%)67 (100%)1/1 to 5N/A1 to 5Observations: Older regions north of Highway 58 comprised 123 mi 2 (81%) of the 152mi 2 die-off region, with 29 mi 2 (21%) of newer die-offs interspersed. Of the 223 carcasses found,170 (76%) were older and 53 (24%) were newer, with at least one and up to five carcasses foundon each square mile surveyed. There were also two newer regions in the Fremont-Kramer,which are bisected by Highway 58 (Region FK5 and Region FK6 on Map 3-13). Region FK7 is4 mi 2 and found near “Edwards Bowl.” Only 1 tortoise/mi 2 was observed, so this is more likelyan artifact of the survey as opposed to a regional die-off. The two bisected regions included 32mi 2 in Region FK5 and 19 mi 2 in Region FK6. There were 37 fresher carcasses north of thehighway and 26 to the south; given the similar region sizes, the average number of carcasses pertransect was similar (i.e, 1.7/mi 2 to the north and 1.4/mi 2 to the south). Like the older regions tothe north, there were between 1 and 5 carcasses found per transect. Unlike the older regions, 54of 67 carcasses (81%) found in these two areas were estimated to have died within four years ofbeing found.Given the above observations, areas north of Highway 58, excluding Region FK5, arepredominantly (81%) older die-off regions. Region FK5 and south of Highway 58 are (100%)newer die-off regions.1.4N/A1.5Chapter 3 3-115
BLM Study Plots: Five of Dr. Berry’s permanent study plots are found in the Fremont-Kramer DWMA, north of Highway 58. The three plots at the DTNA and one in Fremont Valleyare within or adjacent to Region FK1 (see Map 3-13). The Fremont Peak study plot is in thevicinity of Region FK2. Declines included 93% at Fremont Peak, 91% at DTNA Interior, 84% atDTNA Exterior Interpretive Center, 74% at DTNA Interior Interpretive Center, and 72% atFremont Valley.These data support Dr. Berry’s conclusions that the precipitous declines observed on thefive square miles encompassing these study plots occurred throughout the northern andnorthwestern portions of the Fremont-Kramer DWMA. Two older die-off regions (i.e., RegionsFK3 and FK4) are about seven miles southwest and eight miles south, respectively, of theFremont Peak study plot. As such, Dr. Berry’s documented die-offs in the DTNA, FremontValley, and Fremont Peak identified a smaller region, within a substantially larger one, wheretortoises died between the mid-1980’s and present day.Distribution of Symptomatic Tortoises: Four of the 12 (33%) tortoises with diseasesymptoms were found in or in the vicinity of the Fremont-Kramer DWMA (Map 3-13). The twoidentified with cutaneous dyskeratosis were within and immediately adjacent to Region FK6, thenewer die-off region south of Highway 58. One with URTD-like symptoms was found threemiles northwest of Region FK7; the other was two miles southwest of Region FK3. Three of thefour were within higher concentration areas; the fourth was three miles southwest of the onlyhigher density area west of Highway 395.Superior-Cronese DWMA: Given Dr. Berry’s work and other observations, the die-offin the northern and northwestern Fremont-Kramer DWMA was already suspected, although theaffected area is larger than expected. The die-offs in the Superior-Cronese have been suspectedsince 1998, when sign count data were first collected; however, this is the first documentation ofthe spatial distribution of these die-offs.The recent die-off regions described herein in the Superior-Cronese are alarming newevidence that the entire population within this 980 mi 2 DWMA may be in jeopardy of becomingextinct (i.e., disappearing) within the next 20 years (see discussion below).The eight die-off regions within the Superior-Cronese are characterized in Table 3-22(see also Map 3-13).Chapter 3 3-116
Table 3-22Characteristics of Older and Newer Die-Off Regions in theSuperior-Cronese DWMAREGION NO. & AGE OF NO. MI 2 NO. RANGENAMEDIE-OFFCARCASSESAVERAGE(Carc/mi 2 )SC1. N of Harper Newer 27 29 1 to 4 1.1SC2. Coolgardie Mesa Newer 22 24 1 to 4 1.1SC3. Hinkley Newer 11 13 1 to 3 1.2SC4. N of Barstow Newer 10 13 1 to 2 1.3Subtotal 4 Newer 70 79 1 to 4 1.2SC5. E Superior Valley/ Newer 23 35 1 to 4 1.5Goldstone Older 5 8 1 to 3 1.6Subtotal 1 Older/1 Newer 28 43 1 to 4 1.6SC6. Coyote Corner/Newer 56 99 1 to 8 1.8Paradise Valley Older 7 26 1 to 8 3.7SC7. Alvord Slope Newer 16 27 1 to 5 1.7SC8. Cronese Lakes Older 6 8 1 to 3 1.3TOTALSOlderNewer18 (10%)165 (90%)42 (15%)240 (85%)1 to 81 to 8Observations: The three older die-off subregions were all relatively small (i.e., between 5mi 2 and 7 mi 2 ), encompassed 18 mi 2 , where 42 (15% of 282) carcasses found had died more thanfour years ago 15 . The seven older die-off subregions were all relatively large (i.e., between 10mi 2 and 56 mi 2 ), encompassed 165 mi 2 , where 240 (85% of 282) tortoises had died within fouryears of being found. As such, both older and newer die-off regions encompassed about 19%(183 mi 2 of 980 mi 2 ) of the Superior-Cronese DWMA. Whereas 19% may seem like aninsignificant amount of land for this large, 980 mi 2 area, the spatial distribution (Map 3-13) wasthroughout the DWMA north of Highway 58, and all higher density live tortoise areas wereproximate.Only 18 mi 2 (10%) of the Superior-Cronese were indicative of older die-off regions. Allcarcasses in the remaining 165 mi 2 (90%) had died within four years of being found. Region SC8was the only older region not associated with a more recent die-off. The other two older regions(i.e., SC5 and SC6) were encompassed within predominantly recent die-off areas. Unlike theFremont-Kramer, which is characterized as an older die-off region (170 of 223 carcasses, or76%), the Superior-Cronese is a region of predominantly newer die-offs (i.e., 240 of 282carcasses, or 85%), where most observed tortoises had died since about 1990.BLM Study Plots: None of the nine permanent study plots is within the Superior-CroneseDWMA (i.e. six are within the Fremont-Kramer and three are within or adjacent to the Ord-Rodman DWMA). Had plots been established in the Superior-Cronese, there may have been anopportunity to detect these recent die-offs earlier, as Dr. Berry had done in the Fremont-KramerDWMA. Establishing study plots in remaining portions of higher density tortoise areas may beprudent to detect die-offs as they occur, rather than after the fact.15Time since death is only a relative indicator. Taken literally, it would mean that the tortoises died between 1994and 1997, relative to the survey dates of 1998 and 2001. It is a safer assumption that these tortoises died sometimeafter 1990.Chapter 3 3-1172.21.4
Distribution of Symptomatic Tortoises: Four of the 12 (33%) tortoises with diseasesymptoms were found in the Superior-Cronese DWMA (Map 3-13). One was southeast ofCuddeback Lake, two were found in the Mud Hills area, and one was found in the northeastcorner of Coolgardie Mesa. All four were within several miles of recent die-off regions. Threeof the four were inside or within one mile of higher density tortoise areas.Ord-Rodman DWMA: Although three newer die-off subregions are described in thissection as being in the Ord-Rodman DWMA, only Region OR1 (5 mi 2 ) was actually foundwithin the DWMA (Map 3-13). Region OR2 (7 mi 2 ) was found north of Interstate 40 and east ofTroy Dry Lake, and OR3 (15mi 2 ) was found in the western part of the Johnson Valley OpenArea. Pertinent data are summarized in Table 3-23.Table 3-23Characteristics of Older and Newer Die-Off Regions in the Ord-Rodman DWMAREGION NO. &NAMEAGE OFDIE-OFFNO. MI 2 NO.CARCASSESRANGE AVERAGE(Carc/mi 2 )OR1. Newer 5 9 1 to 3 1.8OR2. Newer 7 4 1 0.6OR3. Newer 18 15 1 to 2 0.8TOTALS 30 28 1 to 3 1.1Observations: The three newer die-off subregions were between 5 mi 2 and 18mi 2 ,encompassing a total of 30 mi 2 . Only 28 newer carcasses were found, with about half of these(i.e., 15 of 28, or 54%) located in the Johnson Valley Open Area. Region OR1 is the mostsignificant, as it may indicate that ill tortoises have passed through the “corridor” from north tosouth (see “corridor” on Map 3-13). If this 5 mi 2 die-off area represents a contact zone forURTD or some other disease spread, it may have the potential to threaten tortoise populations onthe north-facing bajada between Dagget Ridge/Newberry Mountain and Interstate 40, where 19mi 2 of higher sign counts were found between 1998 and 2002.BLM Study Plots: There are three permanent study plots within and adjacent to the Ord-Rodman DMWA; the Stoddard Valley plot in the northwestern part of the DWMA and LucerneValley plot to the south; the Johnson Valley plot is found in the open area, to the east of theDWMA. Both the Stoddard Valley and Lucerne Valley plots are within higher density tortoiseareas. Interestingly, there was only a 5% decline on the Stoddard Valley plot (i.e., from 86 to 81tortoises/mi 2 between 1981 and 1991) and a 30% decline on the Lucerne Valley plot (i.e., 93 to65 tortoises/mi 2 between 1980 and 1994). For comparison, there was a 77% decline (i.e., 69 to16 tortoises/mi2 between 1980 and 1994), which is not associated with a higher concentrationarea. These findings further support Dr. Berry’s findings that tortoise trends on the individualthree square miles appear to represent tortoise trends for the three regions where the plots werelocated.Distribution of Symptomatic Tortoises: Four of the 12 (33%) tortoises with diseasesymptoms were found within or adjacent to the Ord-Rodman DWMA (Map 3-13). Two of thesewere within the DWMA, including one of the three observed with suspected evidence ofcutaneous dyskeratosis. One URTD-symptomatic tortoise was observed in the eastern portionsChapter 3 3-118
of the Johnson Valley Open Area, and the fourth animal was observed about seven miles southof the open area. Two were within higher sign count areas, and the other two were within two tothree linear miles. None was within recent die-off areas; the closest was in the southern portionof the Ord-Rodman DWMA, approximately three miles northwest of the nearest die-off region.Summary of All Carcass Observations: Table L-11 (see Appendix L) summarizes thecumulative findings listed above. Region-wide, there were of 420 mi 2 of die-offs, including 279mi 2 (66%) of newer die-offs and 141 mi 2 (34%) of older die-offs; given the overlap of 29 mi 2 ,there were a total of 391 mi 2 affected by both newer and older die-offs. This indicates that about3.5% of the 2002 tortoise range (391 of 11,134 mi 2 ), or 11.6% of the surveyed area (391 of 3,362mi 2 ), were within older and newer die-off regions.A total of 600 carcasses were found within the die-off regions (59% of the 1,011carcasseswhere coordinate information was available), including 388 (65%) newer carcasses and 212(35%) older carcasses. This is a significant finding, indicating that tortoises are continuing to diethroughout the planning area, particularly in the Superior-Cronese DWMA, probably since about1990. Newer die-off regions were characterized by 317 (85%) newer carcasses and 54 (15%)older carcasses; older die-off regions were characterized by 158 (69%) older carcasses and 71(31%) newer carcasses. These latter findings suggest that tortoises continue to die in older dieoffregions, even though older carcasses were twice as likely to be found as newer ones.3.3.2.6 Tortoises and Off Highway VehiclesOne of the most controversial resource management issues within the western <strong>Mojave</strong><strong>Desert</strong> concerns the relationship between desert tortoises and off-highway motorized vehicles.This discussion will address both casual OHV use and competitive events and the effects thatboth may, or may not, have on tortoises and habitat.3.3.2.6.1 Dispersed Casual OHV UseOff highway vehicles users visit the desert for many purposes. They explore the desert,hunt, and drive to campsites and trailheads for hiking or horseback riding, rockhounding andother activities. Commercial uses are also common, for mineral exploration, maintenance ofexisting facilities, and administrative or law enforcement purposes. This use occurs in a moredispersed manner than, for example, concentrated competitive events, and results in a lowdensitybut continuing presence of vehicles throughout the desert. The following discussionaddresses effects that have occurred as a consequence of such dispersed, casual use of theplanning area by off highway vehicles.Boarman (2002) conducted a literature review of 56 references that addressed OHVbasedimpacts on desert tortoises. His conclusion follows:Although each study comparing tortoise densities inside and outside of [OHV] areas haslimitations, they all lend evidence to reductions in tortoise population densities in heavy [OHV]use areas. The causes for these declines are less certain. Tortoises and their burrows are crushedby [OHVs], although it is difficult to evaluate the full impact this activity currently has on tortoiseChapter 3 3-119
populations, partly because there are probably relatively few tortoises in most open use areas.[OHVs] damage and destroy vegetation. Density, cover, and biomass are all reduced inside versusoutside of [OHV] use areas, particularly following multiple passes by vehicles. Split grass(Schismus barbatus), a weedy introduced grass, in particular appears to benefit from [OHV]activity. Very light, basically non-repeated, vehicle use probably has relatively little long-termimpact. Soil becomes compacted by vehicles. The compaction increases with moisture content ofthe soil, weight of vehicle (particularly high weight to tire surface area ratio), and soil type.Cohesionless sand, such as in sand dunes and washes, [is] largely immune to compaction whilemoist soils are much more susceptible than dry ones. Compaction, lower infiltration rates, loss ofplants and cryptogamic soils all contribute to increased wind and water erosion and fugitive dust,particularly when such areas are several meters in width. More research is needed to understandthe effect light [OHV] use has on tortoise populations and habitat.Boarman (2002) reported that tortoise densities have been reduced through (a) directeffects, including crushing of tortoises and burrows, and (b) indirect effects of (i) compaction ofsoil, (ii) destruction of cryptogamic soils, (iii) changes in vegetation, (iv) erosion and loss of soil,(v) light OHV use, and (vi) human access to tortoise habitat.The USFWS (2002) indicated that the degree of threat posed to desert tortoises byrecreation increases with the speed, weight, and numbers of recreational units involved. Theyindicated, for example, that a small group of hikers posed much less threat to the desert tortoiseand its habitat than a race that involved numerous all-terrain vehicles.Positive Benefits of Motorized Vehicle Routes: Haskell (2000) reported that roadsprovided benefits to society such as opportunities for recreation and natural resource extraction.The USFWS (2002) felt that recreational use of the desert might benefit the desert tortoise in anindirect manner. They concluded that many people viewed the California desert as a uniqueplace to enjoy nature and solitude, and that the enjoyment of the desert could promote privatecitizens to assist in volunteer projects to restore habitats, clean up trash, report problems to theBLM, and educate other users. The BLM’s existing educational programs were identified asstriving for these goals (USFWS 2002).3.3.2.6.2 Direct Impacts of OHVs on <strong>Desert</strong> Tortoise PopulationsAs of 1980, the USFWS (2002) reported that OHV activities had affected approximately25% of desert tortoise habitat in California. In 1986, Dodd (1986) concluded that nearly 70% ofthe remaining high-density tortoise populations in the California desert were subject to OHVimpacts. In 1990, Chambers <strong>Group</strong>, Inc. (1990) found that 413 square miles (2.9%) of theplanning area had been directly disturbed by OHVs, and that much of the disturbance hadoccurred in open areas or in unauthorized OHV-use areas.Sign count data collected between 1998 and 2002 indicate that vehicle-based impacts areprevalent throughout tortoise habitats, including DWMAs. Within the Fremont-Kramer andSuperior-Cronese DWMAs, cross-country travel was observed on 833 of 1,572 (53%) transectsand roads were observed on 702 (45%) transects. There were 447 mi 2 with higher tortoise signcounts, 159 mi 2 (36%) of which overlapped with above-average vehicle-based impacts (see Map3-14).Chapter 3 3-120
Distribution of Recreational and ResidentialVehicle Impact Regions (1998-2002)NAWSChina LakeN<strong>Mojave</strong> B RangeNAWSNTCFort IrwinEdwardsAFBMCAGCC29 PalmsLegendCitiesBLM Open Area BoundariesCounty Lines Higher Density TCS AreasHighways Above-Average Vehicle Impact Areas<strong>Plan</strong> Boundary Residential Vehicle Impact AreasMilitary Lands Open Area Impact AreasProposed DWMAs High OHV Use Areas10/14/04<strong>West</strong> <strong>Mojave</strong> <strong>Plan</strong> <strong>FEIR</strong>/SMap 3-14Scale: 1 : 1,100,0000 10 20 30Km0 10 20 30Miles
Although most of the above-average vehicle impacts are contained within BLM OpenAreas, similar vehicle impact areas were observed from California City, north through the RandMountains, into Fremont Valley. In effect, this is a heavy OHV use area affecting both privatelands around California City and about half of the region that is proposed for DWMAmanagement. Beginning in the late 1970’s and early 1980’s, extending through 2002, data frompermanent study plots indicate that tortoises decreased from about 72% to 93% in this region.Reduced Tortoise Numbers Attributed to OHV Impacts: The literature suggests thatOHV use has resulted in reduced tortoise numbers (National Ecology Research Center 1990,USFWS 1994b), including juveniles next to well-used dirt roads (USFWS 1994b). Berry (1996)found that tortoise populations decreased significantly with (a) increasing mileages of lineardisturbances associated with roads, trails, routes, and tracks (P
Tortoises and Burrows Crushed: Vehicle collisions are responsible for tortoise injuryand mortality on dirt roads (Berry 1996), including lightly traveled roads (USFWS 1994b).Given the prevalence of cross-country OHV travel (WMP 1998-2002 data), tortoises have alsobeen crushed in areas adjacent to roads (see also USFWS 2002), and mortality has likelyoccurred both above- and belowground (USFWS 1994b). Such cross-country travel has alsoresulted in loss (Jennings 1993) or damage (USFWS 1994b) of tortoise burrows.Relative Impacts Attributed To Trucks versus Motorcycles: Data do not indicate if thetortoises (or carcasses) were crushed by motorcycles or trucks, but it was more likely by trucks,given the larger surface area affected by four large tires, and the following considerations. Thelocation of tortoises and burrows likely affects the potential for them to be differentially crushedby trucks or motorcycles. Compared to trucks, motorcyclists are less likely to ride through andcrush shrubs, so tortoises and burrows under shrubs are somewhat less vulnerable to this impact.The visibility from a motorcycle also makes it likely that cyclists can more readily see and avoidtortoises. Comparatively, operators of four-wheel drive trucks often crush shrubs, have limitedvisibility from inside the vehicle, and are probably more likely to crush tortoises and burrowsthan are cyclists.Cross-country travel by both trucks and motorcycles results in degradation of habitat,which may result in poor forage quality and reduced burrowing potential. Motorcycles aresignificantly more maneuverable between shrubs, in mountainous areas above 20% slope, andmany other places that are less accommodating to trucks. This maneuverability has resulted inmore cross-country travel by motorcycles than by trucks, although there are exceptions inlocalized areas. The 27% increase of trails between 1979 and 1995 observed in the southern partof the Ord-Rodman DWMA was predominantly due to motorcycle traffic, and likely due to theproximity with Johnson Valley Open Area, which is immediately east. Therefore, althoughcyclists are less likely to crush tortoises than truck operators, they are more likely to leave roads,and are more likely to degrade habitats in areas with few roads, compared to trucks.Prevalence of Vehicle Crushing: Sign count data indicate that vehicles crushed 28 (27%)of the 104 carcasses where the cause of death could be ascertained. These results are remarkablysimilar to those of distance sampling in the Fremont-Kramer and Superior-Cronese DWMAs,where vehicle crushing accounted for 32% (14 of 44) of all observed carcasses where cause ofdeath was given.Vehicle crushing has resulted in about a third of the tortoise deaths observed where causecould be determined, with only mammalian predation being more prevalent. Unlike catastrophicdie-offs, where the cause of death is unknown, and mammalian predation, which is widespreadand may not be controllable, vehicle impacts may be controlled. Route reductions, signing andfencing programs, restriction on competitive events in DWMAs, education program, andincreased law enforcement are pragmatic ways of minimizing vehicle impacts.Adult Versus Subadult Tortoises Crushed: The data suggest that adult tortoises are morelikely to be crushed than subadult tortoises, although the lower detectability of smaller carcassesmay, in part, account for the difference. Sign count data for the 28 crushed carcasses indicatethat 23 (82%) were adults, 4 (14%) were subadults, and 1 (4%) was unknown. Similarly,Chapter 3 3-123
distance-sampling data indicate that 12 of the 14 (86%) crushed carcasses were of adult tortoises,1 (7%) was a subadult, and 1 (7%) was unknown.Aboveground Tortoise Activity in Response to Wet versus Dry Years: Sign count anddistance-sampling data indicated within a give year, tortoises are more likely to be aboveground(i.e., active) in the spring and in burrows (i.e., inactive) in the summer-fall. The distancesampling data suggest that increased activity patterns occur on a regional scale, not just on alocal scale. This may the first evidence that increased tortoise activity patterns in response torainfall occur on a population level instead of at the individual level.These observations are significant for the following reasons:• Heightened activity in wetter years may put more tortoises at risk to being crushed byvehicles, both on and adjacent to designated routes. This impact is more likely to occurin higher density areas where operators are more likely to encounter tortoises.• Illegal activities that are facilitated by roads (i.e., poaching, pet collection, inter-regionaltranslocations, intentional vandalism, etc.), may occur more frequently in wetter years,given that tortoises are substantially more visible aboveground than in burrows.Increased law enforcement in higher density areas during such conditions may minimizethese impacts when and where they are most likely to occur.• Vehicles traveling in washes in wetter years may impact relatively more tortoises than indry years. It has been suggested that vehicle travel in washes during drought periodswould result in more impacts. This may not be true if tortoise activity in washes occursat reduced levels (i.e., although tortoises in burrows would still be affected by vehicletravel in washes).Locations of Tortoises: There were 491 sign count and distance sampling tortoisesobserved between 1998 and 2002. Their locations and other information are given in Table 3-24.Distance sampling tortoises for 2001 and 2002 are given in the middle two rows of the table.Arrows show the directions to which percentages apply; the two middle rows are relative to“Distance Both Years” shown in the fourth row of data.Chapter 3 3-124
TypeYearsSignCount98-99-01Distance2001Distance2002DistanceBothYearsTotal275↓56%104↓21%112↓23%216↓44%Table 3-24Characteristics of 491 Tortoises Found Between 1998 and 2002LOCATIONS OF TORTOISES 16NoObs202←74↓70%29←28%↓10%57←51%↓2086←40%↓30%Total 491 288←59%288 IN BURROWS 203 ABOVEGROUNDShrubs Open Wash Unk No Open Shrubs WashesRocksBanksObsRocks116 58 20 8 73 67 3 3←57% ←29% ←10% ←4% ←26% ←92% ←4% ←4%↓36%29 in Burrows; no location data 75←72%↓37%57 in Burrows; no location data 55←49%↓27%86 in both years 130←60%↓64%203←41%↓40%58←77%↓34%43←78%↓26%101←78%↓60%168←84%↓9%17←23%↓37%12←22%↓37%29←22%↓91%32←16%↓4%SeefootnoteOHV Impacts to Tortoises in Washes: During his studies at the <strong>Desert</strong> TortoiseNatural Area in the early 1990's, Jennings (1993, 1997a, 1997b) found that tortoisessystematically located preferred forage along the margins of small washes. They spent aconsiderable amount of time traveling along washes, and apparently used washes as navigationalaids to relocate burrows. For example, more than 25 percent of all plants on which tortoises fed,and three of the ten most-preferred plants, were in the washes and washlets, even though washescomprised only 10.3% of the study area habitats (1997). Given this information, he concludedthat OHV use may disorient tortoises (1993) and that tortoises will be forced to select other lesspreferredand possibly less-nutritious plant species (1997a).Jennings (1997a) also found that tortoises generally spent more time traveling andforaging in hills, washes, and washlets than on the flats, and that hills and washes were favoredin the planning area for use by OHV recreationists. Given this overlap, he concluded thattortoises are more likely to suffer direct mortality from vehicles than if they used the habitatrandomly.3.3.2.6.3 Direct Impacts of OHVs on <strong>Desert</strong> Tortoise HabitatHabitat Degradation: Lovich and Bainbridge (1999) found that the wheel tracks of afull-size OHV vehicle operating in an undisturbed area could damage almost 1.25 acres (0.5 ha)with every 4 miles (6.44 km) traveled. Goodlett and Goodlett (1991) reported that impacts in the16 Sign count data are shown in the 1 st row for 275 tortoises, and in the 4 th row for 216 distance-sampling tortoises86 animals found in burrows during distance sampling, but was provided for aboveground tortoises. The totalaboveground estimates of 84% in the open and 16% under shrubs are for 200 tortoises observed outside washes. Itwould be incorrect to conclude that only 3 of 203 tortoises were in washes; the correct conclusion is that 3 of 73(4%) were found in washes, in the summer to fall period; even this number is likely an underestimate, as surveyorslikely failed to indicate all tortoises and burrows associated with washes.Chapter 3 3-125
Rand Mountain area were highest close to open routes. Open routes may induce negativeimpacts for substantial distances; even at 500-feet from an open route, unauthorized tracks wereobserved at a rate of almost one per 20 linear foot.Negative effects on the desert environment have been summarized (National EcologyResearch Center 1990, USFWS 1994b). Impacts include damage to and loss of habitat (Jennings1997a, USFWS 2002) and severe declines in biomass of plants and vertebrates (USFWS 1994b).Both annual and perennial plants are affected (Jennings 1997a, National Ecology ResearchCenter 1990), which in turn affect forage quality, water availability, and thermoregulation(USFWS 1994b).Vollmer et al. (1976) reported that cross-country OHV travel impaired annual plantproductivity, retarded shrub regrowth, resulted in less plant cover and density, and conspicuouslydecreased shrub biomass. In comparing areas of different disturbance levels, Webb et al. (1983)concluded that light OHV use might not cause the severity of impact that occurs in some ghosttowns, but OHV pit areas have more soil and vegetation disruption than naturally recoveringghost towns. Berry (1996) indicated that OHV use directly affects plants and animals bydisrupting the distribution, composition, structure, diversity, and biomass of animal and plantcommunities; changing the watershed; and promoting desertification.The USFWS (2002) concluded that unauthorized activities, particularly OHV use, havedegraded desert tortoise habitat. The access provided by the BLM for legitimate uses, such asrecreation, facilitates some degree of unauthorized use (USFWS 2002). In addition tounauthorized roads and trails, areas that are frequently used for loading and unloading vehiclescan be severely degraded (USFWS 2002).Habitat Regeneration: Vollmer et al. (1976), upon revisiting their study plot 18 monthsafter the tests were conducted, found that little damage to shrubs was apparent from a distance,but that when viewed from nearby, tracks were clearly discernible. They concluded that trucktracks can persist at least 10 to 12 years depending on the substrate, and that shrub cover may bere-established within a couple of decades if there is no further damage. National EcologyResearch Center (1990) estimated full-recovery time required to ameliorate severe OHV impactsshould probably be estimated in terms of human life spans; and that hundreds or thousands ofyears may be necessary for disturbed areas to recover. Stowe (1988) found that many of theolder, smaller trails that were identified 1977-78 appeared to be unused in 1988, and in somecases the vegetation appeared to be growing back over the edges of the trails.OHV Impacts to Wash Habitats: Jennings (1993, 1997a) found that vehicles’ driving inwashes disturbed relatively rare species of plants that were restricted to washes. LaRue (1997)found catclaw acacia and desert willow mostly restricted to washes in the Ord Mountain area.Damage observed in the Ord Mountains included disturbed soil and terrain, crushed shrubs, anderoded margins of washes, which led to widening of the washes. He found that some routes inwashes became impassable when banks and boulders were encountered, which necessitatedturning around and resulted in new shrub damage.Chapter 3 3-126
OHV Impacts to Soils: OHV use has resulted in the following impacts to soils (see alsoNational Ecology Research Center 1990): damage or destruction of soil crusts (24), soil erosion(Trombulak and Frissell 2000, USFWS 1994b), and interrupted run-off patterns (Trombulak andFrissell 2000). Vollmer et al. (1976) found that OHV use changed soil compaction andpermeability, and that disruption of soils may not be fully expressed until years after the originalimpact. Berry (1996) found alterations to and erosion (wind, water) of soil and soil crusts, andadverse effects to soil porosity, chemistry, moisture, and temperature. Lovich and Bainbridge(1999) observed that areas they considered least susceptible to water and wind erosion, followingOHV use, were dunes, playas, and areas with abundant coarse surface material.3.3.2.6.4 Indirect Impacts of OHVs on <strong>Desert</strong> Tortoises and HabitatHuman Access: Berry (1996) indicated that human access results in increased damage toplants, animals, and soils. This access results in exploitation, removal, unintentional orintentional disturbance, and harassment of wildlife. She also reported adverse effects on othervisitors and increased deposition of garbage and refuse. Fire regimes are altered as a result ofhuman-induced fires and the proliferation of alien or non-indigenous plants.USFWS (1994b) indicated that the presence of routes facilitates the removal of deserttortoises (predation for food, collecting for pets, and commercial trade), vandalism, and releaseof captive desert tortoises. Dumping, numbers and locations of wild fires, harvest and vandalismof vegetation, and predation by dogs and ravens may increase proportionate to available access.Routes have been implicated in the proliferation of weeds, resulting in more wildfire (USFWS2002, USFWS 1994b). Berry (1996) found that tortoise populations decreased with increasingpercentages of introduced annual plants.Spread of Weeds: Lovich (1992) concluded that, among other things, tortoise habitatshave been negatively affected by construction of roads and utility corridors. Brooks (1998) andFrenkel (1970) concluded that dominance of alien annual plants is the highest where roaddensities are high, and that minimizing the number of paved and dirt roads and maintaining nonroadedwilderness areas may reduce the dominance of aliens.Trombulak and Frissell (2000) listed seven general effects of roads, including spread ofexotic species, and indicated that roads are commonly identified as important correlates orindicators of loss of ecological health. They reported that roads provide dispersal of exoticspecies via three mechanisms: providing habitat by altering conditions, making invasion morelikely by stressing or removing native species, and allowing easier movement by wild or humanvectors. Hourdequin (2000) found that, whereas roads negatively affect some species, others maybenefit; that many exotic plant species thrive along roadsides; that roads can act as corridors forthe dispersal of plant seeds; and that roads may also provide habitat and movement corridors foropportunistic species such as weeds. Tracy (1995) showed that fires are mainly started alongroads, and that a majority of those are along paved roads.Route Proliferation: USFWS (1994b) identified route proliferation as a threat. LaRue(1997) reported that there had been a 27% increase in detectable routes between 1978 and 1989in the Ord Mountain area. Much of it resulted from motorcycle use in the southern parts of theChapter 3 3-127
proposed Ord-Rodman DWMA, west of and including the Cinnamon Hills. The USFWS (2002)reported that recreationists used legal routes to gain access to popular staging and camping sites,and that impacts emanated out from such areas, impacting less disturbed habitats. Stow (1988)reported that light OHV activity escalated into heavier use and more impacts. Vollmer et al.(1976) expressed concern that once an area was heavily used, recreationists would abandon thearea in search of new and intact environments.No OHV Impacts or Minimal Impacts Observed: Vollmer et al. (1976) found noindication that driving interfered with rodent reproduction, side-blotched lizard reproduction, oranimal population trends. Few shrubs were outright killed, and plant density and diversityremained essentially unaltered. They found creosote bush recovered if root crowns were notdestroyed; damaged plants were scarcely distinguishable after10 years. It was not clear that thedensity of annuals was reduced by vehicular traffic during their study.OHV Impacts Uncertain: In 2002, the USFWS concluded that reductions in the amountof open routes are likely to provide some level of benefit to the desert tortoise. However, neitherthe BLM nor the USFWS had definitive information on how differing route networks may affectthe desert tortoise; presumably, roadless areas would have the least adverse effect on deserttortoises and their habitat. Vollmer et al. (1976) found it difficult to gauge the impact of lessintensive OHV-use areas. The extent that any changes in the access network affect the deserttortoise would be difficult to measure because of the slow reproductive rate of the species andother factors, such as disease, drought, and predation, that may be affecting the number ofindividuals in a region. No quantitative information was available concerning how frequentlydesert users leave routes of travel to camp, stop, and park outside of existing disturbed areas. Inat least some areas that are occupied by the desert tortoise, the density of vegetation would likelyprevent most desert users from leaving the routes of travel (USFWS 2002).3.3.2.6.5 Off-Highway Vehicle Open AreasRelative Tortoise Occurrence in Open Areas: Eight BLM open areas occur, includingJohnson Valley, Stoddard Valley, El Mirage, Spangler Hills, Jawbone, Dove Springs, Rasor, andOlancha. Jawbone, Dove Springs, and Rasor are on the edge of the 2002 tortoise range, whileOlancha is north of the known range. These areas were either not surveyed (Jawbone orOlancha) during sign count surveys, or no tortoise sign was observed during surveys at Rasor(i.e., 26 of 35 mi 2 , 74%) and at Dove Springs (i.e., 3 of 6 mi 2 , 50%). Survey coverage wasrelatively good at Johnson Valley (231 of 294 mi 2 , 79%), Spangler Hills (i.e., 75 of 97 mi 2 ,77%), and Stoddard Valley (i.e., 63 of 85 mi 2 , 74%), and somewhat less representative of ElMirage (i.e., 16 of 40 mi 2 , 40%). Most of the following discussion is relative to Johnson Valley,Stoddard Valley, El Mirage, and Spangler Hills open areas (see Appendix L for moreinformation).Higher Density Tortoise Areas: Higher density sign count regions within open areas areshown in Map 3-14. There were four higher density tortoise areas in the Johnson Valley OpenArea, comprising 32 mi 2 . Two of these (28 mi 2 ) were contiguous to the Ord-Rodman DWMA.Higher density areas were also found throughout much of the northern part of the StoddardValley Open Area, and were contiguous to higher density areas east of Highway 247, in the Ord-Chapter 3 3-128
Rodman DWMA. There were no higher density areas in El Mirage, although the survey effortwas relatively light, and 5 mi 2 were found immediately northwest of Spangler Hills.Relative Tortoise Occurrence in Open Areas 17 : Tortoise encounters were the highest inStoddard Valley (i.e., 1 tortoise/10.5 linear miles of transects), intermediate in Johnson Valley(i.e., 1 tortoise/43.3 miles), and lowest in Spangler Hills (i.e., 1 tortoise/56.2 miles). El Miragewas relatively high (i.e., 1 tortoise/8.0 miles), but the sample size was sufficiently small that thiswas likely an artifact of the survey rather than a relative estimate of abundance.The data suggest the following descending order of tortoise abundance in the four openareas: Stoddard Valley > Johnson Valley > (El Mirage, suspected) > Spangler Hills.Collectively, 22 live tortoises were observed over 520 linear miles of transects in these four openareas, for an encounter rate of 1 tortoise/23.6 miles of transects. For comparison, 154 liveanimals were observed on 2,293.5 miles of transects in three DWMAs (i.e., excluding PintoMountain), for an encounter rate of 1 tortoise/14.9 miles, or about 1.6 times higher than in openareas.Relative Occurrence of Carcasses in Open Areas: Carcass encounters were the highestin Johnson Valley (i.e., 1 carcass/5.25 miles), intermediate at Stoddard Valley (i.e., 1carcass/8.59 miles), and lowest in Spangler Hills (i.e., 1 carcass/12.5 miles). El Mirage wasrelatively high (i.e., 1 carcass/4.8 miles), but again, sample size was too small to be meaningful.The data suggest the following descending order of carcass abundance in the four open areas:Johnson Valley > Stoddard Valley > (El Mirage, suspected) > Spangler Hills.Comparisons between Live Tortoises and Carcasses in Three Open Areas: The inverserelationship described previously for DWMAs was not observed in the three open areas. Table3-25 shows the encounter rates for both tortoises and carcasses.Table 3-25Tortoise and Carcass Encounter RatesAREA OF COMPARISON ONE TORTOISEOBSERVED EVERYONE CARCASS OBSERVEDEVERYStoddard Valley 10.5 mi 8.59 miJohnson Valley 43.3 mi 5.25 miSpangler Hills 56.2 mi 22.5 miObservations in three DWMAs (i.e., excluding Pinto Mountain) indicated an inverselinear relationship between live tortoises and carcasses; tortoises were more often encounteredwhere fewer carcasses were found. Observations in the Stoddard Valley Open Area followedthis pattern, but not for either Johnson Valley or Spangler Hills. Spangler Hills is relativelyeasily explained; very low encounter rates for both tortoises and carcasses suggests low densitiesof tortoises. Johnson Valley, however, appears to be an anomaly, as it was the only place wheretortoises were difficult to find, but carcasses were relatively easy. Only 10 sign count tortoises17 Appendix L shows encounter rates, carcass data and other calculations that were used in support of the aboveobservations.Chapter 3 3-129
were observed in the 294 mi 2 Johnson Valley open area. Five were in higher sign count areasand five were outside. None was found in the 22 mi 2 higher density area southeast of the Ord-Rodman DWMA, where a recent die-off was detected. This may suggest that tortoises wereonce relatively more common than they are now (i.e., as evidenced by the prevalence ofcarcasses).One measure is to divide the tortoise encounter rate by the carcass encounter rate. Thisratio is 1.2 for Stoddard Valley, 2.5 for Spangler Hills, and 8.2 for Johnson Valley. The sameratio for the DWMAs is: 1.8 for Ord-Rodman, and 4.5 for Superior-Cronese and 7.0 forFremont-Kramer. The lower ratios for Stoddard Valley, Ord-Rodman, and Spangler Hills (1.2,1.8, and 2.5, respectively) coincide with regions of relatively more tortoise encounters comparedto carcasses (excepting Spangler Hills, where both were less commonly found). This comparesto the higher ratios for Superior-Cronese, Fremont-Kramer, and Johnson Valley (4.5, 7.0, and8.2, respectively) where there were relatively fewer tortoise encounters compared to carcasses.Dr. Berry documented a 77% decline between 1980 and 1994 on the Johnson Valleystudy plot, which is within the open area. All other such declines have occurred in the Fremont-Kramer and Superior-Cronese DWMAs. The two study plots showing the smallest declines wereLucerne Valley (i.e., 30% decreases between 1980 and 1994) and Stoddard Valley (5% between1981 and 1991). These data suggest that there may be a differential die-off in Johnson Valleythat is more similar to Fremont-Kramer and Superior-Cronese DWMAs than in Stoddard Valleyand Ord-Mountain areas.Relative Occurrence of Vehicle Impact Areas: Map 3-14 shows the spatial distributionof three types of vehicle impact areas that occur within the planning area: BLM open areas,heavy OHV use areas, and residential areas. Rules of polygon establishment describedelsewhere were used to delineate these regions 18 . Importantly, only above-average vehicleimpact data collected during sign count surveys (1998-2002) were used in polygonestablishment. Although these types of impacts occur throughout many portions of the planningarea not encompassed in the polygons, the identified regions (and data discussed herein) reflectthe most severe and intense levels of vehicle impacts on lands where human uses are mostconcentrated (i.e., on at least four contiguous square miles where every square mile had aboveaverageimpacts).Open areas are designated by the BLM for vehicle free play, and occur in seven specificareas. Residential impact areas occur in three general regions: west and northwest of thecommunity of Silver Lakes, north of Hinkley, and in the “Coyote Corner,” southwest of FortIrwin. Heavy OHV Use areas are as disturbed as designated open areas, but are not officiallydesignated for this form of vehicle use. The impact area between California City and the RandMountains is not a BLM open area, but it is very large and, in places, as impacted as open areas.Interestingly, there is also a 14 mi 2 area (i.e. East Sierra in Table 3-26) seven to eight miles north18As in other similar calculations, although Map 3-14 shows the distributions of the larger polygons, only the squaremiles of data are included in the table and discussed in the text. Importantly, all data describe above-average vehicleimpacts; there are individual square miles of similar disturbance and many other square miles affected by belowaverageimpacts; these areas are significantly affected by vehicle impacts.Chapter 3 3-130
of Dove Springs that has experienced above-average vehicle impacts, but it is not clear if this isan extension of Spangler Hills impacts from the east or Dove Springs/Jawbone Canyon impactsextending north (likely the latter). These two, and the Edwards Bowl area south of EdwardsAFB, are herein referred to as heavy OHV use areas.Table 3-26Relative Areas Affected by Recreational versusResidential Vehicle Impact RegionsTYPE OF IMPACT AREA AFFECTED AREA % TOTAL IMPACT AREA(TOTAL = 979 MI 2 )RECREATIONDesignated Open Areas Inside OutsideJohnson Valley 205 mi 2 91 mi 2 296 mi 2 = 30%Spangler Hills 71 mi 2 60 mi 2 131 mi 2 = 13%Stoddard Valley 61 mi 2 58 mi 2 119 mi 2 = 12%Dove Springs/Jawbone Canyon 2 mi 2 22 mi 2 24 mi 2 = 2%El Mirage 14 mi 2 7 mi 2 21 mi 2 = 2%Open Area Subtotals 353 mi 2 238 mi 2Open Area Total 591 mi 2 591 mi 2 = 60%Heavy OHV Use AreasCalifornia City/Rand Mountains 168 mi 2 = 17%Edwards Bowl 31 mi 2 = 3%East Sierra 14 mi 2 = 1%Total 213 mi 2 213 mi 2 = 21%Total Recreation (591 mi 2 + 213 mi 2 )804 mi 2 RECREATION804 mi 2 = 81%RESIDENTIALCoyote Corner 39 mi 2 = 4%Silver Lakes 37 mi 2 = 4%Hinkley 31 mi 2 = 3%Total Residential 107 mi 2 RESIDENTIAL107 mi 2 = 11%Other 77 MI 2 OTHER77 MI 2 = 8%TOTALABOVE-AVERAGEVEHICLE IMPACT AREAS988 mi 2 ABOVE-AVERAGEVEHICLEIMPACT AREAS988 mi 2Comparisons among these different regions are very important, as they differentiaterecreational vehicle impacts from residential vehicle impacts. This is not to say that there is nooverlap; there are likely both residential and recreational impacts in the northern Lucerne Valleyand in the Rand Mountains, for example. However, in most cases, the impacts are clearlyassociated with either recreational impact regions (i.e., BLM open areas and heavy OHV useChapter 3 3-131
areas) or residential impact regions. The relative sizes of these different regions and subregionsare given in Table 3-27, and summarized as follows. The “% of Impact Area,” given in thefourth column, lists the percentages of each subregional impact area relative to the total aboveaveragevehicle impact area observed throughout the planning area, which was determined to be988 mi 2 .Table 3-27Cumulative Totals of Above-Average Vehicle-Based Impacts in Open Areas, Heavy OHVUse Areas and Residential Impact RegionsMi 2Area TotalSum Ave Range Mi 2 Sum Ave Rangemi 2 ObsObsTRAILSTRACKSOpen Area 591 494 9417 19.1 1-250 548 78909 144.0 1-4000Heavy Use 213 128 954 7.4 1-35 184 8903 48.3 1-585Residential 107 49 191 3.9 1-22 94 2761 29.4 1-341Total 911 671 10562 15.7 1-250 826 90573 109.6 1-4000LITTERDUMPSOpen Area 591 549 20819 37.9 1- 0 0 0 01080Heavy Use 213 199 4940 24.8 1-305 0 0 0 0Residential 107 49 191 3.9 1-22 6 7 1.2 0-2Total 911 797 25950 32.6 1-1080 6 7 1.2 0-2TARGETHUNTINGOpen Area 591 213 3456 16.2 1-325 61 126 2.1 1-18Heavy Use 213 98 653 6.7 1-53 25 39 1.6 1-4Residential 107 48 874 18.2 1-525 23 55 2.4 1-8Total 911 359 4983 13.9 1-525 109 220 2.0 1-18CAMPINGOpen Area 591 66 161 2.4 1-25Heavy Use 213 15 22 1.5 0-3Residential 107 10 16 1.6 1-4Total 911 91 199 2.2 1-25Again, it is important to note that each square mile of impact was above-average for oneor more of the eight vehicle-based disturbances: roads, trails, tracks, garbage/litter, hunting areas,target shooting areas, and camping. There were a total of 988 mi 2 of above-average vehicleimpacts within the surveyed area. This comprises about a third (29%) of the 3,362 transectssurveyed between 1998 and 2002.Vehicle-based recreation (open areas and heavy OHV use areas) was responsible for atotal of 804 mi 2 (81% of 988 mi 2 ) of above-average impacts. This was further segregated into591 mi 2 associated with open areas. Of this, 353 mi 2 (60%) occurred within open areas, and 238mi 2 (40%) occurred on lands adjacent to open areas (Map 3-14). This is a key finding, as itclearly shows that vehicle impacts are not restricted to designated open areas; 40% of observableabove-average impacts are adjacent to open areas, including DWMAs. One should not forgetthat there were additional above-average square miles and below-average impact areas spreadthroughout the planning area. Only above-average impacts are discussed in this section.Chapter 3 3-132
Both inside and adjacent to open areas, Johnson Valley, Spangler Hills, and StoddardValley (given in descending order of the size of the affected area) cumulatively affected 546 mi 2 ,or about 92% of the 591 mi 2 impacted. Areas affected included Johnson Valley at 296 mi 2 (54%of 546 mi 2 attributed to all open areas), Spangler Hills (131 mi 2 or 24%), and Stoddard Valley(119 mi 2 or 22%) open areas.The three heavy OHV use areas occupied 213 mi 2 , most of this (168 of 213 mi 2 , or 79%)was associated with the large area around California City, in the Rand Mountains, and adjacentareas. There were also 31 mi 2 of impacts in the Edwards Bowl area, and 14 mi 2 in the EastSierra, about seven miles north of the nearest open area. These are significant findings,indicating that in addition to the spill over effect of open areas given above, there are other areasthat are being treated as if they were open areas. Cumulatively, the 213 mi 2 corresponds to about21% of the total impact area (988 mi 2 ).As described above, there were also three residential areas of above-average impactsaffecting approximately 107 mi 2 . These were about equal in size, including 39 mi 2 in the CoyoteCorner area, 37 mi 2 in the Silver Lakes area, and 31 mi 2 north of Hinkley, including someoverlap into higher concentration tortoise areas. Residential area impacts were responsible forabout 11% (107 of 988 mi 2 ) of all above-average areas. There were also 13 smaller polygons ofup to eight miles that, cumulatively, have impacted about 77 mi 2 in the surveyed area, or about8%. These smaller impact areas are shown among the others on Map 3-14).Characteristics of Vehicle Impact Areas: The types and intensity of impacts associatedwith each region are listed in Appendix L.Table 3-27 reports the cumulative totals for trails, tracks, litter, dumps, target shooting,hunting, and camping among open areas, heavy OHV use areas, and residential areas.Data were collected between 1998 and 2001, and those given in the above table includethe 911 mi 2 of the 988 mi 2 (92%) impacted, excluding the 77 mi 2 encompassed in 13 smallerregions. Key findings and implications are bulleted below relative to the region of comparison:Open Areas. Importantly, the data presented for open areas include those observedimpacts that are inside (60% of 591 mi 2 ) and outside (40%) designated areas. Trails (19/mi 2 ),tracks (144/mi 2 ), litter (38/mi 2 ), and camping (2/mi 2 ) were more common in open areas thaneither heavy OHV use areas or residential areas. Tracks were about three time more prevalentthan in heavy OHV use areas (144/mi 2 compared to 48.3 mi 2 ), and five time more prevalent thanin residential areas (29.4/mi 2 ). Litter was similar in open areas (37.9/mi 2 ) and heavy OHV useareas (24.8 mi 2 ), but significantly lower in residential areas (3.9/mi 2 , or 10 less common than inopen areas). This is a key finding relative to raven management, suggesting that the BLM needsto implement a proactive education program in the open areas to minimize the amount of litter(and presumably attractiveness to ravens) available to ravens and other predators (including feraldogs) that threaten tortoises.Chapter 3 3-133
As shown in Appendix L, Johnson Valley exceeded the following average impacts givenin parenthesis in the previous sentence: trails (22/mi 2 ), tracks (180/mi 2 ), litter (41/mi 2 ), targetpractice (17.4 compared to 16.2/mi 2 ), and camping (3.1 versus 2.4/mi 2 ). Johnson Valley was theonly open area to exceed the average number of tracks among the five open areas.Heavy OHV Use Areas: Impacts in these three regions were intermediate to open areas(where more impacts were observed) and residential areas (where there were relatively fewerimpacts). Both target shooting (6.7/mi 2 compared to 13.9/mi 2 on average) and hunting (1.6/mi 2compared to the average of 2.0) were relatively lower in heavy OHV use areas than in open areas(16.2/mi 2 shooting, 2.1/mi 2 for hunting) and residential areas (18.2/mi 2 shooting, 2.4/mi 2hunting). Heavy OHV areas were also slightly lower in terms of camping (1.5/mi 2 compared toaverage ofg 2.2/mi 2 ) than in open areas (highest at 2.4/mi 2 ) and residential areas (1.6/mi 2 ).Among the three heavy OHV use areas, California City into the Rand Mountains is themost impacted in terms of trails (8.0/mi2 compareed to Edwards Bowl, the next highest heavyOHV use area was highest in terms of litter (47.6/mi 2 compared to California City/RandMountains at 21.1/mi 2 ) and target practice (7.8/mi 2 compared to 6.5/mi 2 at California City).Residential Areas. Importantly, all three residential vehicle impact areas are insideDWMAs, and cumulatively affect 107 mi 2 . They are all about the same size (i.e., 35 mi 2 ). Thereis also a spatial importance among the three areas; impacts from Silver Lakes are mostly affectthe DWMA from the east, whereas Hinkley is partially within the DWMA, and Coyote Corner isfully within the DWMA.Seven dumps were observed on 107 mi 2 surveyed, and were unique to this impact area,having not been recorded in either open areas or heavy OHV use areas. This is a significantfinding relative to raven management, suggesting that dump clean up activities should be focusedin these areas, all of which are within DWMAs.Interestingly, both target shooting (18/mi 2 compared to 16/mi 2 in open areas) and hunting(2.4/mi 2 compared to 2.1/mi 2 in open areas) had the highest incidence of occurrence inresidential areas. Again, on BLM-managed lands, this may help direct law enforcement to focalproblem areas, which correspond to west of Silver Lakes in the Fremont-Kramer DWMA, northof Hinkley and in the Coyote Corner, both of which are within the Superior-Cronese DWMA.Of the three residential areas, Hinkley was the highest for trails (5.1/m 2 compared to3.6/mi 2 in Coyote Corner) and litter (104/mi 2 compared to 53/mi 2 in Coyote Corner). CoyoteCorner was significantly higher in track counts (57/mi 2 compared to 15/mi 2 in Hinkley) andtarget shooting (37/mi 2 compared to 6/mi 2 west of Silver Lakes). Coyote Corner was alsonoteworthy for the amount of dumping, where 6 of 7 incidences (86%) were observed; theremaining dump was seen west of Silver Lakes, although dumping is far more common there,particularly just north of Shadow Mountain Road (LaRue, pers. obs.).Chapter 3 3-134
3.3.2.6.6 Organized Competitive OHV EventsOHV Speed Events: Unless otherwise noted, most of the following impact discussionfor the Barstow-to-Vegas race was given in the <strong>Desert</strong> Tortoise (<strong>Mojave</strong> Population) Recovery<strong>Plan</strong> USFWS (1994b) and Burge’s 1986 observations of the Frontier 500 Race. Burge (1986)found that the types of maneuvers that contributed to old and recent disturbances includedcircling in place, turning out, passing, backing up, parking, continuous paralleling of the road fora half mile or more, hill climbing, short coursing (short cutting), road widening, and leaving orjoining the course from across open desert.Competitive events have resulted in old routes being widened (1986, USFWS 1994b) andnew routes being formed (Burge 1986, USFWS 1994b). Burge (1986) reported that the Frontier500 Race resulted in stretches of existing roads that were widened 50 to 90 feet on each side.Burge (1986) and the USFWS (1994b) also identified straying from the designated course as aproblem with both races. USFWS (1994b) reported that, during the Barstow-to-Vegas Race,motorcycles and other vehicles strayed beyond the designated course by an average of 30 feet,and caused damage or loss of hundreds of acres of desert tortoise habitat in the eastern <strong>Mojave</strong><strong>Desert</strong>. Burge (1986) found that race-related tracks showed a 103% increase compared to preracetrack counts, and that 38% of discrete tracks, and hundreds of overlapping tracks, extendedbeyond the allowable course width of 100 feet.Burge (1986) found that damaged shrubs were evident in every recent OHV track createdby the Frontier 500 Race, and that 1,170 shrubs were crushed and uprooted along one transectsurveyed after the event. Vollmer et al. (1976) reported that, in the course of one day, amotorcycle race in Kern County involving 700 motorcyclists, “devastated all vegetation in anarea approximately 1-2 meters wide and 5 kilometers long.” Prior to the Frontier 500 Race,Burge (1986) located and flagged 26 tortoise burrows, none of which was crushed, although sheobserved motorcycle tracks within one to two feet of several flagged burrows.Impacts have also been associated with races that were not directly attributable to eventparticipants. The USFWS (1994b) reported that non-event participants often camped inunauthorized areas, litter and garbage were often associated with such illegal campsites, andBLM and other monitors were unable to prevent or control these unauthorized activities.Stoddard to Johnson Valley Competitive Event Corridor: BLM currently allows theuse of the Stoddard-to-Johnson Valley Corridor, which runs through the southwestern portion ofthe proposed Ord-Rodman DWMA. Official use of this corridor for an organized event was lastauthorized by the BLM in 1994, when the “Stoddard Valley-to-Johnson Valley Point-to-PointCorridor Run” occurred.The event, which occurred on 26 November 1994, was sponsored by the AmericanMotorcyclist Association and monitored by the BLM and its appointees. Although the totalracecourse was 173 miles long, all monitoring was restricted to the 21.25-mile Stoddard-to-Johnson Valley Corridor. Prior to the event, LaRue (1994) found a total of 24 tortoise burrows,including 17 burrows that were located between 6 inches and 40 feet from the designated route.Chapter 3 3-135
Although the event authorized participation of up to 500 motorcyclists, only 87individuals actually participated (LaRue 1994). Racers were under “yellow flag conditions” thatincluded (a) a well-marked route, (b) speed limits of 40 miles per hour for the eastern sevenmiles of the corridor and 30 miles per hour elsewhere, (c) pace motorcycles every 15 minutesthat were not to be passed by event participates, (d) no passing of other racers while in thecorridor, and (e) participants were timed and could not pass through the corridor in under 40minutes. Additionally, there was light rain and snow immediately prior to and during the race,which likely reduced riders’ tendencies to stray from the route to avoid dust created by theracer(s) that were immediately ahead of them (LaRue 1994).LaRue (1994) found that 22 event-related tracks left the route for a total linear distance of1,074 feet. The average track length was 48.8 linear feet and ranged from 10 to 300 feet inlength. Perpendicular distances between the 22 tracks and the route averaged 3.95 feet andranged from 0.5 to 20.0 feet. Most of the straying (i.e., 16 of 22 tracks, or 73%) occurred alongJensen Pass, which was the narrowest part of the corridor (i.e., 8.1 feet wide), and the remainingsix tracks occurred along wider routes (i.e., widths ranged from 9.7 to 17.3 feet). Although theBLM employed 10 rangers, eight observers, and one helicopter between 24 and 26 November toenforce the closure of 119 square miles of desert that encompassed the corridor, LaRue (1994)still found 23 motorcycle tracks, 13 truck tracks, and 5 quad-runner tracks that were not causedby the racers. He concluded that the tracks were probably associated with monitors orunauthorized use by the general public.Johnson Valley to Parker Competitive Event Corridor: The western portion of thiscorridor coincides with the northeastern boundary of the proposed Ord-Rodman DWMA. Thisis important because the USFWS (2002) reported that during events elsewhere along the route,riders were authorized to travel up to 100 feet from the centerline of the established road, alongthe southern side of the corridor to avoid impacts to the Chemehuevi DWMA in the East<strong>Mojave</strong>, which occurs north of the road. They (USFWS 2002) concluded that (a) this off-roadtravel was likely to kill or injure desert tortoises, disturb habitat, and could accelerate the spreadof invasive species; (b) some potential existed for racers to cause degradation of habitat in thearea surrounding the western end of the race (in the vicinity of the proposed Ord-RodmanDWMA); and (c) the proximity of the OHV event to the Chemehuevi DWMA posed, at aminimum, an indirect threat to the stability of the area, since tortoises travel beyond reserve areaboundaries, and invasive plants may have more ready access to reserves if adjacent habitats aredisturbed.Dual Sport Events: The USFWS (2002) concluded that organized, non-speed events,such as dual sports rides in the western <strong>Mojave</strong> <strong>Desert</strong>, resulted in minimal habitat disturbance, ifany, and that they were unaware of any injuries or mortalities of desert tortoises that haveoccurred during these events. They acknowledged that some level of mortality or injury may beundetected but impacts were anticipated to be minimal because dual sports occurred on existingroads and were usually conducted when most desert tortoises were inactive.Chapter 3 3-136
3.3.2.7 Current Effectiveness of Existing Protected Areas<strong>Desert</strong> Tortoise Research Natural Area: Although there are several ACECs in tortoisehabitat, only the DTNA was expressly established for conservation of the desert tortoise. TheDTNA has been partially fenced since the late 1970’s and completely fenced since the late1990’s. Even so, there are still threats to this most protected area. Each year a naturalist isemployed by the <strong>Desert</strong> Tortoise Preserve Committee (DTPC) to educate the public abouttortoise biology and protection. Several times each year, DTPC naturalists have encountered pettortoise owners attempting to release their animals into the DTNA (Michael Connor, pers.comm., Nov. 2002). Some of these tortoises have been symptomatic for URTD or otherdiseases. The fence line has been cut from time to time and trespass motorcycle tracks have beenseen bisecting the area within the fence (LaRue, 2001 pers. obs.). Feral dogs and ravenscontinue to be a problem.Some have questioned the efficacy of fencing off large areas, such as the DTNA, whenthe data do not appear to show that tortoise populations are increasing inside the fence. Dr.Berry (pers. comm., Nov 2002) has shown that decreases have been similar on both sides of thefence, but that tortoise numbers within the fenced area remain somewhat higher than numbersoutside the fence. Sign count and distance sampling data support Dr. Berry’s findings that therehave been significant declines in the DTNA and the surrounding region. Most importantly, theyalso show that there has been recent reproduction within the remnant population. Eight of 13(61%) tortoises found inside the fenced area were subadult animals.This may be a very significant finding, when one considers that the subadult cohort mayonly constitute 15 to 20% of the regional population. Within the 697 mi 2 area bounded byGarlock Road, Highway 14, Highway 58, and Highway 395, a total of 324 mi 2 (46%) weresurveyed. All subadults observed within the 324 mi 2 surveyed area were located within, orimmediately adjacent to, the DTNA (Map 3-9). The next nearest subadult was located 17 mileseast of the DTNA, found in the spring during line distance sampling surveys. It is promising thatthere may be recruitment in an area that has experienced significant population declines, andnoteworthy that no subadult animals were observed in any of the other older die-off regions.This may suggest that the perimeter fence is functioning in some manner to promote recruitment,and to minimize vehicle and sheep grazing impacts to reproducing females and new animals.These recruits are exceedingly vulnerable to natural predators (especially coyotes and kitfoxes), predators that have increased due to man (coyotes and ravens), vehicular cross-countrytravel, and trampling by sheep. Except for the predators, protective fencing has reduced orcompletely eliminated many of these impacts. And there is evidence that tortoise habitat isresponding in a positive way. For example, during his studies at the DTNA, comparing variousparameters inside and outside the fence, Dr. Matthew Brooks (1993) found (a) higher biomass ofnative annuals inside the fence; (b) higher biomass of non-native annuals outside the fence; (c)higher abundance of birds inside the fence; and (d) higher abundance of reptiles inside the fence.The increases, which likely show the results of habitat protection and rehabilitation, wereattributed to less human use inside the fence.Chapter 3 3-137
Wilderness Areas: With the passage of the California <strong>Desert</strong> Protection Act, there arenow a total of 684 mi 2 of wilderness within the planning area. This includes 17 wilderness areas,eight of which are completely or mostly outside the 2002 range of the tortoise 19 . Only theeastern 10 mi 2 of the 77 mi 2 Owens Peak Wilderness Area are within the range, where threetransects were surveyed, and no tortoise sign found.The remaining eight wilderness areas, encompassing 391 mi 2 (57% of all wildernessacreage), are fully within the tortoise range. As a general measure of tortoise conservation value,Table 3-28 lists the acreage of each area, acreage above and below 20% slope, and acreage aboveand below 4,000 feet elevation.Table 3-28Comparisons of Acreage, Percent Slope, and ElevationWithin Eight Wilderness Areas within the 2002 Tortoise RangeWILDERNESSAREATOTAL MI 2 MI 2 > 20%SLOPEBlack Mountain 33 mi 2 7 mi 221%Cleghorn Lakes 62 1829%El Paso Mountains 38 1232%Golden Valley 57 2646%Grass Valley 51 36%Newberry Mountains 43 2558%Rodman Mountains 54 2037%Sheephole Valley 53 1630%Totals 391 mi 2 127 mi 2100%32%MI 2 < 20%SLOPE26 mi 279%4471%2668%3154%4894%1842%3463%3770%264 mi 268%MI 2 >4,000 FT0 mi 20%
Overall, one sees that 68% of the 391 mi 2 within these eight wilderness areas are below20% slope, and therefore relatively more suitable tortoise habitat, in terms of this one factor.Grass Valley (94%), Black Mountain (79%), Cleghorn Lakes (71%), and Sheephole Valley(70%) are the wilderness areas that are predominantly below 20% slope. Newberry Mountain(58%), Golden Valley (46%), and Rodman Mountains (37%) rank as the three wilderness areaswith relatively more area above 20% slope.The 4,000-foot cut-off is another measure used in Table 3-28. The 3,362 transects weresurveyed in an area 20 of 3,378 mi 2 . There were 70 mi 2 surveyed above 4,000 feet and 3,308 mi 2surveyed below 4,000 feet. Only one tortoise was observed above 4,000 feet, with the remaining260 found below. When one factors in the area of survey, there were 0.014 tortoises/mi 2(tortoises were observed in 1.4% of the survey area), compared to 0.078 tortoises/mi 2 (observedin 7.8% of the survey area). In general, then, tortoises were about 6 times more likely to beobserved below 4,000 feet than above. As with 20% slope, most (89%) of wilderness areasoccurs below 4,000 feet elevation, and are therefore relatively more suitable.Given these observations, which suggest that wilderness areas are mostly below 20%slope (68%) and mostly below 4,000 feet elevation (89%), the next comparisons consider thedata that were collected in these areas. The relative survey effort within each of the eightwilderness areas in the tortoise range where 141 sign count transects were surveyed between1998 and 2002 are compared in the following table. Table 3-29 lists the number of transectssurveyed, the area covered by the survey, and percent of the area surveyed within each of theeight wilderness areas.Table 3-29Sign Count Survey Effort within Each of theEight Wilderness Areas in the Tortoise RangeWILDERNESS AREA NO. TRANSECTS NO. MI 2 SURVEYED % OF AREA SURVEYEDSURVEYEDBlack Mountain 21 Transects 13 mi 2 39% of 33 mi 2Cleghorn Lakes 12 12 19% of 62 mi 2El Paso Mountains 10 4 10% of 38 mi 2Golden Valley 14 6 10% of 57 mi 2Grass Valley 35 30 59% of 51 mi 2Newberry Mountains 15 10 23% of 43 mi 2Rodman Mountains 29 24 44% of 54 mi 2Sheephole Valley 5 2 4% of 53 mi 2Totals 141 Transects 101 mi 2 26% of 391 mi 2One can see that about 26% (i.e., 101 of 391 mi 2 ) of the eight wilderness areas wassurveyed, ranging from a low of 4% in Sheephole Valley up to 59% in Grass Valley. BlackMountain (39%) and Rodman Mountains (44%) were also fairly well covered compared to many20As in previous discussions, there is a slight discrepancy between the numbers of transects and the area surveyed.Both numbers are derived from GIS coverages, however the area surveyed is often smaller than the number oftransects surveyed. Thus, in the table that follows, there were 141 transects covering only 101 mi 2 , because only thearea within a given square mile surveyed that occurs within wilderness is reported. These numbers should beconsidered as a rough index, and not necessarily characteristic of the entire area being described.Chapter 3 3-139
of the other wilderness areas. Although sample sizes were relatively small, data that werecollected are given in Table 3-30, including the number of tortoises, number of higher densitytortoise areas, tortoise sign (TCS), and carcasses observed. The area of survey is importantrelative to each of the observations, so the numbers of tortoises, carcasses, etc. are shown inparenthesis as the percent of transects surveyed within the area of comparison.Table 3-30Sign Count Tortoises, Carcasses, and Total Corrected Sign (TCS)Observed within Each of the Eight Wilderness Areastortoise observationsWilderness Area(No. Transects)No.TortoisesNo. ofCarcassesNo./%w/out SignNo./%w/ SignRange(Sum)Averagew/ Sign 21 Mi 2 AboveAverageCleghorn Lakes (12) 3 (25%) 2 (17%) 4 (33%) 8/67% 0-20 (96) 12 8Black Mountain (21) 1 (5%) 2 (9%) 3 (14%) 18/86% 0-34 (158) 9 6Rodman Mountains (29) 4 (14%) 3 (10%) 8 (27%) 21/73% 0-14 (105) 5 5Newberry Mountains (15) 2 (13%) 3 (20%) 3 (20%) 12/80% 0-4 (23) 2 0Sheephole Valley (5) 0 (0%) 0 (0%) 2 (40%) 3/60% 0-14 (17) 6 0Golden Valley (14) 0 (0%) 1 (7%) 9 (64%) 5/36% 0-1 (5) 1 0Grass Valley (35) 0 (0%) 8 (23%) 23 (66%) 12/34% 0-3 (19) 2 0El Paso Mountains (10) 0 (0%) 0 (0%) 7/70% 3/30% 0-3 (6) 2 0Totals 10 19 59 82 0-34 (53.6) 4.9 19The numbers would be interpreted using, for example, the Cleghorn Lakes WildernessArea: 3 tortoises were found on the 12 transects (25%) surveyed; 2 carcasses (17%) were found;no sign was found on 4 (33%) transects; tortoise sign was found on 8 (67%) transects; a total of96 pieces of sign were found, ranging from 0 to 20/transect; there was an average of 12 signfound on the 8 transects with sign; and there were 8 mi 2 of higher sign count areas.These comparisons suggest that Cleghorn Lakes, Black Mountain, Rodman Mountains,and Newberry Mountains provide the most tortoise conservation value in terms of currenttortoise occurrence. There were too few transects surveyed in the Sheephole Valley to determinewhere it would fit into this order. Golden Valley, Grass Valley, and El Paso may providerelatively less conservation value, although this may be more reflective of recent tortoise die-offsthan lower conservation value. Note for example, that more carcasses were found in GrassValley relative to the survey effort than any other area; so this area may have outstanding tortoisevalue, but older die-offs have affected the number of tortoises currently present.The spatial distribution of the eight wilderness areas is an important factor regarding therelative value of these areas for tortoise conservation. Cleghorn Lakes and Black Mountainappear to be the two most valuable areas in terms of tortoise occurrence. The Cleghorn Lakesarea is bisected by the 29 Palms Marine Corps Base, and the northern portions of this wildernessarea on the base also support relatively higher tortoise concentrations (data were unavailablefrom 29 Palms for analysis, but show a concentration area immediately north of the oneoccurring on BLM-managed lands). It is very isolated from human uses, and not near any die-21The “Average with Sign” column reports the average number of tortoise sign on the transects where sign wasfound, so that transects with zero sign counts have been excluded.Chapter 3 3-140
off regions discussed herein. Black Mountain is a diverse area of lava flows, with the westernportions above 20% slope, and no areas above 4,000 feet elevation. The southeastern cornercoincides with higher density areas over 6 mi 2 . Die-off regions immediately west and southeastof this area may threaten tortoises that remain.Both the Newberry and Rodman mountains wilderness areas are comprised of steepslopes (58% and 37%, respectively, occur above 20% slope), much of which is above 4,000 feet(30% and 32%, respectively). The southeastern portion of the Rodman Mountains includes 5 mi 2of higher density areas. These two areas appear to be intermediate in terms of tortoise occurrenceand conservation. Neither appears to be affected by recent die-offs, although such an area occursseveral miles west of the Newberry Mountains. There are too few data to see how the SheepholeValley may fit into the order given in the table; additional surveys in this area would be neededto determine its relative value for tortoise conservation.Although the El Paso Mountains and Golden Valley wilderness areas were relativelyunder-represented in the surveys, neither of them occurs in regions where any higher densitytortoise areas were identified. The Grass Valley Wilderness Area received more survey effortthan any other wilderness area, yet sign counts were sufficiently low throughout the area that noabove-average tortoise areas were identified. The prevalence of carcasses at Grass Valleysuggests that it was once more densely populated than at present, which does not diminish itsvalue in terms of serving as a potential head starting area. In terms of current tortoisedistribution, these three areas may provide relatively less value for tortoise conservation.Relative Overall Conservation Value of Wilderness Areas: Are wilderness areas, alone,sufficient to conserve and recover tortoises? The answer is no, for the following reasons.Wilderness areas encompass about 19 mi 2 of the 358 mi 2 (5.3%) area identified withhigher sign counts. Three of the wilderness areas (El Paso, Cleghorn Lakes, and SheepholeValley) encompass 153 mi 2 that are outside proposed DWMAs, and include 39% of allwilderness acreage in the planning area within the 2002 tortoise range. Cumulatively, wildernessareas within the range encompass 391 of 11,134 mi 2 , or 3.5% of the potentially occupied tortoisehabitat in the planning area. The 358-mi 2 area represents about 15% the size of the fourproposed DWMAs, and as given above, only 205 mi 2 (61% of wilderness areas) occurs inDWMAs, which is about 8.8% of that entire area. It would appear that the Grass Valley area hasalready been affected by die-offs within and adjacent to that region, and Black Mountain is inimminent harm’s way, assuming spread of disease from adjacent areas. Given the prevalence ofcarcasses, Grass Valley may serve as an excellent location to conduct head starting studies.De facto tortoise protection in wilderness areas relies on the assumption that there are noroads and therefore no threats to tortoises. This is a false assumption for several reasons. First,not all tortoise mortality is caused by impacts associated with dirt roads. Tortoises in wildernessareas are still susceptible to raven and feral dog predation, various diseases, and catastrophic dieoffsthat cannot be readily explained, although disease, drought, and/or synergistic effects havebeen implicated. Second, there are still known adverse human uses, even without roads. Sheepgraze the Golden Valley Wilderness Area, and vehicular trespass is considered to be a seriousproblem in places.Chapter 3 3-141
BLM Areas of Critical Environmental Concern: Thirty ACECs are found within the<strong>West</strong> <strong>Mojave</strong> planning area. Table 3-31 lists each ACEC, its size, focal protected resource, itslocation relative to the 2002 Tortoise Range Map, and the relative protection it provides [adoptedfrom Current Management Situation (BLM 1999)].ACECAfton CanyonSIZEACRESTable 3-31Tortoise Conservation Provided by ACECsFOCUS OFCOMMITMENT8,160 Riparian habitat,raptors, bighorn, scenicvalues.SPATIAL LOCATIONRELATIVE TO 2002TORTOISE RANGEFully within range, butfocal area is canyon ratherthan surrounding bajadasRELATIVEPROTECTIONAFFORDED BYEXISTING ACECMANAGEMENTHigh. Routes aredesignated and mineralwithdrawals are in place.Cattle grazing remainsoutside riparian zone.Amboy Crater 679 Geologic landmark Marginal tortoise habitatwith little direct protectionBarstow WoollySunflower314 Botanical resources,Barstow woollysunflower in particularFully within rangeExcellent protection fromhuman impacts byperimeter fenceBedrock Springs 785 Prehistoric values Tortoises and habitatsubject to OHV impactsfrom adjacent SpanglerHills Open AreaBig MorongoCanyon28,274 Riparian habitat. South of range N/A, outside known rangeCronese Basin<strong>Desert</strong> TortoiseResearch NaturalArea10,226 Marsh, riparian, andlacustrine habitats.25,695 <strong>Desert</strong> animals andplants, <strong>Desert</strong> Tortoisein particular.Fully within rangeFully within the 2002Tortoise RangeHigh. Routes aredesignatedExcellent protection fromhuman impacts byperimeter fenceFossil Falls 1,667 Prehistoric values Within the northern portionof the range where tortoisesare relatively less commonGreat Falls Basin9,726 Riparian habitat, InyoCalifornia towheeEastern and southernportions of ACEC barelywithin rangeHarper Dry Lake 475 Marsh habitat Within range; 363 of 480acres (76%) is non-habitaton the dry lake bedJawbone/Butterbredt 187,486Riparian and wildlifevalues.At the western edge ofrangeMostly north and west ofthe range.Does not protect tortoisehabitat.Little protection, and 80%of the ACEC is outside therangeJuniper Flats 2,528 Cultural values South of range N/A, outside known rangeLast ChanceCanyon5,913 Prehistoric and historicvaluesNot well protected fromvehicle disturbanceChapter 3 3-142
ManixACEC<strong>Mojave</strong> fishhookcactusRainbow BasinSIZEACRESFOCUS OFCOMMITMENT2,897 Paleontological andcultural valuesSPATIAL LOCATIONRELATIVE TO 2002TORTOISE RANGERELATIVEPROTECTIONAFFORDED BYEXISTING ACECMANAGEMENTRemote area with fewtortoises628 Botanical Unfenced ACEC is subjectto heavy impacts fromsheep grazing andmotorcycle use in theBrisbane Valley19,480 Geologic features,wildlife species (deserttortoise)Fully within range, verynear Mud Hills/ WaterValley concentration areaModerate. Routes aredesignated, but off-roadtravel still occursRed Mountain717 Prehistoric values UnknownSpringRodman Mountains 6,204 Cultural Resources Mostly within wildernessCultural AreaRose Spring 859 At northern edge of range UnknownSand Canyon 2,338 Riparian habitat and <strong>West</strong> of rangeN/A, outside known rangewildlifeShort Canyon 1,100 Riparian habitat, <strong>Plan</strong>ts <strong>West</strong> of rangeN/A, outside known rangein particularSoggy Dry LakeCreosote RingsSteam WellTrona PinnaclesUpper JohnsonValley YuccaRings<strong>West</strong> RandMountains*186 Ancient vegetation Within the known range,but inside open area, whichdegrades habitat and resultsin tortoise crushing4,05541 Historic and prehistoricvaluesScenery and geologicalfeaturesLittle protection in this areawhere die-offs may haveeliminated many tortoisesVery marginal habitat;tortoise present subject toimpacts from adjacentSpangler Hills Open Area353 Ancient vegetation Tortoises and occupiedhabitats threatened by usein Johnson Valley OpenArea, which surrounds thisACEC29,440 Species specific, deserttortoiseFully within rangeMajor problems withcompliance on OHV travelhave been identified.Whitewater Canyon 16,381 Wildlife N/A, <strong>West</strong> <strong>Mojave</strong> portionof ACEC is at upperelevations, out of range* Signed by CDFG under Federal Authority of the Sikes Act.Chapter 3 3-143
Existing ACEC protection ranges from very high protection at fenced sites (i.e., DTNAand Barstow Woolly Sunflower ACECs), to very little or no protection (i.e., Harper Lake and<strong>West</strong> Rand Mountains ACEC), to being inapplicable because the ACEC is outside the range.Only the DTNA is expressly managed for tortoise conservation; there are few formal ACECmanagement prescriptions that provide for more protection than other regulations (habitatmanagement in BLM habitat categories, USFWS critical habitat, under FLMPA).3.3.3 Mohave Ground Squirrel3.3.3.1 Mohave Ground Squirrel RangeDistribution: The entire known range of the Mohave ground squirrel (MGS) is withinthe planning area (Map 3-15) except for a very small area northeast of Searles Valley, in theNEMO planning area. The known range (Gustafson 1993) is bounded to the south by the SanGabriel and San Bernardino mountains, to the east and southeast by the <strong>Mojave</strong> River, to thewest by Palmdale and Lancaster 22 , to the west and northwest by the Sierra Nevada, to the northby the Coso Range and Olancha, and to the northeast by the Avawatz and Granite mountains onthe Fort Irwin National Training Center.The MGS has apparently been eliminated from Lucerne Valley (Wessman 1977), whereit was first trapped (at Rabbit Springs) in 1886. The most recent (1993) range map no longerincludes the western portion of the Antelope Valley east to Highway 14 between Palmdale and<strong>Mojave</strong>, an area previously considered within the MGS’s range (CDFG 1980). No new datacollected since 1993 support either extensions or reductions of the known range.The known range of the MGS is probably associated with elevation, rainfall patterns,temperature, suitable plant communities and substrates, topographical barriers, and other factors.In reviewing available records, Gustafson (1993) found that the highest known elevation was at5,600 (1,728 meters) feet on China Lake NAWS (Michael Brandman Associates 1988). Laabs(1998) reported the highest known elevation at about 5,000 feet (1,524 meters), which occurredalong the eastern slope of the Sierra (Freeman Canyon, Bird Spring Canyon, and JawboneCanyon). The California Natural Diversity Data Base (CNDDB) has reported them from anelevation range of 1,800 to 5,000 feet (548-1524 meters).Rainfall patterns, temperature, and plant communities are interrelated and influenced byelevation gradients. Gustafson noted that the northwestern portion of the ranges of both theMGS and Joshua trees are coincident near Olancha. Most of the 30 plant communities where theMGS has not been observed are associated with relatively higher elevations or are outside therange (LaRue, 1998 unpublished data). The northeastern part of the range, on Fort Irwin, may belimited due to rainfall and/or topographical barriers such as mountains, major washes, dunes, anddry lakes (Gustafson 1993). Gustafson suggested that lakes of the Pleistocene era might haverestricted the current range from extending east of the <strong>Mojave</strong> River and north of the OwensValley.22 Laabs (1998) found no records for the Antelope Valley west of Palmdale and <strong>Mojave</strong>.Chapter 3 3-144
Range of Mohave Ground SquirrelN190I n y o C o395178K e r n C o14395155814S a n B e r n a r d i n o C o40156613818L o s A n g e l e s C o24762LegendCounty LinesHighways<strong>Plan</strong> BoundaryMGS RangeR i v e r s i d e C o10/14/04<strong>West</strong> <strong>Mojave</strong> <strong>Plan</strong> <strong>FEIR</strong>/SMap 3-15Scale: 1 : 1,750,0000 10 20 30Km0 10 20 30Miles
Gustafson (1993) indicated that local populations of the MGS might disappear inresponse to prolonged drought, but that under natural conditions, it is likely that such areas canbe repopulated. He concluded, “There is no reason to believe that this pattern of extirpation andrepopulation has not occurred for thousands of years in the range of the Mohave GroundSquirrel.” What has changed, however, is pervasive and persisting human occupation of MGShabitat, particularly through the southern portion of its range from Palmdale to Lucerne Valley(WMP data). Although there are no historic records for the MGS west of Palmdale andLancaster, Gustafson (1993) indicated that it is likely that the species once occurred west ofPalmdale due to suitable plant communities (prior to their elimination for agriculture),topographies, and elevation.Trends: Brooks and Matchett (2001) provide the latest statistical summary of MGStrapping success and potential trends. They reported that there had been 1,353 individualsquirrels, found at 264 sites, between 1886 and 2000 that had been reported to the CNDDB.They concluded that trapping success had declined across most of the known range since themid-1980s, and that this decline was not associated with decreased rainfall.Their final conclusion was given as follows, “Recent attempts to locate populations fornew studies have been hampered by low trapping success, even during a period in which winterrainfall was adequate for reproduction and survival (Leitner 2000) and at sites where Mohaveground squirrels were previously abundant from the mid-1970’s through the early 1980’s. Theresults of others (Leitner 2000), coupled with the decreased trapping success since the mid-1980’s that was documented in the current study, have heightened concern that the Mohaveground squirrel may be undergoing a long-term decline in abundance.”3.3.3.2 Life History 233.3.3.2.1 Species DescriptionThe MGS is one of two members of the subgenus Xerospermophilus, which also includesthe round-tailed ground squirrel (Spermophilus tereticaudus) of the eastern <strong>Mojave</strong> and Sonorandeserts (Hall 1981; Nowak 1991). The MGS measures 8.3-9.1 inches (210-230 mm) in totallength, 2.2-2.8 inches (57-72 mm) in tail length, and 1.3-1.5 inches (32-38 mm) in hind footlength (Hall 1981), which helps differentiate it from the smaller antelope ground squirrel(Ammospermophilus leucurus) and the considerably larger California ground squirrel(Spermophilus beecheyi). Of these four species, the MGS is the only one found entirely withinthe western <strong>Mojave</strong> <strong>Desert</strong>.23 Unless otherwise noted, most of the following information is taken from the species account providedfor the <strong>West</strong> <strong>Mojave</strong> planning effort by long-time MGS trapper, David Laabs, of Biosearch Wildlife Surveys, SantaCruz, California (referenced as Laabs 1998). Many of the supporting documents were originally cited in Laabs(1998), and are herein included in the literature-cited section.Chapter 3 3-146
3.3.3.2.2 Seasonal ActivityThe MGS exhibits a strongly seasonal cycle of activity and torpor (like hibernation),emerging from dormancy as early as January, but more typically in mid-February or March(Leitner and Leitner 1996). Dates of emergence appear to vary geographically. Males typicallyemerge one or two weeks prior to females (Recht, pers. comm.). Once a sufficient amount of fathas been accumulated, individuals enter a period of aestivation and hibernation (Bartholomewand Hudson 1961). Aestivation generally begins sometime between July and September, butmay begin as early as April or May during drought conditions (Leitner, et al., 1995).MGS population dynamics are dependent on the amount of fall and winter precipitation(Leitner and Leitner 1996). The failure to reproduce may result in dramatic population declinesand, if poor conditions persist for several seasons, may become extirpated from a given area.This may be especially true in less optimal habitats. Therefore, entirely suitable habitats can beunoccupied during some years and become reoccupied in others.3.3.3.2.3 Substrate Affinities and Burrow UseThe MGS generally occurs in flat to moderate terrain and is not found in steep terrain.Substrates in occupied habitats have ranged from being very sandy to, less frequently, very rocky(Best 1995, Wessman 1977). For example, of 102 transects surveyed in 1998 (see below) wherethe MGS had been previously detected, 91 (89%) were identified as predominantly sandy and 11(11%) were identified as being rocky. The MGS is considered to be absent, or nearly so, on drylakebeds, lava flows, and steep, rocky slopes (Clark 1993), although juveniles may dispersethrough such areas (Leitner, pers. comm. in Laabs 1998), probably excluding larger playas.Individuals may maintain several residence burrows that are used at night, as well asaccessory burrows that are used for temperature control and predator avoidance (Laabs 1998).Aestivation burrows are dug specifically for use during the summer and winter period ofdormancy (Best 1995), and often occur beneath large shrubs (Leitner et al. 1995).3.3.3.2.4 Home RangesHome ranges of adults vary between seasons and throughout a season, presumably inresponse to quantity and quality of food resources. The Leitners’ studies in the Coso Range haveindicated that there is considerable overlap in the home ranges of individual males and females,though there is no clear evidence that home ranges are defended (Laabs 1998). Juveniles aregregarious, initially staying close to their natal burrows. However, juveniles have demonstratedconsiderable dispersal abilities, having traveled up to four miles from their birthplace in a matterof a few months.3.3.3.2.5 ReproductionThe reproductive success of the MGS is dependent on the amount of fall and winter rains(Laabs 1998) and the new growth of annual forage materials that result. Leitner and Leitner(1992) hypothesized that a standing crop of about 1 gram per square foot may be necessary forChapter 3 3-147
MGS reproduction to occur. Leitner and Leitner (1996) found a clear correlation between falland winter precipitation and the number of juveniles appearing on the same plots in subsequentyears. Following low rainfall, annual herbaceous plants are not readily available, the MGS isunable to attain a minimum amount of body fat (identified by the Leitners as 180 g total bodyweight), and in such years the species forgoes breeding (Recht, pers. comm. in Laabs 1998;Leitner et al. 1995).The Leitners have consistently observed that in years of poor rainfall (i.e., less than 75mm since the MGS entered hibernation), the MGS foregoes reproduction in favor of attainingsufficient body fat to make it through the winter. This is likely a physiological adaptation toensure adult survival, and to avoid birthing young when resources are not sufficient for juvenilesto acquire necessary body fat to hibernate. Gustafson (1993) indicated that the “evolutionarystrategy of suspending reproductive activity and concentrating on gaining weight ensures thesurvival of the species (Leitner and Leitner 1990), as long as droughts are of short duration andsufficiently large areas of habitat exist.”MGS adults are solitary except during breeding, which occurs soon after emergence fromhibernation. Gestation lasts 28-30 days, at which time between 4 and 10 young are born perlitter. Juveniles emerge from natal burrows within four to six weeks, and begin to establish theirown home ranges by about mid-May. Mortality is high during the first year (Leitner and Leitner1996). Females breed in the spring if environmental conditions are appropriate, while males donot normally mate until two years of age (Leitner and Leitner 1996). Laabs (1998) indicated thatsex ratio is consistently female biased, with ratios as high as seven females for each male.3.3.3.2.6 DispersalJuveniles begin making exploratory movements away from the natal burrow by aboutmid-May to early June, and some individuals eventually make long-distance movements (Leitneret al. 1997). Recent radio-telemetry data suggest that females are more likely than males toremain near their natal burrows (Leitner et al. 1997). In 1997, the majority of radio-collaredjuvenile males moved greater than 0.6 miles (1 km.), up to a maximum of 3.9 miles (6.2 km.).Juveniles can apparently traverse steep terrain during dispersal (Leitner, pers. comm. in Laabs1998), and some are known to disperse 3-4 miles from their birthplace (Leitner 1998).The current, 2002 status of the MGS, in terms of numbers of individuals and amount ofoccupied habitat, is difficult to assess due to the limitations of available data. The data that areavailable, the potential associations between MGS historic occurrences and existing habitatcharacteristics, results of recent trapping studies, etc. are compared and discussed in thefollowing sections.3.3.3.3 Winterfat, Spiny Hopsage, and MGS OccurrenceIn the northern portion of its range, the MGS feeds on the leaves (in particular), seeds,and fruits of perennial plants (mostly shrubs) when annual plants are not available. Shrub speciesthat were consumed most often at the Leitner’s Coso study sites were spiny hopsage (Grayiaspinosa), winterfat (Krascheninnikovia lanata) and saltbush (Atriplex sp.) (Leitner and LeitnerChapter 3 3-148
1996). As herbaceous annuals appear in the spring, the MGS shifts to leaves, flowers, seedsand/or pollen of forbs (annual plants). Once the ephemeral forage disappears in a normal rainfallyear, the MGS resumes feeding on shrub parts until entering hibernation. If no ephemeral forageis available in a given season, the MGS subsists entirely on perennials.The Leitners have shown, through repeated observations employing consistent livetrappingmethodologies and fecal analyses, that winterfat, hopsage, and various saltbush species(genus Atriplex) are common components of the MGS diet in the northern part of its range, atCoso Hot Springs. They have demonstrated that winterfat and hopsage, in particular, comprise alarge part of the MGS’ diet during years when rainfall was below about 75 mm at their studyplots. They have hypothesized that these two plants may be critically important in allowing theMGS to attain 180 g body weight during dry years when preferentially selected annual plants areunavailable.It remains unknown, but is plausible, that these plants are equally important to the south.Dr. Anthony Recht (1977) found that MGS at Saddleback Butte in Los Angeles Countyconsumed substantial amounts of Russian thistle (Salsola tragus), which he found to have a veryhigh water content, and others have documented MGS feeding heavily on the seeds of Joshuatrees (Yucca brevifolia) (Laabs 1998). The Leitners have been very cautious to apply their Cosoresults to MGS foraging preferences elsewhere in the planning area, because their study sites arelocated within about 15 to 20 miles of the northern range boundary line. The comparisons givenbelow, however, suggest that there may be a relationship between the prevalence of these twoplants and the relative occurrence of (trappable) MGS elsewhere in the western <strong>Mojave</strong> <strong>Desert</strong>.Recent evidence suggests that winterfat and spiny hopsage may be important foragespecies well to the south of the Coso study sites. In 1998, 344 perennial vegetation transectswere surveyed both within the range to the south and in the Ord-Rodman DWMA, east of therange 24 (Map 3-16). Each transect surveyed during this “1998 survey” consisted of a ¾-mile,equilateral triangle. All perennial plant species within one meter of each transect were counted.Transect locations included:• 102 places where the MGS was previously observed (i.e., CNDDB, Debi Clark records,and 19 of 22 sites surveyed by Aardahl and Roush (1985) (the “Aardahl-Roush sites”);• 208 additional locations in “High” and “Medium” quality habitats 25 within the knownrange; and,• 34 sites in the Ord-Rodman area, located east, south, and northeast of the known range.24 Surveyors (transects given in parenthesis) included LaRue (237 transects), botanists Dave Fleitner (87), DaveSilverman (7), and R.T. Hawke (3), and by biologist Dave Roddy (10). Transects were surveyed in the spring andsummer of 1998. As indicated in the text, 34 transects were in the proposed Ord-Rodman DWMA).25 The 208 transects were systematically (rather then randomly) located at about two-mile intervals within the 1993polygons that CDFG and others identified as “High” and “Medium” quality habitats (although those designationshave since been dismissed; see U.S. Bureau of Land Management 2000).Chapter 3 3-149
Table 3-32 shows the relative abundance of perennial and annual plants, winterfat,hopsage, and saltbush observed during the 1998 Survey on the 102 sites with historic MGSrecords and the 208 additional sites within the known range. Numbers represent the number ofplants observed on a given (or average) transect.Table 3-32Comparisons Among Habitat Variables Observed Along 1998 Survey TransectsNUMBER OF PLANTSTransect Type102 WithMGS Records208 Without MGSRecordsPerennial<strong>Plan</strong>tsRange: 3 to 21Mean: 9.8Range: 2 to 19Mean: 10.6Annual<strong>Plan</strong>ts3 to 3819.57 to 4721.2Chapter 3 3-150Winterfat Hopsage Saltbush Hopsage &Winterfat0 to 458 0 to 164 0 to 463 1 to 164 / 1 to 45815.1 14.6 89.2 28.0 32.00 to 423 0 to 242 0 to 646 1 to 242 / 1 to 42323.3 21.0 82.2 36.0 40.0NUMBER (%) OF TRANSECTS WITH NO OCCURRENCES OF SPECIFIED PLANT102 With MGSRecords208 Without MGSRecordsN/A N/A 45(44%)N/A N/A 73(35%)38(37%)60(29%)51(50%)86(41%)24(23%)39(19%)These data suggest that the average numbers of winterfat and hopsage observed wereabout the same within each of the two transect categories (15.1 versus 14.6 and 23.3 versus21.0). The largest numbers of winterfat exceeded those of hopsage two times on 102 transects(211 and 458 for winterfat versus 164 for hopsage) and two times on 208 transects (367 and 423versus 242). This indicates, on average, that winterfat and hopsage may occur in similarnumbers on a regional scale, but that winterfat occasionally occurs in denser aggregations thanobserved for hopsage.In comparing the two data sets, relatively more winterfat and hopsage occurred on the208 transects than on the 102 surveyed at historic MGS locations. This is also reflected in therelatively lower percentages of the 208 transects where one or the other (or both) plants wereabsent. This is not clear evidence against the current hypothesis that these two plants (andprobably others) may be critically important to MGS survival. Far too many factors governMGS densities and distribution to fully understand the relationship between MGS and plantoccurrence. For example, there is no evidence that MGS was absent from the 208 transects,which were all within the range. With the exception of transects surveyed between Lancasterand Lucerne Valley, most transects occurred in suitable, potentially occupied habitats, wherethere have been recent and historic observations.In a memo dated 6 August 2002, Dr. Leitner indicated that 48 of these 310 transectsincluded occurrences of: (1) 100 or more winterfat, hopsage, or the two combined or (2) between50 and 99 of either hopsage or winterfat. He found that 33 of these 48 occurrences (69%) wereconcentrated in three specific areas: 12 (25%) in the Little Dixie Wash area, between the SierraNevada and Ridgecrest/Inyokern; 11 (23%) in the Cuddeback Dry Lake/Pilot Knob area; and 10(21%) in the Coolgardie Mesa/Superior Valley area). The remaining 15 transects with theconcentrations of these plants were generally scattered, with only five occurrences south ofHighway 58.
1998 Mohave Ground Squirrel TransectsN190I n y o C o395178K e r n C o14395155814S a n B e r n a r d i n o C o40156613818L o s A n g e l e s C o24762LegendCounty LinesHighways<strong>Plan</strong> BoundaryMGS Survey PointsR i v e r s i d e C o7/29/04<strong>West</strong> <strong>Mojave</strong> <strong>Plan</strong> <strong>FEIR</strong>/SMap 3-16Scale: 1 : 1,750,0000 10 20 30Km0 10 20 30Miles
The 1998 vegetation data were independently assessed to determine if these three regionsof MGS trapping success, compared to lower trapping success areas south of Highway 58,supported above-average occurrences of winterfat and hopsage 26 . The three regions and areassouth of Highway 58 are listed in the first column of Table 3-33. Regional averages were thendetermined (see footnote) to be 33 winterfat/transect and 28 hopsage/transect where at least oneof the two species was observed (as given in the footnote, transects without either of the plantswere excluded from the analysis; the number of transects with at least one of the plants are givenin the first column). The number and percent of transects reported in the second and thirdcolumns indicates the relative occurrences of these two species within each of the regions ofcomparison. MGS trapping success rates for the four areas were provided in Dr. Leitner’smemo, and are listed in the fourth column. Data are presented in descending order of theprevalence of the two plants, as expressed in percentages in the second and third columns.REGION (NO. OFTRANSECTS SURVEYED)Coolgardie Mesa/SuperiorValley (23 transects)Little Dixie Wash(15 transects)Cuddeback Lake/Pilot Knob(59 transects)South of Highway 58(117 transects)Table 3-33Comparisons Among Four Regions for Occurrence ofAbove-Average Numbers of Winterfat and/or HopsageNO. (%) TRANSECTSWITH MORE THAN 33WINTERFATNO. (%) TRANSECTSWITH MORE THAN 28HOPSAGE2002 TRAPPINGSUCCESS WITHINEACH REGION13 (56% of 23 transects) 15 (65% of 23 transects) 4 of 4 sites (100%)5 (33% of 15 transects) 4 (26% of 15 transects) 2 of 3 sites (67%)6 (10% of 59 transects) 15 (25% of 59 transects) 6 of 7 sites (86%)14 (12% of 117 transects) 3 (2% of 117 transects) 1 of 9 sites (11%)Vegetation sample sizes may be too small for meaningful statistical comparisons, but onecan see that these two plants were relatively more common in the three regions where more MGSwere trapped north of Highway 58 than to the south. When percentages are combined for thetwo plants within each region (in respective order given in the table), these plants were found on60.5%, 29.5%, and 17.5% transects in the three regions north of Highway 58, compared to only7% of the transects surveyed south of Highway 58. Dr. Leitner reported that MGS was capturedat 13 (56%) of the 23 sites listed in the table. Importantly, of the 13 sites where MGS wastrapped, 12 (92%) were located in the three regions north of Highway 58. MGS was trapped ononly 1 (11%) of the 9 sites located south of Highway 58.The average trapping success rate for the first three regions, which correspond to highincidences of winterfat and hopsage, was 84% compared to only 11% at the 9 sites surveyedsouth of Highway 58. This does not appear to be a sampling bias, as about 40% of the 2002trapping effort occurred south of Highway 58, where the lower success rate was observed.26 The methods used for this analysis were similar to those used to determine above-average tortoise concentrationsand vehicle-based disturbances. Using the 310 transects surveyed in 1998 within the range, all transects where nowinterfat or hopsage were found were dropped; the average numbers of these two species were then determined.The prevalence of these two plants within the two regions was then compared. Data were used for transects shownon Map 3-18, and included the three regions of higher trapping success and all transects south of Highway 58.Chapter 3 3-152
Finally, the 84% success rate was associated with areas where 87% of the high winterfat andhopsage abundance was observed; only 5 (13%) of 38 high abundance transects were foundsouth of Highway 58.One interpretation of these findings is that the MGS is somewhat more common insurveyed areas of abundant winterfat and hopsage north of Highway 58, and somewhat lesscommon in survey areas south of Highway 58. More studies are needed before firm conclusionscan be made. It is entirely possible that the MGS is less common south of Highway 58 forreasons other than lower abundances of winterfat and hopsage. For example, MGS may be lesscommon to the south due to relatively more human impacts, higher incidence of non-nativeannual species (which Dr. Leitner has suggested), or some unknown environmental factor.The 1998 survey also recorded the occurrence of saltbush, since the Leitner’s researchfound saltbush to be a recurring component in the MGS diet at the Coso study sites 27 . Fivedifferent saltbush species were observed, including Atriplex canescens, confertifolia, polycarpa,spinifera, and lentiformis. Based on these data and personal observation, saltbush was found tohave a similar pattern of occurrence as winterfat. Although the upper range for saltbush (646)was 1.5 times higher than that observed for winterfat (423), only 4 transects exceeded winterfat’supper range. Average saltbush occurrence was 3.5 to 6 times more concentrated than theaverage winterfat occurrence.Substrates for the 102 transects where MGS has been observed included 91 (89%) thatwere sandy and 11 (11%) that were rocky. For the remaining 208 transects within the knownrange, 188 (90%) were denoted as being sandy, while 20 (10%) occurred in more rocky areas.Leitner and Leitner (1989, 1990) found that sites with the highest incidence of the MGStrapped at Coso in 1988 also had the highest standing crop of annual plants. During the 1998studies (LaRue, unpublished data), as few as three and as many as 38 different species of annualplants were observed along the 102 transects surveyed at known MGS locations. Diversity ofnative species is also likely to be important to the MGS, and may be indicative of the relativelack of human disturbance in a given area. There are numerous places where OHV staging areas,sheep bedding and watering sites, and newly brushed pipeline corridors have either temporarilyor permanently eliminated both annual and perennial plants.Current Habitat Characteristics on the 19 “Aardahl-Roush Sites:” The Leitner’sCoso studies provided annually-collected data since 1989 in both low and high density MGSpopulations, and have shown consistent patterns in MGS foraging and seasonal activity relativeto rainfall. However, most trapping studies, including those of Aardahl and Roush (1985), rarelypersisted for more than three or four consecutive years (see U.S. Bureau of Land Management2000). Although the Aardahl and Roush (1985) survey was restricted to a single season, theytrapped the MGS on every one of the 22 sites they surveyed, which has rarely been repeated inrecent years. Table M-1 (Appendix M) reports their results, showing that they trapped as few as1 (DTNA site) and as many as 68 (Golden Valley) MGS at a given site. Their surveys provide27 Winterfat, hopsage, and saltbush are each members of the Chenopod family (often referred to as the “Goosefoot”family).Chapter 3 3-153
an excellent opportunity to compare current vegetation data with sites where multiple MGS havebeen observed.The 1998 vegetation data relative to 19 of the 22 Aardahl-Roush sites are given in TableM-1 (Appendix M). Surveys were conducted prior to the current widespread use of GPS units,which is true for most of the non-military surveys up until a few years ago. However, transectslocations were relatively more accurate because their 19 sites were delineated on 7.5’ USGSquad maps, as opposed to CNDDB records, for example, which specify that a given MGS recordoccurred somewhere within a 160-acre, quarter section.Aardahl and Roush (1985) trapped a total of 350 MGS on the 19 sites reported in TableM-1. Like many other studies, they did not differentiate between adults and juvenile MGS, socaptured animals may have either been resident or dispersing through the trap area. That theytrapped the MGS at every site is significant, when one considers recent trapping efforts onregional scales where no MGS have been trapped (see Brooks and Matchett 2001).The 1998 surveys found that creosote bush scrub was found at 12 (63%) of their sites,saltbush scrub at 5 (26%) sites, and blackbush scrub at 2 (11%) sites. Of the 350 MGS trappedin 1985, 235 (67%) were in creosote, 107 (31%) were in saltbush, and the remaining 8 MGS(2%) were found in blackbush scrub. These data reflect what was also found on a regional scalewhen the prevalence of plant communities was compared to historic reports of the MGS: theprevalence of MGS is proportionate to the prevalence of a given plant community (Table 3-34,below), both at a regional level and among the 19 sites trapped by Aardahl and Roush 28 .Winterfat and/or hopsage were observed on 14 (74%) of the 19 sites. On one of the fivetransects where winterfat and hopsage were not observed (Aqueduct South), 16 winterfat plantswere observed in adjacent areas, although none was observed along the transect. On two othersites (Bowman Road South and Kramer Hills), although there were no winterfat or hopsage,chenopods were well represented, with 294 and 141 saltbush found, respectively. Given theseand other observations, it is important to exercise caution in reviewing results, such as the onespresented herein, and applying them to management practices. For example, it would bepremature to identify “source areas” (i.e., areas where MGS persist during prolonged drought)based solely on the presence or prevalence of winterfat and hopsage. However, these results dosupport the hypothesis that chenopods (particularly winterfat and hopsage) may be important toMGS foraging ecology.28 One must exercise caution when accepting plant community designations, for example, like “creosote bush scrub”and “saltbush scrub,” because of the variability of shrubs comprising such communities. Creosote bush (Larreatridentata), from which the community derives its name, is necessarily a part of the so-named plant community, butis often not the most abundant plant. For example, on the 12 Aardahl-Roush sites that LaRue identified as creosotebush scrub, creosote bush was the most abundant plant only on 1 (8%) of the 12 sites. The dominant perennials inthe remaining 11 creosote bush scrub communities included burrobush (Ambrosia dumosa) at 10 (91%) sites andCooper’s goldenbush (Ericameria cooperi) at 1 (9%) site. Burrobush was also the most abundant perennial speciesat 2 (40%) of the 5 sites characterized as saltbush scrub.Chapter 3 3-154
LaRue characterized substrates at the 19 sites as “sandy” for 16 sites (84%) and “rocky”for the remaining three sites (16%). This is consistent with numerous reports in the literature,and with observations for the other 1998 survey sites.The abundance and diversity of annual plants is directly related to the amount and timingof rainfall and temperature. Although rainfall data were not analyzed for Aardahl-Roush’strapping effort in 1985 or for LaRue’s in 1998, the numbers of annual plants were similar.Aardahl and Roush reported between 12 and 33 annual plant species (average of 22 species) ontheir 19 sites, compared to between 3 and 38 species (average 19.5) on the 102 sites where MGShas been observed; there were between 7 and 47 species (average 23 species) in previouslyidentifiedmedium and high quality habitats.Ord-Rodman Winterfat and Hopsage Survey (1998): During the 1998 survey, 34transects were surveyed in the Ord-Rodman mountains area to see if winterfat and hopsage maybe associated with MGS occurrence (LaRue, 1998 unpublished data). This area is to the south,east, and northeast of the known. Either winterfat and/or hopsage were found on 14 (41%) of the34 transects. These 14 sites were associated with (from west to east) Highway 247 in StoddardValley, Highway 247 in Lucerne Valley (to south of Cougar Butte), and along Camp Rock Road(both north and south of the bend that is located east of the Maumee Mine). Neither species wasfound on the 11 eastern-most transects, which were surveyed along Bessemer Mine and BoxCanyon roads between Highway 247 and the Rodman Mountains. These data are insufficient toconclude that winterfat and hopsage are uncommon or absent from the region, but they appear tobe less common in the survey areas as one proceeds to the east.Neither winterfat nor hopsage were as common as they were on the 48 high abundancetransects found within the range. When the numbers of winterfat and hopsage are combined forthe Ord-Rodman area, only 1 (3%) of the 34 transects had more than 100 individuals (158 plantswere observed on one transect located along Camp Rock Road, south of the NewberryMountains). Two adjacent transects had the next highest combined counts of 81 and 68, andwere located within several miles of each other, along Highway 247, several miles west ofBessemer Mine Road.As such, only 1 (3%) of 34 transects surveyed in the Ord-Rodman area, outside theknown MGS range, had more than 100 plants per transect, compared to 48 (15%) of 310transects found within the range. It would appear, pending more study (particularly closer to theknown range in western Stoddard Valley and Brisbane Valley), that winterfat and hopsage maybe more prevalent within the known range.3.3.3.4 MGS Associations with Regional <strong>Plan</strong>t CommunitiesAs of July 2002, the CNDDB listed locations for 260 MGS occurrences; 252 of these arewithin the range and 8 are just outside; one of these is five or six miles east of Barstow, and wasprobably a round-tailed ground squirrel that was misidentified. Only the 252 records within therange are included in the following discussions. When these occurrences are compared to the 1996Chapter 3 3-155
vegetation map 29 within the range, one finds that MGS occurrences are directly proportional to theprevalence of plant communities. Table 3-34 compares the occurrence of MGS sightings to theprevalence of each plant community within the range.Table 3-34Occurrence Of 252 Mgs Records With 16 <strong>Plan</strong>t CommunitiesPLANT COMMUNITY NO. AND PERCENTOCCURRENCE OFMGSPERCENT OCCURRENCE OFCOMMUNITY WITHIN MGSRANGE<strong>Mojave</strong> Creosote Bush Scrub 136 (53.96%) 53.97%<strong>Desert</strong> Saltbush Scrub 50 (19.84%) 19.84%<strong>Mojave</strong> Mixed Woody Scrub 22 (8.73%) 8.73%Urban 15 (5.95%) 5.95%Agriculture 9 (3.57%) 3.57%Blackbush Scrub 4 (1.58%) 1.59%<strong>Mojave</strong> <strong>Desert</strong> Wash Scrub 4 (1.58%) 1.59%Hopsage Scrub 3 (1.19%) 1.19%Shadscale Scrub 2 (0.79%) 0.79%Alkali Seep 1 (0.39%) 0.40%<strong>Desert</strong> Sink Scrub 1 (0.39%) 0.40%Greasewood Scrub 1 (0.39%) 0.40%<strong>Mojave</strong> Wash Scrub 1 (0.39%) 0.40%<strong>Mojave</strong>an Juniper Woodland 1 (0.39%) 0.40%Playa 1 (0.39%) 0.40%Ruderal 1 (0.39%) 0.40%Total 100% 100%These data show remarkable similarities between MGS occurrence (locations collected since1886) and the prevalence of plant communities (determined in 1996) within the range. In fact, thepercent occurrence of MGS and plant communities is exactly the same (two points right of thedecimal point), even though these are independent data sets! These comparisons clearly indicate thatthe MGS is a generalist in terms of plant community preference; it is neither restricted to norconcentrated within any of the 16 plant communities where it has been reported; its occurrence isdirectly proportional to the occurrence of plant communities.These are very important findings with regards to MGS conservation. Historically, the MGSwas equally likely to occur in the 12 native plant communities (i.e., excluding Agriculture, Ruderal,and Urban communities, which are of recent origin, and Playa, which is likely an artifact of theanalysis, or the animal may have been dispersing). Although true that one cannot differentiatebetween resident and dispersing MGS, these observations suggest that the 12 native habitats withinthe range are equally important to support both resident adult animals and dispersing juveniles.29 The vegetation map used throughout Chapters 3 and 4 of this document was developed in 1996 by Tom and DebiClark. U.S. Bureau of Land Management 2000 describes the fieldwork and methods used to develop this map.Although it likely has some inaccuracies, and lacks the resolution of other recent vegetation community mappingprojects (e.g., at 29 Palms Marine Corps Base, Fort Irwin, and Edwards AFB), it represents the best scientificinformation available for the planning area.Chapter 3 3-156
There were no MGS occurrences in 28 of the 44 plant communities occurring within theplanning area. When combined, however, these 28 plant communities comprise only 7.4% of theplanning area, and are generally outside the known range. Three of the 28 plant communities, whichcomprise 4.2% of the 7.4%, are either not habitat (Playa at 1.7%) or mostly occur above theelevation range of the MGS (Semi-<strong>Desert</strong> Chaparral at 1.4% and <strong>Mojave</strong>an Pinion JuniperWoodland at 1.1%).The analysis also provides one means of measuring the relative impact of urbanization andagricultural development on historically occupied habitats. Recall that the data have been collectedsince 1886, and the “vegetation communities” given above were derived in 1996. Therefore, thecommunities include both native plant communities and type-converted communities (i.e., nativehabitats that have recently been replaced by manmade communities). As such, Urban communitiescurrently occupy about 6% and Agriculture communities occupy about 4% of the historical MGSrange. Excepting a few anecdotal accounts of MGS in such areas (see below), these data suggestthat about 10% of the native habitat has been converted to urban and agricultural uses, which areultimately not suitable for the species (Laabs 1998).3.3.3.5 ThreatsThis section provides a general discussion of threats and impacts that have been given inthe literature, and includes recent data for comparison. Except for the first section, whichdescribes human disturbances observed during the 1998 survey, the threats are presented inalphabetical order (as opposed to severity or importance of a given threat).Human Disturbances Observed During 1998 Vegetation Studies: During the 1998survey, biologists collected information on human disturbances observed along each of 310transects, including those located near previous MGS reports (102 transects) and those located inhigh and medium quality habitats (208 transects). Table 3-35 indicates the prevalence ofdisturbance types found along these transects 30 .30 "OHV” refers to cross-country vehicle tracks, which were created by trucks, motorcycles, and all-terrainvehicles. “Road” includes trails, and usually included routes passable by trucks. Sheep, cow, and dog sign wereusually feces. “Guns” does not differentiate between legal activities (e.g., hunting, regulated target practice, etc.)and illegal ones (e.g., shooting glass and articles at dump sites). “Dumps” generally required a vehicle to off-loadthe materials, so does not include litter. “Mines” may have included pits and adits, exploratory excavations, borrowpits, etc. “Ord” refers to military ordnance, which typically included spent cartridges and clips from aircraft. Twotransects occurred in areas previously burned. Most of the transects (237 of 310, 76%) were surveyed by LaRue, sosubjective determinations among surveyors is not considered a significant problem.Chapter 3 3-157
TotalTable 3-35Prevalence of 10 Types of DisturbancesObserved within the Known Range of the MGS During the 1998 SurveyTRANSECTSDISTURBANCE TYPESDisturbancesNoneYesOHV Road Sheep Gun Dump Cow Dog Mine Ord Burn Total310 168 142 145 116 56 23 20 20 12 6 3 2 403% of 310 transects 47% 37% 18% 7% 6% 6% 4% 2%
certain shrubs (e.g. winterfat) that are important in the MGS diet (Leitner and Leitner 1996)(Leitner et al. 1997).Gustafson (1993) indicated that, at that time, grazing was permitted on approximately2,106,000 acres (3,290 mi 2 ) of military and BLM lands within the known range. BLMauthorized cattle grazing on approximately 761,000 acres (1,189 mi 2 ) and sheep grazing on592,000 acres (925 mi 2 ) of potential MGS habitat (see Appendix M for a list of cattle and sheepallotments within the known range of the MGS, and a discussion of cattle grazing outside ofBLM allotments). Cattle may wander up to several miles beyond designated allotmentboundaries (see Appendix M).A total of 1,517,262 acres (2,370 mi 2 ) of BLM sheep allotments are actively being grazedwithin the known range, including 897,820 acres (1,403 mi 2 ) of public lands and 619,442 acres(968 mi 2 ) of private lands. On private lands, woolgrowers, or landowners giving thempermission, are required to obtain federal Section 10(a) permits if their activities are likely toresult in the take of tortoises. To date, there have been no such permits issued for sheep grazing.There is no discretionary action required by county or city jurisdictions for grazing on privatelands, so consequently there is no clear means of regulating this impact on private lands outsidesheep allotments.There are no region-wide data to show the incidence of sheep grazing that is notassociated with BLM allotments. However, because there exists the potential to graze in theseareas, the total sheep grazing area given above likely underestimates actual sheep grazing withinthe known range.Gustafson (1993) indicated that cattle may adversely affect the MGS by trampling andcollapsing burrows, and that sheep may compete for limited annual forage and severely tramplelocal areas. Sheep are generally grazed in the desert between late February and the middle ofJune (Gustafson 1993), which coincides with MGS emergence from hibernation (February) andthe entire activity period, particularly during very dry years when the MGS may enterhibernation in June. These are critical times for both adult and juvenile MGS to attain sufficientfat reserves to enter and successfully emerge from hibernation. The severity of impacts mayrange from marginal in lightly used areas to extreme at cattle troughs and sheep bedding areas.No consolidated data are available concerning the spatial locations of these impacts.Hybridization between Round-tailed Ground Squirrels and the MGS: Hybridizationresults when two different species interbreed to produce progeny that has genetic traits of eachspecies. Physiological, behavioral, and geographical barriers generally segregate two species.Physiological barriers, such as incompatible genitalia, different mating seasons (which alsosuggests behavioral segregation), and similar biological factors tend to remain the same, pendingevolutionary pressures. Geographical barriers may also take a long time to change (measured ingeological time frames), as is the case with the gradual disappearance of lakes that wereprevalent in the Pleistocene. However, some changes in habitat (often referred to as “typeconversion”) can occur in an instant, as when a parcel is bladed, or during several humangenerations (e.g., spread of agricultural development).Chapter 3 3-159
Both agriculture and mechanized military maneuvers have resulted in a gradual trendfrom coarser to finer substrates (Krzysik 1994; LaRue and Boarman, in prep.). When the naturalvegetative cover is removed for agricultural (and other) purposes, the soil is far more susceptibleto wind erosion than if left undisturbed. The potential problem with converting relatively coarsesubstrates to finer materials is that the MGS tends to prefer the coarser materials, compared tothe round-tailed ground squirrel, which prefers sandier substrates (Hafner and Yates 1983).Gustafson (1993) reports that the contact zone between the two species is approximately240 km (149 miles) between northern Fort Irwin and Victorville, with the <strong>Mojave</strong> River inbetween. MGS-round-tailed hybrids have been observed in the Helendale area (Wessman 1977;LaRue, pers. obs. 1997), adjacent to the <strong>Mojave</strong> River, and much of the river basin has beenconverted to agricultural fields (WMP data). Although agriculture is not likely to significantlyexpand outside the <strong>Mojave</strong> River, the Fort Irwin expansion would extend west into the knownrange of the MGS. If similar impacts are observed in the expansion area as has been documentedon the existing installation (i.e., conversion of gravelly soils to sandier soils; Krzysik 1994), thereis the potential for expanding preferred round-tailed ground squirrel habitat and reducing MGShabitat. If so, the potential for hybridization between the two species will be facilitated where itpresently may not occur.The only occurrences of hybrid (Wessman 1977) and suspected hybrid (Krzysik 1994;LaRue, 1997 pers. obs.) ground squirrels have been in the areas of Fort Irwin and Helendale.Gustafson (1993) reported that hybridization likely occurred in these areas due to ecological andbehavioral changes in one or the other species that resulted from agricultural disturbances in theHelendale area and military maneuvers at Fort Irwin. Dr. Recht (2001 pers. comm.) has recentlytrapped the round-tailed ground squirrel in the Superior Valley, 10 or more miles inside theknown range of the MGS. This suggests that there is potential for hybridization to occur wellinto the known range, and not just along the edges.Gustafson (1993), citing Hafner (1992) discussed the low vagility (the potential for ananimal to disperse) of the MGS, which results, in part, from the species being active for onlythree to four months of a given year. Hafner (1992) concluded that low dispersal potential, onthe local population level, may be on average about 5 m per year, and that this low vagilitywould preclude the MGS from rapidly expanding into suitable habitats where it was previouslyextirpated. Since that time, the Leitners have found that juvenile MGS may disperse up to fourmiles from their natal burrows in a given year. So, although dispersal abilities may be morepronounced than previously thought, the quality (including sandiness) of habitat may still limitrecolonization potential.Military Maneuvers: Military maneuvers may affect the MGS through direct mortality,crushing burrows (and animals within them), or decreasing shrub cover (Laabs 1998). Krzysikand Woodman (1991) reported that coarse-grain soils were pulverized by mechanized equipmentat Fort Irwin. Army maneuvers in the main corridors caused a reduction in the particle size,which led to dust storms and reduced human visibility to within several meters. China LakeNAWS reported that opening the <strong>Mojave</strong> B Range to Army maneuvers would create so muchdust (which they compared to that blowing south out of the Owens Valley) that the Navy’smission would have been compromised by this use (Range Systems Engineering Office andChapter 3 3-160
NAWS China Lake 1993). As discussed above, there is concern that sandy habitats resultingfrom new Army maneuvers in the Superior Valley may favor round-tailed ground squirrels at theexpense of the MGS, which tends to prefer relatively coarser sands. Gustafson (1993) also notedthat the residential areas of Edwards AFB, China Lake, and Fort Irwin (often referred to ascantonment areas) directly and indirectly affect MGS.Military maneuvers and their observable impacts vary dramatically. Edwards AFB hascantonment areas west of Rogers Dry Lake, and logistical support facilities occur west of Rogersand east of the northern end (Leuhman Ridge facilities) that have resulted in MGS habitat loss.China Lake has a limited cantonment area (Ridgecrest serves that function) and office area, sosupport facilities have resulted in minimal impacts to either the northern or southern ranges.Given that both installations practice air-to-ground maneuvers, with limited day-to-day grounddisturbance, most of the habitats are still intact and potentially occupied.At Fort Irwin, mechanized vehicles and ground troops create new ground disturbancesduring each exercise (albeit in previously degraded areas). Gustafson (1993) reported thatmilitary training had affected approximately 130,000 acres (203 mi 2 ) in the known range. Mostof the impacts are limited to areas below about 20% slope (LaRue and Boarman, in prep.), whichcoincides with the substrates most preferred by the MGS, where about 90% of 102 MGS recordshave occurred (LaRue, 1998 unpublished data). Approximately half of Fort Irwin [i.e., 353,644acres (552 mi 2 ) of the 1,000 mi 2 ] installation within the MGS range is below 20% slope, and istherefore susceptible to some of the heaviest maneuver impacts. Krzysik and Woodman (1991)noted heavy shrub losses from the main maneuver corridors at Fort Irwin.“Natural” Predators: Recently Dr. Leitner (pers. comm. 2000) indicated that commonravens might also prey on the MGS, although the evidence is anecdotal. He indicated that ravensare known to prey on Townsend's ground squirrels. In their Coso studies, the Leitners havefound radio collars of several of their study animals at known raven perch sites. The extent ofraven predation on the MGS is unknown. Although ravens are identified as a “natural” predator,they have also been referred to as a “subsidized predator” (Boarman 1993), and would probablynot occur at current population levels in the absence of human resources. No data were found inthe literature to indicate to what extent other predators (e.g., raptors, kit fox, coyote) may prey onthe MGS.Off Highway Vehicles: Off-highway vehicles may pose a threat to the MGS by crushingindividuals or burrows, and degrading habitats (Gustafson 1993, Laabs 1998). With time, theplant diversity and abundance decreases in areas with intense OHV use (Laabs 1998), whichreduces cover needed by the species for shade and forage. Gustafson (1993; citing Bury andLuckenbach 1977), reported that even light OHV use in the <strong>Mojave</strong> <strong>Desert</strong> can result in lost orcompacted topsoil, unavailability of seeds for birds and mammals, and disrupted soil mantles.Gustafson (1993) reported, “…it is known that the squirrel is run over by vehicle[s],” but did notprovide any specific reports.There is anecdotal evidence that the MGS may be killed on both paved and dirt roads,although it has been suggested that they are too quick for this to happen. For example, duringtortoise surveys conducted near Water Valley, northwest of Barstow, in 1998, LaRue crushed aChapter 3 3-161
juvenile male MGS on a dirt road as it attempted to cross in front of his truck. In 1997, LaRueobserved a juvenile male (likely a hybrid) as it was crushed on National Trails Highway, severalmiles north of Helendale. One of the nine MGS observed in 1998 (LaRue, unpublished data)darted into burrows that were located in the berms of a dirt road. The juvenile female wasobserved for about 20 minutes eating cryptantha alongside the road, and later using two differentburrows located in berms on opposite sides of the road. Recht (1977) also observed MGSfeeding on Russian thistle that was congregated along shoulders of roads in northeastern LosAngeles County.Goodlett and Goodlett (1991) have shown, in the Rand Mountains, that the heaviestvehicle impacts occur immediately adjacent to both open and closed routes. It is plausible, then,that individual MGS using resources adjacent to roads are more likely to be in harm’s way thanthose animals occurring in roadless areas. It is also plausible that juvenile MGS, which are mostlikely to travel longer distances than adults, are somewhat more susceptible to vehicle impactsthan adults. Although adults may still be susceptible to vehicle impacts within their somewhatfixedhome ranges, dispersing juveniles are likely to encounter more roads than an adult livingwithin a fixed region.The potential to crush squirrels likely increases as the prevalence and use of roadsincreases in a given region. Given the relatively higher incidence of cross-country travel in openareas (1998-2001 WMP data), vehicle impacts are more likely to occur there and other placeswith similar densities of cross-country tracks, depending on resident and dispersing populationsof the MGS. This would suggest that there may be relatively more impacts in the Spangler Hills,Jawbone Canyon, Dove Springs and El Mirage open areas, which occur within the range, butdoes not negate the possibility that impacts may also be prevalent in heavy OHV use areas, suchas occur in the vicinity of “Camp C” near the western end of the Rand Mountains.In Table 3-36, incidences of six vehicle-based disturbances observed between 1998 and2002 are compared between designated open areas and one heavy use area, between CaliforniaCity and the Rand Mountains. The first table lists data for trails, tracks, and litter; followed bytargets, hunting, and camping in the second table.The tables document the types of heaviest vehicle-based impacts observed within therange of the MGS in three open areas (excluding Olancha, which was not surveyed) and onehevy OHV use area. All vehicle-based impacts in these areas were above average, as describedin the tortoise section. The data include vehicle impacts both inside and outside the open areas,the latter of which are clearly associated with the vehicle impacts emanating from open areas(see Map 3-14).One can see that the Spangler Hills Open Area had the highest incidences of trails(19.3/mi 2 compared to 16.9/mi 2 at the next highest incidence at El Mirage), litter (39.1/mi 2compared to 21.0/mi 2 at El Mirage), and target shooting (18.0/mi 2 compared to 17.6 at JawboneCanyon/Dove Springs). El Mirage had the highest incidence of cross-country vehicle tracks (at120.7/mi 2 compared to Spangler Hills at 95.6/mi 2 ) and hunting areas (2.3/mi 2 compared to1.5/mi 2 in the heavy OHV use area).Chapter 3 3-162
Cumulatively, one finds there to be 274 mi 2 affected by above average trails, 324 mi 2impacted by tracks, 319 mi 2 by litter, 160 mi 2 by target shooting, 38 mi 2 by hunting, and 25 mi 2by camping. Tracks and trails are most likely to affect the MGS, as shooting has not beenidentified as a direct threat to the species. These impacts were most prevalent in the open areas,where this sort of activity will likely remain or increase under present and future management onthese class I lands.AREATable 3-36Prevalence of Vehicle-Based Disturbances in Four Areas of ComparisonSQUARE MILES, SUM, AND AVERAGE VEHICLE-BASED DISTURBANCESOBSERVED (1998-2002) IN THREE OFFICIAL AND HEAVY USE AREATrails Tracks LitterMi 2 Sum Ave Mi 2 Sum Ave Mi 2 Sum AveSpangler 121 2336 19.3 127 12140 95.6 121 4734 39.1El Mirage 19 322 16.9 19 2294 120.7 20 437 21.9Jawbone/Dove 24 370 15.4 22 406 18.5 22 381 17.3Cal. City/Rands 110 878 8.0 156 8162 52.3 156 3295 21.1Totals 274 3906 14.3 324 23002 71.0 319 8847 27.7AREA SQUARE MILES, SUM, AND AVERAGE VEHICLE-BASED HEAVY OHV USE AREATarget Hunting CampingMi 2 Sum Ave Mi 2 Sum Ave Mi 2 Sum AveSpangler 56 1006 18.0 12 13 1.1 7 18 2.4El Mirage 12 136 11.3 6 14 2.3 2 2 1.0Jawbone/Dove 16 281 17.6 1 1 1.0 2 5 2.5Cal. City/Rands 76 498 6.5 19 28 1.5 14 21 1.5Totals 160 1921 12.0 38 56 1.5 25 46 1.8Two of the 23 sites trapped for the MGS in 2002 included the El Mirage and SpanglerHills open areas (Leitner, pers. comm. 2002) where no MGS were trapped. However, theabsence of squirrels cannot be attributed to vehicle use in those two areas. El Mirage is locatedsouth of Highway 58, where no MGS were captured on eight of the nine trapping grids,including the one in the open area. Nor were any of the high concentrations of winterfat andhopsage identified in 1998 (LaRue, unpublished data) associated with either open area.Data show that there is a “spill-over” effect from the open areas, where relatively higherincidences of vehicle impacts were found in adjacent areas, compared to non-adjacent lands (seeMap 14). The prevalence of cross-country vehicle tracks north of El Mirage Open Area willprobably be reduced due to boundary fencing installed in the late 1990’s. Other areas, adjacent toJawbone and Spangler Hills, remain susceptible to open area-related impacts as no fences havebeen installed.Vehicle-based impacts may be prevalent in areas that are not adjacent to open areas.Within the MGS Conservation Area, these areas include lands within the Rand Mountains, westof Silver Lakes, within Kramer Hills, north of Hinkley, and southwest of Fort Irwin. Smallerareas also exist east and northeast of Fremont Peak, Fremont Valley, Iron Mountains north ofSilver Lakes, Superior Valley (one 4-mile region), and southeast of Harper Lake (see Map 3-17).Chapter 3 3-163
Vehicle Disturbances and MGS Habitat190N39517814395155814401513818LegendCounty LinesHighways<strong>Plan</strong> BoundaryMilitary LandsBLM Open AreasAbove-Average Vehicle Impact AreasMGS Range Boundary24710/14/04<strong>West</strong> <strong>Mojave</strong> <strong>Plan</strong> <strong>FEIR</strong>/SMap 3-17Scale: 1 : 1,250,0000 10 20 30Km0 10 20 30 Miles
Citing Bury and Luckenbach (1977), Gustafson indicated “One result [of OHV activity]is a reduction in the number of spring annuals in areas of off-highway vehicle use” and “…offhighwayvehicles detrimentally affect wildlife and creosote bush scrub habitat in the <strong>Mojave</strong><strong>Desert</strong>.” Brooks (1999a, 2000) found non-native plant species were more common alongsideroads, and that roads served as dispersal corridors for weed species. Weeds, in turn, providefuels that result in hotter fires and relatively larger burned areas. Non-native annuals serve tospread fires between shrubs far more readily than the native annual flora (Brooks 1999b).Gustafson (1993) indicated wildfires are probably hot enough to kill seeds, sprouting shrubs, andsquirrels within their burrows. He felt this was a temporary impact that would be remedied whenvegetation became re-established.Urban Development: According to some authors, the primary threat to the MGS isdestruction and degradation of its habitat (Laabs 1998, CDFG 1992). Habitat conversion notonly decreases the amount of available habitat, it also fragments the remaining habitat, isolatingpopulations from one another. Urbanization has resulted in the loss of considerable habitat,particularly surrounding the cities of Palmdale, Lancaster, Victorville and Hesperia. Urbandevelopment results in the direct loss of habitat, and likely has effects on surrounding nativehabitats, including increased numbers of domestic and feral cats and dogs. Dumping of refuse,abandoned vehicles, and other items is often most prevalent on undeveloped lands adjacent toresidential, commercial, and industrial development (Gustafson 1993; WMP data).Gustafson (1993) concluded: “No single small development threatens the squirrel’sexistence in the region, but the total cumulative impact is greater than the sum of the individualimpacts.” He reported approximately 165,000 acres (258 mi 2 ) of urban development and215,000 acres (336 mi 2 ) of rural development occurred within the known range as of the early1990’s. Numerous historic localities for the MGS are in areas that have been converted to urbanuses. For example, about 10% of the historic MGS range has been lost to urban (6%) andagricultural (3%) uses.The MGS is not absent from all urban areas. A recent observation occurred south ofHighway 138, near Pinyon Hills, and a second occurred near an aerospace industrial complexlocated adjacent to Palmdale (Becky Jones, pers. comm., 2002). In the first case, the site andadjacent areas are comprised of extensive tracts of undeveloped lands and those with relativelylight rural development. At the second site, there are about five to six contiguous square miles ofrelatively undeveloped land, but the entire area is surrounded by urban and agriculturaldevelopment.The MGS has also been observed in residential backyards in Inyokern (Peter Woodman,2000 pers. com.), and may be seen foraging on the golf course at China Lake (Tom Campbell,pers. comm., 2002). In 1991, Laabs (Tierra Madre Consultants, Inc. 1991) tentatively identifiedan MGS burrow in the edge of an agricultural field in northeastern Lancaster. One squirrel wasrecently trapped at the proposed Hundai facility south of California City, where the consultanthad identified habitats as being marginal (Michael Connor, pers. comm., 2002). In these lattercases, the sightings are adjacent to extensive areas of undeveloped lands.Chapter 3 3-165
Given these observations, the only certain areas of MGS extirpation within the range arethose that have been physically developed. Such areas include, but are not limited to, pavedroads and parking lots; residential, commercial, and industrial sites occupied by buildings,graded areas, and other areas where vegetation has been mechanically removed; solar facilities atKramer Junction and Harper Lake; and large mined areas (U.S. Borax, Rand Mining Company,portions of the Shadow Mountains located east of Edwards AFB).Although urbanization and its affiliated impacts are prevalent in the Palmdale/Lancasterand Victorville/Apple Valley/Hesperia areas (Aardahl and Roush 1985), other communitieswithin the range (e.g., Ridgecrest, California City,.) are also likely affecting MGS habitats.Whereas the MGS has been observed at the edge f urbanization (e.g., Barstow, China Lake golfcourse), it is unlikely that the species can persist for long in urban settings (Laabs 1998).Potential causes for the likely extirpation of the MGS from Lucerne Valley have includedagricultural development (Laabs 1998) and the expansion of the California ground squirrel(Spermophilus beecheyi) in the area (Wessman 1977). The isolation of MGS in Lucerne Valleyfrom the main portion of its range, located west and north of the Victor Valley, has also beencited (Gustafson 1993).Uncertainties with the MGS That Do Not Affect the <strong>Desert</strong> Tortoise: There aresignificant differences, in terms of detectability and distribution, between the tortoise and theMGS that warrant brief mention.• Detectability: The tortoise leaves behind evidence (scats, burrows, tracks, carcasses,courtship rings) that allows for detection that is not available with the MGS. Tortoisecarcasses and fragments may persist for as many as 20 years, and still allow for positiveidentification. This is not true for the MGS. As such, it is relatively straightforward todetermine occupied (or recently occupied) tortoise habitat. MGS detection, by contrast,relies on either observing or trapping animals, or occasionally finding road-killedsquirrels. For these reasons, nothing comparable to the relatively accurate tortoise rangemap could be developed for the MGS without a focused trapping survey. Even the 1993range reduction (Gustafson 1993) was based more on anecdotal information than onsubstantiated absence of the MGS west of Highway 14, in the Antelope Valley.• Records: MGS records have been maintained for more than 100 years. This historicinformation is not available for the tortoise, for which records have only been availablesince the mid-1970s (except for anecdotal accounts). This is critically important, as itallows for a MGS range map that shows both historical and current distribution, eventhough current distribution cannot be fully ascertained based on available data. Giventhese data, it is possible to determine what percent of the known and historic range hasbeen converted to urban, agricultural, and other uses.• Current Distribution: It cannot be emphasized enough that the entire known range ofthe MGS occurs within the <strong>West</strong> <strong>Mojave</strong>; all but a small part of that, which is locatednortheast of Searles Dry Lake, occurs within the planning area, west and north of the<strong>Mojave</strong> River. The tortoise occurs in four different states on millions of acres, whereasChapter 3 3-166
the MGS is restricted to about 7,000 mi 2 . The literature indicates that this is the smallestrange for any full species of mammal in the United States.Although it is not possible to produce a relatively accurate range map for the MGS, thisproblem is somewhat alleviated by available data. Several different studies corroboratethe hypothesis that the MGS is a generalist, equally likely to occur in creosote bush scrubas in saltbush scrub. Its distribution is likely restricted by elevation limits (i.e., probablynot above about 5,600 feet) and geomorphologic factors (i.e., absent from non-vegetatedplaya surfaces, and likely less common on steep, rugged terrain, although young MGSmay disperse through such areas).Implications for Conservation Strategy: Given this lack of information, any conservationstrategy must necessarily rely on protecting as much quality habitat within the range as possible,regardless of current occupancy. Available data suggest that local MGS populations follow a“boom and bust” cycle, where they expand into habitats when conditions are favorable, andshrink back into core areas when conditions are less favorable, particularly when conditions suchas drought occur over a several-year period. Therefore, one critical difference betweenconservation of the tortoise and that of the MGS is that proactive conservation measures for theMGS must be applied to its habitat; they cannot be applied to animals only, and still succeed.MGS conservation requires that a substantial portion of its known range is protected to allow fornatural fluctuations in local and regional populations in response to climatic factors, particularlywetter and drier conditions.3.3.3.6 Regulatory Protection of the Mohave Ground SquirrelAs a State-listed species with no federal status, there is limited regulatory protection forthe MGS compared to the tortoise. For example, although tortoise management programs atEdwards AFB and China Lake minimize habitat loss and degradation of MGS habitat, the AirForce and Navy are not obligated to manage the installations to preserve State-listed species.The CDFG has no habitat designation that is analogous to federally designated critical habitat.Even so, CDFG works closely with county and city jurisdictions to ensure that habitatsare assessed for potential impacts to the MGS. CDFG is also given the opportunity to reviewbase management plans for the three installations within the known range. Currently, privateproponents must trap a proposed development site to confirm absence of the MGS, or assumepresence, obtain a 2081 incidental take permit, and mitigate and compensate accordingly.MGS also receives protection in several existing parks, wilderness areas, and BLMcrucial habitat areas within the known range. These areas are managed in such a way that one ormore known impacts to squirrels and habitats is somewhat minimized. For example, none of theareas discussed below is likely to be developed for either urban or agricultural uses. These landsconstitute the most protected areas (outside military installations) within the known range.However, none of them is completely isolated from potential impacts to squirrels and habitateither. These areas include the following:Chapter 3 3-167
• Red Rock Canyon State Park: This 14,489-acre (22.6 mi 2 )state park is located in thewest-central portion of the known range. No grazing is allowed. There are centralizedlocations accommodating an unknown number of visitors each year, and remaining areasthat are only accessible to foot traffic. The park is situated adjacent to the Dove SpringsOpen Area, and is therefore vulnerable to impacts from OHV traffic. Managementactions have recently been implemented to minimize OHV impacts in the park.• Saddleback Butte State Park: This 2,795-acre (4.4 mi 2 ) state park is located within theknown range near its south-central boundary. The entire site is fenced, which minimizesdirect impacts associated with OHV activity and grazing, both of which are prevalent inthe region (LaRue, 2002 unpublished data). The community of Lake Los Angeles occursseveral miles to the south, and individual residences are immediately adjacent to the eastand north. Dogs and cats are both likely to affect any squirrels that may occur.• <strong>Desert</strong> Tortoise Research Natural Area: The 25,695-acre (40-mi 2 ) DTNA iscooperatively managed by the BLM and the <strong>Desert</strong> Tortoise Preserve Committee (DTPC)for desert tortoise conservation, which should also benefit the MGS. For example, DTPChas conducted an aggressive land acquisition program to acquire private inholdings. TheDTNA is completely fenced. The fence precludes sheep grazing, which is prevalent onthe surrounding lands. Occasional OHV trespass occurs when the fence is cut, but this isgenerally limited to one or several passes by the perpetrator. Sign count data indicate thattortoises within the fenced area are reproducing, but few subadult tortoises were observedin the larger, surrounding region. This suggests that the tortoise population receivesprotection within the fence that would also extend to the MGS, which like the tortoise, isexposed to extreme levels of sheep grazing and cross-country OHV travel outside thefence.• BLM Wilderness Areas: As shown in Table M-11 (Appendix M), there are a total of 18wilderness areas within then WMPA, which encompass 430 mi 2 within the MGS range.Six wilderness areas (274 mi 2 ) are fully within the range, five (478 mi 2 total) are partiallywithin the range (156 mi 2 are inside), and seven (604 mi 2 ) are fully outside the range.One (Malpais Mesa) is outside the WMPA, but partially within the range. Althoughthese areas are designated roadless areas, vehicle trespass occurs, some areas (GoldenValley) are sheep grazed, etc. Other uses, such as agriculture, urban development, etc.are precluded (see discussion in tortoise section for characteristics of these wildernessareas and impacts that continue to occur).Other BLM Special Management Areas: The 1980 CDCA <strong>Plan</strong> established threemanagement areas for MGS: Rose Valley <strong>West</strong>ern <strong>Mojave</strong> Crucial Habitat, and SuperiorValley. The CDCA <strong>Plan</strong> also identified Crucial Habitat for the MGS, which occurred within thethree MGS management areas and in two others as well: DTNA and Sierra-<strong>Mojave</strong>-TehachapiEcotone (see Table M-10, Appendix M). Cumulatively, these five areas encompassed about773,000 acres (1,208 mi 2 ), or about 16% of the 7,691 mi 2 range of the entire MGS range. TheCDCA <strong>Plan</strong>’s wildlife element identified management objectives, planned actions andimplementation needs, which are also given in Appendix M.Chapter 3 3-168
Habitat Management <strong>Plan</strong>s (HMPs) were to be prepared for each of the five areas, to befinished no later than 1987, with implementation occurring no later than 1989. Specificmanagement actions varied, as did long term goals, but each of the five areas had the long-termgoal of protecting, stabilizing, and enhancing resource values. During the early preparation ofthese HMPs, conflicts with some of the multiple use class guidelines were identified. Becausean HMP, unlike an ACEC, cannot override multiple use class guidelines, it was determined thatan HMP was not an effective tool for MGS management. Rather, a plan amendment would benecessary, to be implemented through the <strong>West</strong> <strong>Mojave</strong> planning process.Rand Mountains Fremont Valley Management <strong>Plan</strong>: The BLM completed a RandMountains Fremont Valley Management <strong>Plan</strong> (Rand <strong>Plan</strong>) in August 1993 (U.S. Bureau of LandManagement 1993), which included 65,020 acres (101.6 mi 2 ) of public lands 35 miles south ofRidgecrest and immediately north of California City. The area encompasses about 24,320 acres(38 mi 2 ) of previously designated MGS Crucial Habitat. The Rand <strong>Plan</strong> ranked the MGS assecond only to the desert tortoise on its list of the most sensitive wildlife resources in themanagement area. The Rand <strong>Plan</strong> called for: (1) amendment of the CDCA <strong>Plan</strong> to reflect aproposed 13,120 acre (20.5 mi 2 ) expansion of the Rand ACEC and a BLM multiple use classchange from class M to class L; (2) acquisition of private lands; and (3) a mineral withdrawal.To date, the CDCA <strong>Plan</strong> has been amended for the ACEC expansion and multiple use classchange; acquisitions of private lands and mineral withdrawal have not occurred. Facilitatingimplementation of the Rand <strong>Plan</strong> is considered a high priority for MGS conservation in the <strong>West</strong><strong>Mojave</strong> <strong>Plan</strong>.3.3.4 BatsSix species are addressed by the plan: long-legged myotis, California leaf-nosedbat, spotted bat, pallid bat, <strong>West</strong>ern mastiff bat and Townsend’s big-eared bat.Life History: The California leaf-nosed bat and Townsend’s big-eared bat are colonialcave dwellers thought to have declining populations. The California leaf-nosed bat is known tobe dependent on desert wash foraging habitat near the roosts. The Townsend’s big-eared bat isdependent on riparian habitat within five miles of the roosts.The spotted bat and western mastiff bat are cliff dwellers. In desert habitats, pallid batsroost mostly in rock crevices, although they might be found in tree cavities, old buildings, underbridges, in caves and mine adits, and mud tubes when these istes are available. The long-leggedmyotis is primarily a tree-dweller occurring at higher elevations than those found in the planningarea.Population Status in the <strong>Plan</strong>ning Area: All except one of the identified significantroosts are on public (NPS and BLM) lands. The Dale Mining District in the Pinto Mountains,including portions of Joshua Tree National Park, contains many shafts and adits known to harborbats of several species. Six significant roosts have been located, and the potential for severalmore is present. The largest roost known, containing over 10,000 bats of several species, isunder the Interstate 15 bridge at the <strong>Mojave</strong> River crossing. This site is currently underChapter 3 3-169
investigation. It may not be a significant roost for the six target species.The only identified cliff roosts for spotted bat are within Red Rock Canyon State Park.No roosts of western mastiff bat have been located, but roosts are suspected within Joshua TreeNational Park.Regulatory Status: BLM sensitive (except long-legged myotis), California Species ofSpecial Concern (except long-legged myotis).Threats Affecting Bats: The most serious direct threats to bats are disturbances ofhibernation and maternity roosts and destruction of roosting habitat, primarily old mines andnatural caves. Old buildings and bridges also provide roosts for some species. Loss anddegradation of foraging areas threatens certain species. Potential recreation impacts includeaccess to significant roosts and degradation of foraging habitat for Townsend’s big-eared bat andCalifornia leaf-nosed bat.3.3.5 Other Mammals3.3.5.1 Bighorn SheepLife History: Bighorn sheep were originally distributed from Baja California to Texas inthe south to the Canadian Rockies in the north, with the eastern boundary reaching westernNebraska and the western boundary in California extending from Mount Shasta in the north tothe crest of the central and southern Sierra Nevada to the Transverse Ranges and the east side ofthe Peninsular Ranges in the south. Traditional taxonomy dating back more than half a centurybroke bighorn sheep from the southwestern desert region into four subspecies, one of which, theNelson Bighorn (Ovis canadensis nelsoni), included bighorn from the Transverse Rangesthrough most of the desert mountain ranges of California, including the <strong>West</strong> <strong>Mojave</strong> planningarea, and adjacent Nevada and northern Arizona to Utah. Recent research indicates a lack ofsupport for Cowan’s (1940) desert subspecies and instead has found previously unrecognizednorth-south variation of the Nelson Bighorn. The transition between the southern (warm desert)and the northern (cold desert) forms occurs in the middle of the <strong>West</strong> <strong>Mojave</strong> planning area, withI-15 east of Barstow representing the approximate boundary. Within the <strong>West</strong> <strong>Mojave</strong> planningarea no populations north of I-15 persist that have not been reintroduced or augmented withsheep from south of I-15.Within the <strong>West</strong> <strong>Mojave</strong> planning area, 16 bighorn sheep populations are known to haveexisted as defined by mountain range complexes. Five of these 16 areas no longer containpopulations, three have been reintroduced, and two have been augmented with sheep fromanother population. For the past decade, bighorn sheep populations in California have beenviewed in a metapopulation context. Within the <strong>West</strong> <strong>Mojave</strong> planning area there are threemetapopulations whose geographic boundaries are now formed by major fenced highways (I-15and I-40) -- the south, central, and north <strong>Mojave</strong> <strong>Desert</strong> metapopulations (Torres et al., 1994,1996).Chapter 3 3-170
Basic to the biology of bighorn sheep is their agility on steep rocky terrain, an adaptationused to escape predators. Preferred habitat of bighorn is primarily on or near mountainousterrain above the desert floor.Radio telemetry studies of bighorn sheep in various southwestern deserts, including the<strong>Mojave</strong> <strong>Desert</strong> of California, have found considerable movement of these sheep betweenmountain ranges. This is especially true of males, but also of ewes. Within individual mountainranges, populations often are small. Levels of inbreeding could be high in such populations, butintermountain movements provide a genetic connection with a larger metapopulation, and thiswill counteract potential inbreeding problems.Surface water is another element of desert bighorn habitat considered to be important topopulation health. Male and female bighorn sheep inhabiting desert ecosystems can survivewithout consuming surface water, and males appear to drink infrequently in many situations ;however, there are no known large populations of bighorn sheep in the desert region that lackaccess to surface water.Population Status in the <strong>Plan</strong>ning Area: The majority of bighorn sheep herds arelocated on military bases, especially China Lake NAWS and Twentynine Palms MCAGCC.Additional populations are found in the Rodman and Ord Mountains (occasionally ranging westonto Sidewinder and Stoddard ridges), Newberry Mountains, and on the north slope of the SanBernardino Mountains. Much of the habitat is within designated Wilderness.Regulatory Status. BLM Sensitive.Threats Affecting the Bighorn Sheep: Potential threats to bighorn include loss ordisturbance of springs and waterholes, incremental loss of habitat, contact with domestic sheepthat can introduce disease, and blockage of linkages by roads, canals, or fences. Significantmountain lion predation in the San Bernardino Mountains is a threat. Vehicle intrusion intooccupied habitat, especially lambing areas, can be a minor threat.Rural development with fencing threatens corridors; one corridor formerly extendedthrough the city of Twentynine Palms. The bighorn traveling between the Pinto Mountains andthe Bullion Mountains on Twentynine Palms MCAGCC now travel through the SheepholeMountains (BLM, 2002). The dispersal corridor between the San Bernardino Mountains and theGranite Mountains is threatened by rural development in western Lucerne Valley. Miningoperations have not been shown to significantly impact bighorn numbers in the San BernardinoMountains, although the mines result in a loss of habitat, block access to water sources andpasture, and bring new disturbances into the permanent range. New cyanide heap leachingmines have the potential to harm bighorn if open water containing cyanide is present onoperations within bighorn habitat.Chapter 3 3-171
3.3.5.2 <strong>Mojave</strong> River VoleLife History. The <strong>Mojave</strong> River vole occupies moist habitats along the middle reaches ofthe <strong>Mojave</strong> River.Population Status in the <strong>Plan</strong>ning Area: The range of this subspecies is entirely withinthe <strong>West</strong> <strong>Mojave</strong> planning area. It is found in wetland and riparian habitats along the <strong>Mojave</strong>River between Victorville and Helendale. Additional potential habitat lies upstream ofVictorville towards Hesperia. Voles have been captured at Harper Lake, Edwards Air ForceBase near Piute Ponds and Rogers Dry Lake, and at China Lake Naval Air Weapons Station. It isunknown which subspecies these specimens are.Regulatory Status: BLM Sensitive, California Species Of Special Concern.Threats Affecting the <strong>Mojave</strong> River Vole: Habitat destruction and fragmentation dueto agriculture and urbanization are the primary threats. Concentrated off-highway-vehicle useand other surface-disturbing activities are also threats. Virtually all the potential habitat alongthe <strong>Mojave</strong> River, with the exception of the <strong>Mojave</strong> Narrows Regional Park, is in privateownership.3.3.5.3 Yellow-eared Pocket MouseLife History: This mouse inhabits the eastern slopes of the Piute Mountains and SierraNevada along the western fringe of the <strong>Mojave</strong> <strong>Desert</strong>. Little information is available regardinghabitat requirements except that it has been found in Joshua tree woodland, desert scrub, pinyonjuniper,mixed and montane chaparral, sagebrush and bunchgrass habitats. It occurs primarily insandy soils with sparse to moderate shrub cover with elevations of known localities rangingbetween 1030-1615 meters.Population Status in the <strong>Plan</strong>ning Area: Most of the range of the yellow-eared pocketmouse is within the <strong>West</strong> <strong>Mojave</strong> on the eastern slope of the Sierra Nevada and Piute Mountains.The species is known from Kelso Valley, Horse Canyon, Sage Canyon, Freeman Canyon, IndianWells Canyon and Sand Canyon. Similar habitat, which may harbor the species, is present bothnorth and south of this region, as well as in intervening canyons.Regulatory Status: BLM sensitive.Threats Affecting the Yellow-eared Pocket Mouse: Given the small range of theyellow-eared pocket mouse, any major disturbance of its known or suspected habitat could havesignificant deleterious effects. Cattle and sheep grazing pose a potential threat due to the effectson plant assemblages or erosion of soils. Off-highway vehicle activity and mineral extraction areother potential threats, due to their effects on native vegetation. Most of the canyons supportingthe species have roads and are therefore accessible. Wind-energy production also poses apotential threat, resulting from impacts associated with road networks.Chapter 3 3-172
3.3.6 Birds3.3.6.1 Bendire’s ThrasherLife History: This species breeds in desert areas containing cactus, <strong>Mojave</strong> yuccas, andJoshua trees.Population Status in the <strong>Plan</strong>ning Area: The primary distrubution of Bendire’sbreeding habitat in the WMPA extends as a discontinuous band in suitable habitat from JoshuaTree National Park to near Victorville. The most extensive documented populations are in JTNP.The planning area comprises a small portion of the total range, which extends east to the east<strong>Mojave</strong> and Arizona. The historical range in the <strong>West</strong> <strong>Mojave</strong> was considerably larger than atpresent, and the occupied habitat in 1986 consisted of six disjunct populations: 1) Yucca Valley;2) Kelso Valley; 3) Coolgardie Mesa; 4) Joshua Tree National Park; 5) SE Apple Valley; and 6)N. Lucerne Valley.Surveys conducted in 2001 failed to detect Bendire’s thrasher at most of these locationsor at a control site in the east <strong>Mojave</strong>. Only Coolgardie Mesa and Joshua Tree National Park hadnesting birds. The thrashers have been seen in abundance in the east <strong>Mojave</strong> in 2004.Regulatory Status: California Species of Special Concern.Threats Affecting the Bendire’s Thrasher: Identified threats include habitatdestruction through rural and urban development, off-road vehicle activity during the nestingseason, and removal of yuccas and cholla cacti. Grazing has shown both positive and negativeeffects on this species. Fragmentation of the small remaining populations is a serious long-termthreat.3.3.6.2 Brown-crested FlycatcherLife History: This neotropical migrant occurs in riparian woodland or forest dominatedby cottonwoods and willows, usually in a climax stage. The presence of woodpeckers or othercavity-excavating species is important. No data exist on the minimum area of riparian habitatrequired by brown-crested flycatchers.Population Status in the <strong>Plan</strong>ning Area: In the western <strong>Mojave</strong> <strong>Desert</strong>, this specieshas nested at the following localities: the <strong>Mojave</strong> River at Victorville (1-3 pairs annually),Cushenbury Springs (one pair in 1991), and Morongo Valley (1-2 pairs annually). It wasreported from Indian Wells Canyon June 18, 2001. Fifteen birds were seen in the <strong>Mojave</strong> Riverbetween Victorville and Helendale in 2000.Regulatory Status: California Species of Special Concern.Chapter 3 3-173
Threats Affecting the Brown-crested Flycatcher: Habitat destruction is the primarypotential threat to brown-crested flycatchers in the western <strong>Mojave</strong> <strong>Desert</strong>. Habitat destructioncan occur in several ways, with the most catastrophic losses resulting from clearing of largetracts of forest or woodland for agriculture, development, or flood control. Activities such aswood cutting for fuel or pumping of groundwater can degrade or destroy suitable breedinghabitat for this species.3.3.6.3 Burrowing OwlLife History: This species is found in level grassland, prairie or desert floor habitat. Ithas adapted well to locations on the urban fringe, such as flood control channels or agriculturalareas.Population Status in the <strong>Plan</strong>ning Area: Existing records of burrowing owls include53 records within the western <strong>Mojave</strong> <strong>Desert</strong>. These represent only a small sample of thelocations at which burrowing owls have recently been or currently are present. Of the 53records, 23 (43%) are from within Edwards Air Force Base; all of these have no specific localeor date. Of the other 30 records, only 13 have specific locales and dates. Probable or confirmedbreeding was noted at five locales.Regulatory Status: California Species of Special Concern.Threats Affecting the Burrowing Owl: Potential threats include direct mortality fromman (including vehicle collisions– this species has a high tolerance for vehicle disturbance, butthis causes high numbers of collisions), pesticide and rodenticide poisoning; habitat degradation,destruction and loss; and predators. Disturbance by vehicles at nest sites is a threat.3.3.6.4 Ferruginous HawkLife History: The ferruginous hawk can be found throughout the <strong>West</strong> <strong>Mojave</strong> inwinter, but it prefers agricultural areas where prey is relatively abundant.Population Status in the <strong>Plan</strong>ning Area: The ferruginous hawk is relatively abundantin winter in the Antelope and <strong>Mojave</strong> Valleys, and is occasional elsewhere, such as at <strong>Mojave</strong>Narrows Regional Park. Harper Dry Lake has been identified by the BLM as a Key Raptor Areafor ferruginous hawk.Regulatory Status: California Species of Special Concern.Threats Affecting the Ferruginous Hawk: Electrocution on electric transmission anddistribution lines is a potential problem. Shooting remains a minor threat.Chapter 3 3-174
3.3.6.5 Golden EagleLife History: This species uses rugged and remote mountain ranges for nesting;foraging over open desert in a range approaching 100 square miles.Population Status in the <strong>Plan</strong>ning Area: Golden eagle is widespread in mountainousareas of the planning area. The Argus Mountains, El Paso Mountains, Newberry Mountains, RedMountain and the southern Sierra Nevada Mountains contain several golden eagle nest sites.Within the China Lake NAWS <strong>Mojave</strong> B Range, the Eagle Crags provide outstanding habitat forgolden eagle. The Great Falls Basin area contains several nest sites.Where development has encroached on historical nesting sites, golden eagles sometimesmake new nests on electrical transmission lines, as in Adelanto.Regulatory Status: California: Fully Protected, Species of Special ConcernThreats Affecting the Golden Eagle: The three main threats to the Golden Eagle are: 1)shooting; 2) electrocution from electrical distribution and transmission lines; and 3) leadpoisoning from eating carrion with bullet fragments. Disturbance from vehicles or humanactivities at nest sites is a minor threat. Golden Eagle numbers are limited within the planningarea by the availability of nest sites. Protection of known nest sites is therefore the mosteffective method of preserving Golden Eagles in the planning area.3.3.6.6 Gray VireoLife History: This species is found on arid slopes dominated by short, densely branched,stiff-twigged shrubs. It is migratory, occurring in the western <strong>Mojave</strong> <strong>Desert</strong> from early Apriluntil mid-August.Population Status in the <strong>Plan</strong>ning Area: Gray vireos breed in small numbers at a fewsites on the southwest margin of the <strong>West</strong> <strong>Mojave</strong> planning area. In Los Angeles County onesinging bird was present in summer 1997 just west of the junction of Pallett Creek and Big RockCreek (elevation = 3800 ft.) near Valyermo. This is approximately 8 mi. (5 km) west of Bob'sGap (elevation = 4200 ft.), which was occupied by 1-3 pairs from 1981 to 1992. In 1985 anadditional territorial bird was found along Largo Vista Road, southeast of Pearblossom; this isapproximately 8 mi. (5 km) east of Bob's Gap.In San Bernardino County, gray vireos have bred consistently in the Round Valley/RoseMine area of the eastern San Bernardino Mountains (elevation = 6890-7870 ft.), and likely breedlocally in similar habitat elsewhere in those mountains. Territorial males were located in theupper Crystal Creek drainage, west of Cushenbury Canyon, in 1988; this is only 1-2 mi. (1.5-3km) south of the <strong>West</strong> <strong>Mojave</strong> <strong>Plan</strong> boundary. They formerly bred in chamise-dominatedchaparral in Cajon Pass. Egg sets were taken south of Hesperia, at the southern edge of the<strong>West</strong> <strong>Mojave</strong> <strong>Plan</strong> area, in 1937 and 1949. There were recorded breeding gray vireos at BlackRock Spring, Quail Spring, and Smithwater Canyon, all in the northern portion of Joshua TreeChapter 3 3-175
National Park.In Kern County gray vireos have bred on the west side of Walker Pass. There is a singlesight record of uncertain authenticity at Castle Butte, east of California City in 1977.Regulatory Status: BLM Sensitive, California Species of Special Concern.Threats Affecting the Gray Vireo: The reasons for the apparent decline of this speciesin southern California are unclear. Cowbird parasitism is a likely threat.3.3.6.7 Inyo California TowheeLife History: The Inyo California towhee is a narrow endemic whose range is almostentirely within the planning area. The USFWS has prepared a Recovery <strong>Plan</strong> and critical habitathas been designated. In 1998, an extensive survey of the entire range of this bird was conducted.The bird nests near riparian vegetation, including very small springs and seeps, andforages in mixed <strong>Mojave</strong> desert scrub. It ranges from 2680 feet to 5630 feet in elevation. Alltowhee sightings have been within 700 yards of a water source.Population Status in the <strong>Plan</strong>ning Area: This bird is restricted to the southern half ofthe Argus Range in Inyo County. The extent of occupied habitat has been estimated at 24,176acres. This figure does not include mountainous areas between nesting territories that may beused for dispersal or in the non-nesting season.Two thirds of the range of the Inyo California towhee falls within the boundaries of theChina Lake NAWS. Current management is compatible with conservation of this bird, and theResources Management <strong>Plan</strong> for the base will address conservation of this species. Theremaining one third of the range is managed by BLM and the CDFG. These agencies haveestablished the Great Falls Basin ACEC, the Argus Mountains Wilderness, and the Indian JoeCanyon Ecological Reserve.The 1998 survey and census of the Inyo California towhee detected a total of 640 adulttowhees, representing 317 breeding pairs and 23 single adults.LaBerteaux and Garlinger (1998) conducted an Inyo California towhee survey during the1998 breeding season. A total of 640 adult towhees representing an estimated 317 pairs and 23single adults were detected at 210 sites within the Argus Range. Prior to the 1998 survey, thetowhee population was estimated to be no more than 200 individuals. Along with an increase inthe numbers of birds detected, the 1998 census documented a range expansion 15 km to thenorth. Seventy-three percent of the population occurred on U. S. Navy lands, 25% on BLMlands on the east slopes of the Argus Range, and 2% on State-owned and private lands.Chapter 3 3-176
The towhee recovery plan established, as a criterion for delisting, the maintenance of apopulation of at least 400 birds for a period of five years. The 1998 survey was performed in anexceptionally wet year, and subsequent censuses have not been performed to determine if thehigh numbers observed then have been maintained.Regulatory Status: Federal Threatened, California Endangered.Threats Affecting the Inyo California Towhee: Destruction and degradation of habitatby feral burros and horses is a primary threat. Other potential threats include cattle grazing, offhighwayvehicle activities, mining, and encroachment by rural residents. Water exportation fromoccupied springs (Bainter Spring, Alpha Spring, Benko Spring, North Ruth Spring #3) is acurrent threat or potential threat. Trespass camping and hunting near the springs may impact thebirds and their habitat. Invasive exotic plants are present at some of the water sources that canreduce the quality of the nesting habitat.3.3.6.8 LeConte’s ThrasherLife History: The habitat for this species is creosote bush scrub with stands of chollacactus, Joshua trees, and thorny shrubs.Population Status in the <strong>Plan</strong>ning Area: LeConte’s thrasher is widespread throughoutthe planning area, favoring areas of cacti, Joshua trees, and desert washes. It is absent fromplayas and mountainous areas.Regulatory Status: California Species of Special Concern.Threats Affecting the LeConte’s Thrasher: The primary threat is loss of habitat andfragmentation of habitat into segments too small to support a viable population in the long term.LeConte’s thrashers are sensitive to vehicle traffic during the nesting season, especially off roadtravel in washes.3.3.6.9 Long-Eared OwlLife History: Riparian groves of willows and cottonwoods, stands of oaks in desertmountains, and dense stands of junipers are the preferred nesting habitat in the California desert.The long-eared owl disperses widely and can migrate long distances, and appears to exhibit lownest site fidelity. Therefore, protection of the woodland habitat is more important than protectionof individual nest sites. This species often nests communally in the winter, preferring densestands of trees, even plantings near human habitation.Population Status in the <strong>Plan</strong>ning Area: Long-eared owl has been found in severallocations in the Argus Mountains, and is known to nest at the largest riparian sites in the western<strong>Mojave</strong> <strong>Desert</strong>, including Big Morongo Reserve and <strong>Mojave</strong> Narrows Regional Park. Otherrecorded sites, presumably for nesting birds, are Leona Valley near Elizabeth Lake, and severalsites near Lancaster. It is not clear whether the majority of birds are winter visitiors. Mostrecords appear to be breeding. Communal winter roosts have been detected at Harper Dry Lake.Chapter 3 3-177
Regulatory Status: California Species of Special Concern.Threats Affecting the Long-Eared Owl: Flood control projects can impact or convertriparian habitat. Habitat degradation and disturbance at nest and roost areas are potential threats.This includes degradation of adjacent open foraging habitat. The increase of great horned owlsand their predation of long-eared owls may be having an impact. Shooting remains a minorthreat.3.3.6.10 Prairie FalconLife History: The prairie falcon is found throughout the western <strong>Mojave</strong> <strong>Desert</strong>,although it generally avoids urbanized areas. Nests are located on cliffs in rugged mountainranges, often within ½ mile of a water source. Mountain ranges near agricultural areas also arefavored because of increased prey density near nest sites. In winter, birds disperse widely, andare joined by migratory birds from northern latitudes.Population Status in the <strong>Plan</strong>ning Area: Prairie falcons are widespread inmountainous areas of the planning area. Three sites are recognized as high-density nestinglocations: Red Mountain/El Paso Mountains, Robber’s Roost, and Newberry Mountains/GraniteMountains. In addition, a substantial population has been reported from the <strong>Mojave</strong> B Range ofthe Naval Air Weapons Station.Regulatory Status: California Species of Special Concern.Threats Affecting the Prairie Falcon: Human disturbance at certain prairie falcon nestsites is a threat. Urbanization surrounding an historical eyrie gradually degrades the foraginghabitat and increases disturbance at the nest site so that they are abandoned. New miningprojects occasionally threaten selected nest sites. Eggshell thinning due to ingestion of pesticidesmay be a problem.3.3.6.11 Southwestern Willow FlycatcherLife History: The southwestern willow flycatcher breeds only in riparian woodland,typically adjacent to or even over water. Surface water or saturated soil is usually present in oradjacent to nesting sites during at least the initial portion of the nesting period.Population Status in the <strong>Plan</strong>ning Area: Summering willow flycatchers appear to beknown from only two sites in the western <strong>Mojave</strong> <strong>Desert</strong>:(1) At Big Morongo Canyon Preserve, one nesting pair in 1981. Subsequent years'regular study, however, failed to reveal any further resident willow flycatchers. The birds' use ofthe site is evidently only ephemeral.(2) Along the <strong>Mojave</strong> River. Since the specimen from Oro Grande in 1920, twoobservations: one at <strong>Mojave</strong> Narrows Regional Park in 1990 and the second about one-quartermile downstream (north-northwest) of the Interstate 15 crossing in 1994 and 1995.Chapter 3 3-178
Regulatory Status: Federal Endangered, California Endangered.Threats Affecting the Southwestern Willow Flycatcher: Habitat loss and degradationand brood-parasitism by the brown-headed cowbird are the biggest threats.3.3.6.12 Summer TanagerLife History: <strong>West</strong>ern populations of the summer tanager require riparian woodland orforest dominated by cottonwoods and willows, usually in a climax stage. Little quantitative dataexist regarding the composition of summer tanager habitat in the California deserts. Fivevegetation plots conducted within tanager territories at <strong>Mojave</strong> Narrows Regional Park in 1991revealed a canopy cover of 60-85%. The same plots had shrub cover from 1-23%, andherbaceous cover from 25-90%.Population Status in the <strong>Plan</strong>ning Area: Summer tanagers have nested at thefollowing localities within the western <strong>Mojave</strong>: Big Rock Creek near Valyermo (1-2 pairsannually, Little Rock Creek (1-2 pairs in the <strong>West</strong> <strong>Mojave</strong>, and 1-2 pairs on the adjacent AngelesNational Forest), <strong>Mojave</strong> River at Victorville (10-15 pairs annually), Cushenbury Springs (1pair, at least sporadically), Morongo Valley (2-4 pairs annually), and Yucca Valley (1 pairannually). A female or immature was observed at Camp Cady in August 1997, suggestingpotential breeding.Numbers along the <strong>Mojave</strong> River at Victorville have increased notably over the past 11years: from 3 or 4 pairs in 1987 to 12-15 pairs in 1996, and at least 12 pairs in 1997. In 2000, 15birds were counted in the <strong>Mojave</strong> River between Victorville and Helendale in an area notpreviously surveyed. The population at Big Rock Creek has remained stable since the early1980s at 1-2 pairs annually. Breeding at the golf course at Yucca Valley has been sporadic.Regular fieldwork has not been conducted at Cushenbury Springs, so the summer tanager'scontinuity there is not known.Regulatory Status: California Species of Special Concern.Threats Affecting the Summer Tanager: Habitat destruction is the primary threat tosummer tanagers in California. Habitat destruction can occur in several ways, with the mostcatastrophic losses resulting from clearing of large tracts of forest or woodland for agriculture,development, or flood control. On a smaller scale, activities such as woodcutting can degrade ordestroy suitable breeding habitat for this species. Groundwater pumping can gradually make theriparian habitats unsuitable.3.3.6.13 Vermilion FlycatcherLife History: This species occupies habitat with open riparian areas with accessiblewater and dominated by mesquite with willow and Fremont cottonwood. It uses parkland or golfcourse settings that support either native or non-native trees, and may or may not have accessiblewater. In native habitats, trees used for nesting range from massive cottonwoods, sycamores,and even oaks to smaller trees such as willow and mesquite.Chapter 3 3-179
Population Status in the <strong>Plan</strong>ning Area: The Vermilion Flycatcher breeds in manylocations in the <strong>Mojave</strong> <strong>Desert</strong>, almost all of which are well above 500 ft. elevation. Forexample, this species breeds regularly (up to 3 pairs) in Morongo Valley (San BernardinoCounty), at both Covington Park and the northern edge of the Big Morongo Canyon Preserve.Additional areas within the <strong>West</strong> <strong>Mojave</strong> where the Vermilion Flycatcher has recently nested areYucca Valley, San Bernardino County (up to 3 pairs from 1991 through 1999); Jess Ranch inApple Valley, San Bernardino County (1 pair in 1995 and 1997); Fort Irwin, San BernardinoCounty (1 pair in 1996); Ridgecrest, Kern County (1 pair in 1992 and 1994); China Lake, KernCounty (1 pair in 1994); Antelope Valley northwest of Lancaster, Los Angeles County (1 pair in1998); and Leona Valley, Los Angeles County (1 pair in 1994). In 2000, six birds (2 pairs and 2adult males) were found along a 1mile stretch of the <strong>Mojave</strong> River bounded by alfalfa fieldssouth of Helendale.Regulatory Status: California Species of Special Concern.Threats Affecting the Vermillion Flycatcher: The primary threat to the VermilionFlycatcher is habitat loss and nest parasitism by the Brown-headed Cowbird.3.3.6.14 <strong>West</strong>ern Snowy PloverLife History. The <strong>West</strong>ern snowy plover nests in the <strong>West</strong> <strong>Mojave</strong> on certain playas andwetland areas. Most appear to depart for the winter, but migrants and wintering birds are knownfrom a few localities. They favor playas, seasonal wetlands, and sewage treatment ponds orponds managed for wintering waterfowl.Population Status in the <strong>Plan</strong>ning Area: <strong>West</strong>ern snowy plover appears to nest withregularity on Edwards AFB at Piute Ponds. Other reported nest locations are Harper Dry Lake,Koehn Lake, China Lake, Rosamond Lake, Dale Lake, and the evaporation ponds at the Edisonfacility in Daggett, although the birds may not use these sites every year. A survey of nestingsites for this species at Searles Lake in 2001 recorded 14 broods of chicks and 2 nests were found(LaBerteaux, 2001). No plovers were detected at Koehn Lake in spring 2001 (Cunningham,2001). No plovers or habitat were detected at Superior Dry Lakeor at East and <strong>West</strong> CroneseLakes (Wehjte, 2001). Six plovers (five males, one female) were seen at Harper Dry Lake onMay 30, 2001, but none were seen on July 6. One pair was judged to be breeding at Harper DryLake. At least two pairs were reported to nest at Harper Dry Lake in 2003 and 2004. The birdmay use all of these sites in winter.Regulatory Status: California Species of Special Concern.Threats Affecting the <strong>West</strong>ern Snowy Plover: Nests are vulnerable to humandisturbance, including vehicle traffic and pets. Insufficient water supply to permanent andseasonal wetlands is a problem in many areas, including Harper Dry Lake. Rising water levelsthat inundate nests is a problem at managed ponds and during exceptional wet years at naturalplayas. They are very susceptible to predators, including ravens, coyotes, foxes and feral dogsand cats.Chapter 3 3-180
3.3.6.15 <strong>West</strong>ern Yellow-billed CuckooLife History: Yellow-billed cuckoos have one of the most restrictive suites of macrohabitatrequirements of any bird species. Not only are they restricted to a single habitat type, thesize and configuration of the habitat is also extremely important. During the breeding season inCalifornia, they are confined to cottonwood-willow riparian forest containing a tall canopy.Population Status in the <strong>Plan</strong>ning Area: While there are no records of nesting areaswithin the planning area, birds have been seen during the breeding season along the <strong>Mojave</strong>River between Victorville and Barstow. <strong>Desert</strong> oases, with willows and cottonwoods, couldprovide habitat for migrating yellow-billed cuckoos. One migratory bird was observed in 2001at upper Sand Canyon in Kern County.Regulatory Status: Federal Candidate, California Endangered.Threats Affecting the <strong>West</strong>ern Yellow-billed Cuckoo: The primary threat to this birdis riparian habitat loss.3.3.6.16 Yellow-breasted chatLife History: All breeding in the western <strong>Mojave</strong> <strong>Desert</strong> occurs in riparian habitatsdominated by cottonwoods and willows. Nesting habitat must have dense understory vegetationand larger trees that are used for singing perches.Population Status in the <strong>Plan</strong>ning Area: Yellow-breasted chats have nested at fivelocalities: the <strong>Mojave</strong> River at Victorville (6-10 pairs annually), Camp Cady (2 pairs in 1985),Morongo Valley (2-7 pairs annually), Cushenbury Springs (1 pair, sporadically), and AftonCanyon (1 pair in 1977).Yellow-breasted chats are uncommon to rare migrants throughout the <strong>West</strong> <strong>Mojave</strong>.They have not been reported during winter.Regulatory Status: California Species of Special Concern.Threats Affecting the Yellow-breasted Chat: Habitat destruction and parasitism bybrown-headed cowbirds are the primary threats to breeding yellow-breasted chats in the western<strong>Mojave</strong> <strong>Desert</strong>. Habitat destruction and degradation occurs in many ways, with the mostcatastrophic losses resulting from clearing of large tracts of forest or woodland for agriculture,development, or flood control. Groundwater pumping can also lead to loss of suitable nestinghabitat.3.3.6.17 Yellow WarblerLife History: In the California desert, yellow warblers occur in riparian woodland orforest dominated by cottonwoods and willows. This species nests in habitats with denseunderstory vegetation that contain cottonwoods and willows. Fremont cottonwoods and largerChapter 3 3-181
willows typically form the canopy at breeding sites such as Big Morongo Canyon and the<strong>Mojave</strong> River at Victorville.Population Status in the <strong>Plan</strong>ning Area: The yellow warbler has nested at only fourlocalities: the <strong>Mojave</strong> River at Victorville (8-12 pairs annually), Camp Cady (1 pair in 1985),Morongo Valley (1-6 pairs annually), and Big Rock Creek (1-2 pairs annually). Yellow warblerswere present and potentially breeding at several of the east Sierra Canyons in 2001.As a migrant, yellow warbler is common throughout the western <strong>Mojave</strong> <strong>Desert</strong>.Hundreds have been observed in mid-May at Butterbredt Spring; fall daily maxima in the samearea are typically between 50-100. It is casual during winter. Recent records exist for Arrastreand Grapevine Canyons south of Apple Valley and in the east Sierra Canyons of Kern and Inyocounties.Regulatory Status: California Species of Special Concern.Threats Affecting the Yellow Warbler: Habitat destruction and parasitism by brownheadedcowbirds are the primary threats to breeding yellow warblers in the western <strong>Mojave</strong><strong>Desert</strong>. Groundwater pumping in the <strong>Mojave</strong> River is a potential threat.3.3.7 Reptiles3.3.7.1 <strong>Mojave</strong> Fringe-Toed LizardLife History: The <strong>Mojave</strong> fringe-toed lizard in endemic to southern California and asmall area of western Arizona. This species is an obligate sand-dweller, found in dunes, sandfields, sand hummocks, and other sand deposits throughout the <strong>Mojave</strong> <strong>Desert</strong> in California. Itselevation ranges from 300 to 3000 feet. Its survival requires conservation of the blowsandecosystem processes, including the sand source, fluvial sand transport areas, aeolian sandtransport areas, wind corridors, and the occupied habitat.Population Status in the <strong>Plan</strong>ning Area: <strong>Mojave</strong> fringe-toed lizards occur at severaldisjunct localities in the planning area. Occupied habitat is found at the Saddleback Buttesregion of Los Angeles County, Edwards Air Force Base, El Mirage, <strong>Mojave</strong> River near Barstow,<strong>Mojave</strong> Valley, Alvord Mountain, Pisgah, Cronese Lakes, Dale Lake, Twentynine Palms, andHarper Dry Lake.Regulatory Status: California Species of Special Concern.Threats Affecting the <strong>Mojave</strong> Fringe-toed Lizard: Urban and rural development hasfragmented populations along the <strong>Mojave</strong> River and at Twentynine Palms. Agriculturaldevelopment has eliminated and fragmented populations in the <strong>Mojave</strong> Valley. These threatswill continue during the duration of the permit.Chapter 3 3-182
Other major threats are flood control structures which prevent the waterborne flow ofsand towards the occupied habitat, windbreaks that impede the aeolian transport of sand to theoccupied habitat and vehicle use within the occupied habitat.3.3.7.2 San Diego Horned LizardLife History: The San Diego horned lizard is endemic to southern California andnorthern Baja California, Mexico. This lizard prefers areas with loose, fine soils, an abundanceof open areas for basking, and plenty of native ants and other insects. Within the planning area,the San Diego horned lizard is restricted to juniper woodland, <strong>Mojave</strong> mixed woody scrub andchaparral habitats above 3,000 feet elevation.Population Status in the <strong>Plan</strong>ning Area: The San Diego Horned Lizard is found in theAntelope Valley California Poppy State Reserve, east along the base of the San Gabriel and SanBernardino Mountains to Joshua Tree National Park. This lizard is believed to be extirpatedfrom the <strong>Mojave</strong> River near Oro Grande and from many areas near Palmdale.Regulatory Status: California Species of Special Concern.Threats Affecting the San Diego Horned Lizard: Urban and rural development on thenorth slope of the San Gabriel Mountains is the primary threat to the long-term viability of thedesert populations. Increased predation by cats and dogs are a threat. Collection by collectorsand children has contributed to the decline in numbers of this species, and this threat maycontinue today. Off-road vehicles pose a potential threat, particularly at the <strong>Mojave</strong> Forks dam.The introduction of Argentine ants and their elimination of the native ant food base may becontributing to the decline.3.3.7.3 Southwestern Pond TurtleLife History: Pond turtles are found within and adjacent to perennial water, especially atlocations containing ponds. The turtles utilize adjacent uplands as well as the wetland habitats.Nest sites may be located several hundred feet from the water’s edge.Population Status in the <strong>Plan</strong>ning Area: The Southwestern pond turtle is found withinthe <strong>Mojave</strong> River in areas of permanent water, such as <strong>Mojave</strong> Narrows, Camp Cady, and AftonCanyon. It is known historically from Deep Creek at the southern edge of the planning area inthe San Bernardino Mountains. A relatively large population is found west of Palmdale at LakeElizabeth. It also occurs along Amargosa Creek and may occur along its tributaries.Potential habitat is found on public and private land in the Kelso Valley at the northwestboundary of the planning area. Additional potential habitat is located within the JawboneButterbredt ACEC and at Barrel Springs near Palmdale.Regulatory Status: California Species of Special Concern.Chapter 3 3-183
Threats Affecting the Southwestern Pond Turtle: The greatest single threat to thisspecies is habitat destruction. Urban and rural development on the north slope of the San GabrielMountains is the primary threat to the long-term viability of the Elizabeth Lake and AmargosaCreek populations. Urban and agricultural demands on the water sources are a threat for the<strong>Mojave</strong> River pond turtle locations. Collection by collectors and children has contributed to thedecline in numbers of this species. Bullfrog predation may impact populations.3.3.7.4 Panamint Alligator LizardLife History: The Panamint alligator lizard is found most often in canyons with riparianhabitat and nearby permanent springs. They forage in thick brush and along talus slopes wherethey may be observed basking on rocks in open areas, near thick vegetation.Population Status in the <strong>Plan</strong>ning Area: The Panamint alligator lizard is endemic toCalifornia, where it is known only from 16 disjunct localities in the Panamint Mountains(Brewery and Limekiln Springs, Surprise Canyon, Pleasant Canyon), Nelson Mountains(Grapevine Canyon), Inyo Mountains (Daisy Canyon, Lime Hill), and White Mountains(Batchelder Spring, Marble Canyon, Tollhouse Spring, <strong>West</strong>gard Pass) of Inyo County,California. Sight records (12) have been reported for the eastern Argus, Cosos, Panamint, Inyo,and White Mountains of Inyo and southeastern Mono counties, California.Surveys conducted in 2002 at the China Lake NAWS have located the Panamint alligatorlizard in the Argus Mountains at Mountain Springs Canyon. There are no verified records fromthe planning area outside of the China Lake NAWS.Regulatory Status: BLM Sensitive, California Species of Special Concern.Threats Affecting the Panamint Alligator Lizard: A potential decline in Panamintalligator lizard populations may be attributed to the direct loss of riparian habitat. Althoughthere are no baseline data that suggests a current decline in population numbers, habitat loss oralteration due to expanded mining operations, off-highway vehicle (OHV) activity, grazing(domestic and feral), and introduction of non-native invasive plant species (e.g., Tamarisk) couldhave serious adverse effects in riparian areas where this species occurs.3.3.8 <strong>Plan</strong>ts3.3.8.1 Alkali Mariposa LilyLife History: This species is most often found at the edges of alkali sinks and playas, infloodplains with alkali soils, and at alkali seeps and springs. The alkaline floodplain north ofLancaster and south and east of Edwards AFB appears to provide a large block of undisturbedhabitat for alkali mariposa lily. Sheet flooding of the flat terrain supports the plants, which areabundant in wet years. The saltbush scrub north of Highway 138 and west of EAFB has notbeen well surveyed.Chapter 3 3-184
Population Status in the <strong>Plan</strong>ning Area: The western <strong>Mojave</strong> <strong>Desert</strong> comprises themajority of the range of alkali mariposa lily, although the Kern River Valley east of LakeIsabella supports substantial populations. Within the <strong>Plan</strong>ning area are some very significantpopulations as well as smaller, scattered populations. Large numbers of alkali mariposa lilies areknown from Edwards AFB (>100,000 plants), Los Angeles County just south of the southwestcorner of Edwards AFB (10,000 plants), and Paradise Spring near Fort Irwin (2-3,000 plants).The Kelso Valley contains alkaline meadows supporting >2,000 plants in 1988. This area is asouthern extension of the Lake Isabella group of occurrences.Smaller populations of this species are known from Red Rock Canyon State Park andCushenbury Springs. Collections have been recorded from several playas and alkaline springsbetween EAFB and Fort Irwin, and one outlying population was recorded from TwentyninePalms in 1902. Many playas within the planning area have not been surveyed for this species.Regulatory Status: California Species of Special Concern.Threats Affecting the Alkali Mariposa Lily: Many occurrences are threatened withurbanization, especially the very large populations in the Amargosa Creek floodplain nearLancaster. Reduction of water supply to playas and alkaline floodplains could pose a threat.Maintenance of sheet flooding in the Rosamond Lake basin is essential, and the west part of thisbasin is becoming fragmented by agriculture and urban development. Lowering of groundwaterto alkaline springs and seeps is a potential threat. The next greatest threat is urbanization in theLancaster area where the largest populations are concentrated.Grazing is a potential threat to the plants on private ranch lands in the Kelso Valley.3.3.8.2 Barstow Woolly SunflowerLife History: This species is a western <strong>Mojave</strong> <strong>Desert</strong> endemic. It is found on bareareas with little soil, often containing a shallow subsurface caliche layer.Population Status in the <strong>Plan</strong>ning Area: Most known locations are between KramerJunction and Harper Dry Lake. The range of Barstow woolly sunflower, however, extends westof Kramer Junction and includes Edwards Air Force Base. It is also located east of Harper DryLake on the Coolgardie Mesa. The BLM has established a 320-acre ACEC for protection of thisspecies east of Kramer Junction. CDFG mitigation lands northeast of Kramer Junction arebelieved to support this species.Regulatory Status: BLM Sensitive.Threats Affecting the Barstow Woolly Sunflower: Populations are subject to removalwithin the utility corridor between Kramer Junction and Harper Dry Lake. Military operations atEdwards AFB could be a threat in the future. Current management at EAFB is compatible withprotection of this species. Off-road vehicle travel is a threat.Chapter 3 3-185
3.3.8.3 Carbonate Endemics (Cushenbury Buckwheat, Cushenbury Milkvetch,CushenburyOxytheca and Parish's Daisy)Life History: These species are restricted to limestone and dolomite substrates in theSan Bernardino Mountains at the southern edge of western <strong>Mojave</strong> <strong>Desert</strong>. The majority of therange of these species is on the adjoining San Bernardino National Forest. An extensivedatabase of localities and underlying land uses has been assembled in cooperation with theUniversity of Redlands.These species are substrate dependent; carbonate outcrops and soils on the north slope ofthe San Bernardino Mountains and conservation of habitat generally protects all species in theplant community. Parish’s daisy and Cushenbury milk vetch are found at lower elevations thanCushenbury oxytheca and Cushenbury buckwheat.Population Status in the <strong>Plan</strong>ning Area: Restricted to the north slope of the SanBernardino Mountains on carbonate substrates. The majority of the populations are on ForestService lands at higher elevations. The distribution of Parish’s daisy extends east to the Town ofYucca Valley.Regulatory Status: Federal Endangered – Cushenbury buckwheat, Cushenburymilkvetch, Cushenbury oxytheca, Federal Threatened – Parish's daisy.Threats Affecting the Carbonate Endemics: The primary threat is mining, which hasfragmented some existing populations and eliminated others. Existing regulatory mechanismsunder the mining law are inadequate to prevent fragmentation of populations. The extent ofmining claims covering the carbonate substrates limits the opportunities for conservation.Vehicle travel on occupied habitat is a minor potential threat and travel off roads could adverselymodify designated critical habitat.3.3.8.4 Charlotte’s PhaceliaLife History: Parish’s phacelia is a striking blue and white annual wildflower, aboutseven inches tall, blooming from April to June. The flower falls off before the fruits develop. Itis generally associated with naturally disturbed or unstable habitats such as loose sand, talus, andwashes, and is most often found on open, arid slopes ranging in elevation from 2,500 to 7,200feet. Population numbers fluctuate considerably from year to year, probably depending onrainfall.Population Status in the <strong>Plan</strong>ning Area: This species occurs in the high SierraNevada, its desert-facing foothills, and the adjacent El Paso Mountains, mostly from the foothillsabove Fremont Valley, north through Red Rock Canyon State Park, to east-facing canyons aboveIndian Wells Valley. The range is almost entirely within the planning area. Most documentedpopulations are near roads or trails in the lower canyons and washes, or are in high-interestnatural areas (e.g., Red Rock Canyon State Park). Several locations are associated with the LosAngeles Aqueduct and its various access roads. In view of the documented locations at the SierraNevada crest and on its lower slopes, it is likely that additional undocumented populations occurChapter 3 3-186
on the inaccessible mountain slopes above the foothills, washes, and lower canyons. Additionalpopulations also are likely to occur within the China Lake Naval Air Weapons Center.Regulatory Status: BLM Sensitive.Threats Affecting the Charlotte’s Phacelia: Most of the known populations are withingrazing allotments. Grazing is mentioned repeatedly in CNDDB records, but there appears to beno documentation of population declines in response to grazing. Other potential threats are offroadvehicles and wildflower collecting.3.3.8.5 Crucifixion ThornLife History: Crucifixion thorn is long-lived, thorny leafless shrub or small tree ofwashes and other sites where water accumulates. It is particularly characteristic of non-salinedry lakes. It is mostly restricted to outwash plains and reported not to occur on rocky slopes.<strong>Plan</strong>ts occur as scattered colonies of fairly small size that never extend far across the landscape.Fruits remain on the plant for long periods, up to several years, and may be distributed byvertebrate herbivores. The plants are dioecious, that is, male and female flowers occur onseparate plants.Population Status in the <strong>Plan</strong>ning Area: This species is disjunct from its primaryrange and is found in the sand fields and washes north and east of Pisgah Crater and southeast ofFort Irwin, where it forms a distinct community, termed crucifixion thorn woodland. Twopopulations are known in the western <strong>Mojave</strong> <strong>Desert</strong>, from the Pisgah area and 5 miles southeastof Fort Irwin. Three of the ten occurrences are on private land. Another site is located nearAmboy, just outside the planning area. A single plant was located near Newberry Springs duringthe 1999 tortoise surveys.Regulatory Status: No special status.Threats Affecting the Crucifixion Thorn: No significant human threats are known toexist. Some populations are, or were, somewhat impacted by OHV recreation, but the matureplants are large and stout enough that they are generally avoided. Seedlings could be damagedor destroyed by OHV activity.3.3.8.6 <strong>Desert</strong> CymopterusLife History: <strong>Desert</strong> cymopterus is a long-lived herbaceous perennial, which hasconspicuous purple flowers during early spring, but dies back completely aboveground in thesummer, fall and early winter. It survives drought by storage of food in its large taproot, and istermed a geophyte. Flowering and seed production appear to be episodic, with large numbers ofviable seed produced in wet years and little or no flowering and seed production in dry years.<strong>Desert</strong> cymopterus is generally found on sandy soil.Chapter 3 3-187
Population Status in the <strong>Plan</strong>ning Area: This species is a western <strong>Mojave</strong> <strong>Desert</strong>endemic, found from California City east to the Superior Valley and from the Cuddeback Lakearea south to near Kramer Junction. Early collections of this plant from Lucerne Valley,Victorville and Apple Valley are from areas now developed, and the most recent records datefrom 1941.<strong>Desert</strong> cymopterus is found in low densities and is widely dispersed. The vast majorityof known recent occurrences >90%) are from Edwards AFB. Several studies of utility corridorshave verified presence northeast of Kramer Junction on BLM and private lands, and additionallocations were detected in 200 and 2001 near Hinkley and in the Superior Valley, the latter onlands transferred to the Army for the Fort Irwin expansion. <strong>Desert</strong> cymopterus remains one ofthe rarest and least known of the <strong>West</strong> <strong>Mojave</strong> target plant species.The pattern of distribution of desert cymopterus suggests that it favors lands on the eastside of desert playas where blowsand has accumulated.Regulatory Status: BLM SensitiveThreats Affecting the <strong>Desert</strong> Cymopterus: Threats to the desert cymopterus are notobvious. Urbanization in the Victor Valley and utility development east of Kramer Junctionhave eliminated some plants or reduced available habitat. Off-road vehicle travel has been citedas a threat, but documentation of loss of plants is missing. Cattle and sheep formerly grazed inoccupied habitat, but livestock grazing is mostly restricted at known populations. Herbivory tothe leaves by native insects, rodents, and perhaps tortoises is apparent, but the extent of damageto population size is not documented.3.3.8.7 Kelso Creek MonkeyflowerLife History: Loamy, coarse sands on alluvial fans and deposits of granitic origin withinthe Joshua tree and juniper woodlands of the Kelso Valley in Kern County.Population Status in the <strong>Plan</strong>ning Area: Seven of eight known occurrences are withina 12 square mile area in the Kelso Valley, with the remaining occurrence outside the <strong>Plan</strong>ningarea nine miles to the northwest. Approximately 990 acres of public land and 1,000 acres ofprivate land are occupied habitat. An additional 1,600 acres of potential habitat on public landhas been identified.Regulatory Status: Federal Candidate.Threats Affecting the Kelso Creek Monkeyflower: Identified threats includetrampling by cattle and off-highway vehicle activity. The main threat to this species is thepresent or threatened destruction, modification, or curtailment of its habitat or range. Mobilehome and subdivision developments, including road access, threaten populations on private land.Fire-fighting operations have damaged one population in the past.Chapter 3 3-188
3.3.8.8 Kern BuckwheatLife History: Kern buckwheat is found on ridge tops in poorly draining depressions inwhite bentonite clay soils thought to be from volcanic ash. These depressions have pebbles,gravel and rock cemented into the soil surface.Population Status in the <strong>Plan</strong>ning Area: All of the known populations are within theplanning area. There are two to four populations on public land and one or two on private land.All are located in the southern Sierra Nevada Mountains in Kern County either west of MiddleKnob and south of Pine Tree Canyon, or on Sweet Ridge. There are four populations east ofSand Canyon described as follows:• Population A - "Near" Zond Windfarms transmitting Station; a 2-5 acre site in a basinbelow the station.• Population B - On Zond property; a 1 acre site, bisected by the road.• Population C - On BLM managed land ca. 1/2 mile south of population B; a 2-3 acre site,bisected by the road.• Population D - On BLM managed land about 3 miles south of population C; perhaps 4 to5 acres.Regulatory Status: BLM SensitiveThreats Affecting the Kern Buckwheat: Maintenance of wind energy facilities poses athreat to this species. Other potential threats are off highway vehicle (OHV) use, futureconstruction and grazing.3.3.8.9 Lane Mountain MilkvetchLife History: Lane Mountain milkvetch is an herbaceous perennial that grows up withina host plant, which it uses for support. <strong>Plan</strong>ts occur on granitic substrates with shallow soils.Population Status in the <strong>Plan</strong>ning Area: The Lane Mountain milkvetch is a very localendemic species found primarily on public and military land. Its entire known range is withinthe western <strong>Mojave</strong> <strong>Desert</strong> between Goldstone and Barstow, San Bernardino County, in an areano more than 13 miles in diameter.In 2001 and 2002 the Army conducted extensive surveys for Lane mountain milkvetchand found four primary population areas. These are found on public (BLM) lands, on Fort IrwinNational Training Center, at the Goldstone Deep Space Communications Complex, and onprivate lands on the Coolgardie Mesa. The Fort Irwin population is fenced, and most trainingactivities take place outside the fence.Chapter 3 3-189
Regulatory Status: Federal Endangered.Threats Affecting the Lane Mountain Milkvetch: Few threats now exist for LaneMountain milk vetch. Its low numbers make it susceptible to extinction from stochastic(unanticipated random) events. Expansion of training corridors at Fort Irwin could threaten thisspecies. Increased activity within Fort Irwin or Goldstone Deep Space CommunicationsComplex could threaten undiscovered populations of this species. Club mining activities onCoolgardie Mesa are a potential threat. Off-road travel within occupied habitat is a potentialthreat.3.3.8.10 Little San Bernardino Mountains GiliaLife History: This plant is found in dry canyons and along desert washes on alluvialfans. It requires sandy, well-aerated soil on flat ground with few or no competing species. Densestands of weedy annuals are never present at occupied sites, which are all at the margins ofstreambeds.Population Status in the <strong>Plan</strong>ning Area: The plant is restricted to the Little SanBernardino Mountains and the northeast portion of the San Bernardino Mountains. Of twelvemajor areas of occurrence, ten are within the western <strong>Mojave</strong> <strong>Desert</strong>. These are scattered into anumber of discrete population segments, generally defined by drainage basins and washes.Regulatory Status: BLM Sensitive.Threats Affecting the Little San Bernardino Mountains Gilia: The greatest threat tothe species is rural and suburban development near Yucca Valley and the community of JoshuaTree. A secondary threat is OHV recreation in washes. Future channelization or flood controlprojects could threaten the occupied drainages. Two of the ten <strong>West</strong> <strong>Mojave</strong> occurrences arewithin Joshua Tree National Park, one is on BLM lands, and seven are on private land.3.3.8.11 <strong>Mojave</strong> MonkeyflowerLife History: <strong>Mojave</strong> monkeyflower is found in Joshua tree woodland and creosotebush scrub communities. It favors granitic soils, and is most often found on gravelly banks ofdesert washes. Occasionally it is found in sandy openings between creosote bushes and on rockyslopes above washes, areas that are not subject to regular water flows.Population Status in the <strong>Plan</strong>ning Area: The <strong>Mojave</strong> monkeyflower is a restrictedendemic whose entire range is within the western <strong>Mojave</strong> <strong>Desert</strong>. All occurrences are east of the<strong>Mojave</strong> River, and most are south of Barstow. Major populations are found between Victorvilleand Barstow west of Interstate 15, and in the Ord-Rodman-Newberry Mountains area.Populations in the Waterman Hills north of Barstow are not threatened.Regulatory Status: BLM Sensitive.Chapter 3 3-190
Threats Affecting the <strong>Mojave</strong> Monkeyflower: Populations between the <strong>Mojave</strong> Riverand Interstate 15 are situated in a patchwork of private and public lands. Quarries and ruraldevelopment on private land have fragmented some populations, a trend which may continue.Exchange of BLM lands for the Air Force Land Tenure Adjustment program could lead to lossof occurrences on public lands in the Brisbane Valley.Populations south of Barstow and Dagget are threatened by off-road vehicle activity.Several populations are in or adjacent to the Stoddard Valley OHV open area. Some populationsare bisected by Stoddard Valley Road and Camp Rock Road, and adjacent OHV trails haveeliminated some plants.Livestock grazing (Ord cattle allotment) occurs within this species’ range and somedamage to plants may arise from trampling. Mining does not appear to threaten <strong>Mojave</strong>monkeyflower at this time, though expansion of quarries near Oro Grande could result in the lossof occupied habitat.Utility Corridor O traverses the western edge of the Brisbane Valley. Utility Corridor D,the Boulder Corridor, traverses the southeast edge of the Brisbane Valley unit and bisects theeastern part of the proposed Conservation Area near Daggett Ridge.Because numbers of this annual species are dependent on winter rainfall, a potentialthreat is inbreeding, genetic bottlenecks, and lack of sufficient pollinators.3.3.8.12 <strong>Mojave</strong> TarplantLife History: <strong>Mojave</strong> tarplant is found in Joshua tree woodland, creosote bush scrub,and mixed desert scrub communities at scattered locations throughout the planning area. <strong>Mojave</strong>tarplant is found near springs, seeps, wetland margins, swales and stream channels.Population Status in the <strong>Plan</strong>ning Area: Within the planning area, the <strong>Mojave</strong> tarplantoccurs in fairly large numbers at the base of the southern Sierra Nevada Mountains. Anhistorical locality at <strong>Mojave</strong> Forks apparently no longer supports this species. Outside theplanning area, this species occurs in the Peninsular Ranges of Riverside and San Diego counties.Regulatory Status: BLM Sensitive, California Endangered.Threats Affecting the <strong>Mojave</strong> Tarplant: Few threats are known to <strong>Mojave</strong> tarplant. Atthe historical <strong>Mojave</strong> Forks locality, extensive off-road vehicle activity has degraded the habitat.3.3.8.13 Parish's Alkali GrassLife History: Parish’s alkali grass is found in alkali seeps and springs.Population Status in the <strong>Plan</strong>ning Area: Parish's alkali grass is known from a singlelocation, Rabbit Springs near Lucerne Valley, on private land within the planning area. Thislocation is considered to be an important and interesting disjunct occurrence, and is in an area ofChapter 3 3-191
considerable importance to the botanical history of the western <strong>Mojave</strong> <strong>Desert</strong>.Regulatory Status. No special status.Threats Affecting the Parish’s Alkali Grass: Anything that lowers the water table atthe springs will likely result in the destruction of the only known California population of thisspecies, as this plant is absolutely dependent upon continued surface flows for its existence.Grazing, and potential road maintenance or widening threatens the small population.3.3.8.14 Parish’s PhaceliaLife History: Parish's phacelia is found on alkaline flats, that is, playas and dry lakebeds.It is most common on the silty and clayey soils of the lowest portion of the dry lakebeds south ofFort Irwin.Population Status in the <strong>Plan</strong>ning Area: This species has a large population inCalifornia, disjunct from its primary range in Nevada. It occurs on the series of unnamed drylakes (playas) south of Fort Irwin between the Manix tank trail and Coyote Dry Lake.Regulatory Status: No special status.Threats Affecting the Parish’s Phacelia: No threats have been identified, but vehicleactivity, including military vehicles, could be a major impact to the population. Surfacedisturbance on the private lands could eliminate the plants in those locations. The likelihood ofdevelopment of these lands is very low. Because there are only one or two known occurrences inCalifornia, it may be at risk of stochastic or catastrophic extinction.3.3.8.15 Parish’s Popcorn FlowerLife History: Parish’s popcorn flower is a distinctive member of a large genus of annualwildflowers, many of which are found in wetlands. This species is a wetland obligate.Population Status in the <strong>Plan</strong>ning Area: A single site at Rabbit Springs in LucerneValley supports this species, which emerges and flowers every year because of the reliability ofthe groundwater at this alkali seep. The only other recent records of this plant in California arefrom freshwater springs at the edge of Owens Lake in Inyo County.Regulatory Status: BLM Sensitive.Threats Affecting the Parish’s Popcorn Flower: No current threats. Groundwaterpumping has been reported as a potential threat. Because the single location is so small, evenminor disturbances to the seep habitat could significantly affect the population.Chapter 3 3-192
3.3.8.16 Red Rock PoppyLife History: This species occurs at elevations between 2300 and 3280 ft. It appears tobe found in a rather common rock type of rhyolite tuffs, granitics and similar rocks.Population Status in the <strong>Plan</strong>ning Area: All known occurrences of Red Rock poppy,including a probable occurrence on Edwards Air Force Base, are within the western <strong>Mojave</strong><strong>Desert</strong>. A possible location in the Black Mountains is outside the eastern boundary of theplanning area.The taxon is definitely known from only four locations: Red Rock Canyon State Park(many locations); Mesquite Canyon, 0.4-0.6 miles north of Randsburg Road; 2 miles southeast ofSearles Station (which may be in San Bernardino County, and is in the Summit Range); and onan “unnamed road” 1.2 miles north of Red Rock-Randsburg Road at a junction 3.3 miles east ofthe junction of California highway 14 and the Red Rock-Randsburg Road.Regulatory Status: BLM Sensitive.Threats Affecting the Red Rock Poppy: The CNPS inventory (Skinner and Pavlik,1994) states that vehicles threaten the Red Rock poppy, but the extent of this threat is unknown.There may be other threats in various areas, but so little is known about this plant that it isimpossible at this time to outline the nature of any additional threats.3.3.8.17 Red Rock TarplantLife History: The Red Rock tarplant is found in seeps, springs and seasonally moistalluvium in an extremely hot and arid part of the <strong>Mojave</strong> <strong>Desert</strong> in the rain shadow of thesouthern Sierra Nevada Mountains. Specifically, it is found in: 1) sandy to gravelly washes, 2)moist alkaline margins of seeps and springs, 3) sandy alluvium at the foot of ridges and cliffs,and 4) ledges of dry colluvium supported by ribs of bedrock on cliffs.Population Status in the <strong>Plan</strong>ning Area: The Red Rock tarplant is a very localendemic of the western El Paso Mountains. Once thought to only occur in Red Rock Canyon, itis now known to occur in adjacent Last Chance Canyon as well. Within Red Rock Canyon itoccurs along the bottom of the canyon for about 4-5 miles.Regulatory Status: California Rare.Threats Affecting the Red Rock Tarplant: Repeated disturbance is the biggest threatto this species. OHV activity posed the greatest threat in the past, but it is now restricted withinRed Rock Canyon State Park.3.3.8.18 Salt Springs CheckerbloomLife History: This plant is an herbaceous perennial, blooming from April to June, thendying back to ground level in the late summer, fall and winter. Specimens have been collected inChapter 3 3-193
a variety of habitats, including chaparral, coastal sage scrub and yellow pine forest. In the desert,it appears to be restricted to alkali seeps and springs.Population Status in the <strong>Plan</strong>ning Area: Although formerly widespread outside thedesert, virtually no records are available since 1966. A single site at Rabbit Springs in LucerneValley supports this species, which emerges and flowers every year because of the reliability ofthe groundwater at this alkali seep.Regulatory Status. No special status.Threats Affecting the Salt Springs Checkerbloom: Urbanization has eliminated mosthistorical locations.3.3.8.19 Shockley’s Rock CressLife History: Shockley’s rock cress is a perennial herb found on limestone and quartziteoutcrops and gravelly substrates at 3,000 - 6,000 feet elevation.Population Status in the <strong>Plan</strong>ning Area: This plant is found primarily in the SanBernardino National Forest on the north slope of the San Bernardino Mountains, although itranges to Inyo County, Nevada, and Utah. Nine occurrences have been reported by the NDDBwithin the planning area, 3 on public lands and 6 on private lands. The latter have been surveyedmore intensively. In 1998, this plant was found within 51 plots randomly placed across theproposed carbonate plants conservation area, mainly within the San Bernardino National Forest.One isolated historical record is from Highway 247 north of its junction with Highway 18 inLucerne Valley.Regulatory Status: No special status.Threats Affecting the Shockley’s Rock Cress: Populations have been reduced bylarge-scale mining operations and this threat continues. The majority of public lands where thisplant occurs have mining claims. Off road travel within occupied habitat is a minor potentialthreat.3.3.8.20 Short-joint Beavertail CactusLife History: Short-joint beavertail cactus is mostly associated with Joshua tree, pinyonpine, and juniper woodlands, although it also occurs in chaparral and <strong>Mojave</strong> desert scrubcommunities. It has been reported from a wide variety of well-drained soils, from sandy torocky, in open streambeds and on rocky slopes.Population Status in the <strong>Plan</strong>ning Area: Short-joint beavertail cactus is found alongthe north slopes of the San Gabriel Mountains from the Anaverde Valley west of Palmdale eastto the Cajon Pass. It occurs between elevations of 3000 – 6500 feet, and is found within theAngeles National Forest south of the <strong>West</strong> <strong>Mojave</strong> boundary. At the eastern edge of its range,between Cajon Pass and the <strong>Mojave</strong> River Forks Dam in the San Bernardino Mountains, theChapter 3 3-194
populations show intergradation with Opuntia basilaris var. basilaris.Regulatory Status: BLM Sensitive.Threats Affecting the Short-joint Beavertail Cactus: Nearly all of the occurrences ofshort-joint beavertail in the western <strong>Mojave</strong> <strong>Desert</strong> are on private land, and the primary threat isrural development in the Pinon Hills, Oak Hills, and Phelan areas in San Bernardino County, andsuburban development in and near Palmdale. Large-scale developments at Las Flores Ranch andSummit Valley may threaten this species or the intergrade populations.Off-road vehicle activity in the hills south and east of Phelan has damaged some habitat,and may eliminate plants.3.3.8.21 Triple-ribbed MilkvetchLife History: This species is only found in California and it is primarily known from thevicinity of Whitewater Canyon (the type locality) and from Dry Morongo Canyon alongHighway 62, as well as from scattered occurrences farther east in the Little San BernardinoMountains, including an anomalous, relatively high elevation, site at Key's Ranch in Joshua TreeNational Park. It is restricted to sandy or gravelly soils in arid canyons. It appears that no wellestablishedpermanent population of any size has ever been found.Population Status in the <strong>Plan</strong>ning Area: Most of the populations occur just outside ofthe planning area; but there are three locations within the western <strong>Mojave</strong> <strong>Desert</strong>: Little SanBernardino Mountains in Joshua Tree National Park (perhaps at Key's Ranch only), BigMorongo Canyon at the Riverside/San Bernardino counties line (several collections andobservations), in the Whitewater River drainage within the San Gorgonio Wilderness and in DryMorongo Canyon just north of the San Bernardino County line (several collections). There isadditional habitat along the southern part of the planning area that is not well explored that mayhave additional populations: in the upper reaches of Mission, Dry Morongo and Big MorongoCreeks, as well as in the western lobe of Joshua Tree National Park.Regulatory Status: Federal Endangered.Threats Affecting the Triple-ribbed Milkvetch: Threats are not well known becausethis species is not well studied and it is often difficult to find in remote and rugged areas.Vehicle travel in desert canyons and washes of the Little San Bernardino Mountains is apotential threat.3.3.8.22 White-Margined BeardtongueLife History: This species is disjunct from its primary range and is found in the sandfields and washes north of Pisgah Crater.Population Status in the <strong>Plan</strong>ning Area: This plant is found in the Pisgah Crater area.Twenty-two occurrences have been recorded. Three of these are on private lands. TheChapter 3 3-195
BLM/Wildlands Conservancy purchase of lands from Catellus Development Corporation inJanuary 2000 put three occurrences into public ownership. Populations at Twentynine PalmsMCAGCC have been disturbed by military activities in the past. A new population was recordedfrom the base in 1998.Regulatory Status: BLM Sensitive.Threats Affecting the White-margined Beardtongue: Vehicle use of the occupiedhabitat is a threat. Maintenance of utility access roads and facilities has been a threat in the past.Military operations at Twentynine Palms MCAGCC have potential to damage the smallpopulation(s) on the base.3.4 SOCIO-ECONOMIC3.4.1 Regional Economic ProfileThe following information pertaining to existing economic and demographic conditionsin the panning area is excerpted from the Socio-Economic Analysis of the project alternatives,prepared by Alfred Gobar and Associates. The complete socio-economic technical report iscontained in Appendix N of this <strong>FEIR</strong>/S. Further detail and technical data is contained therein.Encompassing nearly 9.36 million acres, the planning area (also WEMO) is a substantialgeographic region. This large study area includes over 733,000 residents (2000 Census) andencompasses portions of five separate counties. The corresponding land area and residentpopulation base within each of the respective county subareas that comprise the planning area isgraphically shown below.WEMO LAND AREA DISTRIBUTIONInyo9%Riverside3%SanBernardino64%2000 POPULATION DISTRIBUTIONKern10.6%Inyo0.1%SanBernardino48.5%Kern17%14,624 Square Miles733,476 ResidentsLos Angeles7%Los Angeles40.8%Chapter 3 3-196
3.4.1.1 Regional EnvironmentIn totality, the <strong>West</strong> <strong>Mojave</strong>’s existing population base is significant but is widelydispersed in scattered concentrations ranging from as few as 25,000 residents in such areas asBarstow and Ridgecrest to more than 200,000 in the Palmdale-Lancaster area of Los AngelesCounty and also the Victor Valley area of San Bernardino County. The <strong>West</strong> <strong>Mojave</strong> populationbase is too small and geographically dispersed to be realistically considered a self-generatingeconomy, even though certain industries such as aerospace, mining, military, and governmentoperations have long provided local employment to area residents.The <strong>West</strong> <strong>Mojave</strong>, while relatively remote, is situated along the periphery of SouthernCalifornia and its huge metropolitan population and employment base. Overall economic growththroughout the <strong>West</strong> <strong>Mojave</strong> is increasingly influenced and driven by growth trends describingthe larger economic region of Southern California for a number of reasons. The six-countySouthern California region (Los Angeles, Orange, San Diego, San Bernardino, Riverside, andVentura counties) hosted 19.7 million residents and 8.0 million nonagricultural wage and salaryjobs in 2001. Due to the sheer volume of employment opportunity in more developed regions ofSouthern California a large number of workers residing in outlying areas commute to jobs insuch central locations. In 2000, about one in five workers residing in cities throughout the <strong>West</strong><strong>Mojave</strong> commuted at least 60 minutes each way to work. By contrast, the high desertenvironment of the <strong>West</strong> <strong>Mojave</strong> continues to offer a diverse range of options for a growingurban population seeking recreation and leisure activities or passive relief in vast natural settings.The high desert region has attracted nearly 2.0 million visitor-trips a year for off-highwayvehicle recreation and nearly 1.5 million visitors to State and National Parks in the area.Recreation travel in the <strong>West</strong> <strong>Mojave</strong> also provides support for local businesses and related jobs.Growth in employment throughout Southern California therefore constitutes one of the principalfactors driving demand for household formation in outlying sub-regions, such as the <strong>West</strong><strong>Mojave</strong>.Historic Regional TrendsPopulation: A wide variety of socio-economic factors can be evaluated with regards togrowth trends, but changes in population, employment, and housing reflect principal drivers ofurbanization and associated economic activity. Area population growth is a product ofhousehold formation. Household formation is primarily driven by the availability ofemployment, with the exception of retirement households.Total population within the six-county region of Southern California, plus Kern County,grew by 6.54 million residents over the 21-year period from 13.8 million residents in 1980 to20.4 million residents in 2001. The resident population of Inyo County has remained relativelystatic since 1980 (about 18,000 residents) and is not explicitly evaluated in relation to regionaltrends since it hosts roughly 600 residents or less than 0.1 percent of WEMO population.Total population throughout Southern California grew at an average annual rate of 1.84percent. Since 1990, the rate of population growth has slowed relative to the average rateexperienced over the past 21-years. Los Angeles County continues to account for the largestChapter 3 3-197
share of absolute population in Southern California due to its size. The pattern of growth,however, is shifting and outlying sub-regions are capturing a greater share of total growth. Since1980, outlying counties such as Riverside, San Bernardino, and Kern County have steadilyincreased their respective share of total population.Employment: Southern California population growth trends are largely influenced bynonagricultural employment trends and related housing construction. Non-agriculturalemployment correlates best with household formation, associated housing demand, andpopulation growth since a large segment of agricultural employment reflects transient andseasonal labor with limited capacity to occupy market rate housing. In addition, agriculturalemployment has been declining in absolute terms and as a share of total Southern Californiaemployment. For these reasons, non-agricultural employment growth will constitute a principalforce driving future housing growth and urbanization in the WEMO area.Between 1980 and 2001 nonagricultural employment in Southern California grew 34.0percent from 5.85 million jobs in 1980 to 8.24 million in 2001. Over this period 1.57 millionnew jobs (net) were created between 1980 and 1990 compared to 0.86 million (net) since 1990.Aggregate employment has grown at a slower rate in absolute and relative terms since 1990, inpart due to significant job losses during the early 90’s. The overall slower pace of employmentgrowth is indicative of broader trends describing the outlook of future economic growth in theregion.Not only is total employment in Southern California starting to grow more slowly,outlying areas are capturing larger shares of such growth. In 1980, Los Angeles Countyaccounted for 62.1 percent of nonagricultural employment throughout the Southern Californiaregion, including Kern County. In 2001, Los Angeles County’s respective share was down to49.7 percent. By comparison, San Bernardino County has captured an increasing share ofemployment (from 4.2 percent in 1980 to 6.8 percent in 2001), while the corresponding share forKern County has remained relatively constant (2.4 percent). Both Riverside and San BernardinoCounty are commonly recognized as a single metropolitan statistical area (Inland Empire) forpurpose of tracking most socio-economic trends. On the basis of this definition, the InlandEmpire has actually led Southern California in net employment gains since 1990 (314,400 jobs).As these trends suggest, the proportionate share of nonagricultural employment growth has beenshifting over the 21-year reference period, principally from Los Angeles County to the other sixcounties.Housing: Southern California housing growth trends are characterized by year-to-yearvolatility and shifting development activity throughout the region. Since 1980 roughly 1.93million construction permits have been issued for new housing development. The averageannual volume of development activity for all forms of housing (detached, attached, condo,apartment, etc.) is summarized in Table 3-37.Chapter 3 3-198
Table 3-37Average Annual Units Constructed - All HousingSouthern CaliforniaSo CalLos Angeles Orange Riverside San Bernardino San Diego Ventura Total Kern IncludingPeriod County County County County County County So Cal County Kern Co.1981-85 31,073 13,211 11,904 13,654 21,740 3,694 95,276 4,912 100,1881986-90 50,112 20,366 23,277 21,556 27,547 4,916 147,773 4,496 152,2691991-95 10,166 7,911 7,920 5,708 6,658 1,977 40,338 3,556 43,8941996-00 11,963 11,379 11,799 5,927 12,353 3,265 56,686 3,008 59,6942001 18,118 8,585 18,097 8,395 15,468 3,453 72,116 3,494 75,61022 Yr Avg 25,611 12,902 13,656 11,410 16,824 3,488 83,890 3,925 87,815Source: Bureau of the Census - Construction Statistics Division; Alfred Gobar Associates.Identified trends clearly show that the volume of development activity throughout all ofSouthern California has dropped considerably since peak building activity during the late 80’s.At that time, housing construction activity was significantly outpacing sales volume just as theSouthern California economy was being impacted by the post-Cold War recession. In effect, thebottom dropped out of Southern California’s aerospace and defense industry, heavilyconcentrated in Los Angeles County, which fueled more wide spread job losses after 1990.During the subsequent recovery period (1995 to 2000), annual job growth began to approachprevious peak levels but housing development has continued at much more moderate levels. Inaddition, the pattern of new housing development has shifted to outlying areas of SouthernCalifornia more rapidly than corresponding shifts describing non-agricultural employmentgrowth.Job-Housing Mix: The Southern California economy has been characterized by ashifting pattern of employment, housing, and population growth trending outward from thetraditional urban centers. The Southern California’s economy as a whole has effectivelygenerated 1.20 nonagricultural wage and salary jobs per household, although this average hasfluctuated in cyclical fashion. Despite substantial employment losses during the early 90’s, LosAngeles County recently has been generating local jobs at a ratio approaching its long-termaverage rate (1.31 jobs per household). Relatively isolated employment submarkets in VenturaCounty and Kern County have also increased relative job-housing performance since the early90’s. The rate of local job growth in San Bernardino County and Riverside County hasaccelerated since 1995, but these sub-regions continue to lag the overall region in terms of jobsper household. A significant portion of housing growth within these two sub-regions continuesto reflect affordable housing opportunities for workers who in turn commute to jobs in the majormetropolitan employment centers.3.4.1.2 Study Area DemographicsThe <strong>West</strong> <strong>Mojave</strong> extends across large portions of four Southern California counties (LosAngeles, San Bernardino, Kern, and Inyo) which all combined host 11.7 million residents (2000Census) or nearly 35.0 percent of the Statewide population (33.8 million residents). As a matterof course demographic traits describing an area are most often compared to corresponding traitsdescribing a larger geographic setting of which it is a part. Roughly 80.0 to 90.0 percent of allChapter 3 3-199
esidents within Southern California, however, reside in areas that are substantially moredeveloped and urbanized than is the case with the <strong>West</strong> <strong>Mojave</strong>.Typical population densities generally range from roughly 2,500 persons per square milein growing suburban areas to more than 7,500 persons per square mile in urbanized areas. Bycomparison, the corresponding population density for the eleven <strong>West</strong> <strong>Mojave</strong> cities combined(accounting for 71.0 percent of the <strong>West</strong> <strong>Mojave</strong> population base) only averages about 680persons per square mile (487,000 acres of land area divided by 520,000 residents in 2000). TheCensus Bureau utilizes a minimum threshold of 1,000 persons per square mile to denote anurbanized setting. The <strong>West</strong> <strong>Mojave</strong> is more characteristic of a large rural environment. Assuch, demographic traits that describe the <strong>West</strong> <strong>Mojave</strong> reflect distinctly different circumstancesthan is true for more urbanized portions of Southern California, thereby minimizing theusefulness of direct comparisons. Instead, the State of California, which includes a sizeable ruralpopulation, periodically serves as a comparative reference to denote overall distinctionsdescribing <strong>West</strong> <strong>Mojave</strong> residents.Demographic traits describing the 2000 population base of the four <strong>West</strong> <strong>Mojave</strong> subarearegions are detailed in Exhibit 8 of the Socio-Economic Analysis in Appendix N. Similar traitsdescribing the resident population of <strong>West</strong> <strong>Mojave</strong> cities are summarized in Table 3-38.The <strong>West</strong> <strong>Mojave</strong> consists of a relatively young population base but is aging more rapidlythan the State overall and more rapidly than central metropolitan areas of Southern California.The <strong>West</strong> <strong>Mojave</strong> includes a heavy composition of families and similarly has a greaterproportion of residents 20 years of age or younger. As result, there are relatively fewer smallhouseholds (two persons or less). The <strong>West</strong> <strong>Mojave</strong> is still attracting a relatively large numberof new households but at a slower rate than experienced through the 80’s and mid-90’s. Theaffordability of housing in the <strong>West</strong> <strong>Mojave</strong> remains a principal attraction to new householdsgiven 1 out of every 5 workers commutes 60 minutes or more to their job.Workforce participation (workers, not jobs) among <strong>West</strong> <strong>Mojave</strong> households continues tolag the State and Southern California economy. Census data indicates there was an average of1.11 workers (persons indicating a place of work) per household throughout the <strong>West</strong> <strong>Mojave</strong>compared to a Statewide average of approximately 1.28 workers per household. Similarly,current estimates of local employment (local jobs, as distinct from resident workers) also indicatethat there are fewer job opportunities in the <strong>West</strong> <strong>Mojave</strong> (0.94 jobs per occupied household)than is true for the State economy or Southern California as a whole (1.20 jobs per household –long term average). The incidence of local job opportunities in the <strong>West</strong> <strong>Mojave</strong>, however, iscomparable to other outlying regions of Southern California, including Kern County (0.92 jobsper household) and the Inland Empire (0.98 jobs per household).Current estimates from the California Employment Development Department and datapurveyors place the 2002 employment base throughout the <strong>West</strong> <strong>Mojave</strong> at approximately232,500 civilian jobs available to a base of 758,000 persons or 247,900 households.Surprisingly, the mix of local employment opportunities is roughly comparable to the broadermix of employment throughout Southern California as suggested below:Chapter 3 3-200
2002 SOUTHERN CALIFORNIAEMPLOYMENT MIXGov15.2%Agr0.8%M ining0.1% Con4.8%Mfg13.5%Gov17.3%2002 WEMO AREAEMPLOYMENT MIXAgr0.9%M ining0.3% Con3.9%Mfg7.6%TCU4.9%TCU5.1%Serv31.8%Trade22.9%Serv35.3%FIRE5.8%Source: Alfred Gobar Associates; California Employment Development Department; Claritas, Inc.FIRE4.8%Trade25.1%Factors that distinguish the current employment base of the <strong>West</strong> <strong>Mojave</strong> include ahigher proportion of service and trade sector jobs (consistent with rural and emerging growthareas). The <strong>West</strong> <strong>Mojave</strong> also has a moderately higher mix of government jobs, reflecting thehistorical role of Federal and State agencies in the region. The manufacturing base within the<strong>West</strong> <strong>Mojave</strong> is significantly underrepresented by comparison to the broader SouthernCalifornia economy. Agriculture (including grazing activities) and mining have a long andproud history in the <strong>West</strong> <strong>Mojave</strong> but account for little more than 1.0 percent of currentemployment opportunities or about 2,500 jobs in the area.Demographic traits and growth trends describing the <strong>West</strong> <strong>Mojave</strong> overall can varyconsiderably among the four subareas. This is particularly evident with respect to thedistribution of population and land area throughout the <strong>West</strong> <strong>Mojave</strong> as summarized below:WEMO AREA COMPOSITIONSHARE OF LAND, POPULATION & GROWTH70%60%50%40%30%20%10%0%Land Area2000 Pop90-00 Pop. Grwth.San Bernardino Los Angeles Kern InyoWEMO SUB-AREASChapter 3 3-201
The San Bernardino subarea accounts for 64.0 percent of the <strong>West</strong> <strong>Mojave</strong>’s land area,nearly 49.0 percent of the 2000 resident population, and nearly 48.0 percent of populationgrowth between 1990 and 2000. By comparison, the Los Angeles subarea only accounts for 7.0percent of the <strong>West</strong> <strong>Mojave</strong>’s land area, but 41.0 percent of the 2000 resident population, andover 50.0 percent of corresponding population growth. The Kern subarea accounted for 11.0percent of the 2000 population base but less than 2.0 percent of total corresponding growth.The Inyo subarea with roughly 600 residents accounts for less than 0.1 percent of the <strong>West</strong><strong>Mojave</strong> population base and has experienced an overall decline in population since 1990. On acombined basis, the Los Angeles and San Bernardino subareas accounted for over 98.0 percentof total population growth between 1990 and 2000.Census data strongly suggest that population and housing growth throughout the <strong>West</strong><strong>Mojave</strong> over the past 12 years area has been substantially concentrated within cities andunincorporated enclaves located closest to the major employment centers of Southern California.Chapter 3 3-202
TABLE 3-382000 CENSUS DEMOGRAPHIC COMPARISONINCORPORATED CITIES WITHIN WEST MOJAVE PLAN REGIONTown of City of City of City ofCombined City of Apple City of California City of City of City of City of Twentynine City of YuccaCensus Variable Cities Adelanto Valley Barstow City Hesperia Lancaster Palmdale Ridgecrest Palms Victorville ValleyTotal Population 520,428 18,130 54,239 21,119 8,385 62,582 118,718 116,670 24,927 14,764 64,029 16,865% Share of Total 100.0% 3.5% 10.4% 4.1% 1.6% 12.0% 22.8% 22.4% 4.8% 2.8% 12.3% 3.2%Population Growth (1990-2000) 24.9% 146.6% 17.2% -4.2% 39.8% 22.2% 22.4% 47.5% -9.7% 24.5% 24.2% 1.7%Families as % of Households 75.5% 81.5% 77.4% 68.7% 73.6% 79.0% 72.4% 82.0% 68.1% 68.2% 76.0% 64.6%Population in <strong>Group</strong> Quarters 2.1% 8.2% 0.7% 1.9% 0.7% 0.5% 5.9% 0.1% 1.2% 0.3% 1.0% 1.8%Average Household Size 3.00 3.53 2.90 2.71 2.72 3.12 2.92 3.40 2.51 2.60 3.03 2.38Housing by TenureOwner-Occupied 65.6% 63.8% 70.0% 54.1% 67.1% 72.3% 61.4% 71.0% 63.0% 43.3% 65.1% 68.0%Renter-Occupied 34.4% 36.2% 30.0% 45.9% 32.9% 27.7% 38.6% 29.0% 37.0% 56.7% 34.9% 32.0%Unit Vacancy 9.4% 15.0% 8.0% 16.5% 13.8% 6.5% 8.4% 7.6% 13.1% 18.7% 7.1% 12.6%Median Housing Value $89,377 $81,700 $112,700 $75,700 $81,900 $95,900 $103,700 $116,400 $72,400 $75,400 $98,700 $83,200Average Housing Value $113,064 $84,431 $129,408 $82,575 $84,607 $107,287 $119,696 $129,805 $80,712 $79,641 $106,300 $97,088Median Rent $495 $391 $483 $418 $450 $526 $563 $551 $418 $416 $506 $421Average Rent $498 $412 $501 $417 $416 $491 $548 $565 $412 $343 $505 $430Median Household Income $40,095 $31,594 $40,421 $35,069 $45,735 $40,201 $41,127 $46,941 $44,971 $31,178 $36,187 $30,420Average Household Income $49,051 $35,912 $51,299 $43,671 $53,620 $47,898 $51,080 $54,994 $53,898 $37,843 $43,254 $38,361Workforce CharacteristicsWorkers per 1,000 Population 359 256 357 373 395 351 357 362 442 419 344 340Occupation (Age 16+)White Collar 69.0% 63.1% 70.3% 68.3% 69.0% 65.4% 70.7% 69.4% 73.1% 70.1% 67.9% 68.9%Blue Collar 31.0% 36.9% 29.7% 31.7% 31.0% 34.6% 29.3% 30.6% 26.9% 29.9% 32.1% 31.1%Worked in Home Town 35.4% 22.0% 28.4% 51.3% 24.3% 26.5% 44.7% 26.3% 58.4% 28.7% 36.7% 44.0%Commute Less than 10 min 14.1% 5.3% 11.0% 28.3% 13.4% 9.0% 16.2% 8.9% 35.5% 17.1% 11.5% 20.3%Commute 10-30 min 42.5% 42.1% 49.6% 40.7% 42.9% 39.0% 45.2% 33.9% 51.6% 65.1% 42.8% 34.5%Commute 30-60 min 19.9% 29.3% 17.2% 22.3% 34.8% 27.2% 16.4% 20.3% 6.1% 8.4% 23.1% 30.3%Commute 60 min or more 20.5% 20.7% 17.8% 6.8% 7.3% 20.7% 19.6% 34.2% 4.2% 7.2% 19.6% 11.2%Source: Alfred Gobar Associates; U.S. Bureau of the Census; AnySite Online.Tabl3 3-389/23/2004
3.4.1.3 Study Area Growth CapacityEconomic growth within a given area is ultimately affected by the underlying capacity tohost additional amounts of land use development where related residential, employment,educational, and leisure activities are to occur. The underlying holding capacity of the area isgreatly influenced by General <strong>Plan</strong> policy that defines the location, supply, and intensity of landuse available to host economic activity. The ultimate growth capacity of the <strong>West</strong> <strong>Mojave</strong> islargely defined by General <strong>Plan</strong> land use policy of 15 separate jurisdictions (11 cities and 4counties). To determine the land use capacity of <strong>West</strong> <strong>Mojave</strong> land use designations werequantified and classified by type and intensity. Because the <strong>West</strong> <strong>Mojave</strong> encompasses such avast geographic area special attention was placed on determining the specific intensity ofpermitted land use rather than estimating land use intensity on the basis of commonnomenclature used to describe type of land use. Specific quantities and correspondingpopulation and employment levels used to describe the growth capacity of the <strong>West</strong> <strong>Mojave</strong> aredetailed in Exhibit 9 and Exhibit 10 of the Socio-Economic Analysis in Appendix N.Overall, roughly 1.78 million acres of land area throughout the <strong>West</strong> <strong>Mojave</strong> isdesignated for residential land use at a target capacity of approximately 1.58 million residentialdwellings. In all about 240,000 acres of land area is designated for a variety of non-residentialland use such as office, retail, industrial, and institutional development. The balance of area, orroughly 7.0 million acres, is designated for open space, utility easements, resource production,agriculture, military installations, conservation land, etc. Overall, the 15 affected local agencyjurisdictions have General <strong>Plan</strong> policies in place guiding the ultimate use and development ofroughly 9.0 million acres. With respect to population and employment, the designated supply ofresidential and nonresidential land use has the capacity to support roughly 4.86 million residentsand 3.09 million local jobs if all <strong>West</strong> <strong>Mojave</strong> properties are developed and utilized according toGeneral <strong>Plan</strong> policy.In terms of economic realities expected to influence growth opportunities throughout the<strong>West</strong> <strong>Mojave</strong> over the long haul, current General <strong>Plan</strong> policies in aggregate are out of balance.The <strong>West</strong> <strong>Mojave</strong> is effectively over-supplied in terms of the amount of non-residential landrequired for the housing unit capacity currently designated. Conversely, it might be argued thereexists an undersupply of designated housing capacity needed to warrant the amount of nonresidentialland use planned. The market reality is such that single-family detached housing willrepresent the dominant form of residential constructed throughout the <strong>West</strong> <strong>Mojave</strong> during the30-year life of the habitat conservation plan (HCP) project.If all <strong>West</strong> <strong>Mojave</strong> land uses were developed according to General <strong>Plan</strong> policy, the areawould effectively host 1.95 local jobs per housing unit (rough equivalent of 2.15 jobs peroccupied household). Since 1990, overall workforce participation throughout the <strong>West</strong> <strong>Mojave</strong>has been declining from about 1.16 workers (including self-employed) per household to 1.11workers per household in 2000, with about one-fifth of these workers commuting to jobs in themetropolitan regions of San Bernardino and Los Angeles County. The corresponding rate ofworkforce participation for the State has been increasing from 1.63 workers per household in1990 to 1.71 workers per household in 2000. To fully develop the designated supply of nonresidentialland area in the <strong>West</strong> <strong>Mojave</strong>, workforce participation trends in the area would needChapter 3 3-204
to undergo a dramatic reversal to the point of exceeding equilibrium levels describing theStatewide economy. A more balanced policy mix of residential and non-residential land usethroughout the <strong>West</strong> <strong>Mojave</strong> suggests limiting office, retail, industrial, and institutional land use(excluding local school sites) to roughly 160,000 acres.Recent growth trends and the long-term outlook for housing development is summarizedin Table 3-39 based on Census reported changes in area housing.Table 3-39<strong>West</strong> <strong>Mojave</strong> Housing Development OutlookEffective Mix Of Detached Vs Higher Density ProductTYPE HOUSING BUILDOUT 2000 EST 1990 EST CHG 2000BUILDOUTCHG 1990-2000All Housing 1,580,000 271,250 230,125 1,308,750 41,125Higher Density 253,000 41,775 38,900 211,225 2,875% High Density 16.0% 15.4% 16.9% 16.1% 7.0%Source: Bureau of Census; Alfred Gobar Associates.3.4.1.4 Study Area Market ShareResidential construction constitutes the form of land use likely to result in the greatestamount of permanent ground disturbance (subdivision grading) among common developmentactivities closely associated with the future urbanization of the <strong>West</strong> <strong>Mojave</strong> (retail, officeinstitutional,and industrial land use reflecting the other principal urban land forms). During themost recent 10-year period of construction activity, the effective share of building permits issuedwithin the principal growth locations of the <strong>West</strong> <strong>Mojave</strong> is summarized in Table 3-40.Table 3-40Residential Permits – 10-Year Average Share/MixALL UNITS SFD MF/OTHERSan Bernardino Subarea 52.0% 52.8% 25.5%Los Angeles Subarea 45.9% 45.0% 61.5%Kern Subarea 2.1% 2.2% 13.0%WEMO Overall 100.0% 100.0% 100.0%WEMO Unit Mix 100.0% 89.6% 10.4%Source: U.S. Bureau of the Census - Residential Construction Branch.As shown, within the last 10 years, the San Bernardino subarea has accounted for thelargest share of total permits, followed closely by the Los Angeles subarea.The 10-year average share of permit activity in each of the subareas described above isnot static but in fact reflects a shifting pattern of growth. Overall, the total share of housingactivity in the San Bernardino and Kern subareas has been declining, while the correspondingshare occurring in the Los Angeles subarea has been growing.Chapter 3 3-205
Long-term growth in the <strong>West</strong> <strong>Mojave</strong> is not solely driven by regional employment gainsbut is also influenced by increases in the local population base, which generates populationservingemployment and attendant housing demand from jobs created.Housing submarket locations with relatively strong housing demand tend to supporthigher average product pricing, reflecting market preferences of prospective residents. Table 3-41 summarizes the estimated average unit value for new single-family detached homes issuedbuilding permits during the first eight months of 2002.Table 3-41<strong>West</strong> <strong>Mojave</strong> Average Housing Value –New Single Family Detached Units2002 AVG. 10-YR. INDEX 2002 INDEXED AVERAGEWEMO Location SFD Value vs. WEMO vs. 1992 vs. WEMOPalmdale $242,800 1.08 1.64 1.17Victorville $232,500 0.94 1.74 1.12Lancaster $211,800 1.09 1.37 1.02Hesperia $203,000 0.95 1.28 0.98Apple Valley $189,800 1.05 1.22 0.91California City $164,600 0.88 1.34 0.79Ridgecrest $161,000 0.88 1.42 0.78Yucca Valley $153,300 0.83 1.14 0.74Barstow $139,500 1.01 1.07 0.6729 Palms $112,900 0.75 0.91 0.54Adelanto $91,100 0.53 1.23 0.44San Bernardino Subarea $192,100 0.91 1.60 0.93Los Angeles Subarea $231,800 1.11 1.47 1.12Kern Subarea $163,400 0.89 1.38 0.79WEMO Overall $207,600 1.00 1.54 1.00WEMO Counties (3) $257,900 1.29 1.39 1.24Source: U.S. Bureau of the Census - Residential Construction Branch; Alfred Gobar Associates.Within the<strong>West</strong> <strong>Mojave</strong>, cities and housing submarket locations closest to metropolitanemployment centers have consistently realized higher average unit values. Indicated pricingpatterns are symptomatic of demand preferences expected to drive future growth. The City ofAdelanto reflects the notable exception. Historically overlooked, Adelanto is now experiencingincreased housing activity due to its location along the principal growth vector of the City ofVictorville. Overall, the <strong>West</strong> <strong>Mojave</strong> remains a price-competitive market in relation to thebroader Southern California housing market.During the past 10 years, <strong>West</strong> <strong>Mojave</strong> has captured nearly a 14.0 percent average shareof all new home construction activity within the four counties surrounding the <strong>West</strong> <strong>Mojave</strong> (LosAngeles, San Bernardino, Kern, and Inyo County).Chapter 3 3-206
3.4.1.5 Study Area Property ValuationProperty valuation throughout the <strong>West</strong> <strong>Mojave</strong> represents an important consideration inrelation to the HCP program. The assessed value of <strong>West</strong> <strong>Mojave</strong> property largely determinesthe amount of property tax revenue appropriated to each of the eleven <strong>West</strong> <strong>Mojave</strong> cities andfour county governments in order to provide necessary public services (police, fire, health &safety, cultural and community, etc.). The assessed value of property within selected portions ofthe <strong>West</strong> <strong>Mojave</strong>, namely the Habitat Conservation Areas (HCA’s), also determines themitigation fee that would be imposed within the HCP compensation framework for AllowableGround Disturbance (AGD) and incidental taking permits needed to facilitate futuredevelopment and generate funds to acquire additional habitat area. These two areas ofconsideration are important for the following reasons. As the HCP is implemented and privatelyowned property in the HCA’s is purchased and removed from the tax rolls, affected City andCounty governments will need to forego corresponding property tax revenue used to supportpublic service responsibilities. The HCP mitigation fee establishes a definitive expense that thatmust be shouldered by site-specific development in order to eliminate case-by-case costuncertainties associated with enforcement of current endangered species regulations (CESA andFESA). The following discussion is supplemented by additional exhibits and discussion in theSocio-Economic Analysis (Appendix N to this <strong>FEIR</strong>/S).3.4.1.5.1 Subarea ValuationProperty tax revenue-generating potential within a given jurisdiction is largely limited tothe assessed value of private property, since government owned land is exempt from directpayment of property tax. Although the four-County region of the <strong>West</strong> <strong>Mojave</strong> encompassesmore than 9.0 million acres, the vast majority of land area reflects government owned land asillustrated below:WEMO LAND OWNERSHIP MIXMilitary29%BLMManaged36%State1%PrivateProperty32%MiscFederal,Local, Etc.2%Chapter 3 3-207
As shown, only 32.0 percent or 2.9 million acres of the <strong>West</strong> <strong>Mojave</strong> is privately ownedand subject to property tax. Under current taxing regulations, private property is taxed accordingto a basic levy equal to 1.0 percent of its assessed value. City and County governments areallocated a portion of the property tax proceeds, along with other government service agencies(school districts, flood control districts, vector control districts, cemetery districts, librarydistricts, etc.). The relative supply of private property within a given jurisdiction affects theamount of fiscal operating revenue that can be anticipated in the form of property tax versusother fiscal sources (sales tax, transient occupancy tax, franchise fees, motor vehicle fees,government subventions, service revenue, fines and forfeitures, etc.).The private property portion of the study area accounts for the greatest share of total landarea within the Los Angeles Subarea at 89.0 percent, followed by the Kern Subarea at 46.0percent, the San Bernardino Subarea at 27.0 percent, and finally the Inyo Subarea at 4.0 percent.The overall 2002 assessed value generating property tax revenue is estimated at roughly$22.2 billion. The relative distribution of private property acreage and taxable value (see Exhibit11 in the Socio-Economic Analysis in Appendix N is graphically summarized as follows:70%60%50%40%WEMO PRIVATE PROPERTY VALUE & ACREAGE DISTRIBUTIONShare of WEMO Private PropertyShare of WEMO ValueSubarea Private Property In CitiesShare of Subarea Value in Cities30%20%10%0%WEMO San Bernardino Los Angeles Kern InyoWEMO SUB-AREASThe above graph compares the amount of private land in various subareas of the <strong>West</strong><strong>Mojave</strong> and the corresponding share of assessed value. The bar describing the “Share of WEMOPrivate Property” illustrates how private property is currently distributed across the foursubareas. The bar depicting “Share of WEMO Value” illustrates a similar distribution withrespect to total assessed value. The bar depicting “Subarea Private Property in Cities” identifiesthe proportion of private property in each given subarea that is situated within a City limitboundary. The final bar depicts a similar ratio with respect to the assessed value of such privateproperty.Chapter 3 3-208
The supply of private property in the San Bernardino and Los Angeles subareasrepresents 55.0 and 20.0 percent of total private land in the <strong>West</strong> <strong>Mojave</strong>. The correspondingshare of private property value, however, equates to nearly 60.0 percent and nearly 30.0 percentof the total assessed value of the <strong>West</strong> <strong>Mojave</strong>. In general, private property in the SanBernardino and Los Angeles subareas is being assessed at a higher value per acre than is the casefor private property in Kern and Inyo County.For the <strong>West</strong> <strong>Mojave</strong> overall, only about 15.0 percent of all private property is locatedwithin a City but accounts for 62.0 percent of total assessed value. A substantial portion of <strong>West</strong><strong>Mojave</strong> assessed value (principal determinant of property tax revenue) is concentrated onrelatively limited amounts of private property located within existing City jurisdictions.3.4.1.5.2 Habitat Conservation Area ValuationTo account for vast distinctions that might influence average land value throughout the<strong>West</strong> <strong>Mojave</strong>, a large sample of 2002 property data exceeding 500,000 records was compiledfrom County Assessor records as procured from electronic appraisal data purveyors. In effect, adata sample was compiled that consists of all property records available from Assessor MapBook records roughly approximating the entire <strong>West</strong> <strong>Mojave</strong> in order to reduce bias that may beinherent to a limited sampling randomly selected from diverse micro-market environments. Thesample set used to estimate the average value of private unimproved land within the HCA isbased on a smaller subset of roughly 38,500 data records due to vast amounts of governmentowned lands in these areas.The appropriate mitigation fee reflects an average value reference describing lands to beacquired for habitat conservation, specifically unimproved private property within the proposedHCA. Table 3-42 below summarizes the estimated average value of unimproved privateproperty closely associated with the proposed HCA boundaries.Table 3-42<strong>West</strong> <strong>Mojave</strong> Habitat Conservation Area – Reference Land ValueREF.VALUEChapter 3 3-209SAMPLE SAMPLE REFERENCE LANDAREAEST. OFPRIVATEPrivate Lands/Subareas Per Acre Records Mix Land Area Mix Land Value2002 Assessed ValueSan Bernardino $489 20,208 52% 401,005 64% $196,091,000Los Angeles 2,587 7,755 20% 77,842 12% 201,377,000Kern 650 10,509 27% 95,682 15% 62,193,000Inyo 1 0 0 0% 0 0% 0Previously AcquiredLR2000 Database $457 38 0.1% 51,769 8% $23,658,000Critical Habitat Lands: $772 38,510 100% 626,298 100% $483,319,000Source: County Assessor Records; BLM LR2000 Database; Alfred Gobar AssociatesNote: The designated HCA within Inyo County specifically excludes privately held property.
HCA boundaries in the Inyo subarea specifically exclude any private property holdings.As a result, no effective weighting has been assigned to Inyo County portions of the HCA. Theestimated 2002 average assessed land value describing unimproved private property throughoutthe HCA’s equates to $770 per acre.3.4.2 Livestock GrazingThere are a total of 31 public land grazing allotments (a designated area suitable forgrazing) within the <strong>West</strong> <strong>Mojave</strong> planning area (see map 3-18). The type of livestock and typeof forage allocation for allotments have been designated in the BLM’s CDCA <strong>Plan</strong>. Allotmentsare designated as ephemeral, perennial, or ephemeral/perennial based on the type of forage that isavailable on the allotment. Cattle, sheep, and, horses, or a combination of these may beauthorized to graze on an allotment. Table 3-43 indicates the livestock type and forge typedesignated for each allotment.Table 3-43Livestock Type and Forage Type for AllotmentsALLOTMENT NAME TYPE OF LIVESTOCK FORAGE TYPEAntelope Valley Sheep EphemeralBissell Sheep EphemeralBoron Sheep EphemeralBuckhorn Canyon Sheep EphemeralCady Mountain Cattle PerennialCantil Common Sheep EphemeralCronese Lake Cattle Ephemeral/PerennialDarwin Horses PerennialDouble Mountain Cattle EphemeralGravel Hills Sheep EphemeralHansen Common Cattle/Sheep Ephemeral/PerennialHarper Lake Cattle Ephemeral/PerennialJohnson Valley Sheep EphemeralLacey-Cactus-McCloud Cattle PerennialLava Mountain Sheep EphemeralMonolith-Cantil Sheep EphemeralOak Creek Cattle PerennialOlancha Common Cattle PerennialOrd Mountain Cattle Ephemeral/PerennialPilot Knob Cattle EphemeralRattlesnake Canyon Cattle Ephemeral/PerennialRound Mountain Cattle Ephemeral/PerennialRudnick Common Cattle/Sheep Ephemeral/PerennialShadow Mountain Sheep EphemeralChapter 3 3-210
ALLOTMENT NAME TYPE OF LIVESTOCK FORAGE TYPESpangler Hills Sheep EphemeralStoddard Mountain Sheep EphemeralSuperior Valley Sheep EphemeralTunawee Common Cattle/Sheep PerennialValley Well Horses Ephemeral/perennialWalker Pass Common Cattle Ephemeral/perennialWarren Sheep PerennialThe allotments are classified as either Taylor Grazing Act Section 3 grazing permits orSection 15 grazing leases. Allotments with perennial forage have an established limit of foragebased on the quality and quantity of perennial plants, stated in animal unit months (AUMs) for adefined period of grazing use. An AUM is a measure of perennial or ephemeral feed that willsupport a cow and its calf, a ewe and its lambs, or a bull for one month. Perennial forageconsumption is typically authorized at the same level from year to year unless forage productiondoes not meet seasonal norms. In contrast, grazing use in allotments with ephemeral forage doesnot have an established level or specified period of use. Instead the amount and length ofgrazing use is based on ephemeral production and determined just prior to authorizing thegrazing use.In most cases, BLM authorizes grazing by permit or lease for a period of 10 years. Ashorter period of time is sometimes issued for special circumstances, such as to accommodate ashorter-term lease of the base property or when the Authorized Officer determines that a shortertermauthorization is in the best interest of range management. Additionally, non-renewablegrazing authorization may be issued for special short-term needs such as trailing, or when thereis short-term surplus forage available for grazing. All permits and leases are subject tomodification and to annual adjustments. Such modifications are implemented throughconsultation between the permittee or lessee and the BLM.The permit or lease identifies the number, kind and/or type of livestock that may grazethe allotment, and the grazing period (usually with specific beginning and ending dates). Inaddition, many permits and leases also require adherence to prescribed grazing prescriptions inthe form of grazing systems such as deferred, deferred-rotation, or rest-rotation. Otherauthorizations may have conditions pertaining to turnout dates based on vegetation conditions.Some permittees and lessees have specific grazing utilization standards and other specifiedconditions to protect site-specific areas, such as riparian areas, wildlife habitat, and special statusplant populations. Usually these conditions have been developed in consultation and cooperationbetween BLM and the livestock operator in the form of an allotment management plan or otherplanning effort.Often there are occasions when the permittee or lessee elects to graze less than the fullamount of grazing authorized for the grazing season. Sometimes this is due to environmentallyrelated factors such as droughts or fires, and in other cases it may be to accommodate thelivestock operator’s need to adjust livestock numbers for marketing or livestock husbandryChapter 3 3-211
purposes. Normally the BLM will authorize the requested amount of non-use on a short-termbasis. In some situations the BLM may temporarily authorize another qualified applicant tograze the amount of authorized non-use in an allotment, but this is seldom done.Grazing use of perennial vegetation in all allotments is expected to continue except wherethe permittee or lessee voluntarily relinquishes their lease or permit. Overall, livestockproducers have voluntarily reduced stocking rates for much of the 1990s, resulting in lesslivestock use than the lease or permit allows. Both cattle and sheep grazing have beenauthorized under existing biological opinions in desert tortoise habitat (see Appendix Q).Since 1992, BLM Barstow Field Office lessees with allotments classified as ephemeral/perennial have not requested, nor has grazing been authorized for, ephemeral forage ortemporary non-renewable (TNR) perennial forage. During the same period, lessees andpermittees in the BLM Ridgecrest Field Office with ephemeral/ perennial allotments haveroutinely requested ephemeral authorizations, and have requested and been authorized to useTNR perennial forage. The authorization of ephemeral sheep grazing is common in both areaswhen sufficient ephemeral forage production occurs, although the number of sheep has declinedover the last 10 years.Fewer range improvements have been installed in the last 10 years than in prior years.Installation of new improvements is based on a case-by-case analysis and available funding.Periodic and annual maintenance is required on existing facilities. Some range improvementsare located in designated wilderness areas, primarily on public lands administered by the BLMRidgecrest Field Office. Ongoing maintenance of existing improvements coupled with theaddition of new infrastructure has marginally increased demands for maintenance.The vast majority of grazing allotments is within habitat and/or designated critical habitatfor the desert tortoise. Table 3-44 lists the current grazing permits and leases within deserttortoise habitat in the planning area.Allotment Management <strong>Plan</strong>s (AMPs) have been prepared for about 42 percent of theallotments. Most of the AMPs apply to Ridgecrest Field Office allotments.Table 3-45 presents information on each cattle and sheep grazing allotment. Appendix Oincludes a profile of each allotment, and a table detailing past livestock use of the allotment.Chapter 3 3-212
Grazing AllotmentsNOlanchaDarwinTunaweeLacey-Cactus-McCloudRudnickWalker PassSpangler HillsLava MountainsHansenCantilPilotKnobGoldstoneDoubleMountainWarrenAntelopeValleyBissellBoronShadowMountainsBuckhornCanyonMonolith-CantilGravel HillsHarperDryLakeMiddleSuperiorValley<strong>West</strong>Valley WellStoddard MountainsEastOrd MountainJohnsonValleyCroneseLakeCadyMountainLegendCounty LinesHighways<strong>Plan</strong> BoundaryGrazing AllotmentsCattleSheepHorseCattle and SheepRoundMountainWhitewaterCanyonRattlesnakeCanyon10/14/04<strong>West</strong> <strong>Mojave</strong> <strong>Plan</strong> <strong>FEIR</strong>/SMap 3-18Scale: 1 : 1,750,0000 10 20 30Km0 10 20 30Miles
ALLOTMENTTable 3-44Grazing Permits and Leases for AllotmentsWithin <strong>Desert</strong> Tortoise HabitatACRES INCRITICAL HABITATACRES IN NON-CRITICAL HABITATAntelope Valley 0 1,048Boron 0 10,868Bissell 0 5,596Buckhorn Canyon 12,364 7,634Cady Mountain 0 160,104Cantil Common 91,930 318,949Cronese Lake 30,080 34,170Goldstone 11,061 0Gravel Hills 135,544 0Hansen Common 0 3,549Harper Lake 21,194 5,120Johnson Valley 0 109,186Lacey-Cactus- McCloud 0 1,800Monolith- Cantil 33,193 4,592Ord Mountain 102,141 34,047Pahrump Valley 0 31,338Pilot Knob 37,857 7,762Rattlesnake Canyon 0 12,800Round Mountain 0 0Chapter 3 3-214
ALLOTMENT NAMEALLOTMENTACRESP. L. 1/ TOTAL 2/ACTIVEAUMSTable 3-45Grazing Allotment InformationRANGETYPE3/KIND OFLIVESTOCKACRES OFTORTOISECRITICALHABITATACRES OFTORTOISENON-CRITICALHABITATSEASONOF USE 4/MANAGINGFIELDOFFICEMULTIPLEUSECLASS(M, I & C)AMPCOMPLETED(YES OR NO)Antelope Valley 627 7,871 0 E Sheep 0 1,048 NA Ridgecrest C NoBoron 10,868 82,892 0 E Sheep 0 10,868 NA Ridgecrest C NoBissell 5,596 48,889 0 E Sheep 0 5,596 NA Ridgecrest C NoBuckhorn Canyon 12,364 27,053 NA E Sheep 12,364 7,634 NA Barstow C NoCady Mountain 160,104 231,897 0 5/ E/P Cattle 0 160,104 Y-L Barstow I YesCantil Common 318,949 555,421 0 E Sheep 91,930 318,949 NA Ridgecrest M YesCronese Lake 54,250 65,304 500 E/P Cattle 30,080 34,170 Y-L Barstow I YesDarwin 430 7,232 44 P Horses 0 0 Y-L Ridgecrest I YesDouble Mountain 2 576 38 P Cattle 0 0 5/1-11/30 Ridgecrest C NoGravel Hills 135,544 230,165 NA E Sheep 135,544 0 NA Barstow C YesHansen Common 34,848 72,102 354 E/P Cattle &Sheep0 3,549 12/1-9/30 Ridgecrest M YesHarper Lake 21,602 26,314 600 E/P Cattle 21,194 5,120 Y-L Barstow I YesJohnson Valley 109,186 118,320 NA E Sheep 0 109,186 NA Barstow M NoLacey-Cactus-McCloud 421,172 421,172 1,425 P Cattle 0 18,000 11/1-5/31 Ridgecrest I YesLava Mountain 20,902 20,902 0 E Sheep 2,165 18,737 NA Ridgecrest M NoMonolith-Cantil 37,771 47,553 0 E Sheep 33,193 4,592 NA Ridgecrest M NoOak Creek 23 177 16 P Cattle 0 0 NA Ridgecrest I NoOlancha 1,582 15,876 606 P Cattle 0 0 4/1-6/30 Ridgecrest M YesOrd Mountain 136,188 154,848 3,632 E/P Cattle 102,141 34,047 Y-L Barstow I YesPilot Knob 38,994 45,619 0 E Cattle 37,857 7,762 NA Ridgecrest I NoRattlesnake Cnayon 26,832 28,757 1,081 E/P Cattle 0 12,800 Y-L Barstow I NoRound Mountain 15,253 18,093 880 E/P Cattle 0 0 12/1-3/31 Barstow M NoRudnick Common 150,154 236,184 6,218 E/P Cattle &Sheep0 62,503 Y-L Ridgecrest I YesShadow Mountain 52,258 121,677 NA E Sheep 35,013 69,395 NA Barstow M No
ALLOTMENT NAMEALLOTMENTACRESP. L. 1/ TOTAL 2/ACTIVEAUMSRANGETYPE3/KIND OFLIVESTOCKACRES OFTORTOISECRITICALHABITATACRES OFTORTOISENON-CRITICALHABITATSEASONOF USE 4/MANAGINGFIELDOFFICEMULTIPLEUSECLASS(M, I & C)AMPCOMPLETED(YES OR NO)Spangler Hills 57,695 69,141 0 E Sheep 0 54,143 NA Ridgecrest C NoStoddard Mountain 190,186 312,045 NA E Sheep 112,772 126,202 NA Barstow M YesSuperior Valley 169,200 236,316 NA E Sheep 232,507 0 NA Barstow C NoTunawee Common 51,729 55,931 1,540 E/P Cattle &Sheep0 1,800 2/16-5/31 Ridgecrest I NoValley Well 480 480 24 E/P Horses 0 0 Y-L Barstow C NoWalker Pass Common 88,158 96,974 3,368 E/P Cattle 0 32,058 11/1-6/30 Ridgecrest I YesWarren 4 584 55 P Sheep 0 0 Y-L Ridgecrest M No1/ Acres of Public Land in the grazing allotment.2/ The acres of private, State, BLM, and other ownerships that comprise the area of the grazing allotment.3/ Those allotments classified as ephemeral (E) produce forage from primarily ephemeral (annual) plants. Those allotmentsclassified as perennial (P) produce forage from perennial grass and shrubs. Those allotments with ephemeral and perennial(E/P) forage have a mixture of both range (forage) types.4/ The period livestock typically graze forage on the allotment. Grazing use on some allotments is authorized to occur allΑyear-long≅ or Y-L. The grazing period of use does not apply (NA) to ephemeral allotments because grazing use occurs whenforage is available.5/ The 1982 California <strong>Desert</strong> Conservation Area <strong>Plan</strong> Amendment process authorized 2,010 AUMs of perennial forage forthe Cady Mountain Allotment.
3.4.3 Mineral Potential and DevelopmentThis section describes (1) the mineral potential of the western <strong>Mojave</strong> <strong>Desert</strong>; (2)strategic and critical minerals found in the planning area; (3) the region’s most importantdeposits, (4) current and historic mineral commodity production; (5) issues unique to CoolgardieMesa, and (6) restoration and reclamation procedures. Additional materials, including adescription of mineral management programs adopted by BLM, state and local governments, canbe found in Appendix P.3.4.3.1 Mineral PotentialThe Southern California region, including portions of the <strong>Mojave</strong> <strong>Desert</strong>, is one ofthe most highly mineralized areas in the United States. The minerals are grouped into fourcategories: metallic minerals, industrial/nonmetallic minerals, energy minerals, and constructionmaterials. These are classed on public lands by disposal categories that include: locatable,leaseable, and saleable. Current management practices are described in part 3.4.3.6. Mineralpotential maps (Maps 3-19, 3-20, 3-21 and 3-22) show zones of moderate and high potential foroccurrence of mineral resources 31 .According to the U.S. Bureau of Mines, undiscovered mineral deposits likely exist withinthe western <strong>Mojave</strong> <strong>Desert</strong>, with quantities and grades of minerals that would support profitabledevelopment (U.S. Bureau of Mines, Oct. 1993, Executive Summary, p. 4). When the U.S.Bureau of Mines asked which deposits were the most important non-operating deposits in the<strong>Desert</strong> Tortoise Priority Habitat (DTPH; Categories I & II), it was found that the commoditieswith the most value include borate, decorative stone, and gold, and collectively accounting for 87percent of the total in place value (Almquist, et al., 1993, p. 4). The expected value forundiscovered mineral deposits, at 1992 prices and technology, is over $2 billion (U.S. Bureau ofMines, Executive Summary, Oct. 1993. p. 5; Almquist, et al, 1993, p. 15).Tables 3-46 and 3-47 show acres of moderate and high mineral potential and percentageof those areas having mineral potential.31 Maps are based largely on the mineral inventory for the BLM’s CDCA <strong>Plan</strong> (1980) and supplemented in mostareas by the Mineral Resource Zones (MRZ) from the SMARA classifications done by the California Department ofConservation, as well as classifications completed by the USGS and the U.S. Bureau of Mines for wilderness studyareas. An explanation of the process for gathering and summarizing the data may be found on page 97 of the CDCA<strong>Plan</strong>. An explanation of the methodology of the mineral inventory may be found on pages 1-15, Vol. G, AppendixXIV of the Final EIS and Proposed <strong>Plan</strong> for the CDCA. The BLM mineral potential classification system may befound in BLM Manual 3031 (Energy and Mineral Resource Assessment). It should be emphasized that thisclassification system is for occurrence and not development of mineral resources.Chapter 3 3-217
Mineral Potential, Active and Inactive Mines, andMining Claim Density - Fremont-Kramer DWMAPEAU1PU3ZL AU1CL3AU1CL3PUCU1CU1SGW1AU1AU1SGSGAU1AU1AU1W1AU2CL3ZLAU114395AU1PEPEPEZLHighwaysDWMA BoundariesActive MinesInactive MinesMining Claim DensitySG1 - 6 per section587 - 16 per section17 - 28 per section29 - 50 per sectionGreater than 51Mineral Potential (BLM Manual 3031)HighMediumCL3AU1 AU1BBBAU1CL3CRkAU1W1CRkCL3W1CL2CL3AU1AU110/14/04N<strong>West</strong> <strong>Mojave</strong> <strong>Plan</strong> <strong>FEIR</strong>/SMap 3-19Scale: 1 : 450,0000 10 20Km0 5 10Miles
Mineral Potential, Active and Inactive Mines, and Mining Claim DensitySuperior-Cronese DWMAAU1AU1PEAU1PEPEAU1AU1CRkLegendHighwaysDWMA BoundariesSGActive MinesInactive MinesMineral Potential (BLM Manual 3031)HighMediumSGFE1Mining Claim Density1 - 6 per section7 - 16 per sectionAU1AU117 - 28 per section29 - 50 per sectionGreater than 51ZLSIPU1AU1PU1SIAU1AU1W1AU1ZLMICRkBSISIZLAU1BAW115AU1FE1AU1FE1FE158CRkAU1AU1AU1 CL2BACRkBAAG1BAAG1BACL3PBMNAU1CL3CL3AU1CL3SGSGBSGSGSGMNZLMNMN10/14/04N<strong>West</strong> <strong>Mojave</strong> <strong>Plan</strong> <strong>FEIR</strong>/SMap 3-20Scale: 1 : 500,0000 10 20 Km0 10 20 Miles
Mineral Potential, Active and Inactive Mines, and Mining Claim DensityOrd-Rodman DWMASGMNSGBSGSGSG40MNZLMNAU1AU1AG1SGSGCL1B BAU1CU1AU1AU1AU1AG1CL3CU1LS3LS2CL3AUAU1LegendDWMA BoundariesActive MinesInactive MinesMineral Potential (BLM Manual 3031)FE1HighMediumMining Claim Density1 - 6 per section7 - 16 per section17 - 28 per section29 - 50 per sectionGreater than 5110/14/04N<strong>West</strong> <strong>Mojave</strong> <strong>Plan</strong> <strong>FEIR</strong>/SMap 3-21Scale: 1 : 280,0000 10 20 Km0 5 10 Miles
Mineral Potential, Active and Inactive Mines, and Mining Claim DensityPinto DWMASG62SI NAAU1AU1BABAFE1UAU1AU1AU1AU1AU1DWMA Boundaries<strong>Plan</strong> BoundaryActive MinesInactive MinesMineral Potential (BLM Manual 3031)HighMediumMining Claim Density1 - 6 per section7 - 16 per section17 - 28 per section29 - 50 per sectionGreater than 51CU110/14/04N<strong>West</strong> <strong>Mojave</strong> <strong>Plan</strong> <strong>FEIR</strong>/SMap 3-22Scale: 1 : 180,0000 5 10 Km0 2.5 5 Miles
Locatable Minerals: Known and undiscovered locatable metallic mineral deposits occurringand expected to occur include gold, silver, base metals (copper, lead, and zinc), tungsten andiron. Zones of moderate and high potential for precious and base metals are scattered throughoutthe plan area, with the exception of the military bases where data is scarce, and alluvial filledvalleys to the southwest where exposures are poor. Mining claim density for locatable (metallicand industrial) minerals may be found on Maps 3-23, 3-24, 3-25 and 3-26.Areas of potential for the occurrence of placer gold deposits include the Rand Mountains– Fremont Valley area, the Coolgardie Camp-Superior Valley area and Dale District. TheCoolgardie area has 1,806 acres having moderate potential and 9,890 acres having high potentialfor metallic mineral resources within the Lane Mountain milkvetch HCA (and Superior-CroneseDWMA). There is no estimate for the number of ounces of unrecovered gold for the Coolgardieplacer area in San Bernardino County but there is a persistent occurrence of placer gold over anarea of about 4 square miles (Leszcykowski, et al., 1993, p. 43).Areas having high potential for the occurrence of hard rock gold (disseminated and inveins) include the Randsburg and <strong>Mojave</strong> Districts in Kern County. Gold production, mostlyfrom Randsburg in Kern County, is estimated to be over $25 million per year. Gold reserves atthe Yellow Aster were estimated in 1993 to be 46.8 metric tons with a grade of 0.02 ounces perton (opt) of gold (0.63 grams per metric ton) (Leszcykowski, et al., 1993, p. 37).High potential areas for tungsten are from brines located at Searles Lake, and from quartzvein and metasomatic lode deposits around Atolia, northeast of Lane Mountain, the ShadowMountains, and scattered locations in the Sierra Nevada. Iron potential zones occur inmetasomatic deposits associated with carbonate rock and plutonic intrusions in the CaveMountain area, upper Johnson Valley, and the Bullion Mountains northwest of Dale Lake. Thereare manganese resources in the Cady Mountains, particularly at Sleeping Beauty Mountain in thesouthern part of the range.Potential zones for nonmetallic minerals are associated with known outcrops. Limestoneis known to occur along the east side of the Sierra Nevada, Tehachapi Mountains, Iron Mountain(between Victorville and Barstow), Oro Grande, Victor Valley, Lucerne Valley, Afton Canyon,and the Alvord Mountains.High potential zones for feldspar are located east of Fremont Peak (proposed Superior-Cronese DWMA) and near the Ord Mountains (Ord-Rodman DWMA). Barite resources occurin the Calico Mountains, the Cady Mountains, and the Waterman Hills north of Barstow.Borates are known to occur in Searles Lake, near Kramer Junction (proposed Fremont-KramerDWMA), the Calico Mountains, Daggett Ridge, and near Hector. Zeolites are known to occur inthe Mud Hills, Opal Mountain (both proposed Suerior-Cronese DWMA), near Hector, AlvordMountain, and the El Paso Mountains. Hectorite clay occurs near the Hector railroad siding offof Highway 40, and bentonite occurs in the Mud Hills, Kramer Hills, and the El Paso Mountains.Leasable Minerals: The Coso Known Geothermal Resource Area (KGRA) has highpotential for geothermal steam development beyond the area that has already been developed.The hills east and southeast of Goldstone Lake on Ft. Irwin have high potential for geothermalChapter 3 3-222
development based on the results of drilling five temperature-gradient holes in which watertemperature ranges from 78.5 to 85 degrees F. at a depth of 500 feet. A 5,000-foot hole isplanned in Pink Canyon. If steam is not found at depth, the hot water could be used in a binaryelectrical plant where a heat exchanger with a working fluid such as freon is used to run a turbinewith lower temperature geothermal fluids. Alternatively, the hot water could be used for spaceheating at Ft. Irwin.The Rand KGRA northeast of Red Mountain has high potential for the occurrence ofgeothermal steam resources based on the occurrence of a known steam well. The KGRA haslow potential for development, however, because of the distance from populated areas, andbecause the high potential area is included in the Red Mountain wilderness area, closed tomineral leasing from public lands.Nearly 30 square miles have moderate potential for low temperature geothermal energyin the Twentynine Palms area. The best locations for exploration drilling are on the northeastside of the town, within a nearly eight-square-mile area extending about a mile and a half northand south from Amboy Road from Adobe Road east beyond Bullion Mountain Road (Rogers,1987, p. B1).The planning area is deemed to have low potential for the occurrence of oil and gas basedon a lack of evidence for marine source beds. Paleozoic marine rocks are, in general, toometamorphosed to retain any oil and gas that they may have originally contained. Furtherconfirmation drilling has never substantiated “showings”, although they have been reported ondrill logs (Dibblee, 1967, p. 128-129; Bowen, 1954, p. 181).Both Searles Lake and Boron are Known Leasing Areas for sodium minerals. Inaddition, Searles Lake is known valuable for potassium minerals. Koehn Lake is knownvaluable for sodium minerals and still has three current sodium leases. Dale Lake isprospectively valuable for sodium, and like Koehn Lake is a past producer. The Boron deposit,west of Kramer Junction, is known valuable for sodium minerals (borates). All of these areashave high potential for the occurrence of sodium minerals.Saleable Minerals: Saleable minerals consist mostly of construction materials such ascrushed and dimension stone and sand and gravel in addition to clay used for pond sealant.These deposits are known to occur in many locations throughout the plan area. For example,veneer stone is produced from private and public lands at Rand Mountain in Kern County andlandscaping rock is produced from private and public lands near Barstow in San BernardinoCounty. Resources for the schist flagstone at Rand Mountain exist over an area of 640 acres (2.6square kilometers (Leszcykowski, et al., 1993, p. 39). The estimated wholesale value of thestone produced from public lands is $1.2 million per year ($80 per ton x 15,000 tons) for theRand schist, and $1.5 million for decorative stone near Barstow.High quality sand and gravel deposits, suitable as aggregate for Portland cement concreteor asphalt concrete, are surprisingly few in number and becoming more difficult to developbecause of zoning and environmental restrictions. Such deposits, like gold, are where you findthem and cannot be moved to a more convenient spot to be mined. Many of the sand and gravelChapter 3 3-223
potential areas are actually borrow deposits, suitable for fill, road repair work or subbase. Bynecessity, these must be located near roads and highways. Local sources of aggregate are criticalto lowering construction costs. The average cost of a ton of aggregate will double if it is hauled35 miles (Beeby et al., 1999).Common clays occur in the playas and Tertiary-age sedimentary rocks. Whether thesedeposits have potential for development depends on the proximity to markets and conflicts withother resources.The El Paso Mountains are particularly favorable for the occurrence of pumice andpumicite.3.4.3.2 Strategic and Critical MineralsStrategic and critical materials are materials that (1) would be needed to supply themilitary, industrial, and essential civilian needs of the United States during a national defenseemergency, and (2) are not found or produced in the United States in sufficient quantities to meetsuch needs (U.S. Bureau of Mines, 1983, p. 1). A strategic and Critical Materials Report to theCongress is submitted annually by the Department of Defense. The report details the operationsof the National Defense Stockpile (NDS) and includes tables of the subject metals, minerals andmaterials. Among the 33 items on Table 5 (Stockpile Goals and Inventory Status) aremanganese ore, tungsten ore, lead, silver and zinc, which occur in the planning area.Three zones in the Cady Mountains have high potential for the occurrence of manganeseresources, and several hundred tons of ore were produced during the first and second world wars(Wright et al., 1953, p. 114-117). Manganese is used for hardening steel and the United Stateshas an import reliance of 100 percent, with most coming from Gabon, Brazil, and Australia.Tungsten resources occur at Atolia and Searles Lake. As previously mentioned, up until1938, Atolia was the principal source of tungsten ore in the state. Tungsten is used in hightemperaturestructural materials and electrical elements, and the United States import reliance is68 percent, with most coming from China.Chapter 3 3-224
MANAGEMENT AREATable 3-46Potential for Metallic, Industrial and Construction MineralsFor Each Conservation AreaMETALLIC MINERALS INDUSTRIAL MINERALS CONSTRUCTIONMATERIALSHighPotentialModeratePotentialHighPotentialModeratePotentialHighPotentialModeratePotentialTotal HighPotentialTotal ModeratPotentialSuperior-Cronese DWMA 30,760 45,563 18,896 36,843 1,397 51,053 82,406Newberry-Rodman DWMA 4,581 44,275 4,798 14,479 1,398 10,777 58,754Pinto Mountains DWMA 29,888 20,463 43 29,888 20,506Fremont-Kramer DWMA 18,419 10,119 3,051 649 2,805 108 24,275 10,876<strong>Mojave</strong> Ground SquirrelConservation Area 65,442 131,648 3,574 25,979 13,778 23,597 82,794 181,224Carbonate Endemics 177 4,416 80 257 4,416Alkali Mariposa Lily 1,691 1,691Barstow Wooly SunflowerBendries Thrasher 2,186 7 2,186 7Big Rock Creek 2,404 2,404Lane Mtn Milkvetch 9,890 1,705 9,890 1,705Little San Bern Mtns GiliaMiddle Knob<strong>Mojave</strong> Fringe-toed Lizard 124 1,430 171 0 1,554 171<strong>Mojave</strong> Monkeyflower Newberry 17 426 0 0 1,168 0 1,185 426<strong>Mojave</strong> Monkeyflower Brisbane 5,338 549 651 0 730 0 6,719 549<strong>Mojave</strong> Monkeyflower KelsoNorth Edwards 30 30Pisgah Crater 8,817 8,817Total AcresChapter 3 3-225
Table 3-47MANAGEMENT AREABLM ManagedPercentage of Each Conservation Area HavingHigh and Moderate Mineral PotentialMANAGEMENT AREAACRESPivate andState ManagedOther FederalManagedTotalManagement AreaTotal HighPotentialPercent ofManagementAreaACRESTotal ModeratePotentialPercent ofManagementAreaSuperior-Cronese DWMA 402,962 209,979 9,646 622,587 51,053 8% 82,406 13%Newberry-Rodman DWMA 195,046 48,440 54 243,540 10,777 4% 58,754 24%Pinto Mountains DWMA 109,090 7,240 655 116,985 29,888 26% 20,506 18%Fremont-Kramer DWMA 320,468 190,389 4 510,861 24,275 5% 10,876 2%<strong>Mojave</strong> Ground SquirrelConservation Area 669,352 86,612 1,790 757754 82,794 11% 181,224 24%Carbonate Endemics 4,393 762 10 5,165 257 5% 4,416 85%Alkali Mariposa Lily 67,330 15 67,345 1,691 3%Barstow Wooly Sunflower 18,327 17,884 36,211Bendries Thrasher 9,363 16,390 98,126 123,879 2,186 2% 7
A third item, yttrium (on the USBM list but not the NDS list) occurs as undevelopedresources in the southern part of the planning area. Similar to the “rare earth” elements, yttriumis found in the mineral xenotime in Music Valley at the edge of the Pinto Mountains in RiversideCounty. In 1998 Draco Exploration identified 330,000 short tons of resources containing over700,000 pounds of Yttrium oxide and nearly 1.2 million pounds of additional rare-earth oxides(Moyle & Cather, 1992, p. 57). The United States imports 100 percent of its yttrium, with mostcoming from China. There are no satisfactory substitutes for yttrium regarding its use inelectronics, lasers and phosphors in color television and computer monitors (Hedrick, 2002, p.186-187).Although celestite (along with kyanite, mica and talc), has been determined to be “neitherstrategic nor critical” in the Stockpile Report to Congress for fiscal year 2001 (DOD, p. 55),celestite (an ore of strontium) has been on the stockpile inventory in years past. About 100 acresin the planning area have high potential for the occurrence of strontium resources, and severalthousand tons of celestite were mined during both world wars from the southern edge of theCady Mountains. By far the largest deposits of strontium minerals in California occur in thefoothills of the Cady Mountains (Ver <strong>Plan</strong>ck, 1957, p. 607). Strontium is used for ceramics,ceramic magnets, and glass, particularly television plate glass because of its ability to block X-rays. It also produces the red flame in pyrotechnics, including ammunition tracers and flares.The United States import reliance on strontium is 100 percent.A 1992 study by the U.S. Geological Survey estimated the occurrence of the criticalmetals lead, silver and zinc in the planning area. The report included a figure showing theprobability distributions for each metal in all of the undiscovered deposits that were evaluated.Figures in metric tons were plotted against probability of occurrence ranging from zero to one.At a probability of 0.5, the estimated number of metric tons in the study area was predicted to be200 tonnes of lead, 300 tonnes of silver and 7 tonnes of zinc (Tosdal, et al., Dec. 1992, p. 78).Silver is often produced as a byproduct from gold mining. Gold is being mined at Randsburgand has been recently mined in the <strong>Mojave</strong> gold mining district.3.4.3.3 Identified Resources by CommodityWithin the planning area there are approximately 426,000 acres having moderate to highpotential for the occurrence and accumulation of metallic mineral resources, 126,000 acreshaving potential for the occurrence of industrial minerals, and 47,700 acres having potential forthe occurrence of construction materials. In addition, there are nearly 13,000 acres havingmoderate to high potential for the accumulation of sodium and potassium minerals. There areapproximately 119,000 acres classified as Known Geothermal Resource Areas and 480,000 acresclassified as prospectively valuable for geothermal resources (BLM Manual 3031). Within theplan area there are about ten active mines in critical habitat for the desert tortoise.There are twelve sites near Barstow in San Bernardino County with important resourcesamounting to 16 million tons (Almquist, et al., 1993, p. 4) for landscaping rock (10 crushed stone& two flagstone): black granite, pink granite, beige, Afton green rock (3 quarries), mint green,pink volcanic rock, dusty rose and wine. Flagstone is mined from two sites in the RandMountains. These figures do not include the brown or “gold” colored rock east of BarstowChapter 3 3-227
ecause the study was done before that site was known to be habitat for the desert tortoise.Identified resources for selected producing deposits are discussed above, and nonproducingdeposits are presented below beginning with gold.The Kramer Hills gold deposit on private land has identified resources reported to be 2.0million metric tons (2.2 short tons) averaging 1.3 grams per ton (0.004 ounces per ton) gold andinferred resources of about 2.7 million metric tons (3 million short tons). Metal resources areabout 2,600 kilograms (5,700 pounds) of contained gold (Lewszcykowski, et al., 1993, p. 52).The Olympus mine in San Bernardino County has moderate potential for the occurrenceof vein gold deposits with 1.8 million tons of resources containing 0.11 to 0.22 opt (3.4 to 6.8grams of gold per metric ton).The disseminated deposits in the Calico district contain the largest resources of silver inthe study area with the Waterloo and Langtry deposits near Barstow containing 27 million tons(24.5 million metric tons) averaging 105 grams per ton (3 opt) silver and 11.8 percent barite and15 million tons (13.6 million metric tons) averaging 85 grams per ton (2.5 ounces per ton) and6.0 percent barite respectively (Fletcher, 1986; Tosdal, et al., March 1992, p. 8). Over 4,000acres in the Calico Mountains have been classified under SMARA as MRZ-2b (moderatepotential for occurrence) for silver and barite resources by the California Department ofConservation (Bezore et al., 1997, p. 37).Over 500 acres on the south slope of Ord Mountain (Ord-Rodman DWMA) has beenclassified under SMARA as MRZ-2b (moderate potential for occurrence) for copper andmolybdenum resources by the California Department of Conservation (Bezore et al., 1997, p.24). Sulfide resources are estimated to be 2,600,000 tons (0.26% copper & 0.12%molybdenum), and combined oxide resources are estimated to be 489,000 tons (0.4% copper &0.07% molybdenum).The most important borate resources outside of the active mining area at Boron are theRho and 395 Hill colemanite deposits northwest of Kramer Junction in San Bernardino County.The Rho deposits contain an estimated total of 86 million metric tons (95 million short tons) ofmaterial averaging 5 percent to 17 percent B 2 O 3 , and the 395 Hill contains an unknown quantityof colemanite-bearing shale with abut 3.7 percent B 2 O 3 (Leszcykowski, et al., 1993, p. 47 & 48).The Alvord Mountain limestone deposit has identified resources of 20 million short tons(18 million metric tons) of high-grade whiting limestone and an accompanying 20 million shorttons of cement grade limestone inside a window surrounded by tortoise habitat (Leszcykowski,et al., 1993, p. 45).In 1993 the Calspar feldspar deposit (Ord-Rodman DWMA) contained “a proven orereserve of 150,000 short tons (136,000 metric tons) of milling grade rock…” (Leszcykowski, etal., 1993, p. 57; Randol Mining Directory, 1990, p. 114.) The feldspar occurs in two zones ofroughly 60 acres and 115 acres on either side of Camp Rock Road and has been classified underSMARA as MRZ-2a and MRZ-2b, respectively (high and moderate potential for occurrence) byChapter 3 3-228
the California Department of Conservation (Bezore et al., 1997, p. 36 -37).The Mud Hills zeolite deposit north of Barstow contains resources of at least 207,000tons (188,000 metric tons; Leszcykowski, et al., 1993, p. 52). The Opal Mountain zeolitic tuffhas an estimated resource of 2 million tons (1.8 million metric tons) (Leszcykowski, et al., 1993,p. 41 & 44), and the Alvord Mountain zeolite deposit has resources estimated in the range of276,000 tons (250,000 metric tons).Chemical analysis of water from wells at Kohen Lake in Kern County indicate the watercontains sodium at 0.6 percent to 3.6 percent (6,000 to 36,000 milligrams per liter), chloride at0.9 percent to 5.6 percent (9,000 to 56,000 milligrams per liter), and sulfate at 0.5 percent to 5.4percent (1,500 to 5,400 milligrams per liter). Sodium chloride or salt is a leasable mineral andhas potential use for specialized agricultural products (Leszcykowski, et al., 1993, p. 36).Important resources of sand and gravel occur northwest of Afton Canyon and in the SodaMountains, southwest of Baker in San Bernardino County. The deposit in the CroneseMountains, northwest of Afton Canyon, is one of two identified by Caltrans as a suitable sourceof aggregate along Interstate 15 between Barstow and the Nevada state line. It contains anestimated 6.8 million metric tons (7.5 million short tons) of sand and gravel (Leszcykowski, etal., 1993, p. A-99). The second deposit, known as Opah Ditch, contains an estimated 3 millionshort tons of sand and gravel between the Soda Mountains Wilderness Study Area (WSA) andthe utility corridor. A similar quantity probably occurs within the WSA. The Blackhawklandslide, between Highway 247 and the San Bernardino Mountains, contains an estimated 400to 500 million tons of naturally crushed dolomitic limestone which is potentially suitable foraggregate, road-base, railroad ballast, concrete rock and sand (Fife, 1982, p. 483). The Big RockCreek fan in Los Angeles County contains 2,400 acres having high potential for the occurrenceof sand and gravel. Present extraction is occurring on the nearby Little Rock Creek fan.Future production is expected to be concentrated in the categories of gold (especiallywith a price increase), aggregate (particularly along I-15), and nonmetallic minerals, includingborates specialty clays and limestone (calcite marble and dolomite). Only minor activity isanticipated in lead-zinc-silver deposits due to the small vein type deposit models exhibited bythese metals, high operating costs to mine and recover these minerals, and depressed commodityprices.3.4.3.4 Current and Historic Mineral Commodity ProductionOverview: Mining in the California <strong>Desert</strong> can be traced back to the early nineteenthcentury, when silver and gold were mined along the Colorado River prior to the Sutter's Millgold discovery in northern California in 1848. Since that time, 19 different metallic and 27 nonmetallicmineral commodities have been extracted from the desert (Bureau of LandManagement, 1980, p. 96). Mineral commodities mined currently or in the recent past includemetallic minerals such as: gold, silver, lead, zinc, silver tungsten and iron; industrial mineralssuch as barite, boron, hectorite, bentonite, zeolites, gypsum, sodium, and calcium salts andcompounds, potash, and limestone; materials necessary for transportation and construction suchas sand and gravel, crushed rock, lightweight aggregate (pumice and cinders), dimension stone;Chapter 3 3-229
and minerals of intrinsic and scientific value such as turquoise, opal, jasper, and specimenmaterials. Construction aggregate is the highest tonnage and highest dollar-value commodityproduced in California. In 2000, 240 million tons of construction sand and gravel and crushedstone were produced with a dollar value of 1.4 billion dollars (Kohler, 2000, p.7.3).Annual mine revenue from production from existing mines in the western <strong>Mojave</strong> <strong>Desert</strong>,for Category I and II tortoise habitat alone, is estimated to be $22.2 million, accumulating to248.6 million over the lives of the mines (U.S. Bureau of Mines, Executive Summary, Oct. 1993,p. 4; Almquist, et al., Oct. 1993, p. 7). Prospecting for gold continues throughout the planningarea and production is occurring at Randsburg. Inactive small mines and prospects are scatteredthroughout the planning area. A few select commodities of particularly significance arepresented below.Table 3-48, showing known active mines in each conservation area, lists eight activemines (i.e. a mine with a SMARA plan) in proposed tortoise DWMAs and eight active mines inthe MGS Conservation Areas. In addition there is an aggregate operation in the carbonateendemic management area downslope from the Mitsubishi plant with plans to begin productionafter a rail spur can be acquired.Table 3-48Active Mines Within Conservation AreasCONSERVATION AREAACTIVE MINESBLM Managed Private And State ManagedSuperior-Cronese DWMABeige stone, Afton green stone, MudHills zeolite, Opal Mountain zeoliteNewberry-Rodman DWMA Redtop cindersPinto Mountains DWMAFremont-Kramer DWMA Rand Mountain stone Rand Mountain stone, ShadowMountains dolomiteMohave Ground SquirrelCarbonate EndemicsAlkali Mariposa LilyBarstow Woolly SunflowerBendire’s ThrasherBig Rock CreekLane Mountain MilkvetchLittle San Bernardino MountainsGiliaMiddle Knob<strong>Mojave</strong> Fringe-toed Lizard<strong>Mojave</strong> Monkeyflower – Newberry<strong>Mojave</strong> Monkeyflower – BrisbaneKelso Valley MonkeyflowerNorth EdwardsCoso Mountains pumice, Trona sandand gravel, Trona clay, Back Springsbentonite, Mud Hills zeolite, OpalMountain zeoliteCoolgardie goldRand Mountain stone, ShadowMountains dolomiteHectorite, borate, cindersBoron clayChapter 3 3-230
Table 3-49 shows the number of mining claims and sites within each conservation area.There are approximately 110 active notices and 55 plans of operations within the planning areaboundary.Table 3- 49Mining Claims and Sites Within Management AreasMINING CLAIMS AND SITESMANAGEMENT AREAMILL TUNNELLODE PLACER SITE SITESuperior-Cronese DWMA 73 169 21 0Newberry-Rodman DWMA 163 53 0 0Pinto Mountains DWMA 67 46 0 0Fremont-Kramer DWMA 63 268 1 0<strong>Mojave</strong> Ground Squirrel Conservation Area 146 534 40 0Carbonate Endemics 11 30 0 0Alkali Mariposa Lily Conservation Area 0 0 0 0Barstow Wooly Sunflower Conservation Area 28 0 0 0Bendries Thrasher Conservation Area 0 1 0 0Big Rock Creek Conservation Area 0 0 0 0Lane Mtn Milkvetch Conservation Area 0 22 0 0Little San Bern Mtns Gilia Conservation Area 0 0 0 0Middle Knob Conservation Area 0 0 0 0<strong>Mojave</strong> Fringe-toed Lizard Conservation Area 0 11 0 0<strong>Mojave</strong> Monkeyflower Conservation Area 40 27 2 0North Edwards 0 0 0 0Pisgah Crater Conservation Area 230 65 85 0Total Mining Claims and Sites in MA’s: 821 1,230 149 0Total Mining Claims and Sites in the <strong>Plan</strong>ning Area: 1,577 1,604 268 0Numbers reflect the November 2001 43 CFR 3833 recordation database maintained by BLM. Locations are to the nearest ¼ section. Numbersare by management area and do not differentiate those mining claims lying within two or more management area overlaps.Saline Deposits: The most important nonmetallic commodities found in the Californiadesert region are borate and associated evaporite minerals and saline brines, collectively knownas saline deposits (Dellinger, 1989, p.57).One of the most outstanding discoveries took place in 1863 when J.W. Searles foundborax near present day Searles Lake at Trona, in San Bernardino County. Production of borax,and 14 other associated minerals, from the brines of Searles Lake continue to this day. SearlesLake is an in-situ solution mine administered under the solid leasable mineral regulations at 43CFR 3500. It has a current mine and reclamation plan approved by the BLM and State Mine andReclamation Act (SMARA). Mining is conducted on thirty Federal mineral leases (consisting oftwenty two sodium leases and eight potassium leases) and one sodium permit aggregating 25,662acres of BLM-administered public lands. There are 6,647 acres of private lands included withinthe mining area. The Trona, Argus and <strong>West</strong>end <strong>Plan</strong>ts are located on private lands adjacent tothe mining area. Mining began at Searles Lake in the early 1900s and is expected to continue formany years due to its location at the end of a chain of Pleistocene lakes where rich mineralChapter 3 3-231
deposition occurred. Brines are pumped from the playa lakebed to the plants where desiredminerals are removed, then the brine is returned to the lakebed. Annual production from themine is about 1,400,000 tons of soda ash, 130,000 tons of borates, 43,000 tons of boric acid,220,000 tons of sodium sulfate and 42,000 tons of salt. These products are used for glass,detergents, water treatment, petroleum refining, circuit boards, ceramics, insulation and papermanufacturing.Production of borax and other sodium minerals in the California desert is of national andlocal significance. About 97 percent of the United States production and 43 percent of the worldproduction of borax comes from Searles Lake at Trona, and U.S. Borax at Boron. The California<strong>Desert</strong> produces over $500 million worth of borate minerals per year (Kohler, 2002, p. 49). Themine at Searles Lake has over 700 employees with additional contractors, consultants andservices. It is the largest employer in Trona and the second largest employer for Ridgecrest. TheFederal sodium and potassium mineral leases generate over $3 million Federal mineral royaltieseach year, half of which go into the Federal general treasury and half of which are returned to theState of California for the direct benefit of local public education.Another significant find was the borax deposit at Boron, in Kern County, discoveredaccidentally in a water well drilled in 1926, and mined continuously since 1927. The U. S.Borax Company mines approximately 9,000 tons of ore daily (Siefke, 1991, p. 6.) and 1,100 menand women are employed at the Boron facility (Lyday, 2001, p. 13.2). Borates have many usesincluding the manufacture of high quality glass, fiberglass and chemicals.The world’s largest hectorite mine occurs south of the Cady Mountains in the <strong>West</strong><strong>Mojave</strong> <strong>Desert</strong> <strong>Plan</strong>ning Area. Hectorite is a specialty clay used in high quality paints,pharmaceuticals, cosmetics, and personal care products.In the Calico Mountains, near Barstow, about $9 million worth of borate minerals wereproduced from 1884 to 1907. Over 15 million ounces of silver were mined from the CalicoMountains from 1881 to 1890.Gold: The western <strong>Mojave</strong> <strong>Desert</strong> has been an important source of gold production.Beginning in 1893, mineral production from the Randsburg district was nearly 1 million troyounces of gold and 18 million troy ounces of silver. In addition, more than one million short tonunits (10,000 tons) of tungsten trioxide were mined from the Atolia district form 1904 to the1950s. Gold production up to 1970 was over $20 million (Clark, 1970, p.167). Current goldproduction from the district is estimated to be 80,000 ounces per year. Between 1890 and 1942,185,000 troy ounces (5.8 metric tons) of gold was produced from the Dale District, which occursin both Riverside and San Bernardino Counties (Tosdal, et al., 1992).Up until 1938, Atolia was the principal source of tungsten ore annually in the state, andproduction amounted to over 8,000 metric tons of tungsten (Tosdal, et al., 1992, p. 49).Iron: Iron was produced from the Cave Mountain (Baxter) and Bessemer mines as wellas from numerous small deposits in San Bernardino County as early as 1930. The CaveMountain mine has been active for a number of years. California Portland Cement CompanyChapter 3 3-232
produces about 75,000 tons per year from the mine for use as a flux for making cement (Brown& Monroe, 2000, p. 45).Limestone: Limestone mining in the Victor Valley area began in 1910 at Oro Grande byGolden State Portland Cement Company (currently owned by TXI) (Taylor, 1994, p. 33). Thiswas followed in 1914 by the Black Mountain quarry operated by Southwest Portland CementCompany (currently owned by Cemex). Their Victorville cement plant has recently completed a1-million short ton per year plant expansion (Kohler, 2002, p.50).The capacity of California Portland Cement’s Creal plant was 1.3 million tons per year inthe early 1990s. Located 9 miles west of <strong>Mojave</strong> and well outside of any HCAs, the plant is thefourth largest in California (PCA, 1997).Lucerne Valley is one of the largest limestone producing districts in the United States andis the leading producer of white, high-purity calcium-carbonate products in western NorthAmerica. In 1987 the district had an estimated gross value in excess of $80 million (Brown,1987, p. 52). Annual production is about 1.7 million tons of Portland cement and about 1.5million tons of ground calcium carbonate (Economic & <strong>Plan</strong>ning Systems, Inc., 2002, p. 29 &31). Ground calcium carbonate is used principally for joint cement, carpet backings, asphaltroofing, paint, plastics, paper, rubber, plastics, and even chemical grade for food-andpharmaceutical-grade products (Economic & <strong>Plan</strong>ning Systems, Inc., 2002, p. 30). Production isfrom mostly private land just south of the planning area boundary.The first commercial white limestone-dolomite operations in north Lucerne Valley beganin the 1940's at Peterman Hill (Fife, 1988, p. 175). The Cushenbury limestone quarry wasopened in 1947, and operated intermittently and on a small scale until it was shut down in 1950(Taylor, 1994, p. 33). From 1953 to 1957 Kaiser Steel (currently owned by Mitsubishi CementCorporation) brought a railhead to Lucerne Valley to construct the first cement plant and to openthe first large limestone quarry in Cushenbury Canyon (Fife, 1988, p. 176). This cement plant isreported to be the largest in California. In the early 1960's, Chas Pfizer Mineral and PigmentsDivision (now Specialty Minerals) acquired deposits in Furnace and Marble canyon area in theSan Bernardino Mountains. From the mid 1960s to about 1994 Partin produced limestone fromits Terrace Springs operation on Forest Service land east of Blackhawk Mountain. Thelimestone was used for a white pigment filler-extender used extensively in white stucco andswimming pool construction (Gray, 1982, p. 217). Since 1980, the Marble Canyon deposit hasbeen mined continuously (Taylor, 1994, p. 52). In the mid 1970's Pluess-Staufer (now OMYA)took over the limestone plant originally developed by Sentinel Mining in the upper Crystal Creekdrainage (Fife, 1986, p.36). At the White Knob quarry the Bullion Member of the Monte CristoLimestone yields exceedingly coarse-grained, very white translucent calcite marble (Taylor,1994, p. 53).Geothermal: At Coso Basin, on China Lake NAWS, geothermal steam was recovered in1981 and brought into production in 1987. Present production is about 76 megawatts (MW) peryear, compared with about 195 megawatts for the CDCA, and 930 megawatts for the state. TheCoso Geothermal Resource Area, located on both public lands administered by the BLM andwithdrawn lands administered by China Lake NAWS, is one of the largest and hottestChapter 3 3-233
geothermal fields in the <strong>West</strong>ern United States. There are four production wells on BLMmanagedland in addition to 10 production wells and two water injection wells on Navyadministered land, three 25 MW power-plants under construction or completed, with four powerplantsplanned for the near future. Presently there are two producing leases covering 5,100 acres,and an additional lease of 2,555 acres is considered “held in production” on BLM-managed land.Since December 1988, the Minerals Management Service has collected approximately $50million in royalty, with 50 percent going to the state.Roughly 30,000 tons per year of pumice are produced from the Coso Mountains in InyoCounty.Aggregates: Sand and gravel and other aggregates are produced at a number of locationswithin the planning area from alluvial fans and other sedimentary deposits. Commercialdeposits, however, are limited by transportation costs and, therefore, are usually located nearmarket areas. These commodities are used primarily for ongoing major highway constructionand repair and as aggregate for concrete in urban areas.Service Rock Products (previously Owl) has produced sand and gravel from the Barstowpit on private land since the 1960s. The Crystal Creek drainage in Lucerne Valley has beenmined for sand and gravel as early as the 1950s. The current operator is Hi-Grade Materials.The aggregate resources in this area have an average thickness of 225 feet based on mining inthis area (Miller, 1993, p.39). Production in the Little Rock Creek deposit (near Palmdale andLancaster) began in 1941 (Joseph et al., 1987, p.10) with several operators in production by the1950s (Evans, et al, 1979, p.17). The pit in Twentynine Palms off of <strong>Mojave</strong> Road has beenoperating since the early 1950s by Hi-<strong>Desert</strong> Concrete Products, now owned by GraniteConstruction. Channel Basin & Reclamation is opening the Cushenbury pit in Lucerne Valleywith a production capacity of a million tons per year (Heter, 2002). The Opah Ditch site, in theSoda Mountains southwest of Baker, has been used in the past and will undoubtedly furnishaggregate for paving jobs along Interstate 15 in San Bernardino County. About 10,000 tons peryear of sand and gravel are produced from BLM lands in Inyo and Kern County. Crushed stonesales in the Barstow area for roofing and landscaping rock are estimated to range from 40,000 to50,000 tons per year. Flagstone production from public land in Rand Mountain is estimated ataround 15,000 tons per year.A summary of the most important deposits in the planning area, listed by county, ispresented in Table 3-50.Chapter 3 3-234
Table 3-50Most Important Deposits By CountyRanked In Order Of Relative ContributionCOUNTY COMMODITY ESTIMATEDANNUALPRODUCTION/RESOURCES*San Bernardino Borates 1Sodium Minerals 2Portland Cement 3(mostly limestone)(Victor Valley & Oro Grande)Sand & Gravel 4Sand & Gravel 5Crushed Stone 6Crushed Stone 7Hectorite clayKern Borates 8Gold 9Portland Cement 10(mostly limestone)Flagstone (BLM) 11Inyo Geothermal 12Pumice 13Black Springs Clay 14130,000 tons1,662,000 tons4,500,000 tons________9,800,000 tonsConfidential24,000 tons480,000 tonsConfidential3,300,000 tons80,000 ounces1,200,000 tonsHCAN/A = OUT OF HCAN/AN/AN/A________N/AN/ASup.-Cron, Fre.-KramerN/AN/AN/AN/AN/A15,000 tons Fremont-Kramer DWMA76 megawatts N/A30,000 tons MGS2,500 tons MGSLos Angeles Sand & Gravel 15 13,000,000 tons N/ARiverside Yttrium (undeveloped) 16*330,000 tons Pinto Mtns. DWMAAdditional rare-earth oxides *1.2 million tons: oxides(undeveloped)1 ”Borates” from BLM leases at Searles Lake includes a variety of compounds and products such as borax & boric acid. Production figures fromKathleen Cox, BLM Geologist, Ridgecrest F.O. Production from the Ft. Cady project near Hector site is unknown.2 ”Sodium Minerals” from BLM leases at Searles Lake includes sodium sulfate, soda ash and salt. Production figures from Kathleen Cox, BLMGeologist, Ridgecrest F.O.3 Production figure for Portland cement is a rough estimate based on estimates of the production capacity for the three plants on private land atBlack Mountain, Victorville, and Oro Grande. The Mitsubishi plant is omitted because it is outside of the WEMO planning area.4 Production estimate for private lands in the district including Barstow, Victorville, Oro Grande and Lucerne Valley takes into account importsfrom Lytle Creek; source: Miller, R.B., 1994, Mineral land classification of concrete aggregate resources in the Barstow-Victorville area:California Geology, v. 47, no. 1, p. 8, published by Calif. Div. of Mines and Geology.5 Sand and gravel has been produced since about 1955 from a pit in Twentynine Palms originally owned by Hi-<strong>Desert</strong> Concrete Products andcurrently owned by Granite Construction.6 This figure is a rough estimate for production of decorative rock from three quarries near Lead Mountain (BLM, northeast of Barstow), Afton(BLM, nearly 40 miles northeast of Barstow), and the Shadow Mountains (patented, northwest of Adelanto).7 Production represents an estimate for the composite of four quarries for decorative stone near Barstow, a quarry off of Hodge road and southeastof I-15, and a larger quarry for railroad ballast in the Newberry Mountains (400,000 tons), all on private land.8 The production rate was converted to short tons from the stated 3,000,000 metric tons of raw ore per day from four zones mined by open pit onpatented land at Boron (Lyday, P.A., 2001, Boron: U.S. Geological Survey, Minerals Yearbook 2001, p. 13.2). The amount of borate compoundsproduced was reported to be 570,000 metric tons, equivalent to 628,000 short tons for the year 2000.9 This gold production figure is a very rough estimate for the Rand mine (BLM land) furnished by Randy Porter, BLM Geologist, Ridgecrest F.O.Chapter 3 3-235
This estimate compares with a figure of 100,000 ounces for the year 2000 stated by the Glamis Rand Mining Co. on their web site:www.glamis.com.10 The production figure is based on a rough estimate for the production capacity of the Creal cement plant located on private land 9 miles west of<strong>Mojave</strong>. The California Portland Cement plant is owned by Taiheiyo Cement and is the fourth largest in California.11 Production figure for Rand Mountain schist (flagstone on BLM land) furnished by Randy Porter, BLM Geologist, Ridgecrest F.O.12 Production of 76 MW off of BLM leases: Sifford, A. & Bloomquist, R.G., 2000, Geothermal electric power production in the United States: asurvey and update for 1995-1999, proceedings World Geothermal Congress 2000, Fig. 8, p. 448.13 Estimate of production from BLM land from Randy Porter, BLM Geologist, Ridgecrest F.O.14 Estimate of bentonite production is from George Diverse, BLM Geologist, Ridgecrest F.O. The bentonite is trucked 220 miles to RiversideCounty where it is used for making roofing tiles.15 Estimate of production from several companies operating in Little Rock Creek for 2002-2006 (mostly private land): Joseph, S.E. et al., 1987,Mineral land classification of the greater Los Angeles area, Calif. Div. of Mines and Geology, Special Report 143, Part V, p. 25.16 Estimate of resources on BLM land (no production): Moyle, R.R. and Cather, E.E., 1992, Mineral classification in the California <strong>Desert</strong>Conservation Area, Open File Report 62-92, prepared to illustrate the variety of potential impacts which could occur should the California <strong>Desert</strong>Act or similar legislation become law, U.S. Bureau of Mines, <strong>West</strong>ern Field Operations Center, Spokane, WA, p. 57.Chapter 3 3-236
3.4.3.5 Coolgardie MesaThe Coolgardie mining district, about 15 miles northwest of Barstow, is within theproposed Superior-Cronese tortoise DWMA and overlaps with the west portion of the proposedLane Mountain Milkvetch Conservation Area. This part of the CDCA is managed for miningactivity under Multiple Use Class L (limited). Gasoline or hand-powered dry washing orsluicing has been done intermittently in this area since 1900 and the total historical output wasreported by Clarke (1970, p. 157) to be $100,000. The deposits are in a broad valley and thegold is found as mostly tiny particles in the upper few feet of alluvial cover.Although the heaviest concentration of mining claims lies to the west, there are twentytwomining claims within the Coolgardie Mesa portion of the proposed Lane MountainMilkvetch Conservation Area (see Table 3-51):Table 3-51Lane Mountain Milkvetch Conservation Area Mining ClaimsTOWNSHIP RANGE SECTION CAMC NUMBER CLAIM NAME11N 01W 03 178797264175274362274363274364274365274366274367Lane ViewSheepe-SheepeNew Century INew Century IIMillenium IMillenium IIMillenium IIIMillenium IV12N 01W 31Chapter 3 3-2370658970658980658990659002790943232S 46E 34 11963911964011964127050027248127271128042532S 47E 3233266188270373Rams Head #1Rams Head #2Rams Head #3Rams Head #4Malek F.L.P.Two Quartz #1Two Quartz #2Two Quartz #3J ZERO 1PETE3 WITHCES3 WITCHESRQ#5Rocky DogThere are a few very old pits scattered throughout the area. The vast majority of thesepits have been filled with sand, and vegetation is growing in the disturbed areas. There are a fewbuildings left at the Kinney camp, half a mile west of the proposed conservation area.Members of at least four recreational prospecting and mining clubs frequent the area.The larger clubs may have a membership of 400 families. Most of these individuals areoperating under casual use and may continue to do so as long as they reclaim their hand-dug pitsand the cumulative disturbance does not cause more than “negligible” disturbance. Clubmembers police themselves so as to not to cause unnecessary or undue degradation. One person
lives at the site in a trailer and is operating under a plan of operations. Club activities arediscussed in more detail in Appendix P.3.4.3.6 Reclamation and Restoration ProceduresReclamation: This includes all activities associated with rehabilitating disturbed areasand generally returning it to a second, best productive use. In regulations under 43 CFR 3809.5,reclamation means taking measures required by this subpart following disturbance of public landcaused by operations to meet applicable performance standards and achieve conditions requiredby BLM at the conclusion of operations.Reclamation includes those activities associated with recontouring waste piles, reshapingpit walls and other excavations, removal of permanent or temporary facilities or structures, soilplacement, soil preparation, and in some cases, reseeding and revegetation. Reclamation mayalso include measures to enhance previously disturbed areas or modify areas to conditions thatpreviously existed. Habitat restoration may be required. This normally entails inventory andconsideration of the desired plant community, as well as development of measures and timeframes to assure recovery.Operations under reclamation may utilize the same equipment to affect the reclamationrequirements specified in the plan of operations where dirt work is needed, especially for thesmall level of operations examined under this assessment. Timeframes for completion ofreclamation are considerably shorter than the length of time to create the disturbance. However,monitoring to assure complete reclamation or restoration may take many years, and access to thesite as well as maintenance of facilities associated with reclamation maintenance (e.g., wateringsystems, water sampling sites/wells) are required to be in place during the period.Restoration: This generally means to return the disturbed area to a condition that existedprior to surface disturbing activities. Elements typically include recontouring the surface to apre-existing or natural shape, revegetation or the ability to revegetate with species native to thearea. It may include placement of vegetation in the same locations that existed prior to conductof operations, and re-channeling stream drainages to pre-existing locations and conditions.3.4.3.7 State Designated Regionally Significant Construction Aggregate ResourcesSMARA identifes a program for the classification and designation of regionallysignificant construction aggregate resources. When an area of the state is classified, the StateGeologist transmits a classification report to the State Mining and Geology Board (SMGB) andto the lead agency (e.g the county where the lands identified are located). After receiving thisclassification information, the SMGB may designate specific geographic areas of the State ashaving “statewide or regional significance” for their mineral resources. Pub. Res. Code Section2790. In designating an area, the SMGB takes into account “the adverse effects that might resultfrom premature development of incompatible land uses, the advantages that might be achievedfrom extraction of minerals of the area, and the specific goals and policies to protect against thepremature incompatible development of the area.”Chapter 3 3-238
Areas designated as regionally significant are identified as “known to contain a deposit ofminerals, the extraction of which is judged to be of prime importance in meeting future needs forminerals in a particular region of the state within which the minerals are located and which, ifprematurely developed for alternative land uses, could result in the permanent loss of mineralsthat are of more than local significance.” Pub. Res. Code Section 2726.Varous lands throughout the planning area have been designated as a “RegionallySignificant Construction Aggregate Resource Area” pursuant to the provisions of SMARA. Thedesignation of these lands has been codified in the California Code of Regulations, at Title 14,Section 3550.9. The designation process included substantial environmental review, andincluded the participation of Federal, State and local agencies.3.4.4 RecreationLocated only 90 minutes from downtown Los Angeles, the <strong>West</strong> <strong>Mojave</strong> is therecreational backyard of the metropolitan area’s 17 million residents, of whom nearly 2 millionparticipate in OHV activities and even greater number camp, hike or drive for pleasure. The<strong>Mojave</strong> <strong>Desert</strong> provides an easily accessible, uncrowded recreation experience. The manyrecreation opportunities of the <strong>West</strong> <strong>Mojave</strong> arise from the variety of its mountains, bajadas, drylakes and badlands, the diversity and affluence of its visitors and the sheer volume of space thatits landscape provides.The types of recreation are highly varied. Due to its vastness, many visitors feel a greaterfreedom from regulations that encourages them to try new forms of recreation while not havingto worry about bothering others. Given the scale of the desert and this sense of freedom, it is notsurprising that many of the recreational activities center around vehicles, speed events oractivities that require a great deal of acreage and separation from other visitors. These includemotorcycle activities, four wheel drive exploring, sight seeing, target shooting, hunting,experimental vehicles/aircraft, model rocketry, and dry land wind sailing. Many otherrecreational pursuits that don’t revolve around the recreational aspect of vehicle use are bynecessity (due to the distances involved) dependent upon motorized vehicles. Examples of thisinclude endurance equestrian rides and support vehicles, hiking, mountain biking, bird watching,botany, rockhounding, camping, and picnicking, for which vehicles are a means to accessvarious destinations.3.4.4.1 Patterns of UseAlthough most recreational activities are widely dispersed, certaom activities have “hotspots” that have been established over time. How or why they were established varies from caseto case, but may be due to the features (topography, geology) of the area, proximity to urbanareas, the availability of access into the area, and publicity. Understanding recreation patternsand hot spots is critical to the design of an effective motorized vehicle access network.Chapter 3 3-239
Particular features or land-characteristics may make a given area highly desirable for acertain type (or types) of recreational activity. For instance, flat, expansive terrain is oftendesirable for recreational activities such as target shooting, plinking, driving for pleasure, andmore quick-paced race events. On the other hand, mountainous terrain is often more conduciveto such activities as rock (rope) climbing, rock hounding or technical four wheel rock crawling.The relative proximity of the <strong>Mojave</strong> <strong>Desert</strong> to urban centers makes it easy andconvenient for recreationists to visit those “hot spots” and other areas having the features thatthey desire. About 85% of all visitors to the <strong>Mojave</strong> <strong>Desert</strong> are from the urban areas of SouthernCalifornia. The BLM public lands are closer to the Los Angeles basin than most other similarrecreation areas, such as Death Valley National Park, and offer a far wider variety of recreationalexperiences.Motorized vehicle access, or at least the degree of access, into areas affects thedesirability of that area depending upon the nature of the recreational activity. Access is itself afeature or characteristic that may or may not be sought. For example, a recreationist hoping tophotograph or film particular wildlife undisturbed in its natural habitat would not want access soconvenient that it attracts a large number of other visitors. Recreationists seeking to hike andcamp in remote, difficult to reach areas to experience solitude would not find a location that hasready access from a major highway to be desirable. Conversely, a recreationist seeking to ridehis dune buggy over sand dunes with groups of other people would appreciate easy access.Publicity about an area’s recreational opportunity often attracts users. Although some ofthis publicity can come through the mainstream news media (newspapers, television newsreports), much of it comes by “word of mouth.” A recreation club (motorcycle riding club, fourwheel drive club, dune buggy club, hiking and camping club, equestrian endurance riding club,rock hounding club, rock climbing club, photography club, or wildlife viewing club) may sendout newsletters to its members identifying areas that have those features that are considered idealfor the type of recreational activity that the club engages in. This promotes discussion amongclub members about those areas, and encourages them to recreate there. Recreation clubs areoften drawn to hot spots where people participating in that particular type of recreation cangather and socialize.Publicity is not limited to recreational clubs. Individuals share their experiences witheach other through “word of mouth.” A camper may learn of an excellent campsite thatpossesses desirable features or characteristics. Through one-on-one conversations betweendifferent campers, such an area can become a “hot spot.”Guidebooks and maps publicize favorite recreation sites. Guidebooks are available thatdescribe areas in the <strong>Mojave</strong> <strong>Desert</strong> that offer significant rockhounding and gem collectingopportunities. These guidebooks typically describe the areas of interest in sufficient detail to leadrecreationists to the most promising regions for the activity. Maps published by the AmericanAutomobile Association are particularly popular, for they indicate areas where different types ofrecreational activities occur. Because they are widely distributed, areas highlighted on thesemaps can receive a great deal of notoriety.Chapter 3 3-240
Recreationists engage in activities that make use of more than one type of feature orterrain, and often desire to travel to locations where multiple types of terrain are readily availableor that are relatively close to other areas having different terrain. In dual sport motorcycletouring, for instance, recreationists use motorcycles that are licensed for use on regular streetsand highways but are capable of off-road travel. Recreationists engaged in such touring can rideto the desert on major highways, and then go off-road once a desired trail or special recreationopportunity has been reached. Since a motorcycle is being used, the recreationist can fit throughtight spaces that a larger vehicle, even one with four-wheel drive, is unable to access.The four-wheel drive vehicles have their attractions as well. A single four wheel driveSUV can accommodate more people and items than can a dual sport motorcycle, and can switchfrom regular highway travel to off-road touring without missing a beat. A trend among somerecreationists is to alternate between areas having very different features since the use of theirvehicles grants them such access opportunities. This affords the recreationist a much broaderrange of activities at any given time.Table 3-52 presents a summary of recreation uses throughout the <strong>West</strong> <strong>Mojave</strong>. Itdescribes the primary destinations and recreational activities that occur at particular geographiclocations within the planning area. Detailed tables presenting visitor use levels at popular sitesthroughout the <strong>West</strong> <strong>Mojave</strong> are presented in Appendix T.Table 3-52Summary of Recreational Activities in the <strong>West</strong> <strong>Mojave</strong> <strong>Plan</strong>ning AreaAREA LOCATION PRIMARY DESTINATIONS ANDRECREATIONAL ACTIVITIESNorth El PasoPanamintValleyCentralSearlesEast Fremont<strong>West</strong> ElMirageSouthKramerSouth Newberry/Rodman<strong>West</strong> of Ridgecrest & north ofthe EL Paso sub region.Between North Searles andthe Manly Peak Wilderness.Between North and SouthSearles and surrounding thetown of Trona.<strong>West</strong> of US 395, north ofEdwards Air Force Base andeast of California City.<strong>West</strong> of El Mirage sub regionand west of El Mirage OHVRecreation Area.Between Kramer sub regionand Highway 15, just north ofVictorville.South of the RodmanMountains Wilderness and onthe north edge of the JohnsonValley OHV Area.Chapter 3 3-241This area is dispersed BLM ownership with an approximate sizeof 60 square miles. The area provides access from Ridgecrest tothe El Paso Wilderness and the El Paso sub region.The Panamint Valley BLM area is solid ownership with anapproximate size of 180 square miles and serves as access toNorth Searles sub region, Manly Peak Wilderness and DeathValley National Park.Central Searles is lightly dispersed BLM ownership comprisingabout 60 square miles and offering mining opportunities andaccess to North and South Searles sub regions.East Fremont BLM area is greatly dispersed BLM ownership withan approximate size of 200 square miles. The area offers desertexploring, rock hounding and mining opportunity in closeproximity to California City.<strong>West</strong> El Mirage is greatly dispersed BLM ownership with anapproximate size of 100 square miles. The area offers access toOHV touring and El Mirage Dry Lake.Moderately dispersed BLM ownership with an approximate sizeof 120 square miles. The area offers OHV touring, exploring,mining opportunity and access to Stoddard Valley OHV Area.This is a consolidated BLM ownership of approximately 8 squaremiles. The east boundary fronts a transmission line corridoroffering OHV touring. Also the area offers access to the RodmanMountains Wilderness and the Johnson Valley OHV Area.
AREA LOCATION PRIMARY DESTINATIONS ANDRECREATIONAL ACTIVITIESJohnsonValley SouthCopperMountain<strong>West</strong>CleghornNorth PintoSouth CoyoteEast AvawatzSouth of Johnson ValleyOHV Area and North ofBighorn sub region.North of Joshua Tree NationalPark and northwest of theCity of Twentynine Palms.<strong>West</strong> of the Cleghorn LakesWilderness and bounded byTwentynine Palms MarineBase to the north and west.North of the BLM Pinto subregion and south of theCleghorn Lakes Wilderness.About 30 miles east ofBarstow, south of AftonCanyon Natural Area andnorth of the Sleeping Beautysub region.About 12 miles north of theCity of Baker on Highway 15.Wilderness Study Areas,which surround this area arethe Soda Mountains to thesouth and Avawatz to thewest.Johnson Valley South is moderately consolidated BLM ownershipof approximately 50 square miles in size, mixed with State Landsand private lands. The area offers access to Johnson Valley OHVArea and the BLM Bighorn sub region and Soggy Lake &Creosote Rings Special Management Areas.The Copper Mountain area is a greatly dispersed BLM ownershipof about 100 square miles. The Twentynine Palms Marine Basebounds the area on the north, and Joshua Tree NationalMonument forms the south border. The area offers OHV touringand dual sport activity.The <strong>West</strong> Cleghorn area is a 30 square mile area of consolidatedBLM ownership offering access to the Cleghorn LakesWilderness.The North Pinto is a moderately consolidated BLM areaapproximately 60 square miles in size, offering OHV touring,mining and rock hounding.The South Coyote BLM area is a checkerboard ownership and iscomprised of about 250 square miles. The Cady Mountains arelocated in the center of the area. The area serves as access to theKelso Dunes Wilderness and Afton Canyon Natural Area andSleeping Beauty sub region.The East Avawatz BLM area is about 100 square miles in size andis largely consolidated ownership offering access to WildernessStudy Areas. OHV touring and mining opportunities are availablein the area.BLM’s CDCA <strong>Plan</strong> has designated several areas within the <strong>West</strong> <strong>Mojave</strong> as “OpenAreas.” Within open areas, unlike limited vehicle access areas, there is no “route designation.”Motorized vehicles may travel anywhere, so long as the vehicle is operated responsibly inaccordance with regulations, and subject to the permission of private landowners.The OHV Open Areas receive high levels of dispersed OHV riding. Many repetitiveOHV routes have been created in these areas that riders generally follow. In areas where the useis particularly concentrated, the density of routes can be very high. Table 3-53 briefly describeseach open area, visitor use levels and the principal recreation activities that occur there.Chapter 3 3-242
OPENAREADoveSpringsElMirageJawboneCanyonJohnsonValleySIZEACRESTable 3-53Characteristics of BLM Open AreasVISITS VISITOR PRINCIPALDAYS RECREATIONACTIVITIES3,840 82,000 NotAvailableMotorcycle hill climbing,ATV/Quads, rails; camping,shooting and hunting.25,600 253,374 391,075 Unrestricted OHV recreation.Approximately 50% of theactivity is not classival OHVactivity (i.e. motorcycles,quads, jeeps). The dry lakebedattracts visitors withexperimental vehicles, aircraft,land wind-sailors, etc. Thepredominant OHV activity ismotorcycle use.188,160 NotAvailable60,000 NotAvailableNotAvailablePredominantly dirtbikemotorcycle use engaging in hillclimbing activities, as well asdual sport motorcycle and 4WDtouring/sightseeingUnrestricted OHV recreation.Predominantly dirt bikemotorcycle use, as well as dualsport motorcycle and 4WDtouring/sightseeing. Permittedevents, camping, and dispersedcamping occur in the area.Rasor 22,400 23,702 36,357 Unrestricted OHV recreation.Predominantly dirt bikemotorcycle use, as well as dualsport motorcycle and 4WDtouring/sightseeing. Camping,dispersed camping, andsightseeing occur in the area.SpanglerHills62,080 NotAvailableNotAvailablePredominantly dirtbikemotorcycle use, as well as dualsport motorcycle and 4WDtouring/sightseeing on gentlerolling desert terrain.OHV USE PATTERNSThe entire Dove Springs openarea is used for camping andOHV driving. OHV drivingcenters on riding up and downthe hillsides using all types ofOHVs.Most of the visitor use isconcentrated on and aroundthe dry lakebed. Significantmotorcycle use takes placeaway from the lakebedtowards the mountains to thenorthwest. Visitors generallystay on long-established preexistingroutes. Permittedevents, sightseeing, camping,and dispersed camping occursin the area.Camping areas are oncentratedalong three miles of theJawbone Canyon Road. OHVusers enjoy the challenge ofriding up and down hillsidesthroughout the canyon. Thesteepness of the hillsides thatthe riders use varies frommoderate to extremely steep.Primarily “Green Sticker”motorcycle use participating in“trail riding”. Approximately50% of the Open area’s totaluse occurs in this area.Approximately 50% of thatuse takes place in the form ofpermitted “organized” events(e.g. races).Dispersed OHV useThe area provides many OHVroutes through open, gentledesert terrain.. There are somemore challenging routesthrough hills along the sides ofChapter 3 3-243
OPENAREAStoddardValleySIZEACRESVISITS VISITORDAYS54,400 NotAvailableNotAvailablePRINCIPALRECREATIONACTIVITIESOrganized competitive events.Unrestricted OHV recreation.Predominantly dirt bikemotorcycle use, as well as dualsport motorcycle and 4WDtouring/sightseeing. Permittedevents, camping, and dispersedcamping occur in the area.OHV USE PATTERNSthe open area. Three popularcamping areas are TeagleWash, Wagon Wheel and eastof US-395.OHV use is widely dispersed.Approximately 50% of the useis estimated to be associatedwith permitted events (e.g.MC, rails, jeeps). Heaviest useat staging areas. Visitors tendto stay on pre-existing routesas the terrain becomes rougherand as they travel away fromthe staging areas.3.4.4.2 TrendsCalifornia’s population is increasing rapidly. The State’s population is projected to growfrom 34 millon in 2000 to 46 million by 2020. The population of the planning area is projectedto grow from 795,000 in 2000 to more than 1.5 million people by 2035.California has the greatest number of off-highway vehicle recreation enthusiasts in thecountry 32 . Its 3.5 million recreationists constitute 14.2% of all California households. Since1980, however, the number of acres available to OHVs for recreation has decreased 48 percent inCalifornia’s deserts alone (from 13.5 million acres in 1980 to 7 million acres in 2000). At thesame time, off-highway vehicle “green sticker” registrations have increased by 108%.Attendance at the State of California’s State Vehicular Recreation Areas (SVRAs) increasedfrom 1985 to 2000 by 52%.OHV Vehicle Trends: Californians have embraced the sport utility vehicle (SUV). AsSUV sales increase, the demand for off-highway opportunities for SUV owners is also on therise. Simultaneously, there have been notable declines in motorcycle sales in California withsteady increases in ATV and SUV sales. As a consequence, there appears to be a trend towardwider trails for larger off-highway vehicles (i.e., SUVs) as opposed to single-track trails used formotorcycling.While the demand for OHV recreational opportunities is increasing along withCalifornia’s growing population, OHV opportunities are decreasing. The increase in California’spopulation has caused significant increases in urban development. Encroachment by citiesthreatens many rural OHV recreation areas. As more species are listed as threatened orendangered, sensitive habitats have been closed to OHV access. Air pollution controls imposedby the California Air Resources Board’s Red Sticker Program have restricted the use of two-32 OHV recreation contributes more than $3 billion to California’s economy annually. OHV recreation generatesroughly $1.6 billion in personal income and affects about 43,000 jobs within California.Chapter 3 3-244
cycle engine motorcycles in OHV riding areas to a limited number of months in the year insteadof year-round.Access for Disabled and the Elderly: OHVs allow disabled and elderly people to visitareas that are not otherwise available to them. In 1994, surveys were conducted at the OceanoDunes SVRA. This survey revealed that approximately 9% of all those surveyed had withintheir group a disabled individual who was able to access the dunes and beach because vehicleswere allowed in those areas. Increasing numbers of senior citizens will want to experienceremote outdoor areas via OHV access. As the baby-boomer population continues to age, theywould find it increasingly difficult to access these areas without the use of off-highway vehicles.Behavioral Trends: With expanded leisure time and growing affluence of SouthernCalifornians, conflicts have arisen between those who use vehicles as a means of access andthose who operate vehicles as a recreational activity. Access can be for a variety of purposes,including economic pursuits and for recreation such as hunting and rockhounding. In addition,recreationists compete for space with other resource users. While strongly advocating thatrecreational facilities and regulations remain minimal, desert recreationists increasingly demandthe protection of the natural and cultural values that are essential to most desert recreation. Thepublic often cites scenic values as the <strong>Desert</strong>’s most important resource.“Tread Lightly!” is a national land-use ethics program designed to educate the public onusing but not abusing the environment. This program has educated many OHV users on beingrespectful and responsible land users. As a result of such educational efforts, attitudes withinmany communities have improved on responsible OHV use.A program called “Off-Road Pals,” sponsored by the OHMVR Division and various lawenforcementagencies around California, has reached out to troubled youths, teaching themrespect for the environment and for other people, while learning how to maintain and ride OHVs.This program has thus far provided more than 1,500 youths with positive and life-changingexperiences. Such programs help to reduce juvenile delinquency and improve the lives offormerly at-risk youths.Many OHV enthusiasts have donated their time to projects combating erosion, replantingrecently burned forests, trash collection, renovating trails to improve rider safety, patrolling ofOHV areas, and more. Such volunteerism indicates that most OHV enthusiasts care about theenvironment and are responsible in their use of off-highway vehicle areas.Technological Improvements: OHV manufacturers have made huge strides inimproving their vehicles to minimize excessive noise. Since 1990, noise levels from motorcycledirt bikes have decreased from 96 to 88 decibels. Noise reduction can also be accomplished byutilizing specific design and construction techniques in OHV areas, through careful trail planningand construction of berms to impede or dissipate sound. Further technological innovations arebeing made to reduce noise, and air, pollution.Chapter 3 3-245
3.4.4.3 Off-Highway Vehicle UseUsers of off-highway vehicles engage in many different types of recreation in the <strong>Mojave</strong><strong>Desert</strong>. These can be categorized into two general groups: (1) Where the driving of the vehicleis itself the recreational activity, and (2) Where the vehicle is a means of access to other forms ofrecreation.3.4.4.3.1 Driving OHVs for RecreationThere are various types of OHV recreation. These include general vehicular touring,motorcycle recreation, and ATV and four-wheel-drive use.General Vehicular Touring: Many people engage in recreational touring. Such touringallows visitors to see vast areas of the desert while spending less time on the land itself. OHVtouring may occur on both flat and mountainous terrain using jeeps and similar vehicles.OHV touring vehicles such as the popular SUV have four-wheel-drive (4WD)capabilities to handle off-road work and are designed to be comfortable for normal street usage.They do not have to be towed by another vehicle to particular staging areas; rather, they can bedriven on the highway and, when opportunity presents itself, they can follow a dirt trail.Vehicles that have 4WD capability have a broader range of access opportunities since they cantraverse different types of terrain features.In the mid-1980s, off-road enthusiasts, and state and local government agenciescollaborated to provide a system of interconnected roads and "jeep" trails. Today, over 600 milesof trails have been designated by the State of California as "Back Country Discovery Trails". Agoal of this trail system is to provide a backcountry opportunity for non-traditional trail userssuch as persons with disabilities, senior citizens and families with small children.The California Backcountry Discovery Trail system is one of shared-use. Equestrians,hikers, and cyclists are welcome, although the trail system is designed for off-road enthusiasts.The existing roads that make up the "principle route" network were selected with a stock, sportutility vehicle in mind. The CBDT network provides recreationists with an abundance of OHVtouring opportunities. "Alternate trails" departing and later rejoining the principle route providemore challenging experiences, and are open to greensticker vehicles.Motorcycle Recreation: Many desert recreationists engage in motorcycling andmotorcycle events. In most (but not all) cases, the motorcycles, equipment and supplies have tobe transported to the desired locations by street-legal vehicles, such as SUVs.There are many popular motorcycle events, including enduros, hare n’ hound, harescramble, European scramble, and the grand prix. These events allow participants to ride invarying types of terrain, which present different challenges and require varying degrees of skill.Table 3-54 presents a descriptive summary of motorcycle events.Chapter 3 3-246
One popular activity is dual sport motorcycling. Dual sport motorcycles are designed toperform off-road, and they are also “street legal” for operation on paved roads. Therefore, theuse of a street-legal vehicle to transport the bike is not necessary. A person using this type ofmotorcycle can enjoy riding on the highway, and then go off-road when the desired trail isreached. The dual sport motorcycle gives the rider a broader and more flexible recreationalexperience 33 .NAMETYPE OFSTARTTable 3-54Types of Motorcycle EventsSPEED EVENTYES/NOCOMMENTSGrand Prix Staggered Y The course is ten miles, and speed is importantEuropeanScrambleMass Y The race course is ten miles, using a mass start byclassHareScrambleMass Y The race course is a 30 mile loop repeated forstronger ridersHare &HoundMass Y The racecourse is two thirty-mile loops configured asa figure 8, not repeating the same track in the secondloop. The second loop continues with only half theriders, and riders are spread out to such an extent thatthe second loop can be in a DWMA.Enduro Staggered N This is a time-controlled event, and speeds can beslowed through sensitive areas. Riders loose twopoints for every minute they are early to the finishand one point for every minute they are over thespecified course time.Dual SportRideNA NA This is a tour event and portions of the ride can be onpaved route as well as travel off road. Theparticipant numbers can be limited to 50 to 100entrants and speeds can be limited as well.Each year there are a few commercial tours and dual sport rides on public land. Theseactivities generally use well-defined public land vehicle routes. These tours typically involvemotorcycle and 4-WD sightseeing and exploration tours. There are generally two types ofcommercial tour events: guided and unguided (self-guided):• Guided Tours: A typical guided tour operator might lead two to three tours each year,with participants following a trail leader. The group stops together several times duringthe day to see and learn about various natural and man made features. The trip leader isgenerally an expert on the particular area, and is able to relay information pertaining tonatural and historic resources to participants.• Unguided Tours (including Dual Sport Events): Dual Sport Events, those eventsdesigned for street legal motorcycles capable of off highway travel, are the best example33 The use of SUVs to transport dual sport bikes to motorcycle parks, other staging areas, or trailheads may still bethe desired method of access. This is due largely to the distance that such recreationists travel, and the bulk ofequipment and supplies that are often needed. An SUV allows for safe storage of equipment at the staging area.Chapter 3 3-247
of unguided tours. In these events, participants are given a map and “Roll Chart” thatdepict the tour route turn by turn. There is no element of competition so participants mayarrive at the final destination at their convenience. Often “bail out” opportunities areidentified so that participants can safely leave the off highway portion of the route toreturn to paved roads and the final destination on their own.All Terrain and “Technical” Four Wheel Drive Recreation: ATVs are small motorvehicles with wheels or tractor treads for traveling over rough ground. They often have fourwheel-drivecapability. ATVs are often viewed as being more agile than other four-wheel drivevehicles and can access narrower routes since they are relatively small and handle likemotorcycles. ATVs, however, are only allowed to accommodate one person. ATVs aregenerally not appropriate for dual sport activities, since they are not legal on public highways.Typical four-wheel-drive vehicles (SUVs and jeeps) have fairly similar capabilities,including the capability to travel off-road on rocky terrain. They are significantly larger thanATVs, as they can accommodate several passengers, supplies and equipment. Four-wheel-drivevehicles such as SUVs and jeeps often have “dual sport” capabilities and perform efficiently bothon regular streets, roads, and highways, as well as off-road. SUVs are generally used to traverserelatively flat, yet rough, terrain, while jeeps with their narrower and shorter wheelbase are morecapable of negotiating rougher terrain tnan a typical stock SUV.Technical four-wheel-drive vehicles constitute a class of vehicle that includes jeeps,trucks and SUVs that have been significantly modified from their “stock” condition. Throughthe addition of specialty tires, transmissions, engines and suspensions these vehicles are lessfunctional in open-highway situations, but very effective in traversing otherwise impassibleroutes (e.g. large boulders). “Rock-crawling” is an example of an activity that utilizes vehiclesof this class. Travel is typically very slow (i.e. less than 5 mph) over and around rocks, incontrast to SUV and even jeep touring. Enthusiasts must possess a high level of technical “fourwheeling”skill. They may even employ the use of power winches to pull the vehicle over themore difficult rock formations. The challenge in technical four-wheel-drive use is to apply one’sskills to cross the rocks, rather than tour large regions.Competitive Events: The BLM Ridgecrest Field Office permits about 30 competitiveevents annually. These include about 20 OHV events and 10 dual sport, equestrian, mountainbiking and running events. There are 50 miles of “C” (i.e. competition) routes establishedadjacent to the Spangler OHV Area. The use of these routes for competitive events wasdiscontinued in 2001.The BLM Barstow Field Office permits about 60 competitive events annually. Theseinclude about 50 OHV events and 10 dual sport, in addition to other events. Most of these eventsoccur in the Stoddard and Johnson Valley Open Areas. The best known among these events arethe Barstow to Vegas and Johnson Valley to Parker motorcycle races, neither of which has beenrun in over a decade.Chapter 3 3-248
Compliance With Regulations: Compliance has generally become better withimplementation of the CDCA plan. With the exception of a few areas, OHV free play hasgradually moved to the OHV open areas. Compliance is worst in areas of historic OHV use andadjacent to local communities. Compliance appears to be best achieved when a pro-activeapproach to vehicle management is used, including the identification of outstanding recreationopportunities to direct recreationists to, such as through quality signing and mapping to helpvisitors locate appropriate opportunities, as well as through enforcement and additional educationefforts.The best program for achieving compliance in designated route areas involves:• Keeping open routes well signed.• Revegetating and otherwise rehabilitating closed routes so that they are not apparent oreasy to use.• Maintain a field presence of BLM personnel to contact, inform visitors, and enforce the law.• Establishing BLM-trained and supervised volunteer groups who can assist in keeping theroutes signed and who can contact visitors in order to explain applicable use policies.Once vehicle routes have been designed, they need to be maintained as a way of keepingusers on those open routes. If open routes become too difficult to travel, recreational visitorswould be more likely to utilize closed routes.3.4.4.3.2 Driving OHVs to Access Other RecreationMany visitors use the vehicle as a means to attain a recreation end, rather than as the enditself. These recreation types fall into two classes: (a) point and (b) dispersed forms ofrecreation.Point Forms of Recreation: Often an OHV is driven to a specific destination such as atrailhead, staging area, or campsite. For instance, equestrians use an OHV to tow horse trailersand other equipment to designated staging areas where they can set up for horseback riding. Therecreational activity is not the driving of the OHV itself; it is merely used to access the stagingarea for the equestrian ride. Similarly, hikers may use an OHV to travel to a trailhead; oncethere, the recreationist would then begin their hike.Dispersed Forms of Recreation: This form of recreation is more dependent uponvehicle use than point forms, but the use of the vehicle is still not viewed as the primary sourceof recreation. For instance, a recreationist who desires to photograph a particular species ofwildlife or wildflower may hike, ride a horse or use an OHV to search for a subject. Driving avehicle is not the primary recreation; photography is. Because there is no specific destination,this form of recreation is referred to as “dispersed” rather than “point.”Chapter 3 3-249
3.4.4.4 Economic Contribution of OHV RecreationOff highway vehicle recreationists, whether they use OHVs as a means to access otherforms of recreation, or find recreation opportunities in the driving of the OHV itself, willcontribute to the local economies of the planning area in a variety of ways. These depend on thelevel of use in areas surrounding desert towns, and the future significance of that contributiondepends on the nature of ongoing recreation use trends. Table 3-55 addresses the various waysby which recreation contributes dollars to local economies.REGIONORCITYInyo County(PearsonvilleLittle Lake)KernCountyCaliforniaCity<strong>Mojave</strong>PRINCIPALRECREATIONALACTIVITIESON ADJOININGPUBLIC LANDSCommercial filmingMotorcycle touringLarge range ofvehicle dependentrecreational activitiesOHV touring in theRand and El Pasomountains – off roadmotor cycle playSUV touring, Off-Road Events for 4 X4 and motorcycle andall desert playvehiclesTable 3-55Recreation Economic ContributionOHV USEINNEARBYAREASSOURCES OFECONOMICCONTRIBUTIONTRENDSINGROWTHLow Fuel, food Increasingas the LABasingrowsCummalativelyHighModerateHighLodging, meals,supplies, vehiclerepairs, fuel.Fuel, campingsupplies, and foodVehicle repairsand vehicle parts,fuel, campingsupplies, motels,and foodIncreasingHas beenincreasingwith thegrowth ofthe LABasin.Increasingsignificantlywithgrowth inLA Basinand theincreasingpopularityof desert.COMMENTSMost visitors to the areawill acquire supplies inlarger communities furthersouthGiven the close proximityof this portion of KernCounty to the LA Basin andthat it serves as the“Gateway” to the Sierrasand the <strong>Desert</strong> growth ishigh and is expected toincrease.Visitors coming over theTehachapi and headed to theRands and El Pasomountains will likely stop inCalifornia City. In spite ofrecent closures in theRands, the level of useoutside of California Cityhas not diminished. Theclosures have in factincreased demands on locallaw enforcement due toincreased private propertytrespass.The Tehachapi pass carriesa significant load ofRecreation Traffic from theSan Joaquin valley headedto the <strong>Mojave</strong> Region.Certainly any increase inrecreation activity has apotential for economic gainfor <strong>Mojave</strong>.Chapter 3 3-250
REGIONORCITYRidgecrestSanBernardinoCountyBakerBarstowDaggetPRINCIPALRECREATIONALACTIVITIESON ADJOININGPUBLIC LANDSSUV touring,organized OHVevents, rockhounding,commercial filmingLarge range ofvehicle dependentrecreational activitiesSUV Touring, OHVEvents, 4WD andmotor cycle play,rock hounding,mining explorationSUV Touring, OHVevents, 4WD andmotorcycle play, rockhounding, miningexplorationSUV touring, OHVEvents, 4WD andmotorcycle play, rockhound, miningexplorationOHV USEINNEARBYAREASHighCummalativelyHighLowHighSOURCES OFECONOMICCONTRIBUTIONVehicle repairsand parts, fuel,camping supplies,food, hotelsLodging, meals,supplies, vehiclerepairs, fuel.Vehicle repairsand vehicle parts,fuel, campingsupplies, motels,and foodVehicle repairsand vehicle parts,fuel, campingsupplies, motelsand foodTRENDSINGROWTHIncreasingIncreasingSlightincreasedue toremoteness.IncreasingLow Fuel, and Food IncreasingSlightlyCOMMENTSViewed as both a significantcurrent and future source ofeconomic revenuesGiven the close proximityof this portion of SanBernardino County to theLA Basin and the “InlandEmpire” and that it servesvia I-15/US 395 as the“Gateway” to the Sierrasand the <strong>Desert</strong> growth ishigh and is expected toincrease.Baker is at the eastern edgeof the study area and mostusers come out of the LAbasin and the San JoaquinValley. Therefore mostrecreation expenditures forthe <strong>Mojave</strong> come fromrecreation users not goingthru Baker.Barstow is at the heart ofthe <strong>Mojave</strong> Study Area withtraffic coming in from LAvia highway 15 and fromthe west via highway 58.An increase in recreationrelated expenditures couldhave a significant positiveeffect on Barstow.Dagget is located about 5miles east of Barstow andmajority of travelers willstock up in Barstow andonly use Dagget for lastminute supplies. Thereforea light increase in recreationactivity will have a veryslight economic impact tothis small community.Chapter 3 3-251
REGIONORCITYLucerneValleyLudlowNewberrySpringsTronaPRINCIPALRECREATIONALACTIVITIESON ADJOININGPUBLIC LANDSSUV Touring, <strong>Desert</strong>exploring via 4WDand motor cycle, rockhounding, and miningexplorationSUV touring, OHVEvents, 4WD andmotorcycle play, rockhound, miningexplorationSUV touring, OHVEvents, 4WD andmotorcycle play, rockhound, miningexplorationCommercial filming,motorcycle touringOHV USEINNEARBYAREASLowSOURCES OFECONOMICCONTRIBUTIONFuel, campingsupplies, and foodTRENDSINGROWTHSlightincrease;due to thefact that thearea issomewhat“off thebeatenpath” thelevel ofgrowth isless thanother areas.Low Fuel, and Food IncreasingSlightlyLow Fuel, and Food IncreasingSlightlyLow Fuel, food Increasingasvisitationincreases toDeathValley NPCOMMENTSLucerne Valley is locatedjust north of the SanBernardino Mountainsabout 10 miles east ofApple Valley. Thefollowing BLM sub regionssurround Lucerne Valley:Juniper, Granite, Ord, andBighorn, also to the east isJohnson Valley Off-Highway VehicleRecreation Area. Lucernedoes not serve a largenumber of travelers.Ludlow is located about 50miles east of Barstow andmajority of travelers willstock up in Barstow.Therefore a light increase inrecreation activity will havea very slight economicimpact to this smallcommunity.Newberry Springs is locatedabout 18 miles east ofBarstow and majority oftravelers will to theirbusiness in the bigger city.Therefore a light increase inrecreation activity will havea very slight economicimpact to this smallcommunity.Although most visitors tothe area get supplies inRidgecrest, the futureeconomic contribution tothis economically depressedcommunity is significantChapter 3 3-252
REGIONORCITYVictorville /AppleValleyYuccaValleyPRINCIPALRECREATIONALACTIVITIESON ADJOININGPUBLIC LANDSSUV Touring, OHVEvent, 4WD andmotorcycle play, rockhounding, miningexplorationSUV touring, desertexploring via 4WDand motor cycle, rockhounding, and mingexplorationOHV USEINNEARBYAREASHighLowSource: Advance Resource Solutions, Inc.SOURCES OFECONOMICCONTRIBUTIONVehicle repairsand vehicle parts,fuel, campingsupplies, lodging,foodFuel, campingsupplies and foodTRENDSINGROWTHIncreasingSlightincrease;most of therecreationgrowth isto thenorthwest.COMMENTSVictorville does receive ahigh volume of recreationtraffic leaving the LA basinon Highway 15. It is closeto The Stoddard ValleyOHV Area, Johnson ValleyOHV Area, and Granite,Ord, and Juniper BLM SubRegions. Any increases inOHV recreation could resultin significant monetaryinputs into the localeconomy.Yucca Valley is east of theSan Bernardino Mountains,and south of the BLM subregion of Bighorn and northof the Morongo sub region.Yucca Valley not on majorhighway and relative toother cities not serve largevolume of recreation traffic3.4.5 Circulation and Landfills3.4.5.1 Circulation Element3.4.5.1.1 Transportation MethodsTransportation methods in the <strong>West</strong> <strong>Mojave</strong> are not unlike those of other communities.The movement of humans and agricultural and industrial products in and out of the planning areais provided by a variety of systems associated with smaller urban centers and rural areas. Theplanning area serves as a major transportation corridor taking goods and people in and out of theLos Angeles and Kern County metropolitan areas. With the completion of the Alameda Corridorthe movement of goods is expected to continue to increase. Relatively inexpensive housing andthe rural lifestyle of the planning area make commuting into the more populated coastal areaattractive for many residents. This trend is expected to continue with the large increase inpopulation that is expected. The planning area has a number of different means of transportationand these systems have been developed to connect farm/industrial/commercial centers to cities,and cities to communities within the County and state, and in other states and other nations.State System - California Department of Transportation (Caltrans): The State ofCalifornia has established a series of state-constructed and maintained routes in accordance withChapter 3 3-253
the Street & Highway Code, Art. 3, Sec. 300 et.seq. State roadways in the planning area consistof Interstate freeways, freeways, expressways, highways and surface streets. For more than 100years, Caltrans and its predecessors have been responsible for designing, building, operating andmaintaining the California state highway system. Over time, as the population of California hasincreased, Caltrans’ role has expanded to include rail and mass transit systems. In addition to achanging mix of transportation modes, such as highways, rail, mass transit and aeronautics,Caltrans professionals must consider the integration of various transit issues with land use,environmental standards and the formation of partnership between private industry and local,state and federal agencies.Caltrans operates and maintains 15,000 miles of roadways included in the State HighwaySystem, and is responsible for ensuring proper distribution of the State TransportationImprovement Program, including the application of $3 billion used for construction (1997).Mass Transit: Mass transit and rapid transit systems in the planning area are limited tothe more conventional modes, specifically bus. There are many sources of bus public transitwithin the plan area. The largest providers in the area include:• Victor Valley Transit Authority: The Victor Valley Transit Authority (VVTA) serves thecities of Adelanto, Hesperia and Victorville; the Town of Apple Valley; and theunincorporated communities of Phelan, Wrightwood, Pinon Hills, and Helendale. Thistransit system carries more than a million passengers annually. Service includes standardbus operations, plus curb-to-curb service for disabled persons.• Morongo Basin Transit Authority: The Morongo Basin Transit Authority transportsnearly 143,000 passengers each year in the City of Twentynine Palms, Town of YuccaValley and the unincorporated communities of Joshua Tree, Landers, Flamingo Heights,and Yucca Mesa.• Barstow Area Transport: The City of Barstow administers the operation of the BarstowArea Transit, as well as two San Bernardino County-supported specialized services forseniors and persons with disabilities in the communities of Big River and Trona. Thesystem carries more than 144,000 passengers each year.• Antelope Valley Transit Authority: The Antelope Valley Transit Authority serves theLancaster/Palmdale area. They provide a variety of services including local andcommuter services. The transit system carries more than a million passengers annually.• Kern Regional Transit (KRT): KRT operates a fleet of 30 vehicles ranging in sizefrom 15 passenger paratransit minibuses to thirty-foot, heavy duty transit buses,with service in excess of 1.2 million miles. The Kern Regional Transit connectsTaft, Frazier Park, Lancaster, <strong>Mojave</strong>, Wasco/Shafter, Delano, California City,Tehachapi, Ridgecrest, and Inyokern with Bakersfield and with a ridership of over450,000 passengers.Chapter 3 3-254
Rail: The <strong>West</strong> <strong>Mojave</strong> planning area is a major rail corridor for bringing goods in andout of the Southern California ports and metropolitan area. The entire rail network is operated bythe private sector with the Southern Pacific, the Burlington Northern – Santa Fe rail systemscarrying freight through and beyond the boundaries of the planning area. With the completion ofthe Alameda Corridor rail traffic is expected to increase to even higher levels in the future.Aviation: There are several airports operating in the planning area. These facilitiesprovide opportunities for air traffic and the movement of goods. A wide variety of air flightscome out of the region including small private plane operations, passenger flights and freightmovement. In addition to the municipal and community airports, there are several militaryairfields located within the planning area.Non-motorized Transportation: The climate in the <strong>West</strong> <strong>Mojave</strong> is well suited forbicycle travel at many times during the year. Bikeways exist in most cities and in someunincorporated portions of the planning area. Most bikeways exist as marked lanes on surfacestreets within the communities. Many of the more recently developed portions of the planningarea provide for foot traffic along sidewalks in residential areas while some of the oldersubdivisions make no provisions for pedestrians. Generally speaking, foot traffic pathwaysbetween unincorporated communities are nonexistent.Motor Vehicles: Automobile, truck, and motorcycle traffic can use the varied networkof roads and highways developed by the State and County. This mode of transportation is by farthe most used system in the planning area, with roadways under State, County, service area, andprivate entity control. In addition to the movement of goods by rail, the planning area is a majorcorridor for the movement of goods by truck, again connecting Southern California to the rest ofthe United States. Caltrans, the Counties of Inyo, Kern, Los Angeles and San Bernardino andeach incorporated community manage motor vehicle systems in the planning area. The countiesmaintain many of the roadways within cities by contract.3.4.5.1.2 <strong>West</strong> <strong>Mojave</strong> <strong>Plan</strong>ning Area RoadsThe road system within the planning area is mostly composed of four classifications ofroads: major highways, arterials, collectors and local streets. Design, construction andmaintenance of the surface road system is the responsibility of each local jurisdiction’s roadsdepartment or Caltrans.The following road standards are left purposefully vague do to the numerous jurisdictionswithin the planning area. Specific road standards are available from each local jurisdiction.Major Highways - There are many major roadways that connect this large plan area.Most of the roads are two to four lane roads with some expanding to eight lanes in the moreurban section of the planning area. These roads are state and US routes and are maintained byCaltrans. These roadways include:• State Route 14: This route is classed as a major conventional highway/freeway. It is anorth-south route located in Los Angeles County.Chapter 3 3-255
• State Route 18: This route is classed as a major conventional highway. It is an east-westroute located in the southern portion of the plan area in San Bernardino County, with ashort section in Los Angeles County.• State Route 58: This route is classed as a major conventional highway/freeway. It is aneast-west route located in San Bernardino and Kern Counties. This highway has manyfour-lane sections along its alignment.• State Route 62: This route is classed as a major conventional highway. It is an east-westroute located in San Bernardino County.• State Route 127: This route is classed as a conventional highway. It is a north-south routelocated in San Bernardino and Inyo Counties.• State Route 138: This route is classed as a major conventional highway/expressway. It isan east-west route located in Los Angeles and San Bernardino Counties.• State Route 178: This route is classed as a conventional highway. It is an east-west routelocated in Inyo, Kern and San Bernardino Counties. This Highway expands to four lanesthrough Ridgecrest in the plan area.• State Route 190: This route is classified as a conventional highway. It is an east-westroute located in Inyo County.• State Route 202:This route is classed as a conventional highway. It is an east-west routelocated in eastern Kern County.• State Route 223: This route is classed as a conventional highway. It is an east-west routelocated Kern County.• State Route 247: This route is classed as a conventional highway. It is a north-south routelocated in San Bernardino County.• U.S. Route 95: This route is classed as a major conventional highway. It is a north-southroute located in Eastern San Bernardino County.• U.S. Route 395: This route is classed as a major conventional highway/expressway. It is anorth-south route passing through San Bernardino, Kern and Inyo Counties.• Interstate Route15: This route is classified as a major interstate. It runs northeast throughSan Bernardino County from the southwest corner of the plan area to the northeast.• Interstate Route 40: This route is classified as a major interstate. It runs east west throughthe southern section of the plan area through San Bernardino County.Chapter 3 3-256
Arterials: Arterials are routes with high traffic carrying capacity. An arterial might bedefined as a road which is used, designed to be used, or is necessary to carry high volumes oftraffic. An arterial, when constructed to its ultimate standard, are typically two lanes of trafficand a parking lane each way separated by a median with additional right-of-way on either side.Access is typically limited in order to minimize potential conflicts. Subdivision standards limitaccess to two intersecting local streets between arterials and collectors (1/2 mile distance), withno intersection closer than 660' to another. Also, developers are usually required to abandon theright of vehicular access from lots adjacent arterials. Actual listing of arterial locations is toonumerous for this report. Arterials are usually within a 110' right-of-way and provide aconnecting route between population centers and major highways. Arterials may also form theboundaries for neighborhoods. At present, numerous arterial alignments, especially in the ruralareas, exist at local street standards (approximately 60-foot right-of-way). It is anticipated thatdevelopment and traffic demand would result, ultimately, in the widening of these roads.Collectors: Collectors are the next lower level of traffic carrying capacity. These routescarry lower volumes of traffic than arterials, but more than local streets. Collectors serve ascollections for local street systems directing traffic to the arterials. These roads occasionallyserve as boundary streets for neighborhoods and as a general rule are located along mid-sectionlines. The collectors usually have two-travel lanes and a parking lane each way with minimaladditional right-of-way. While some residential lots may have access to collectors, it ispreferable that access is limited and access to properties is directed to local streets.Local Street: Local circulation routes generally provide access directly to abuttingproperties. Under existing standards, these roadways consist of approximately 40 foot traveledway improved sections and 10-foot parkways on each side. The width of these roads varies agreat deal with newer developments usually having wider travel lanes.3.4.5.2 LandfillsSolid waste produced in the planning area is collected by private contractors anddeposited in the numerous landfills located throughout the region. Landfills in each county aredescribed below. Descriptions include 34 : size and location, presence of septage ponds andfencing, the method of covering the working face, litter control measures, and planned future useof the site. Inactive sites are included on the list. A landfill is a waste management unit at whichwaste is discharged in or on land for disposal. This does not include surface impoundment, wastepile, land treatment unit, injection well, or soil amendments. The State Water Resources ControlBoard establishes the classification for landfills. A Class III facility is permitted to acceptresidential, commercial, industrial, agricultural, demolition and non-hazardous inert wastes. Inaddition to permitted and active landfill sites, illegal dumping occurs throughout the planningarea, including at many “closed” landfill sites. Solid waste management agencies areimplementing actions to discourage illegal dumping, such as providing convenient locations fortransfer stations in more remote communities.34 Source of data is California Integrated Waste Management Board, Solid waste Information System (SWIS) atwww.ciwmb.ca.gov/SWISChapter 3 3-257
Inyo County: There are no landfill sites located within the planning area. The Olanchalandfill has been closed and converted to a transfer station. The Olancha transfer station islocated about a mile east of Olancha on highway 190, and accepts mixed municipal wastes. Thistransfer station has a permitted capacity of 36 cubic yards. There is another limited volumetransfer station on Homewood Canyon Road, about one mile west of Trona-Wildrose Road,which serves the Valley Wells area. The Inyo County Integrated Waste Management Departmentoperates both transfer stations.Kern County: The Kern County Waste Management Department operates Class IIIlandfill sites at Boron, <strong>Mojave</strong>-Rosamond and Ridgecrest. In addition, a transfer station equippedwith 14 three-cubic yard trash bins is available for local resident use in the community ofRandsburg. Property owners are charged a $57 special assessment on their property tax bill forwaste management services. There is no gate fee for residents at the landfills for disposal ofhousehold or yard waste that would normally go into a residential waste can.Commercial/industrial waste disposal fees are $29.00 per ton, and the cost for disposing of deadanimals is $5.00 if 200 pounds for less, and $10.00 for animals larger than 200 pounds. A 50%discount is available for disposal of source separated recyclable materials at a disposal site thathas a recycling program in place for the type of material being disposed.Boron Sanitary Landfill: The Boron landfill is a Class III landfill located in thecommunity of Boron in the southeast portion of the county, and is owned and operated by theKern County Waste Management Department. The 20-acre facility has about 14 acres of disposalarea. The facility is permitted through the California Integrated Waste Management Board for200 tons per day and has a permitted capacity of 1,002,819 cubic yards. Remaining capacity asof June 21, 2001 was 208,632 cubic yards. The estimated closure date for this landfill is 2013.The facility is limited to a landfill; there are no septage ponds. The site is completely fenced withchain-link for security; however, dogs and other scavengers can access the area by digging underthe fence. Ravens are present. The working face is covered daily with a minimum of 6 inches ofcompacted soil or an approved alternate daily cover (ADC) such as a geosynthetic tarp. Litter iscontrolled with a temporary fence that is located downwind from the working face. Litter pickupcrews are deployed after heavy winds.<strong>Mojave</strong>-Rosamond Sanitary Landfill: This Class III landfill is located on Silver QueenRoad in the community of <strong>Mojave</strong>. The facility is owned and operated by Kern County WasteManagement Department. The 40-acre landfill has about 27 acres of disposal area. This facilityis currently being re-permitted to allow for disposal of up to 470 tons per day with a permittedsite capacity of 2,262,243 cubic yards. The facility has a remaining capacity of 443,681cubicyards (as of January 2002 Capacity Study). The estimated closure date for the landfill is 2014.Facilities are limited to an area method type landfill; there are no septage ponds. The site iscompletely fenced with chain-link and hog wire for security. Ravens are present. The workingface is covered daily with a minimum of 6 inches of compacted soil or an approved ADC, suchas a geosynthetic tarp. Litter is controlled with a temporary fence that is located downwind fromthe working face. Litter pick-up crews are deployed after heavy winds.Chapter 3 3-258
Ridgecrest-Inyokern Sanitary Landfill: This is a Class III landfill located on BowmanRoad, 5 miles southwest of Ridgecrest. The facility is owned and operated by the Kern CountyWaste Management Department. The facility is located on 321 acres, 91 acres of which isdevoted to waste disposal activities. The site has a permitted capacity of 5,992,700 cubic yards,and a remaining capacity, as of January 2002, of 1,287,587 cubic yards The landfill is permittedto accept 701 tons of waste per day, and has an estimated closure date of 2012. Facilities arelimited to an area method type landfill; there are no septage ponds. The site is completely fencedwith chain-link and hog wire for security. Dog and other scavengers are able to get in under thefence at certain locations, but ravens are not a major problem. The working face is covered dailywith a minimum of 6 inches of compacted soil or an approved ADC, such as a geosynthetic tarp.Litter is controlled with a temporary fence that is located downwind from the working face.Litter pick-up crews are deployed after heavy winds.Randsburg Transfer Station: This facility is located on Goler Road in the community ofRandsburg to facilitate the handling of solid waste in this rural community. It is a limited volumetransfer operation with a maximum permitted throughput of 60 cubic yards per day.In addition to the Kern County landfill sites, U.S. Borax owns and operates a class IIIlandfill for construction/demolition and industrial wastes at its site on Boron Road in thecommunity of Boron. This site is permitted for 8,500,000 cubic yards with a permittedthroughput of 443 tons per day. Remaining capacity for this site as of May 17, 2001, is 1,400,000cubic yards. This site has an estimated closure date of 2023.Edwards Airforce Base recently closed a small (2 tons per day) class II solid wastedisposal site located approximately 1.5 miles south of Leuhman Ridge, east of Mars Blvd. Thissite was officially closed as of August 1, 2002. The Edwards AFB Main Base Sanitary Landfill isstill operational and accepting waste. This facility is permitted to accept up to 180 tons of wasteper day.Los Angeles County: Two regional landfill sites are located in the Antelope Valley areaof Los Angeles County, and serve the cities of Palmdale and Lancaster, as well as the ruralunincorporated areas. Tipping fees at these facilities is $38.00 per ton. Loads less than one tonare charged a $20.00 fee. Additional information on these and other facilities in the area are asfollows:Antelope Valley Public Landfill: This class III landfill facility, located on <strong>West</strong> CityRanch Road in Palmdale, is owned and operated by Waste Management of California, Inc. Thissite serves the City of Palmdale and the surrounding unincorporated county area. This facilitywas permitted in June 1997 with a permitted throughput of 1,800 tons per day. As of December31, 2000, there was 9,093,000 tons of remaining capacity. It is located on 756 acres of which 54acres are indicated for waste disposal. The site includes a landfill with no septage ponds. It isfenced with six-foot chain-link for security. No scavenger problems of any type have been noted.The working face is covered daily with a minimum of 6 inches of compacted soil or with aspecial cover made of lightweight fibrous material and anchored with tires. Litter control isprovided by a high net fence and portable units located near the working face.Chapter 3 3-259
Lancaster Landfill and Recycling Center: This class III landfill facility is located onEast Avenue F, Lancaster, and serves the city of Lancaster and the surrounding unincorporatedcounty area. The landfill is owned and operated by Waste Management of California, Inc. Itoccupies 276 acres, of which 209 acres are identified for waste disposal. The facility is permittedfor a capacity of 22,645,000 cubic yards with a permitted throughput of 1,700 tons per day. As ofDecember 31, 2000, there was 20,583,180 cubic yards of remaining capacity. The site includes alandfill with no septage ponds. It is fenced with six-foot chain-link for security. Ravens havebeen noted in the area but not in substantial numbers. The working face is covered daily with aminimum of 6 inches of compacted soil or with a special cover made of a light weight fibrousmaterial and anchored with tires. Litter control is provided by a high net fence and portable unitslocated near the working face.In addition to these two landfills, the City of Lancaster owns and maintains a mediumvolume transfer/processing facility at their city yard on North 7 th Street <strong>West</strong>. This 16-acrefacility has a permitted capacity of 11,550 cubic cards with a throughput of 100 tons per day.San Bernardino County: County of San Bernardino Solid Waste Management Division(SBSWMD) is responsible for the operation and management of San Bernardino County’s solidwaste disposal system. SBSWMD owns and operates three landfills and eight transfer stationswithin the planning area. Landfill operations are no longer occurring at the following locationsbecause they are in the process of being closed: Newberry Disposal Site (SWIS # 33-AA-0039),the Phelan Refuse Disposal Site (SWIS # 36-AA-0044, the Hesperia Refuse Disposal Site (SWIS# 36-AA-0050), the Twentynine Palms disposal Site (SWIS# 36-AA-0060), the Lenwood-Hinkley Refuse Disposal Site (SWIS # 36-AA-0061), The Lucerne Valley Disposal Site (SWIS #36-AA-0062), the Yermo Disposal Site (SWIS # 36-AA-0047) and the Apple Valley DisposalSite (SWIS #36-AA-0048).Disposal fees at all county sites is as follows:• $10.00 for up to 500 pounds of ordinary residential waste• $34.30 per ton for residential waste over 500 pounds (prorated)• $84.30 per ton for waste requiring special handling• $103.78 per ton for tiresThe SBSWMD operates the facilities through its contract operator, Burrtec WasteIndustries, Inc. The contract operator handles the day-to-day operations and maintenance of theCounty’s Solid Waste Disposal System, including both its Landfills (both active and inactive)and its Transfer Stations.Additional information on solid waste facilities in San Bernardino County is as follows:Barstow Landfill (SWIS # 36-AA-0046): The Barstow Landfill (BSL) is a Class IIIdisposal facility with two, Class II, lined surface impoundments accepting only non-hazardoussolid wastes. The BSL began operations in 1963 and has been in continuous operation since thattime. The landfill is located in an unincorporated portion of the County on Barstow Road,Chapter 3 3-260
approximately 3 miles south of the City of Barstow, off State Highway 247. The landfill disposaloperations are currently being conducted within an approximately 47-acre refuse disposalfootprint of an approximately 640-acre site; the remaining land is utilized for the scale facility,land farming and surface impoundments. Approximately 480 acres are still undisturbed and arereserved for future expansion. The landfill has a permitted capacity of 3,584,000 cubic yards ofwhich 94,086 cubic yards was remaining as of July 8, 2002. The current operation at the currentpit has an estimated closure date of 2007. The site is located in an area designated by theUSFWS as critical habitat for the desert tortoise. The facility includes a landfill and two septageponds. The active landfill area is fenced for security but the fence is not adequate to keepscavengers out. The ponds are not covered and may attract ravens. The working face is covereddaily with a minimum of 6 inches of compacted soil.Landers Landfill (SWIS # 36-AA-0057): The Landers Sanitary Landfill (LSL) is a ClassIII facility on 637 acres, 44 of which are used for solid waste disposal. The site is located onWinters Road, east of S. Avalon Avenue in the unincorporated community of Landers. The LSLwas acquired by SBSWMD in a land transfer from the Bureau of Land Management inNovember 2000. The landfill has a permitted capacity of 3,080,000 cubic yards, with a permittedthroughput of 1200 tons per day. Remaining capacity was 326,201 cubic yards as of July 8,2002. The site has an estimated closure date of 2008. After that date the material will betransported and be replaced by transfer stations and solid waste will be transported to Victorvilleor Barstow. Facilities include a landfill and four septage ponds. The site is about 80 percentfenced with chain-link for security, which is probably not adequate to keep scavengers out.Recent inspections indicate a very large number of ravens at this facility compared to nine otherlandfills visited in San Bernardino County. The working face is covered daily with a minimum of6 inches of compacted soil.Victorville Landfill (SWIS # 36-AA-0045): The Victorville Sanitary Landfill (VSL) is aClass III regional landfill facility and is located on Stoddard Wells Road, in Victorville. The sitehas a total acreage of 80-acres, 67 of which are used for waste disposal, seven acres were used asseptage drying ponds and six acres comprised a daily/intermediate soil cover borrow area. In1998, the facility ceased accepting liquid waste and in September 2000, the liquid waste surfaceimpoundments were clean closed in compliance with applicable regulations.This facility has a permitted capacity of 7,700,000 cubic yards, with permitted throughputof 1,600 tons per day. The remaining capacity was 277,879 cubic yards as of July 8, 2002. Theactive area of the landfill that is currently in operation has an estimate closure date of 2005. Theexpansion area would continue to operate beyond this date. The facility includes a sanitarylandfill, the inactive surface impoundment area, and a borrow pit. The entire site is fenced withsix-foot chain-link for security and to reduce entry by scavengers. The working face is covereddaily with a minimum 6 inches of compacted soil. There is illegal dumping outside of the fencedarea and litter controls have, at times, not been effective.A biological opinion (1-8-94-F-8) was issued for the 37.5 acre borrow pit locatedadjacent to the landfill. The terms and conditions are generally the same as for the miningoperation, including the installation of tortoise proof fences to keep tortoises out of the pit area.Chapter 3 3-261
Limited Volume Transfer Operation is an operation that receives less than 60 cubicyards, or 15 tons of solid waste per operating day for the purpose of storing the waste prior totransferring the waste to another solid waste operation or facility and which does not conductprocessing activities. Limited salvaging activities and volume reduction may also be conduct aspart of the operation.Apple Valley Community Collection Center: This facility, located on Laguna SeccaDrive in Apple Valley, is a limited volume transfer operation. The facility accepts mixedmunicipal waste and has a permitted capacity and throughput of 60 cubic yards per day.Baker Community Collection Center: This facility, located south of I-15 on KelbakerRoad in the community of Baker, is a limited volume transfer operation. The facility acceptsmixed municipal waste and has a permitted capacity and throughput of 60 cubic yards per day.Daggett/Silver Valley Community Collection Center: This facility, located on thenortheast corner of Hidden springs Road and National Trails Highway in the community ofDaggett, is a limited volume transfer operation. The facility accepts mixed municipal waste andhas a permitted capacity and throughput of 60 cubic yards per day.Hesperia Community Collection Center: This facility, located on Hesperia Dump Roadin Hesperia, is a limited volume transfer operation. The facility accepts mixed municipal wasteand has a permitted capacity and throughput of 60 cubic yards per day.Yermo Community Collection Center: This facility, located on Minneola Road in theunincorporated community of Yermo, is a limited volume transfer operation. The facility acceptsmixed municipal waste and has a permitted capacity and throughput of 60 cubic yards per day.Large Volume Transfer/Processing Facility is a facility that receives 100 tons or moreof solid waste per operating day for the purpose of storing, handling or processing the wasteprior to transferring the waste to another solid waste operation or facility.Lucerne Valley (Camp Rock) Transfer Station (SWIS # 36-AA-0317): This facility,located on 7 acres on Camp Rock Road in the unincorporated community of Lucerne Valley, is alarge volume transfer station. The facility accepts mixed municipal waste and has a designcapacity and a permitted throughput of 14 tons per day.Newberry Springs Transfer Station (SWIS # 36-AA-0371): This facility, located on 3acres on Troy Road and Poniente Drive in the community of Newberry Springs, is a largevolume transfer station. The facility accepts mixed municipal waste and has a permitted capacityof 140 cubic yards per day and a permitted throughput of 7 tons per day.Phelan (Sheep Creek) Transfer Station (SWIS # 36-AA-0382): This facility, located on5 acres on Buckwheat Road in the unincorporated community of Phelan, is a large volumetransfer/processing facility. The facility accepts mixed municipal waste and has a design capacityof 1,600 cubic yards per day and a permitted throughput of 198 tons per day.Chapter 3 3-262
Trona-Agrus Transfer Station (SWIS # 36-AA-0391): This facility, located on 2 acreson 1 st Street approximately 1 mile north of Trona Road in the unincorporated community ofTrona, is a large volume transfer/processing facility. The facility accepts mixed municipal,agricultural, construction/demolition, industrial waste and tires. It has a permitted capacity of352 tons and a permitted throughput of 88 tons per day.29 Palms Transfer Station (SWIS # 36-AA-0390): This facility, located on PintoMountain Road in Twentynine Palms, is a large volume transfer/processing facility. The facilityaccepts agricultural, ash, construction/demolition, industrial, and mixed municipal waste andtires. It has a permitted capacity of 1,600 cubic yards with a permitted throughput of 200 tons perday.Medium volume Transfer/Processing Facility is a facility that receives equal to ormore than 60 cubic yards or 15 tons (whichever is greater) of solid waste per operating; or afacility that receives any amount of solid waste, up to 100 tons per operating day, for the purposeof processing solid waste prior to transferring the waste to another solid waste operation orfacility.Trail’s End Transfer Station (SWIS # 36-AA-0377): This facility, located on 2 acres onMalibu Trail in the unincorporated community of Morongo Valley, is a medium volumetransfer/processing facility. The facility accepts mixed municipal waste and has a permittedcapacity of 120 cubic yards per day, and a permitted throughput of 95 tons per day.In addition to the landfills owned by San Bernardino County, there are several otherpermitted solid waste facilities located within the plan boundaries. Some of these are owned andoperated by private industrial plants for disposal of waste related to their operations. Table 3-56lists these facilities:Table 3-56Private Industrial Solid Waste Disposal Sites in San Bernardino CountyFACILITY &LOCATIONPERMITTEDACTIVITYWASTETYPESACRES CAPACITY/THROUGHPUTAce <strong>Plan</strong>t Dump SiteMariposa Street, Trona(C/T)Solid Waste Landfill Ash 65 T: 198 tons per dayArgus Ash Disposal Site700 Ft. N of First St.TronaMitsubishi Cements <strong>Plan</strong>tCushenbury L.F.Highway 18, LucerneValleyOro Grande Kiln WasteDust DumpNE of Oro GrandeSolid Waste Landfill Ash 77 C /T: 250 tons per daySolid Waste Landfill(Class III)Inert Waste DisposalSite (Class II)Industrial 15 C: 520,400 cubicyardsT: 40 tons per dayOtherdesignated104 T: 233 tons per monthChapter 3 3-263
There is also a privately owned and operated large volume transfer/processing facility,waste tire facility and materials recovery facility, located within the City of Hesperia and servingthe residents of that area, and solid waste facilities located at Fort Irwin. The <strong>Mojave</strong> <strong>Desert</strong> andMountain Solid Waste Authority owns a transfer/processing facility in the City of Victorville.Additional information regarding these facilities is as follows:Advance Disposal Transfer/Processing Facility (SWIS # 36-AA-0337): This facility,located on 7 acres on Mesa Street in the City of Hesperia, is owned and operated by AdvanceDisposal Company. This company handles waste disposal for the City of Hesperia. The site ispermitted as a large volume transfer/processing facility, waste tire location and materialsrecovery facility. Permitted capacity and throughput for the transfer/processing facility is 600tons per day.Fort Irwin Sanitary Landfill (SWIS # 36-AA-0068 & 0413): This facility is owned andoperated by US Dept. of the Army at Fort Irwin. It is a class III solid waste landfill with apermitted capacity of 19,000,000 cubic yards and a permitted throughput of 100 tons per day.The site has 460 acres identified for disposal, and a remaining capacity, as of May 30, 2001, of14,738,5900 cubic yards. There is also a composting facility permitted on 6 acres for thecomposing of green materials and sludge (biosolids). The composting facility is permitted for18,000 cubic yards per day.Victor Valley MRF and Transfer Station: This facility is located on 13 acres in the Cityof Victorville, at the northwest corner of Abbey Land and “B” Street. It is owned by the <strong>Mojave</strong><strong>Desert</strong> and Mountain Solid Waste Authority and operated by Burrtec Waste Industries, Inc. It ispermitted as a large volume transfer/processing facility with a permitted capacity of 500 tons perday and a permitted throughput of 600 tons per day.3.5 MOTORIZED VEHICLE ACCESS NETWORK3.5.1 Policies and Legislation3.5.1.1 Federal Land Policy and Management Act (FLPMA)The Federal Land Policy and Management Act (FLPMA), of 1976, long considered thelandmark legislation that changed the operations of BLM forever, provides a multiple useframework for managing the nation's public lands that focuses on the needs of both present andfuture generations. Under FLPMA, land managers are required to take into account the longterm needs of present and future generations as they make important decisions in themanagement of renewable and nonrenewable resources, including recreation, timber, minerals,watershed, fish, wildlife, rangeland, scientific and historical values. The Act requires BLM toexecute its management powers under a land use planning process that is based on multiple useand sustained yield principles.Chapter 3 3-264
The BLM is an agency of the U.S. Department of the Interior with responsibility formanaging more than 264 million surface acres of America's public lands, and also administers700 million acres of sub-surface mineral estate throughout the nation. The BLM accomplishesthis by planning and managing such resources as outdoor recreation, livestock grazing andmineral development, and by conserving natural, historical, cultural, and other resources on thepublic lands. Most of the public lands managed by BLM are located in 12 <strong>West</strong>ern states, whichincludes California. The 25-million-acre California <strong>Desert</strong> Conservation Area contains over 12million acres of public lands, which BLM manages.3.5.1.2 Executive Order No. 11644In 1971, Presidential Executive Order No. 11644 established the first uniform policiesregarding OHV use on public lands. Each land management agency was directed by this Orderto issue directions as to which trails and areas were open for OHV use and which were not. TheOrder required that OHV use be monitored to assess and minimize associated impacts.3.5.1.3 Federal Regulations (43 CFR 8342.1)The CDCA <strong>Plan</strong>’s motorized-vehicle access element was amended (1982 <strong>Plan</strong>Amendment Three, approved May 17, 1983) to conform with 43 CFR 8342.1 which requiresroute approval to be based on the following criteria:• Areas and trails would be located to minimize damage to soil, watershed, vegetation, air,or other resources of the public lands, and to prevent impairment of wildernesssuitability.• Areas and trails would be located to minimize harassment of wildlife or significantdisruption of wildlife habitats. Special attention would be given to protect endangered orthreatened species and their habitats.• Areas and trails would be located to minimize conflicts between off-road vehicle use andother existing or proposed recreational uses of the same or neighboring public lands, andto ensure the compatibility of such uses with existing conditions in populated areas,taking into account noise and other factors.• Areas and trails would not be located in officially designated wilderness areas orprimitive areas.• Areas and trails would be located in natural areas only if the authorized officerdetermines that vehicle use in such locations would not adversely affect their natural,esthetic, scenic, or other values for which such areas are established.3.5.1.4 California <strong>Desert</strong> Conservation Area <strong>Plan</strong>Section 601 of FLPMA was included by Congress to give direction about the California<strong>Desert</strong> Conservation Area. In section 601, Congress required the preparation of acomprehensive, long-range plan for the CDCA. The purpose of the CDCA <strong>Plan</strong> is to establishguidance for the management of the public lands located in the California <strong>Desert</strong> by BLM inclear accordance with the Congressional intent as stated in the law.Chapter 3 3-265
Goals of CDCA <strong>Plan</strong>: The goals stated in the CDCA <strong>Plan</strong>’s Motorized-Vehicle AccessElement follow:• Provide for constrained motorized vehicle access in a manner that balances the needs ofall desert users, private landowners, and other public agencies.• When designating or amending areas or routes for motorized vehicle access, to the degreepossible, avoid adverse impacts to desert resources.• Use maps, signs, and published information to communicate the motorized vehicle accesssituation to desert users, making sure all information materials are understandable andeasy to follow.The goals in the CDCA <strong>Plan</strong>’s Recreation Element follow:• Provide for a wide range of quality recreation opportunities and experiences, emphasizingdispersed undeveloped use.• Provide a minimum of recreation facilities. Those facilities should emphasize resourceprotection and visitor safety.• Manage recreation use to minimize user conflicts, provide a safe recreation environment,and protect desert resources.• Emphasize the use of public information and education techniques to increase publicawareness, enjoyment, and sensitivity to desert resources.• Adjust management approach to accommodate changing visitor use patterns andpreferences.• Encourage the use and enjoyment of desert recreation opportunities by specialpopulations, and provide facilities to meet the needs of those groups.The goals for motorized-vehicle access / routes of travel designations / recreation are to:• Designate routes of travel consistent with the criteria at 43 CFR 8342.1, discussed below.• Provide for competitive off-highway vehicle events in a manner that protects desertresources.• Establish stopping, parking, and vehicle camping limitations consistently.The CDCA <strong>Plan</strong> defined open and closed routes as follows:• Open Route. Access on the route by motorized vehicles is allowed. Specific uses withpotential for resource damage or significant conflict with other use may require specificauthorization.• Closed Route. Access on route by motorized vehicles is prohibited except for: (1) fire,military, emergency or law enforcement vehicles when used for emergency purposes; (2)combat or combat support vehicles when used for national defense purposes: (3) vehiclesused for official purposes by employees, agents, or designated representatives of thefederal government or one of its contractors. Use must be consistent with the multiple useguidelines for that area.Chapter 3 3-266
Route designations apply only to routes and portions thereof on public lands; thedesignation of routes as “open,” and “closed” is not applicable on non-public lands.3.5.1.5 Route Designation DefinitionsRoute designation definitions of open and closed routes were established in the amendedCDCA plan. The definitions are shown here as an aid to the reader.• Open Route. Access on the route by motorized vehicles is allowed. Specific uses withpotential for resource damage or significant conflict with other use may require specificauthorization.• Closed Route. Access on route by motorized vehicles is prohibited except for: (1) fire,military, emergency or law enforcement vehicles when used for emergency purposes; (2)combat or combat support vehicles when used for national defense purposes: (3) vehiclesused for official purposes by employees, agents, or designated representatives of thefederal government or one of its contractors. Use must be consistent with the multiple useguidelines for that area.In determining route designations, the following must be kept in mind:• Route designations approved through the WEMO <strong>Plan</strong> constitute CDCA <strong>Plan</strong> decisions;future changes to these decisions would require amending the CDCA <strong>Plan</strong>.Route designations apply only to routes and portions thereof on public lands; thedesignation of routes as “open,” and “closed” is not applicable on non-public lands.3.5.2 Motorized Vehicle AccessThere is a close relationship between the pursuit of recreational activities and motorizedvehicleuse in the California desert, whether motorized vehicles are driven for pleasure or aresimply a means of access to recreation destinations such as campgrounds and wildernesstrailheads. Given the desert's vast expanse and great distances to recreation sites, it is difficult, ifnot impossible, in many circumstances, to engage in recreational activities in this region withoutemploying a motorized vehicle in some fashion. Therefore, actions that restrict vehicular accessmay affect opportunities for recreation depending on the specific activity pursued and/or thespecific location at which such restrictions are imposed. Routes of travel designations directlyinfluence opportunities for recreation and affect access for non-recreational pursuits.Accordingly, motorized-vehicle access, routes of travel designations, and recreation areaddressed as a single issue.Chapter 3 3-267
3.5.2.1 Motorized Vehicle Access NeedsMotorized vehicle access to public lands in the planning area is needed for a variety ofactivities. These include OHV touring, motorcycle events (e.g., challenges, speed, and othercompetitive events), trailheads and staging areas (for hiking, camping, equestrian riding, gemcollecting and rock hounding, hunting, etc.), private land access, utility maintenance, and mineralproduction.OHV Recreational Touring: OHV touring often occurs on flat terrain, but such touringalso takes place in mountainous terrain using jeeps and similar vehicles. Vehicles that allow formulti-terrain travel have a broad range of access needs since they can traverse different types ofterrain features.Motorcycle Events: OHV access is necessary, not only due to the distance that must betraveled to reach the site of a motorcycle speed, challenge, or other competitive event occurs, butalso because significant equipment and supplies must be brought to event staging areas. This istrue even for dual sport motorcycles, despite their “street legal” status, because a larger OHVmay still be necessary to transport related equipment and supplies to motorcycle parks, otherstaging areas, or trailheads. This is due largely to the distance that such recreationists travel toparticipate in their activity, and the motorcycle’s limited carrying capacity.Camping and Hiking: Visitors need OHV access to staging areas and trailheads, andmust bring supplies to camp in the <strong>Desert</strong> areas. Campers generally stay at locations that arefairly remote to obtain the level of solitude that is associated with the camping experience. In thedesert, these locations are typically not located along major highways. Hikers use OHVs toreach trailheads and staging areas that are often quite remote.Equestrian Riding: Equestrians use motorized vehicles to pull their horse trailers, andother equipment and supplies, to staging areas where they unload their horses, saddle up, andotherwise prepare for rides. Without the use of OHVs, equestrians would be unable to reachthese staging areas, where watering holes, corals, and related facilities are commonly present.Gem Collecting and Rock Hounding: This activity generally occurs in geologic areasthat offer the possibility of finding desired gems and rocks. Many of these areas are remote, anda four-wheel-drive OHV is needed to access them. The vehicle is also required to bring thevariety of supplies necessary to safely participate in this form of recreation.Hunting: Hunters require OHV access to reach trailheads and staging areas, which tendto be remote. From here, they can set out to hunt. Hunters use motorized vehicles to carry theirsupplies and equipment, which may include camping gear.Private Land Access: Private lands may be surrounded by public lands, or abut publicland in a checkerboard type fashion. The surrounding public lands may lack major highways,and have rough terrain on which street vehicles cannot travel. Four-wheel-drive OHVs arerequired to access these private inholdings.Chapter 3 3-268
Utility Maintenance: Many powerlines, pipelines and fiberoptic cables cross the desert;microwave and other sites are located on public lands. Although many of these sites are not inextremely mountainous terrain, they may not be accessible by major paved highways. Accessusing unpaved desert routes may be necessary to allow routine maintenance of these facilities tooccur.Mining Production and Exploration: Many mineral production sites cannot beaccessed by paved road, and the terrain where they are located may be rather rough. Motorizedvehicles may be necessary, however, both to haul supplies and equipment in, and to bringminerals out.3.5.2.2 Off Road Vehicle Designations Prior to 2002Off-road vehicle designations have been completed by BLM in the <strong>West</strong> <strong>Mojave</strong>planning area, although they have not yet been adopted as a component of the CDCA <strong>Plan</strong>.These designations occurred through a <strong>West</strong> <strong>Mojave</strong>-wide effort in the middle 1980s, during thepreparation of ACEC plans, and during a late 1990s pilot project at Ord Mountain, and identified3,266 miles of open routes within the planning area.1985-87 Off-Road Vehicle Designations: BLM conducted a field and map inventory ofoff highway vehicle routes throughout the planning area in the mid-1980s and, based upon thatinventory, identified a network of open motorized vehicle access routes. BLM personnelinventoried and evaluated existing routes of travel. Information from existing maps and aerialphotos was supplemented by field checks. This information was then utilized to create a knownroute inventory that primarily consisted of known “two-track” routes (i.e. “single-track”motorcycle routes were generally not part of the inventory). Public meetings were conductedand members of the public also reviewed these route inventories. Criteria for determining whichroutes were to remain open was based upon public access needs, recreational values and resourceconflicts. Following public meetings, decisions to designate the route network were announced.On August 21, 1985, BLM published a Notice in the Federal Register titled Off-RoadVehicle Designation Decisions; Ridgecrest Resource Area, CA (Federal Register, Vol. 50,No.182). Two years later, on June 19, 1987, BLM published Federal Register notice titled Off-Road Vehicle Route Designation Decisions for the California <strong>Desert</strong> District, Barstow ResourceArea (Federal Register, Vol. 52, No.118, p.23364); and, on September 22, 1987 BLM publishesa Federal Register notice titled Off-Road Vehicle Route Designation Decisions for the California<strong>Desert</strong> District, Barstow Resource Area (Federal Register, Vol. 52, No. 183, p. 35589). Thesenotices opened 2,949 miles of off highway vehicle routes.Other Off Road Vehicle Designations: Since 1980, many BLM ACEC and other localmanagement plans identified identified motorized vehicle access networks, collectivelyidentifying 317 miles of open routes. Table 3-57 lists these plans, together with the date theroute network in each was developed.Chapter 3 3-269
ACECNAME ANDNUMBERAfton Canyon(43)Amboy CraterNational NaturalLandmark (87)Barstow WoollySunflower (36)Bedrock Springs(24)Big MorongoCanyon (50)BlackMountain (35)Calico Early Man Site(40)ChristmasCanyon(23)CroneseBasin<strong>Desert</strong> TortoiseResearch Natural Area(22)Fossil Falls(10)Table 3-57ACEC Route Networks and Principal Recreation ActivitiesSIZEACRESROUTEDESIGNATIONYEARChapter 3 3-270ROUTESTATUS4,726 1989 26 mile designatedroute system679 NA One access route toparking area.314 1982 Mapped routesexcluded; vehiclesExcluded From NW¼ of Section 11;T11N; R6W785 1987 Mapped designatedroute system28,274 19821996Mapped designatedroute system; Routesdesignated in 2002Coachella Valley<strong>Plan</strong> Amendment61,806 1988 26-mile designatedroute system898 1984 Mapped designatedroute system3,444 NA No route designationbecause most ofACEC is withinOpen area10,226 1984 Mapped designatedroute system25,695 1988 Designated closed tovehicular use;protected byperimeter fence1,667 1986 Designated routesystemGreat Falls Basin (12) 9,726 1987 Mapped designatedroute systemPRINCIPALRECREATIONACTIVITIESCamping, vehicular touring,equestrian, rock hounding,recreational mining on outsideedges of area.Geologic exploration, rockhoundingNon-vehicular dependent:Hiking, botanizingAccess to prehistoric valuesand Northern portion of theGolden Valley WildernessAreaHiking, wildlife viewing,picnickingOHV recreation and touring,equestrian riding, hiking,camping, prehistoric andhistoric interpretation,recreational mining onnortheastern fringe of area,wilderness recreation.OHV touring, hiking,camping, prehistoric andhistoric interpretationOHV recreation and touring,historic interpretation.Located in between SpanglerHills OHV area and ChinaLake Naval Weapons Center.OHV touring, bird-watching,wildlife viewingHiking, wildlife viewing,shooting.OHV touring, prehistoricappreciation. Located at northend of East Sierra subregion.OHV touring, picnicking, birdwatching,wildlife viewing.Located just north of Trona.
ACECNAME ANDNUMBERHarper Dry Lake(37)Jawbone/Butterbread(20)Juniper Flats(45)Last Chance Canyon(21)Manix(85)SIZEACRESROUTEDESIGNATIONYEARROUTESTATUS475 1982 Mapped designatedroute system; allroutes within 100yards of marshvegetation closed187,486 1982 133 mile designatedroute system2,528 1988 Mapped designatedroute system5,913 1982 Designated routesystemPRINCIPALRECREATIONACTIVITIESOHV touring, bird-watching,equestrian riding. Locatedsouthwest of Black MountainWilderness Area.OHV touring, bird-watching,wildlife watching, rockclimbing.Located south ofEast Sierra subregion.Equestrian riding, OHVrecreation and touring, accessto Deep Creek hot springs.Located north of SanBernardino Mountains.OHV recreation and touring,historic appreciation, wildlifeviewing. Located south of ElPaso Mountains WildernessArea.2,897 NA None Paleontological and historicinterpretation, OHV touring.Located south of Coyotesubregion.<strong>Mojave</strong> FishhookCactus (77)628 1990 Designated routesystemRainbow Basin (39) 4,087 1991 30 mile designatedroute systemRed Mountain Spring(formerly SquawSpring) (26)Rodman MountainsCultural Area(84)Rose Springs(7)Sand Canyon(11)717 1987 Mapped designatedroute system; areaclosed to vehiculartravel6,204 Routes outsideRodman Mtns.Wilderness weredesignated as part ofOrd-Rodman <strong>Plan</strong>859 1985 Routes designatedclosed2,609 1989 Specific routeclosuresOHV touring, botanizingCamping, OHV touring,equestrian riding, hiking,geologic, paleontological andprehistoric interpretation.Located in middle of Superiorsubregion.Prehistoric and historicinterpretation. Located innorthern portion of RedMountain subregion.OHV touring and recreation,cultural interpretation, hiking,wilderness recreation.Hiking, wildlife viewing,prehistoric interpretation,hunting. Located in north endof East Sierra subregion.Hiking, wildlife viewing, birdwatching,hunting, culturalinterpretation. Located - inpart- in central East Sierrasubregion.Chapter 3 3-271
ACECNAME ANDNUMBERShort Canyon(81)Soggy Dry LakeCreosote Rings(47)Steam Well(25)Trona Pinnacles(16)Upper JohnsonValley Yucca Rings(46)<strong>West</strong>ern RandMountains(2)Whitewater Canyon(49)SIZEACRESROUTEDESIGNATIONYEARROUTESTATUS754 1990? Most of the ACECroutes are closedbecause they arewithin wilderness186 1982 All vehicular routesclosed to protectunique vegetation41 1982 Designated routesystem; All routesclosed with inclusionof ACEC in theGolden ValleyWilderness Area4,055 1989 Designated routesystem353 1982 Specific routesdesignated closed17,877 1994 128 mile designatedroute system16,381 1982 Designated routesystemPRINCIPALRECREATIONACTIVITIESHiking, botanizing, wildlifeviewing, bird-watching,hunting. Located in EastSierra subregion, bordersOwens Peak Wilderness.Botanizing, hiking. Locatedjust south of Johnson ValleyOHV area.Prehistoric and historicinterpretation. Locate dinsouthwest edge of GoldenValley Wilderness area.Sightseeing, commercialfilming, OHV touring,geologic interpretation.Located in South Searlessubregion.Botanizing, OHV recreationand touring. Locate dinJohnson Valley OHV area.OHV touring and recreation.Applied to ACEC andsurrounding lands.OHV touring, wildlifeviewing, hikingOrd Mountain Pilot Off Road Vehicle Designations: In 1995 the BLM undertook apilot project within the Ord Mountain area to test methods to acquire an inventory of routes oftravel. A pilot digital aerial photograph was used together with GIS digitizing equipment toidentify 549 miles of existing routes of travel in the area. From this inventory, a proposed openroute system was identified by BLM and addressed in an environmental assessment.3.5.2.3 OHV Route Subregions and BLM 2001-2 Route InventoryTwenty-one “subregions” have been identified for route designation planning purposes.Table 3-58 describes each of these subregions, as well as the recreational activities and accessneeds associated with each subregion, the miles designated open by BLM in 1985 and 1987 and,where applicable, the miles of routes inventoried by BLM in 2001-2. A more detailed narrativediscussion can be found in Appendix R, section R.2.Chapter 3 3-272
SUBREGIONAmboyBighornCoyoteEastSierraElMirageEl PasoFremontGraniteJuniperKramerPRINCIPALRECREATIONACTIVITIESOff-highwaytouring, rockhounding,recreational miningOff-highwaytouring, sightseeing,equestrian riding.Rock hounding, offhighwaytouring/sightseeing, mining.Hiking, camping,rock hounding,OHV, equestrian.OHV, recreationalminingOHV use, rockhounding,shooting/hunting.OHV use, shooting/hunting, rockhounding,equestrian riding,hiking, recreationalmining.OHV touring,recreational mining,rock climbing,hiking, dispersedcamping, day use.Equestrian riding,recreational mining,hiking, MC riding,huntingOHV use/dual sport,rock hounding,shooting/ huntingTable 3-58Off Road Vehicle Designation SubregionsROUTE MILEAGEDESIGNATEDOPEN: 1985-872001 ROUTEINVENTORYN/ACOMMENTSNeed to maintain commercial access to America Mineand other mine claims, recreation access to theAmboy Crater ACEC and military access to theMarine Corps Air Ground Combat Center.218 N/A Contains Bighorn Mountain Wilderness; providesaccess to San Bernardino National Forest. Transitionarea of desert valley floor into the mountains.178 411 Calico Early Man Archaeological Site, Cronese LakesACEC, and Soda Mountains Wilderness Study Area.OHV recreation relatively light. Most OHV activityoccurs in southwestern sectors.109 N/A OHV touring allows hunting, wildlife observation,and equestrian staging. Area important for access toremote backcountry activities.49 267 El Mirage OHV recreation area borders sub region tothe south. Area of more historic use than current use.Once more popular for races which have since shiftedto the Open Areas. Edwards bowl in the westernsector popular as a motorcycle area creates someconflicts with adjoining private property owners.Shadow Mountain once very popular withmotorcyclists. Use now restricted due to conflictswith hamlet of Shadow Mountain to the south.Bajadas north of Shadow Mountain have been foundto have higher than average desert tortoise sign.324 465 Last Chance Canyon ACEC and El Paso MountainsWilderness abut the sub region. Very mountainousarea universally popular for a variety of visitor typesincluding jeepers, motorcyclists, miners, campers,rock hounders, equestrians, historical explorers andupland game hunters214 582 Contains Barstow Woolly Sunflower ACEC, HarperDry Lake ACEC, and the Black Mountain Wilderness.Northern hilly sectors very popular longstanding MCarea; Gravel Hills and Hamburger Mill northwest ofFremont Peak known for long-term historical use.Bajada areas in the southern sectors not nearly aspopular as the above-described areas to the north.Bajadas areas in the south and central sector knownfor historically high populations of desert tortoise.38 N/A Stoddard Valley OHV Area borders sub region to thenorth. Fairview area in southern portion of regionreceives moderate to high dispersed, day use includinghiking, rock climbing, and social gatherings.108 N/A Hunting opportunities are found in the Juniper Flatsarea as well as on national forest lands. Visitors cancamp at Bowen Ranch area and at locationsthroughout the national forest, to the south. OHVtouring allowed in appropriate areas.254 642 Mining and homestead site established in the late 19 thand early 20 th century exists in the area, some ofwhich may have historical significance.Chapter 3 3-273
SUBREGIONMiddleKnobMorongoNewberry-RodmanNorthSearlesOrdPintoRedMountainRidgecrestSleepingBeautySouthSearlesSuperiorPRINCIPALRECREATIONACTIVITIESOHV touring/sightseeing,camping, hiking,huntingWildlife viewingeducation, hikingEquestrian, OHVtouring, sightseeing,dual sport, rockhounding, miningOHV use/dual sport,rock hounding,equestrian rides.Recreationalmining, OHVtouring/ sightseeingRock hounding,OHV touring/sightseeing, miningOHV touring/sightseeing,shooting hunting,OHV/ dual sport,hiking, equestrianriding, mining.Hiking, equestrianOHV/dual sportRock hounding,recreational mining.Rock hounding,shooting, OHVtouring/sightseeing,mining.OHV/dual sport,rock hounding,camping, mining.ROUTE MILEAGEDESIGNATEDOPEN: 1985-872001 ROUTEINVENTORYCOMMENTSN/A 91 Cultural resources are significant in the sub region.Contains biological values of special concern,including habitat for desert tortoises.18 N/A The Big Morongo Canyon Preserve, a wildlife refuge,is located - in part - within the sub region142 210 Sub region contains the Newberry MountainsWilderness, the Rodman Mountains Wilderness andthe adjoining Rodman Mountains ACEC. Rock artand cultural sites are within the sub region.99 N/A Shooting/hunting occur in the Argus RangeWilderness that borders the northwestern portion ofthe subregion. The Great Falls Basin/Argus RangeACEC lies within the sub region.38 549 The historic Ord Mountain Road and the DaggettWash Road are accessible by four-wheel drivevehicles and motorcycles (OHV/dual sport). TheStoddard Valley OHV Recreation Area to the westand the Johnson Valley OHV area to the southeast ofthe sub region provide for OHV/dual sport activities.The sub region is bordered by the Joshua TreeNational Park to the east, west, and the south.234 733 The Grass Valley Wilderness is partly contained in thesub region and the Golden Valley Wilderness bordersthe sub region to the north. These bajadas areas in thecentral west sector west of Cuddeback Lake, areknown for historically high populations of deserttortoise and extremely high historical mining activity.106 328 The Rademacher Hills trails open to the hiking,jogging, horseback riding and mountain biking.58 N/A Historic Route 66 borders the sub region to the south.36 N/A Sub region contains the Trona Pinnacles NationalNatural Landmark ACEC. Historical and culturalresources are located in the sub region.396 668 Contains the Rainbow Basin National NaturalLandmark ACEC. The Black Mountain Wildernesslies to the west of the sub region and the CalicoMountains lie to the south east of the sub region.3.6 ENERGY PRODUCTION AND TRANSMISSION3.6.1 Powerlines, Pipelines and Fiberoptic CablesCDCA <strong>Plan</strong> Utility Corridor Network: The CDCA <strong>Plan</strong>, as amended, established anetwork of sixteen utility planning corridors across the <strong>Mojave</strong> and Colorado <strong>Desert</strong>s. All newlinear utilities exceeding the following thresholds must be located within a utility corridor:• New electrical transmission towers and cables of 161 kV (kilovolts) or above;Chapter 3 3-274
• All pipelines with diameters greater than 12 inches;• Coaxial cables for interstate communications; and,• Major aqueducts or canals for interbasin transfers of water.Seven of these corridors cross the planning area: Corridors A, B, BB, C, D, G, and H.Each corridor is between two and five miles wide. The intent of the corridors is to provide adelivery system network that meets public needs in a manner that minimizes the proliferation ofwidely separated rights of way by encouraging the joint use of corridors for utilities. By locatinga project within a corridor a project proponent does not receive immediate approval to constructa project: a federal right of way grant must still be obtained and a NEPA document prepared.Occasionally the unique needs of a project may require that it be located outside of acorridor. To accommodate these situations, several “contingent” corridors were identified by theCDCA plan that could be activated through a CDCA plan amendment. A project could belocated outside of either an activated or contingent corridor, but only through a CDCA planamendment that examined whether the need for a one-time exemption from the corridor networkwarranted construction in a non-corridor location. This has happened only once since the CDCAplan was adopted, for the All American Pipeline in 1983, in a region outside of the western<strong>Mojave</strong> <strong>Desert</strong>.Utility Biological Opinions: Table 3-59 presents the abbreviated terms and conditionsfound in 10 biological opinions addressing utility projects. Table 3-60 presents the takeauthorized by those opinions (mortality, harassment, and acreage where provided). Theseinclude includes 5 pipelines (2 crude oil, 1 gasoline, 1 natural gas), 3 transmission lines, and 2fiber optic cables. They include only those biological opinions that had a mortality and/orharassment take limit specified for maintenance activities. Appendix Q presents a more detailedsummary of the terms and conditions found in the biological opinions.Although maintenance was the primary focus of the tables, the terms and conditions ofthe biological opinions also apply to other activities, including construction and installation,operations, routine inspections, repair, and responses to emergency situations.Chapter 3 3-275
Table 3-59Prevalence of Terms and Conditions for 10 Linear ProjectsTERMS AND CONDITIONSNUMBER OF PROJECTS WITH THISTERM AND CONDITIONEducation 10Flag boundaries, restrict activities to impact area 10Tortoise preconstruction surveys 10Biological monitor required 10Speed limits (4 at 20 mph, 2 at 25, 1 at 10) 8Litter free workplace 8Project-end reporting 8Unauthorized firearms prohibited 7Use existing roads 6Check under vehicle for tortoise 6Designate Field Contact Representative 6Avoid entrapping tortoises in excavations 6No pets in the construction area 5Revegetation required 5Compensate impacts with fees or acquisition 4Raven prevention measures 2Table 3-60Authorized Mortality and Harassment Take for 10 Linear ProjectsIMPACTING ACTIVITYAUTHORIZEDMORTALITYAUTHORIZEDHARRASMENTMaintenance and/or Repair 6 per year 8 per yearMaintenance and/or Repair 15 2 unlimitedConstruction 8 125Construction and Maintenance 6 20Routine Inspections, Emergencies 5 ---Chapter 3 3-276
3.6.2 Energy Generation <strong>Plan</strong>tsEnergy generation plants are currently located within or in close proximity to the <strong>West</strong><strong>Mojave</strong> <strong>Plan</strong>. Table 3-61 provides data regarding the megawatts (MW) of electricity generatedby these plants.Table 3-61<strong>West</strong> <strong>Mojave</strong> Energy Generation 35FACILITY TYPE ONLINE MEGAWATTS NO. OF PERMITTED FACILITIESBiomass .25 1Coal 177 3Geothermal 240 3Hydroelectric 39 2Natural Gas 738 6Solar 409 9Wind 701 45Electricity demand increased 16% in the SCAG region during the 1990’s, and isprojected to continue to grow at about 2% per year. This increasing demand for electrical energywill result in continued efforts to conserve and develop new energy sources in California. Thereliability of the energy needed to meet projected demand will depend in part on developing adiversity of energy sources (SCAG- Regional Comprehensive <strong>Plan</strong> and Guide – Energy ChapterUpdate 2002). The <strong>West</strong> <strong>Mojave</strong> region contains the natural resources to support thedevelopment of alternative energy sources such as wind, geothermal and solar facilities, andthere will likely be future proposals for the development of these resources as energy demandsincrease. Proposed thermal energy facilities of 50MW or greater and related facilities (i.e.,transmission lines) are subject to the permitting authority of the California Energy Comission(CEC). The Commission’s siting process provides:• Assurance that only power plants actually needed will be built;• Review by independent staff with technical expertise in public health and safety;environmental sciences, engineering and reliability;• Simultaneous review and full participation by all state and local agencies, as well ascoordination with federal agencies;• One regulatory permit;• A decision within a specific time frame; and,•Full opportunity for participation by public and interest groups. 36Thermal energy facilities of less than 50MW on private lands are subject to thepermitting authority of the city or county within which the proposed project resides and typicallyrequire the issuance of a conditional use permit. On public lands managed by the BLM, newthermal energy facilities (other than geothermal – see below) require a right of way permit per 4335 Data source: California Energy Commission36 Energy Facilities Licensing Process – A Guide to Public Participation. California Energy Commission Webpage at www.energy.ca.gov.Chapter 3 3-277
CRF Part 2800. Coordination with the CEC permitting process for facilities of 50MW orgreater on public land would also occur.The Renewable Resource Data Center (RReDC), managed by the Department ofEnergy’s Office of Energy Efficiency and Renewable Energy has identified major wind resourceareas throughout the United States that have been estimated to have suitable wind energypotential for wind turbine applications (“Class 3” or greater annual average wind power). Withinthe planning area the Tehachapi Pass, near <strong>Mojave</strong>, possesses Class 6 wind energy potential.The western part of the Antelope Valley is another area of high wind resource potential with sitedata in the extreme west end of the Antelope Valley indicating a Class 6 wind resource. RReDChas estimated Class 3 or higher wind resource over much of the southern and western parts of theAntelope Valley. Another wind corridor exists in the vicinity of Daggett (just east of Barstow)where winds are channeled between the Calico and Rodman Mountains. Site data from theDaggett Airport indicate Class 3 to 4 windpower in this area. For each of these wind resourceareas, the maximum wind resource occurs in the spring and summer. 37Wind energy development within the plan area is currently concentrated in Kern Countynear the communities of Techahapi and <strong>Mojave</strong>. Approximately 700 MW are produced fromthe wind farms located in this area. In February 2002, the BLM issued a Temporary Use Permit(CACA-43088) to Sea <strong>West</strong> Wind Power for a term of five years for the placement of fivemeteorological masts on Daggett Ridge.The amount of sunlight received at any given location varies greatly depending ongeographical location, time of day, season and clouds. The southwestern United States is one ofthe world’s best locations for solar energy production with the desert region receiving almosttwice the sunlight as other regions in the United States 38 . Major solar energy facilities have beendeveloped in the Daggett area, at Kramer Junction and at Harper Dry Lake. Online energyproduction for solar these power plants is approximately 409 MW.The majority of the coal and natural gas fueled power plants within the study area arecogeneration facilities, the one exception being the Coolwater facility east of Barstow. In Mayof 2000, the California Energy Commission granted approval to the High <strong>Desert</strong> Power <strong>Plan</strong>tProject, a new natural gas fueled 750 MW facility. This facility is proposed to be located on a25-acre site of the Southern California International Airport, formerly George Air Force Base, inthe city of Victorville.37 Wind Energy Resource Atlas of the United States. Renewable Resource Data Center [www.nrel.gov]38Solar Energy. Renewable Resource Data Center [www.nrel.gov]Chapter 3 3-278
3.7 CULTURAL RESOURCES3.7.1 Archaeological, Historical, Paleontological and Ethnographic Resources3.7.1.1 Area of EffectEffects to cultural resources would be generated by specific implementing actions, suchas fence construction, structure and debris removal, and route designation. Because specificlocations for some actions have not yet been identified, it is not possible at this time to fullyidentify the entire area of potential effect (APE). Decisions that result in actions that disturb theground surface or items on the surface would define the actual area of potential effect for mostcultural resources. For these actions, all work areas, including parking for equipment, loadingand unloading areas, would also fall within the APE. In some cases, actions may affect largerareas, such as landscapes that have cultural, traditional, or sacred values. For route designation,which is the action being considered by the <strong>West</strong> <strong>Mojave</strong> <strong>Plan</strong> with greatest potential to affectcultural resources, the area of effect is the actual routes under consideration plus the 600-footwidecorridor along open routes that is available for pulling off, parking, and camping, plus areasnear or adjacent to routes that may be subject to effects related to use of the route. Such effectsinclude access to historic and prehistoric sites in the area that may be subject to vandalism,artifact theft, removal of wood for campfires, and other similar types of effects. In some cases,presence of vehicle access may have effects on traditional landscapes that extend well beyondthe route and 600-foot corridor of use.3.7.1.2 Existing DatabaseThe existing cultural resources database consists of inventory reports, archaeological siterecords, and related information maintained by BLM in each field office and a databasemaintained by the State of California Office of Historic Preservation (SOHP). To a large degreethese databases overlap through sharing of information over the years. The state database hasbeen maintained by individual Information Centers around the state and until recently was, likethe BLM database, a hard copy system of maps, site records, inventory reports, and photographs.For the past several years a cooperative effort between BLM and the SOHP has been underwayto digitize the database and make it available to qualified users in an electronic format that wouldallow more refined manipulation of the data. This electronic system, the California HistoricalResources Information System (CHRIS) is still under development. Currently, a static version ofdata that has been entered into the CHRIS system has been provided to each BLM field office ona compact disk (CD).In 1966 the National Historic Preservation Act was passed, which requires that federalagencies take into consideration the effects of decisions on cultural resources. By the mid-1970sBLM archaeologists were surveying project areas for Bureau-initiated and non-Bureau-initiatedproposed actions. Similar requirements of state law apply to development of private lands.Since then, the overwhelming bulk of archaeological inventory carried out within the planningarea has been generated by the need to meet legal compliance requirements. Since location ofinventory has been almost wholly determined by where development was planned, the availableChapter 3 3-279
data does not fully reflect the nature, location, and significance of the resource on the ground.The primary exception to this is the archaeological inventory carried out during preparation ofthe California <strong>Desert</strong> Conservation Area <strong>Plan</strong>, beginning in 1969 and continuing until the CDCA<strong>Plan</strong> was signed in 1980. Each planning unit in the California <strong>Desert</strong> was subject to systematicsample inventory, stratified by various environmental factors that are thought to influencearchaeological site distribution. The sample was low, ranging from 0.5% to 2% per planningunit and averaging 1% desert wide. Nevertheless, approximately 280 square miles weresystematically inventoried and another 50 square miles were subject to less intensivereconnaissance. A total of 2,903 historic and prehistoric sites were recorded (USDI, BLM 1980,Appendix VII). This effort substantially increased our knowledge of the distribution of historicand prehistoric sites within the California <strong>Desert</strong>.3.7.1.3 Regional Overview: PrehistoricFor detailed regional overviews of the prehistory, history, and ethnography of the studyarea see Norwood et al., 1980, Stickel et al. 1980, Hall et al. 1981, Garfinkel 1976, Norris andCarrico 1978, and Warren and Roske 1981. These reports were prepared during preparation ofthe CDCA <strong>Plan</strong> and summarized available data at that time. More recent overviews may befound in W & S Consultants 2000 and Whitley, Whitley and Simon n.d.The California <strong>Desert</strong> has been inhabited for at least 8,000 to 10,000/12,000 years andperhaps longer, although most of the extant remains date to much later periods. Evidence of theearliest occupations is sparse and difficult to date or interpret. Between 8,000 to 12,000 yearsago settlement was centered on lakes, which are now the dry playas so characteristic of the<strong>Mojave</strong> <strong>Desert</strong> and Great Basin. These lakes, and especially marsh environments along theiredges, were particularly rich in plant and animal species that provided food, fibers, medicines,tools, clothing, and ritual objects necessary for daily existence. From 8,000 to 6,000 years ago,climatic change caused the lakes to dry, necessitating cultural adaptation to the loss of a primehabitat. One of the adaptations included increased use of upland areas. (There is evidence thatuse of upland areas actually began earlier than this while the lakes were still present.) Around6,000 years ago, food gathering and land use patterns began to appear that continued into thehistoric period. These involved use of a greater variety of habitats and plant and animalresources. Grinding implements such as manos and metates made their appearance. Around2,000 years ago a shift in projectile point types from larger forms (e.g. Elko and Gypsum points)to smaller forms (e.g. Rose Spring and Eastgate Points) may indicate the introduction of the bowand arrow to replace spears and atlatls. The expansion of bow-and-arrow technology is indicatedby the late prehistoric introduction of <strong>Desert</strong> Side-Notched and Cottonwood Triangular points,which are found throughout the area. These point styles are key indicators of the age ofarchaeological sites in which they occur. By this time, because of the drier climate, primaryhabitation sites were located near reliable water sources such as springs and flowing streams.Secondary habitation sites were established as needed in areas in which particular resources wereseasonally collected. Sites relating to ritual or religious activity, such as rock art sites,sometimes occurred near habitation sites but were also remote from such sites to protect thesacred nature of the sites and the ritual activities. People generally followed a pattern ofexploitation of seasonally available resources by moving through a more-or-less definedhomeland, usually returning to a primary habitation (“village”) for winters. This pattern ofChapter 3 3-280
seasonal movement from place to place resulted in use of large areas by relatively smallpopulations, and left the remains that are now archaeological sites widely scattered over thelandscape.3.7.1.4 Regional Overview: HistoricThe first documented exploration of the <strong>Mojave</strong> <strong>Desert</strong> by non-indigenous peoplesoccurred in the mid-1700s when Francisco Garces, a Spanish Franciscan priest, looked for apractical route from Arizona to northern California. Between Garces’ exploration in 1776 and1880, only agriculture or precious metals attracted Spanish-Mexican and American settlers.Much of the history of the region turns on its use as a corridor (Warren 1980: 195).In the early 19th century, fur trappers and caravans crossed the desert. Jedediah Smithled the way in 1826, followed by other mountain men like Ewing Young in 1829; both followedthe <strong>Mojave</strong> Indian Trail. Antonio Armijo is credited with leading the first caravan of packanimals across the <strong>Mojave</strong> in 1830. Traders William Wolfskill and George C. Yount used theOld Spanish Trail in 1830-1831. Other groups who used the trail during Mexican control of thewestern <strong>Mojave</strong> include Don Jose Aveita’s commercial caravan in 1833-1834, Jacob P. Leese in1834, William Slover and Isaac Pope in 1837, and Jose Antonio Salazar’s caravan in 1839-1840.John C. Fremont, a lieutenant in the U.S. Army Corps of Topographical Engineers, described hissurvey and travel in 1844 along a variant route (Warren 1980:201). Other trails arising fromcommerce include the <strong>Mojave</strong> Trail and Salt Lake Trail, both of which run through present-dayBarstow. Joseph Walker is credited with pioneering a trail across the Sierra Nevada Range,enabling access between the San Joaquin Valley and the desert.Settlement by Americans and the growth of coastal and inland trade culminated in theannexation of California by the United States in 1848. In that same year, gold was discovered inCalifornia and the gold rush was on, ushering in a massive influx of prospectors. The DeathValley forty-niners, led by William Lewis Manly, traveled through the project area along IndiansBig Trail, also known as Owens River Road, the Midland Trail, and Bullion Road, whichconnected the northern <strong>Mojave</strong> and Owens Valley area with Los Angeles, via connections withthe Tehachapi Pass road and Walker’s Pass road. In the late-19th century, these roads were usedto transport goods, people, livestock, food and ore between the <strong>Mojave</strong> <strong>Desert</strong> and Los Angeles.Temporary camps or stage stops were set up along the routes, including Indian Wells Station,Coyote Holes Station, and Panamint Station. The western <strong>Mojave</strong> <strong>Desert</strong> became a majorcontributor to California’s mining industry. Small mining towns, such as Calico and Coolgardie,and ranching operations were established and proposed.The California Gold Rush contributed to pressure to establish railroad routes across thedesert. Railroad surveys began in 1853 with Lieutenant Amiel Weeks Whipple and LieutenantRobert Stockton Williamson conducting surveys in the western <strong>Mojave</strong>. The San Pedro, LosAngeles and Salt Lake Line, predecessor of the Union Pacific through the <strong>Mojave</strong> <strong>Desert</strong>, wascompleted in 1905, and the Tonopah and Tidewater finished its line from Ludlow on the Atlantic& Pacific via Death Valley Junction to Beatty, Nevada in 1907 (Warren 1980:207). Spur lineswere constructed to serve mines and mining camps. The Harvey house originated from an earlyrailroad roadhouse located at the junction of the Santa Fe <strong>Mojave</strong>-Needles line and the CaliforniaChapter 3 3-281
Southern line coming north from Cajon Pass.Development of automobile routes began in the early-20th century and increased inimportance in the second quarter of the 20th century (Warren 1980:239). Following completionof the Atlantic & Pacific Railroad, a road was constructed in 1914 parallel to the tracks, whichroad became the precursor of U.S. 66. In 1925, construction began on U.S. 91, a new alignmentof an older trail, which opened up the desert to the general public.Ranching and agricultural industries at the beginning of the 20th century and increasingpopulations in Los Angeles created a need for more water than the immediate landscape couldsupply. In rural areas, the demand was met by small irrigation ditches and canals, but LosAngeles’ need was met by construction of the Los Angeles Aqueducts in 1908-1913 and in the1920s.Military bases were established in the desert prior to U.S. entry into World War II. Largetracts of land were set aside for military use near Ridgecrest, Barstow, Lancaster, andTwentynine Palms.3.7.1.5 Known Significant SitesPrehistoric and historic properties and traditional cultural properties on federal lands areformally identified as significant by being listed in the National Register of Historic Places ordetermined eligible for listing (see Table 3-62). Properties on state or private lands are formallyidentified as significant by being listed in the California Register of Historic Resources ordesignated as a California Historic Landmark or California Point of Historical Interest. Somelocal governments also offer designation/registration programs for local properties. These listsare not comprehensive; they include only those properties that have been selected for specialattention or have been evaluated as part of project development. Most sites have not beenevaluated for significance. Federal regulation requires that caution be exercised when dealingwith unevaluated properties to avoid damage or alterations that might affect qualities that couldmake them eligible for listing in the National Register of Historic Places.Table 3-62<strong>West</strong> <strong>Mojave</strong> Sites listed in the National Register of Historic PlacesRIDGECREST FIELD OFFICEPROPERTY NAME COUNTY SITES INCLUDED KNOWN VALUESBandit Rock (Robber’sRoost)Kern1 (several sites present were notincluded in nomination)Historic (sites not included innomination are prehistoric)Blackwater Well Kern 17 PrehistoricLast Chance Canyon(Includes Last ChanceCanyon ACEC withinboundaries)Red Mountain SpringArchaeological DistrictKernSan Bernardino160 (an additional 55 siteswithin 2 mile radius ofboundary)Chapter 3 3-28223 formally recorded; a numberof others being documented as aresult of recent researchPrehistoric/historic/Native AmericanMostly prehistoric but somehistoric remains
RIDGECREST FIELD OFFICEPROPERTY NAME COUNTY SITES INCLUDED KNOWN VALUESFossil FallsInyo 32 PrehistoricArchaeological District(includes part of FossilFalls ACEC)Steam WellArchaeological DistrictSan Bernardino 4 PrehistoricBARSTOW FIELD OFFICEFossil Canyon San BernardinoScientific, conservation,SBR2841, SBR2058traditional use, publicRodman MountainPetroglyphsSan BernardinoSBR307A, B, C (Deep Tank),SBR306A, B, C (Surprise Tank)Scientific, conservation,traditional use, publicBlack Mountain RockArt DistrictSan BernardinoScientific, conservation,traditional use, publicNewberry Cave San Bernardino Conservation, traditional useHarvey House San BernardinoConservation, public; 1911Railroad station.Alf’s Blacksmith Shop San Bernardino Conservation, public; Onlyknown complete blacksmith shopremaining in San BernardinoCounty.Lake <strong>Mojave</strong> San Bernardino CA-SBE-140 ScientificTable 3-63 lists sites of significance on public lands administered by the BLM BarstowField Office.Table 3-63<strong>West</strong> <strong>Mojave</strong> Sites of Significance Administered by BLM Barstow Field OfficeNAMECULTURAL RESOURCE VALUESCA-SBR-1606CA-SBR-2081CA-SBR-2085CA-SBR-2094Pinto BasinSalt SpringsAmargosa CanyonAwlScientificScientificScientificScientificScientificScientificScientific, conservation, publicScientificRock SpringScientific, publicSaratoga SpringsScientificOro GrandeScientificRustler RockshelterScientificDeep CreekScientificChina RanchScientificShoshone RockshelterScientificFort (Camp) Cady Scientific, conservation, public; 1860 military fort built by Major James H.Carleton.Deadmans PointPublicChapter 3 3-283
NAMEFinger Rock (Hercules’ Finger)Black CanyonCalico Ghost Town/MiningDistrictCoolgardie CampInscription CanyonCULTURAL RESOURCE VALUESPublic; site of 1840 battle between ranchers and rustlers.Scientific, conservation, traditional use, publicPublic; silver mining districtPublic; 1890s gold mining camp.Scientific, conservation, traditional use; publicA number of other sites/districts are currently being nominated for listing in the NationalRegister and many sites have been determined to be eligible for listing in the National Register.Table 3-64 describes the areas of critical environmental concern that have beendesignated within the <strong>West</strong> <strong>Mojave</strong> planning area.Most archaeological sites have not been evaluated for their significance or eligibility forlisting in any formal roster of significant sites. Because one of the criteria for determiningwhether or not a site may be eligible for listing in the National Register is that the site has“yielded, or may be likely to yield, information important in prehistory or history” (36 CFR 60)many site types are a priori eligible for listing and are treated as such for management purposesregardless of whether or not formal determinations have been made. Such site types includepermanent or semi-permanent habitation sites (“villages”); temporary camps containing multipletool types, especially if they contain obsidian; and utilized shelters or caves that contain the sametypes of materials. As analytical techniques improve or new technologies are perfected, thekinds of data that can be extracted from archaeological materials increase. In contrast to mostarchaeological sites, which generally provide information on aspects of material culture andrelationships between sites and groups of people, sites containing rock art (petroglyphs andpictographs) can provide glimpses into the intellectual and spiritual aspects of culture.Historic sites may yield information on industrial technologies and how they were usedor adapted in individual situations; ethnic, gender and age make-up of working populations; foodpreferences; availability of luxury items to various groups; and even how speculation on WallStreet affected small mining operations in the western United States (Barnes 2001).All of this means that many, many archaeological sites, both recorded and unrecorded,are likely to be found to be significant and eligible for listing in the National Register of HistoricPlaces if formally evaluated. For these reasons the actual number of sites listed in the NationalRegister is not an accurate indicator of the significance of the resource base as a whole3.7.1.6 Potentially Significant AreasAll of the lands within the planning area that are administered by the BLM’s RidgecrestField Office may be characterized as sensitive for cultural resources with a few exceptions.Reasons for the intensity of prehistoric occupation include the presence in the past of a series ofPleistocene lakes and the Owens River as well as the fact that this area is on the boundarybetween the <strong>Mojave</strong> <strong>Desert</strong> and the Great Basin and presents a greater than usual variety ofenvironments and associated natural resources.Chapter 3 3-284
ACECRose SpringFossil FallsLast ChanceCanyonJawbone-ButterbredtChristmasCanyonBedrockSpringSteam WellRedMountainSpringAftonCanyonCalico EarlyMan SiteBlackMountainCroneseLakesDenningSpringGreenwaterCanyonTable 3-64Cultural Resource ACECs in <strong>West</strong>ern <strong>Mojave</strong> <strong>Desert</strong>RIDGECREST FIELD OFFICEChapter 3 3-285CULTURAL RESOURCE VALUESContains several prehistoric sites. Research at these sites started in the 1950s and continues(Lanning 1963, Riddell 1956). These sites are type sites for cultural chronology of the westernGreat Basin.Large complex of prehistoric sites associated with Pleistocene Owens River, 32 of which are listedin the National Register. Research here dates back to work of M.R. Harrington in the 1950s. Areaincludes the Stahl site, on private land, also an important type site for explication of western GreatBasin/Northern <strong>Mojave</strong> cultural chronology.Prehistoric. Part of the Last Chance Canyon National Register District; the portion of the Districtconsidered to be most at risk was selected for ACEC status. Also includes important historicresources.Native American values. Contains a number of locations that were identified by a Kawaiisu elderwhose family had lived in the area, including prehistoric and proto-historic/historic archaeologicalsites, sacred areas, and areas that were known or thought to contain burials.Prehistoric. Subject of current research that is revealing a large and very significant complex ofsites, including examples of rare cultural phenomena. Some sites are related to various stands ofPleistocene Lake Searles and preliminary dates indicate great age for some of them, while at leastone site contains historic materials, indicating a very long period of use.Prehistoric. Subject to current research by BLM, this ACEC also contains a variety of site typesincluding habitation sites, rock shelters, rock art, milling, and others. Publication of currentresearch will add materially to our understanding of prehistory in this portion of the <strong>Mojave</strong><strong>Desert</strong>.Prehistoric. Contains four petroglyph sitesPrehistoric. Contains 23 recorded sites and other sites that have been located during recentresearch by Cal Poly Pomona archaeologists. Site types include habitation sites, lithic scatters,milling features, rock art, trails, stacked stone structures, and hunting blinds. Although the ACECwas designated for prehistoric resources there are also historic materials within the ACEC.BARSTOW FIELD OFFICEModerate density and complexity of sites. Twenty recorded prehistoric sites, including quarries,lithic scatters with ground stone, and occupation/multi-use sites. Represent riparian and lacustrineresource exploitation, tool manufacture, trade, and desert settlement (Bureau of Land Management1989:38). Scientific use.Lithic tools and debitage are associated with possibly the earliest human occupation on the NorthAmerican continent. Continued research investigates human occupation and settlement of the<strong>West</strong>ern Hemisphere (Bureau of Land Management 1984:2.1). Public use.Area contains the most extensive assemblages of prehistoric petroglyphs within California.Quarry and lithic workshops are found within the ACEC as well as evidence for obsidian trade(Bureau of Land Management 1988:6). Scientific, traditional use.This area contains sites representing occupation beginning 8,000 years ago. Cultural remainsprovide information regarding subsistence and settlement patterns in the Great Basin (Bureau ofLand Management 1985:1-5). Scientific use.Cultural resource values include at least four major resource locations. In addition to historicresources not formally recorded, prehistoric sites are designated SBR3828 and SBR 3829B and3829C (Bureau of Land Management 1982:3). Scientific use.Contains multi-purpose sites indicative of occupation beginning about 12,000 years ago to historiccontact. Sites include rockshelters, petroglyphs, pictographs, hunting blinds, and diagnostic lithictools (Bureau of Land Management 1988:6-10). Scientific, traditional, public use.
ACECJuniper FlatsRodmanMountainsRainbowBasinSalt CreekHillsCULTURAL RESOURCE VALUESNumerous sites have open trash middens, evidence of cooking, tool manufacture, hunting, andplant/animal processing. An occupied rockshelter is also present. Early historic remains arerelated to homesteading and mining (Bureau of Land Management 1988:9). Scientific use.The badlands within the planning area expose one of the best known and most intensively studiedlate Miocene age fossil assemblages in the United States. Fourteen archaeological sites have beenlocated, characterized by temporary habitation, flake scatter, petroglyphs, historic miningremnants (Bureau of Land Management 1991:32, 36). Scientific, traditional, public use.Site of the first hard rock gold mine in the <strong>Mojave</strong> <strong>Desert</strong> (Bureau of Land Management 1992:5).Public use.The area including the shore of Owens Lake, Haiwee Reservoir, Rose Valley, CactusFlat, and McCloud Flat down to the Fossil Falls-Little Lake area is characterized by extremelyhigh prehistoric site densities related to the presence of Owens Lake and Owens River and thenearby Coso and Sugarloaf obsidian quarries. Sites from this area have been important indefining cultural chronologies for the western Great Basin. Many more prehistoric sites may beexpected in this area than have been formally recorded. The area also contains examples ofCoso-style rock art, both painted and pecked. Recent archaeological and ethnohistoricalresearch, moreover, suggests that the Numic religious and artistic tradition in the Coso regionmay represent 10,000 or more years of continuity (Whitley et al. 1999a, 1999b) – thus makingthis the longest-lived religious tradition so far identified in the world (National RegisterNomination Form, Whitley2002). The Coso Mountains and adjacent areas were an importantcenter of Shoshone habitation during the late prehistoric period.The west edge of the planning area includes a series of canyons along the east flank ofthe Sierra Nevada. Nearly all of these canyons contain significant prehistoric sites and almost noformal inventory has been carried out in any of the canyons. They may be expected to containsites that relate to middle to late-prehistoric settlement-subsistence patterns whereby resources atvarious elevations were exploited seasonally. The lower portions of the canyons that fall withinthe western <strong>Mojave</strong> <strong>Desert</strong> are known to contain what were probably winter habitation sites.Although a number of these sites are known, none have been subject to scientific study. Thesecanyons extend into the Jawbone-Butterbredt ACEC south of Walker Pass.The El Paso Mountains are known to contain extremely high site densities. BlackMountain in the El Pasos (and now in wilderness) was considered a sacred mountain by lateprehistoric peoples. The entire mountain range is characterized by complexes of sites such ashabitation sites, stone quarry sites, rock art sites (both painted and pecked), rock shelters, millingstations, rock alignments, and other site types. The total acreage that has been inventoried in theEl Pasos is relatively small, so there are undoubtedly many unrecorded sites.On the east side of the planning area there are complexes of prehistoric sites that appearto be related to the presence of Pleistocene Searles Lake, as well as sites relating to later periods.In the past year BLM archaeologists have inventoried approximately 1200 acres near SearlesLake and have found very high site densities as well as uncommon archaeological manifestationssuch as rock alignments, trails, and stacked stone features. Materials from some of these sitesChapter 3 3-286
have been dated by radiocarbon and other dating methods and the area appears to have beeninhabited from the late Pleistocene-Early Holocene (c. 11,000 years ago) down to the historicperiod. The Lava Mountains should also be included in this high sensitivity area.Historic mining occurred in a number of areas, including Darwin and adjacent areas, andHomewood Canyon. Extraction of borax and borates from Searles Lake that began in the late1800s left historic remains on and adjacent to Searles Lake. Red Mountain, Randsburg, andJohannesburg all began as centers for historic mining operations in the area and remains ofhistoric mining, milling, and prospecting are abundant.The very low inventory levels, less than 1% in most areas, leaves the probability thatthere are many unrecorded prehistoric and historic resources and areas of high sensitivity thathave not yet been identified.3.7.1.7 Ethno-historic OverviewThe ethnohistoric period begins with European contact in the 18 th century, and isdocumented in diaries, official documents, narratives, and scholarly studies, the latter includinginterviews with native peoples. At the time of European contact, Paiute, Shoshone, Kawaiisu,Kitanemuk, Serrano, Vanyume, Chemehuevi, and <strong>Mojave</strong> occupied the planning area. OwensValley Paiute occupied the far northern edge of the planning area, near Owens Lake, althoughthis was peripheral to their primary areas around Owens Lake and River. The <strong>West</strong>ern Shoshonelived south and east of Owens Lake, as far south as Little Lake. Kawaiisu occupied the southernSierra, as well as Indian Wells Valley, El Paso Mountains, Tehachapi Mountains, and adjacentareas. Kitanemuk and Serrano occupied the southwestern portion of the planning area, as farsouth as the San Bernardino Mountains. The Vanyume lived along the <strong>Mojave</strong> River, north andeast of Victorville. The Chemehuevi are the southernmost band of the Southern Paiute, and theirextensive traditional territory included the eastern <strong>Mojave</strong> <strong>Desert</strong>. By the mid-19 th century, theyhad settled along the Colorado River in traditional <strong>Mojave</strong> territory. The <strong>Mojave</strong> controlled thearea north of Bill Williams River up to the Nevada border, but their main settlements were in the<strong>Mojave</strong> Valley.The Owens Valley Paiute, <strong>Mojave</strong>, and Chemehuevi, after the latter’s relocation to theColorado River, farmed as well as harvested native wild plant foods. There is no record offarming among the other tribes. Ethnographic and ethnohistoric accounts indicate nativepopulations had efficient processes to obtain food and raw materials, and had extensiveknowledge of plants, animals, and the environment. <strong>Group</strong> settlement and subsistence patternswere within well-defined territories, but the length of time spent in any one camp varied amongthe tribes. Organization of society also varied among tribes, but can generally be described asloosely structured, allowing families to be self-determining while recognizing an importance ofkinship lines. A sense of tribal identity, including language, customs, history, and religiousbeliefs, held members of each tribe together.Under the National Historic Preservation Act, a federal agency consults with tribes soChapter 3 3-287
that they might identify traditional cultural properties of cultural and religious importance, andconsider the effect of its actions on those places. Places meeting the criteria for traditionalcultural properties are then evaluated under criteria for the National Register. Under theAmerican Indian Religious Freedom Act and Executive Order 13007, a federal agency mustconsider the effects of its actions on Native American spiritual places and on access to suchplaces by religious practitioners. Consultation usually combines compliance with both laws. Atraditional cultural property is a place that is eligible for inclusion in the National Register ofHistoric Places because of its association with cultural practices or beliefs of a living communitythat are rooted in that community’s history and are important in maintaining the continuingcultural identity of the community. Traditional cultural properties may overlap a number ofcategories of cultural resources such as archaeological sites, historic sites, areas where naturalmaterials are collected, sacred sites, or sacred landscapes.3.7.1.8 Significant Paleontological LocalitiesA triangular area roughly bounded by the Sierra Nevada Front, Highway 395, andGarlock Road has been subject to paleontological research for several decades and has beenfound to contain important paleontological resources. The Dove Spring Wash area contains afossil assemblage known as the Dove Spring Lignites Local Fauna (Whistler 1990). Containingmollusks and a diversity of small vertebrates, “the Dove Spring Lignites Local Fauna is the mostdiverse, Late Pleistocene vertebrate assemblage recovered from fluviatile deposits in the <strong>Mojave</strong><strong>Desert</strong> outside of the <strong>Mojave</strong> River basin” (Whistler 1990).East of Dove Spring Wash, but within the same triangular area, the El Paso Mountainshave been subject to paleontological study for over 50 years. The Raymond Alf Museum ofClaremont, California is currently actively engaged in paleontological research of localitiescontaining Paleocene (−60 million years old) mammals. The El Paso Mountains are the onlylocality on the west coast of the United States known to contain mammal fossils of this age; theclosest known locations are in Wyoming. Consequently, these fossil localities are quiteimportant (Lofgren n.d.).A number of locations around Lake China that contain fossil remains of Rancholabreanmegafauna have been recorded and studied. Although these sites are on China Lake Naval AirWeapons Station and not BLM, similar situations may apply around the edges of otherPleistocene dry lakebeds, such as Searles Lake within the planning area.This area no doubt contains other important paleontological localities that have not beendiscovered or formally investigated.area.Table 3-65 presents an overview of paleontological resources found within the planningChapter 3 3-288
MYACENOZOICEPOCHTable 3-65Paleontological Resources OverviewMAMMALASSEMBLAGES0Rancholabrean Rancho La Brea, Carpinteria Faunas (56).1 PLEISTOCENE Irvingtonian Manix, Bautista Faunas (Savage & Downs 1954:56).2 Coso Mt., San Timoteo FaunasPLIOCENE Blancan (Savage & Downs 1954:52).5Hemphillian Mt. Eden, Kern R. Fauna (Savage & Downs 1954:52).10 Clarendonian Ricardo, Avawatz, Tejon Hills, Mint Canyon Faunas(Savage & Downs 1954:52).15 MIOCENE Barstovian Barstow Fauna (Savage & Downs 1954:49).Tick Canyon Fauna (Savage & Downs 1954:49).20 Hemingfordian25 Arikareean Tecuya Fauna (Savage & Downs 1954:49).30 OLIGOCENE Whitneyan-Orellan Kew Quarry Fauna (Savage & Downs 1954:47).35 Chadronian Titus Canyon Fauna (Savage & Downs 1954:47).40 Duchesnean Pearson Ranch Fauna (Savage & Downs 1954:47).45 EOCENE Uintan Poway Fauna (Savage & Downs 1954:47).50 BridgerianWasatchian55 ClarkforkianTiffanian60 PALEOCENE Torrejonian65 Dragonian-Puercan70(Woodburne 1978:26)Tecopa Lake Beds consist of lacustrine siltstone and mudstone interbedded with layers oftufa and ash that range from 100 feet to 200 feet thick. Multiple vertebrate fossils have beenrecovered from exposures east of Tecopa Hot Springs, though numerous finds occur west andnorth. This area is one of only two placed that provide good examples of small Irvingtonian-agemammals. Additionally, it has yielded remains of a unique camel-like animal unknownelsewhere (Woodburne 1978:37).The Avawatz Formation occurs in the rugged canyon land exposures on the south andsouthwestern flank of Avawatz Peak as well as along slivers of the Garlock and Death ValleyFault Zones. These deposits consist of coarse-grained conglomerate overlain by interbeddedclaystone, sandstone, and coarse- to fine-grained conglomerate. Coarse-grained breccia overliesthe claystone section and is capped by arenaceous clastic sediments and some tuff with coarsegrainedsandstone at the top. Faunal remains occur in the upper Clarendonian age unit(Woodburne 1978:49).Pleistocene-age fossil bones have been reported in the lake sediments of Salt Spring HillsPlaya, but not collected (Woodburne 1978:51).Chapter 3 3-289
Superior Dry Lake <strong>West</strong> consists of playa lakebeds near the southwest shore of SuperiorDry Lake. Fossil bone and tooth fragments have been reported and are thought to beRancholabrean (Woodburne 1978:53).Jack Rabbit Spring is at the north end of Coyote Dry Lake. Playa lake depositsreportedly contain fossil camel bones dating to possibly the Rancholabrean (Woodburne1978:54).Cronese is comprised of sediments from the Barstow Formation. The relatively sparsefossil mammals are important because they probably represent the youngest Barstovian-agesample in the <strong>Mojave</strong> <strong>Desert</strong>. They show a relatively evolved Merychippus and are associatedwith tuffs dated at 12.3 million years (Woodburne 1978:56).Alvord Mountain has a relatively thick sequence of tuffaceous sediment interbedded withtuffs and basalt flows, which is exposed in a valley drained by Spanish Canyon and its tributarieson the east flank of Alvord Mountain. The main fossil bearing unit is the Barstow Formation,followed by the Clews Fanglomerate and Spanish Canyon Formations of Hemingfordian age.Most of the fossils occur within a few feet in the middle of the Barstow unit. The stratigraphicsuccession of faunal remains corroborates the biostratigraphic and evolutionary sequence seen inthe Barstow Formation in the Mud Hills (Woodburne 1978:57).A series of sites occur in alluvial gravel, sandstone, and siltstone along bluffs overlookingthe <strong>Mojave</strong> River. The bluffs occur from the Daggett-Yermo are east to Camp Cady. Thesedeposits are Rancholabrean in age (Woodburne 1978:59).Manix-Afton Canyon. The Manix Lake Beds consist of a succession of fine-grainedlacustrine sediments interbedded with tufa and tuffs. They are unconformably overlain byalluvium and are cut by the <strong>Mojave</strong> River and its tributaries that flow into Afton Canyon.During the Pleistocene, Manix Lake extended westward into the <strong>Mojave</strong> Valley and north intopresent day Coyote Lake. This is one of the few well-studied Rancholabrean-age fossilassemblages, though much of the information is possibly unpublished as yet (60). The Manixbeds near Barstow, CA have yielded an assortment of fossil mammal remains, most of which arelimb bone fragments. This assemblage may be around 2 million years old, but evidence for exactdating is poor at present (Savage, Downs, and Poe 1954:53). Recovered specimens include truehorses (Equus), jackrabbits (Lepus), camelids, true deer (Odocoileus), pronghorns (Antilocapra),and tapirs (Tapirus) (Savage, Downs, and Poe 1954:56).The Cady Mountains comprise a relatively broad, sprawling range south of AftonCanyon. Like many <strong>Mojave</strong> ranges, a core of pre-Tertiary plutonic basement rock is overlain bya succession of mostly volcanic, then volcanic and sedimentary rocks that have been folded andfaulted and are roughly Miocene age. These are overlain by less extensive coarse-grainedapproximately Pliocene deposits and Quaternary fan deposits, which are all finally cut by presentstreams whose valleys are filled with alluvium. Fossils in the Cady Mountains are derived fromMiocene interbedded fluviatile clastic and tuffaceous sediments. The deposits are designated asthe Hector Formation, which is composed of coarse- to fine-grained alluvial deposits interbeddedwith tuffs and a basalt flow. Total thickness is approximately 1,500 feet.Chapter 3 3-290
In the southern area, fossils of late Arikareean and early Hemingfordian fauna areseparated by a tuff dated at 21 million years. This is one of the best calibrations of the boundarybetween currently known mammal ages. To the north near Afton Canyon, fossils are mainly ofHemingfordian age. This area is one of the most important regions in the <strong>Mojave</strong> <strong>Desert</strong> forbiostratigraphy and geologic history. It provides one of the best single reference areas for thelate Arikareean to late Hemingfordian interval in California and would form a secure base withwhich to evaluate the geological history of this part of the <strong>Mojave</strong> <strong>Desert</strong> (Woodburne 1978:62-63).Southwest of Crucero, Rancholabrean age mammal remains were observed inconglomerates and sandstones (Woodburne 1978:65).Daggett Ridge, about 4 miles southwest of Daggett, consists of a few hundred feet offine-grained sandstone and siltstone and a thin, lower bed of gray sandstone that produces bonechips. This Miocene deposit contains small camels, a cervoid, and a horse. These remains dateto about the middle of the Hemingfordian and could contribute significantly to an understandingof the little known faunas of this age in the <strong>Mojave</strong> (Woodburne 1978:66).The Calico Mountain range east of Barstow contains the Jackhammer, Pickhandle, andBarstow Formations (Woodburn 1978:67). Fossil vertebrates have been found in the CalicoMountains in the Barstow Formation, which is approximately 3,000 feet thick. The primaryspecimen is of the grazing-browsing horse (Merychippus intermontanus). Insect-bearing nodulesalso occur. The Calico Range has definite potential to yield fossils, but much of it is located onprivate land with limited access (Woodburne 1978:67-68).The Mud Hills, about 8 miles north of Barstow, contains outcrops of Jackhammer,Pickhandle, and Barstow Formations. The Barstow Formation, named for the Barstow fossilbeds, is a non-marine, late Miocene age geologic unit derived from stream and lake depositedsediments in a basin subject to periodic volcanic ash fall and dust (Woodburne 1978:69; Savage,Downs, and Poe 1954:48). Deposition occurred about 15 million years ago. Many fossils occurin strata of mud mixed with volcanic ash. These strata often erode out as green and dark brownlayers.Fresh-water shells are abundant, but sabel palm is the only identified plant. Variousinstitutions in the United States have collected a large number of mammal bones. Grazingbrowsinghorses (Merychippus) and camelids appear to be the most abundant. Many othermammal species have been described, including browsing horses (Hypohippus), dog-bears(Hemicyon), pronghorns, peccaries, chipmunks, field mice, rabbits, dogs, sabre cats, true cats,mastodons, large oreodonts (Brachycrus), and shrews. Two hawks, several ducks, a gull, aflamingo-like bird (Megapaloelodus), and a quail-like bird (Cyrtonyx) have been identified. Thecharacteristics of the flora and fauna (called “Barstovian” fauna) suggest that grassland wasavailable as well as vegetation similar to that of northern Mexico (Woodburn 1978:71; Savage,Downs, and Poe 1954:48). An overview of Barstovian Fauna is presented in Table 3-66.Chapter 3 3-291
Table 3-66Barstovian FaunaHERBIVORESCARNIVORESMastodonts Gomphotherium Dog-bears HEMICYONIDSBrowsing horses (large) HYPOHIPPUS Dogs TomarctusGrazing-browsing Protohippus, Merychippus Hyaenoid dogs Aelurodon?horses (intermediate) Sabre-toothed cats MachairodontsBrowsing horses (small) Archeohippus True cats PseudaelurusPronghornsMerycodusOreodonts Brachycrus, BIRDS & REPTILESDeer Rakomeryx CondorCamels Hesperocamelus Mourning DovePeccaries Dyseohyus DucksFlamingo-like MegapaloelodusRODENTSGullsRabbits Hypolagus HawksChipmunks Tamias Owls (Great Horned)Pocket mice Perognathoides, Peridiomys Quail-like CyrotonyxDeer micePeromyscusShrews Limnoecus Tortoise(Savage, Downs, and Poe 1954:49; Davenport and Goldbrandsen 1963:4; Woodburn 1978:69-71).The Black Mountain-Gravel Hills region is a small-scale badlands north of Harper Lake.Most of the Tertiary section consists of the Barstow Formation, which is the most extensive unitin the Gravel Hills. Barstovian faunal remains of Merychippine horses and Merycodonts havebeen recovered from tuffaceous sandstone near Black Canyon (Woodburne 1978:74).A number of sites occur in relatively coarse-grained fluvial sandstone and gravel bedsnear Victorville and extend north along the <strong>Mojave</strong> River to Barstow. These deposits relate tothe uplift of the San Gabriel Mountains to the south and the history of the <strong>Mojave</strong> River. Thebest fossil specimens have been obtained from the gravel pits by Victorville, but others areknown from exposures to the north. Equus is the most common species, among otherRancholabrean fauna (Woodburne 1978:84).The Cushenbury beds are often referred to as the Old Woman Sandstone of Shreve andcomprise a succession 200 feet to 1,000 feet of massive reddish-buff and red-brownconglomeratic arkose with a matrix of uncemented, poorly sorted, coarse-grained, angularfragments of quartz, feldspar, and hornblende that support subangular to subrounded pebbles ofandesite, gneiss, quartzite, and other minor types. These lithologies are the oldest Tertiarydeposit to be derived from the San Bernardino Mountains, on the north side, and reflect uplift ofthe ranges. A small, but important, and growing collection of small mammal fossils has beencollected from the Cushenbury beds. They appear to be Blancan or late Blancan age and suggestthat the San Bernardino Mountains began shedding debris to the north about 2 million years ago.These fossils provide the only evidence for the age of that uplift (Woodburne 1978:85).Chapter 3 3-292
At Twenty-Nine Palms, there is an unnamed succession of mainly northeast-dipplingfluvial and lacustrine sediments interbedded with tuff a few miles east of the main north roadfrom Twenty-Nine Palms. The exposures are relatively isolated patches of older sedimentssurrounded by younger alluvium. A small collection of Rancholabrean fauna, mostly largemammals, has been collected. These include Equus, Odocoileus, Tanupolama?, Hemiauchenia?,Bison, Ovis, Breameryx? geopherus, Nothrotheriops? taxidea, Camelops (Woodburne 1978:87).3.7.2 Tribal Governments and PoliciesEight tribal governments who might attach religious and cultural significance to historicproperties within the planning area were contacted in June 2000 and from May to July 2001.These included the Lone Pine Paiute Shoshone, Timbisha Shoshone, San Manuel Band,Morongo Band, 29 Palms Band, Fort <strong>Mojave</strong> Tribe, Chemehuevi Tribe, and Colorado RiverIndian Tribes. Contact was made via letter and phone. When contacted by phone in July 2001,the Lone Pine Paiute Shoshone, Timbisha Shoshone, Fort <strong>Mojave</strong> Tribe, Chemehuevi Tribe, andColorado River Indian Tribes requested additional information, and information packets weresent to those tribes. In August 2001 a briefing was presented to the Native American LandsConservancy at their request. As a consequence of contact, no tribe or band identified religiousor cultural significance to historic properties within the planning area.3.7.3 BLM Consultation ProceduresCDCA <strong>Plan</strong> Policies: The CDCA <strong>Plan</strong> recognizes the importance to the public,scientists, Native Americans, and others of prehistoric, historic, and paleontological resources.<strong>Plan</strong> goals are to conduct inventory to the fullest extent possible to expand knowledge of theseresources, protect and preserve to the greatest extent possible representative samples ofresources, give full consideration to these resources during land-use planning and managementdecisions, manage to maintain and enhance resource values, ensure BLM’s activities avoidinadvertent damage to these resources, and achieve proper data recovery where adverse impactscannot be avoided. Specific guidance regarding vehicle route approval is to use resource dataduring the route approval process to help minimize or eliminate adverse impacts on theseresources from access and vehicle use.The CDCA <strong>Plan</strong> also states that cultural and religious values held by Native Americanswill be considered in all CDCA land use and management decisions. CDCA <strong>Plan</strong> goals are toidentify Native American values through regular contact and consultation; give full considerationto Native American values in land use planning and management decisions consistent withstatue, regulation, and policy; and manage and protect Native American values wherever prudentand feasible.Compliance With Pertinent Statutes and Regulations: The BLM has responsibilitiesand authorities to consider, plan for, protect, and enhance historic properties and other culturalresources under the National Environmental Policy Act, Archaeological Resources ProtectionAct, Native American Graves Protection and Repatriation Act, American Indian ReligiousFreedom Act, National Historic Preservation Act, and other authorities.Chapter 3 3-293
Section 106 of the National Historic Preservation Act requires Federal agencies toconsider the affect of undertakings on historic and prehistoric resources and give the AdvisoryCouncil on Historic Preservation a reasonable opportunity to comment on the undertaking.Section 101 (d)(6))B) of the Act requires Federal agencies to consult with any Indian tribe orNative Hawaiian organization that attaches religious and cultural significance to historicproperties that may be affected by an undertaking. When Indian tribes and Native Hawaiianorganizations attach religious and cultural significance to historic properties off tribal lands, theAct requires Federal agencies to consult with such tribes and organizations in the Section 106process. In following the Section 106 process, a Federal agency documents the area of potentialeffects, compiles and analyzes cultural resource data and literature, seeks information fromconsulting parties, synthesizes information, identifies historic properties, assesses adverseeffects, and seek ways to resolve adverse effects. BLM meets its responsibilities under theNational Historic Preservation Act through a Programmatic Agreement with the AdvisoryCouncil on Historic Preservation and the National Conference of State Historic PreservationOfficers and through State Protocols.Chapter 3 3-294