Revised Report - National Marine Fisheries Service Alaska Region ...
Revised Report - National Marine Fisheries Service Alaska Region ...
Revised Report - National Marine Fisheries Service Alaska Region ...
You also want an ePaper? Increase the reach of your titles
YUMPU automatically turns print PDFs into web optimized ePapers that Google loves.
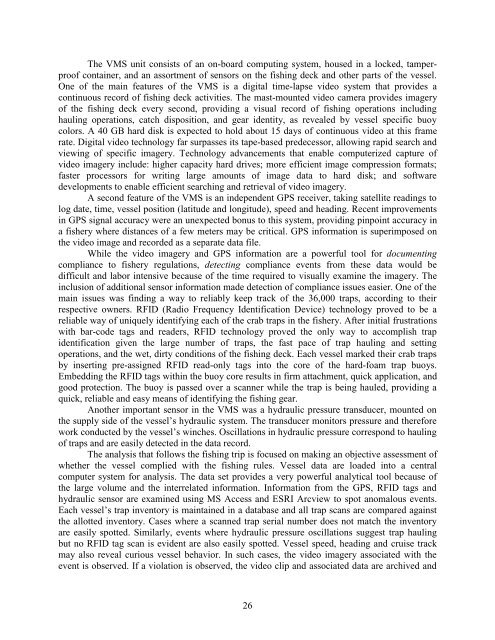
The VMS unit consists of an on-board computing system, housed in a locked, tamperproofcontainer, and an assortment of sensors on the fishing deck and other parts of the vessel.One of the main features of the VMS is a digital time-lapse video system that provides acontinuous record of fishing deck activities. The mast-mounted video camera provides imageryof the fishing deck every second, providing a visual record of fishing operations includinghauling operations, catch disposition, and gear identity, as revealed by vessel specific buoycolors. A 40 GB hard disk is expected to hold about 15 days of continuous video at this framerate. Digital video technology far surpasses its tape-based predecessor, allowing rapid search andviewing of specific imagery. Technology advancements that enable computerized capture ofvideo imagery include: higher capacity hard drives; more efficient image compression formats;faster processors for writing large amounts of image data to hard disk; and softwaredevelopments to enable efficient searching and retrieval of video imagery.A second feature of the VMS is an independent GPS receiver, taking satellite readings tolog date, time, vessel position (latitude and longitude), speed and heading. Recent improvementsin GPS signal accuracy were an unexpected bonus to this system, providing pinpoint accuracy ina fishery where distances of a few meters may be critical. GPS information is superimposed onthe video image and recorded as a separate data file.While the video imagery and GPS information are a powerful tool for documentingcompliance to fishery regulations, detecting compliance events from these data would bedifficult and labor intensive because of the time required to visually examine the imagery. Theinclusion of additional sensor information made detection of compliance issues easier. One of themain issues was finding a way to reliably keep track of the 36,000 traps, according to theirrespective owners. RFID (Radio Frequency Identification Device) technology proved to be areliable way of uniquely identifying each of the crab traps in the fishery. After initial frustrationswith bar-code tags and readers, RFID technology proved the only way to accomplish trapidentification given the large number of traps, the fast pace of trap hauling and settingoperations, and the wet, dirty conditions of the fishing deck. Each vessel marked their crab trapsby inserting pre-assigned RFID read-only tags into the core of the hard-foam trap buoys.Embedding the RFID tags within the buoy core results in firm attachment, quick application, andgood protection. The buoy is passed over a scanner while the trap is being hauled, providing aquick, reliable and easy means of identifying the fishing gear.Another important sensor in the VMS was a hydraulic pressure transducer, mounted onthe supply side of the vessel’s hydraulic system. The transducer monitors pressure and thereforework conducted by the vessel’s winches. Oscillations in hydraulic pressure correspond to haulingof traps and are easily detected in the data record.The analysis that follows the fishing trip is focused on making an objective assessment ofwhether the vessel complied with the fishing rules. Vessel data are loaded into a centralcomputer system for analysis. The data set provides a very powerful analytical tool because ofthe large volume and the interrelated information. Information from the GPS, RFID tags andhydraulic sensor are examined using MS Access and ESRI Arcview to spot anomalous events.Each vessel’s trap inventory is maintained in a database and all trap scans are compared againstthe allotted inventory. Cases where a scanned trap serial number does not match the inventoryare easily spotted. Similarly, events where hydraulic pressure oscillations suggest trap haulingbut no RFID tag scan is evident are also easily spotted. Vessel speed, heading and cruise trackmay also reveal curious vessel behavior. In such cases, the video imagery associated with theevent is observed. If a violation is observed, the video clip and associated data are archived and26


