Revised Report - National Marine Fisheries Service Alaska Region ...
Revised Report - National Marine Fisheries Service Alaska Region ...
Revised Report - National Marine Fisheries Service Alaska Region ...

Create successful ePaper yourself
Turn your PDF publications into a flip-book with our unique Google optimized e-Paper software.
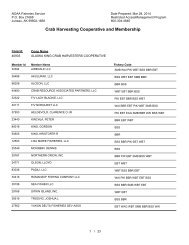
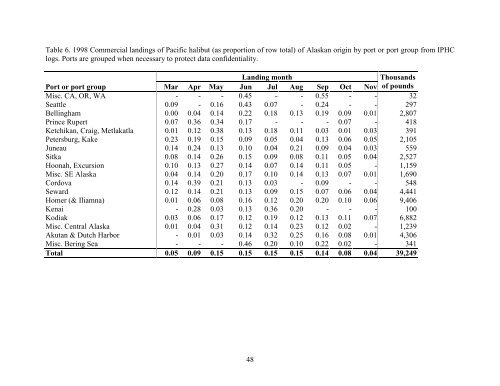
Table 6. 1998 Commercial landings of Pacific halibut (as proportion of row total) of <strong>Alaska</strong>n origin by port or port group from IPHClogs. Ports are grouped when necessary to protect data confidentiality.Landing monthThousandsPort or port group Mar Apr May Jun Jul Aug Sep Oct Nov of poundsMisc. CA, OR, WA - - - 0.45 - - 0.55 - - 32Seattle 0.09 - 0.16 0.43 0.07 - 0.24 - - 297Bellingham 0.00 0.04 0.14 0.22 0.18 0.13 0.19 0.09 0.01 2,807Prince Rupert 0.07 0.36 0.34 0.17 - - - 0.07 - 418Ketchikan, Craig, Metlakatla 0.01 0.12 0.38 0.13 0.18 0.11 0.03 0.01 0.03 391Petersburg, Kake 0.23 0.19 0.15 0.09 0.05 0.04 0.13 0.06 0.05 2,105Juneau 0.14 0.24 0.13 0.10 0.04 0.21 0.09 0.04 0.03 559Sitka 0.08 0.14 0.26 0.15 0.09 0.08 0.11 0.05 0.04 2,527Hoonah, Excursion 0.10 0.13 0.27 0.14 0.07 0.14 0.11 0.05 - 1,159Misc. SE <strong>Alaska</strong> 0.04 0.14 0.20 0.17 0.10 0.14 0.13 0.07 0.01 1,690Cordova 0.14 0.39 0.21 0.13 0.03 - 0.09 - - 548Seward 0.12 0.14 0.21 0.13 0.09 0.15 0.07 0.06 0.04 4,441Homer (& Iliamna) 0.01 0.06 0.08 0.16 0.12 0.20 0.20 0.10 0.06 9,406Kenai - 0.28 0.03 0.13 0.36 0.20 - - - 100Kodiak 0.03 0.06 0.17 0.12 0.19 0.12 0.13 0.11 0.07 6,882Misc. Central <strong>Alaska</strong> 0.01 0.04 0.31 0.12 0.14 0.23 0.12 0.02 - 1,239Akutan & Dutch Harbor - 0.01 0.03 0.14 0.32 0.25 0.16 0.08 0.01 4,306Misc. Bering Sea - - - 0.46 0.20 0.10 0.22 0.02 - 341Total 0.05 0.09 0.15 0.15 0.15 0.15 0.14 0.08 0.04 39,24948