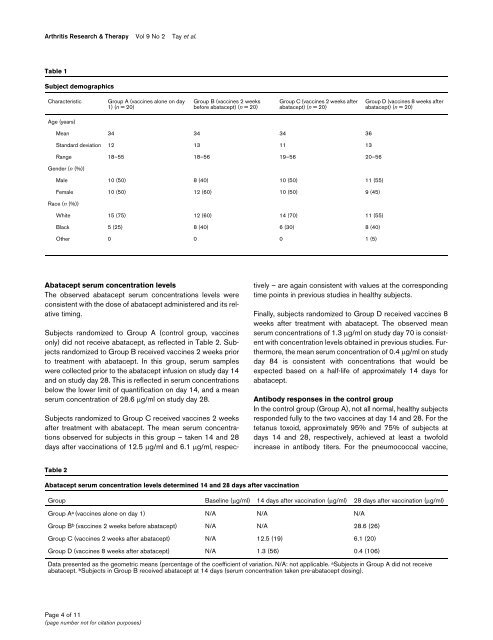
Arthritis Research & Therapy Vol 9 No 2 Tay et al.Table 1Subject demographicsCharacteristicGroup A (vaccines alone on day1) (n = 20)Group B (vaccines 2 weeksbefore abatacept) (n = 20)Group C (vaccines 2 weeks afterabatacept) (n = 20)Group D (vaccines 8 weeks afterabatacept) (n = 20)Age (years)Mean 34 34 34 36St<strong>and</strong>ard deviation 12 13 11 13Range 18–55 18–56 19–56 20–56Gender (n (%))Male 10 (50) 8 (40) 10 (50) 11 (55)Female 10 (50) 12 (60) 10 (50) 9 (45)Race (n (%))White 15 (75) 12 (60) 14 (70) 11 (55)Black 5 (25) 8 (40) 6 (30) 8 (40)Other 0 0 0 1 (5)Abatacept serum concentration levelsThe observed abatacept serum concentrations levels wereconsistent with the dose of abatacept administered <strong>and</strong> its relativetiming.Subjects r<strong>and</strong>omized <strong>to</strong> Group A (control group, vaccinesonly) did not receive abatacept, as reflected in Table 2. Subjectsr<strong>and</strong>omized <strong>to</strong> Group B received vaccines 2 weeks prior<strong>to</strong> treatment with abatacept. In this group, serum sampleswere collected prior <strong>to</strong> the abatacept infusion on study day 14<strong>and</strong> on study day 28. This is reflected in serum concentrationsbelow the lower limit of quantification on day 14, <strong>and</strong> a meanserum concentration of 28.6 μg/ml on study day 28.Subjects r<strong>and</strong>omized <strong>to</strong> Group C received vaccines 2 weeksafter treatment with abatacept. The mean serum concentrationsobserved for subjects in this group – taken 14 <strong>and</strong> 28days after vaccinations of 12.5 μg/ml <strong>and</strong> 6.1 μg/ml, respectively– are again consistent with values at the correspondingtime points in previous studies in healthy subjects.Finally, subjects r<strong>and</strong>omized <strong>to</strong> Group D received vaccines 8weeks after treatment with abatacept. The observed meanserum concentrations of 1.3 μg/ml on study day 70 is consistentwith concentration levels obtained in previous studies. Furthermore,the mean serum concentration of 0.4 μg/ml on studyday 84 is consistent with concentrations that would beexpected based on a half-life of approximately 14 days forabatacept.Antibody <strong>response</strong>s in the control groupIn the control group (Group A), not all normal, healthy subjectsresponded fully <strong>to</strong> the two vaccines at day 14 <strong>and</strong> 28. For the<strong>tetanus</strong> <strong>to</strong>xoid, approximately 95% <strong>and</strong> 75% of subjects atdays 14 <strong>and</strong> 28, respectively, achieved at least a twofoldincrease in antibody titers. For the pneumococcal vaccine,Table 2Abatacept serum concentration levels determined 14 <strong>and</strong> 28 days after vaccinationGroup Baseline (μg/ml) 14 days after vaccination (μg/ml) 28 days after vaccination (μg/ml)Group A a (vaccines alone on day 1) N/A N/A N/AGroup B b (vaccines 2 weeks before abatacept) N/A N/A 28.6 (26)Group C (vaccines 2 weeks after abatacept) N/A 12.5 (19) 6.1 (20)Group D (vaccines 8 weeks after abatacept) N/A 1.3 (56) 0.4 (106)Data presented as the geometric means (percentage of the coefficient of variation. N/A: not applicable. a Subjects in Group A did not receiveabatacept. b Subjects in Group B received abatacept at 14 days (serum concentration taken pre-abatacept dosing).Page 4 of 11(page number not for citation purposes)
Available online http://arthritis-research.com/content/9/2/R38Table 3Geometric means (percentage of the coefficient of variation) of anti-<strong>tetanus</strong> <strong>to</strong>xoid antibody titers taken 14 <strong>and</strong> 28 days after<strong>tetanus</strong> <strong>to</strong>xoid vaccinationGroup n Baseline titers (U/ml) Anti-<strong>tetanus</strong> antibody titers at 14 dayspost-vaccination (U/ml)Anti-<strong>tetanus</strong> antibody titers at 28 dayspost-vaccination (U/ml)Group A (vaccines alone on day 1) 20 1.6 (106) 11.4 (88) 9.3 (104)Group B (vaccines 2 weeks before abatacept) 20 1.9 (76) 10.2 (71) 8.7 (68) aGroup C (vaccines 2 weeks after abatacept) 19 b 2.3 (76) 5.9 (112) 5.6 (98)Group D (vaccines 8 weeks after abatacept) 19 c 2.3 (54) 9.0 (79) 7.8 (85)a n = 19 as one subject discontinued due <strong>to</strong> an adverse event (this discontinued patient only had samples collected at baseline <strong>and</strong> day 14).bSubject discontinued prior <strong>to</strong> vaccine administration on day 14 due <strong>to</strong> <strong>to</strong>xicology. c Subject discontinued prior <strong>to</strong> vaccine administration on day 56due <strong>to</strong> <strong>to</strong>xicology.approximately 45–95% <strong>and</strong> 50–95% of subjects at days 14<strong>and</strong> 28, respectively, achieved at least a twofold increase inantibody titer across all seven serotypes.Antibody <strong>response</strong> <strong>to</strong> <strong>tetanus</strong> <strong>to</strong>xoidThe antibody <strong>response</strong>s against <strong>tetanus</strong> <strong>to</strong>xoid vaccine,expressed as absolute titers of antibodies, are summarized inTable 3. The corresponding abatacept serum concentrationsare presented in Table 2.The intersubject variability in <strong>response</strong> <strong>to</strong> <strong>tetanus</strong> <strong>to</strong>xoid waslarge, with the percentage of the coefficient of variation rangingbetween 54% <strong>and</strong> 112% (Table 3). Based on the geometricmean of the antibody titers, subjects in Group B (receivedvaccines 2 weeks before abatacept) appeared little affected <strong>to</strong>not affected, with a lowered <strong>response</strong> of approximately 6%when compared with the control group (Group A) at 28 daysafter vaccination, a reduction within the variability of the assay(Table 3). For Group C subjects (received vaccines 2 weeksafter abatacept), there appeared <strong>to</strong> be a lowered <strong>response</strong> ofapproximately 48% <strong>and</strong> 39% at 14 <strong>and</strong> 28 days, respectively,compared with Group A. Subjects in Group D (received vaccines8 weeks after abatacept) were affected <strong>to</strong> a lesserextent, with an observed lowered <strong>response</strong> of approximately21% <strong>and</strong> 16% at 14 <strong>and</strong> 28 days, respectively, compared withGroup A.The percentage of subjects who mounted a <strong>response</strong> that wasat least twofold from baseline is shown in Figure 2 for <strong>tetanus</strong><strong>to</strong>xoid. Across all treatment groups, at least 60% of subjectswere able <strong>to</strong> generate at least a twofold increase in antibody<strong>response</strong> after 28 days. In the control group (Group A), 75%of subjects reached this level. The <strong>response</strong>s observed at 14<strong>and</strong> 28 days after vaccination were similar.Antibody <strong>response</strong>s <strong>to</strong> <strong>23</strong>-valent pneumococcal vaccineSeven serotypes of <strong>23</strong>-valent pneumococcal vaccine werechosen as a representative sample of differing immunogenicstrengths of pneumococcal vaccine. Serotype 14 (the mostcommon), serotype 8, serotype 9V <strong>and</strong> serotype 2 are themost immunogenic. Figure 3 illustrates the fold increases forthe seven serotypes at days 14 <strong>and</strong> 28, respectively, <strong>and</strong>Table 4 presents the corresponding geometric mean values ofantibody titers.As with the <strong>response</strong> <strong>to</strong> <strong>tetanus</strong> <strong>to</strong>xoid, variable <strong>response</strong> rateswere obtained in the study subjects across individual serotypes.The percentages of subjects in all treatment groupsachieving a positive <strong>response</strong> <strong>to</strong> the different serotypes at 14<strong>and</strong> 28 days after vaccination are illustrated in Figure 4a <strong>and</strong>4b, respectively. In general, <strong>and</strong> as expected, the highest<strong>response</strong>s were observed for serotypes 14 <strong>and</strong> 2. The apparentdecrease in vaccination <strong>response</strong> in subjects who were inGroup B cannot be accurately evaluated because of thehigher baseline values obtained in these subjects, a knowncause of reduced relative <strong>response</strong>s. This r<strong>and</strong>omization variabilityis further illustrated by the fact that <strong>response</strong>s in GroupB subjects appeared decreased even at day 14, prior <strong>to</strong> theadministration of abatacept. In subjects of Groups C <strong>and</strong> D,however – those who were vaccinated after abatacept – loweraverage titers on days 14 <strong>and</strong> 28 were recorded for allserotypes, except serotype <strong>23</strong>F (Table 4). The decrease inantibody <strong>response</strong> in Group C subjects at 14 <strong>and</strong> 28 daysafter vaccination ranged from 22% <strong>to</strong> 69% <strong>and</strong> from 24% <strong>to</strong>68%, respectively. Similarly, the decrease in antibody<strong>response</strong> for subjects in Group D determined at 14 <strong>and</strong> 28days after vaccination ranged between 12% <strong>and</strong> 67% <strong>and</strong>between 25% <strong>and</strong> 64%, respectively. No correlation betweenthe immunogenicity of the serotype of the pneumococcal vaccine<strong>and</strong> the reduction in <strong>response</strong> was observed.Figure 5a,b summarizes the number of serotypes <strong>to</strong> whichsubjects responded with at least a twofold increase over baselineat 14 <strong>and</strong> 28 days after vaccination, respectively. Morethan 90% of subjects in all treatment groups responded <strong>to</strong> atleast one serotype, over 70% of subjects responded <strong>to</strong> at leastthree different serotypes, <strong>and</strong> approximately 25% of subjectsresponded <strong>to</strong> at least six different serotypes by day 14 (Figure5a) <strong>and</strong> by day 28 (Figure 5b).Page 5 of 11(page number not for citation purposes)