Predictor Type 7810 Version 3.0 Software for Prediction and ... - nl3prc
Predictor Type 7810 Version 3.0 Software for Prediction and ... - nl3prc
Predictor Type 7810 Version 3.0 Software for Prediction and ... - nl3prc

Create successful ePaper yourself
Turn your PDF publications into a flip-book with our unique Google optimized e-Paper software.
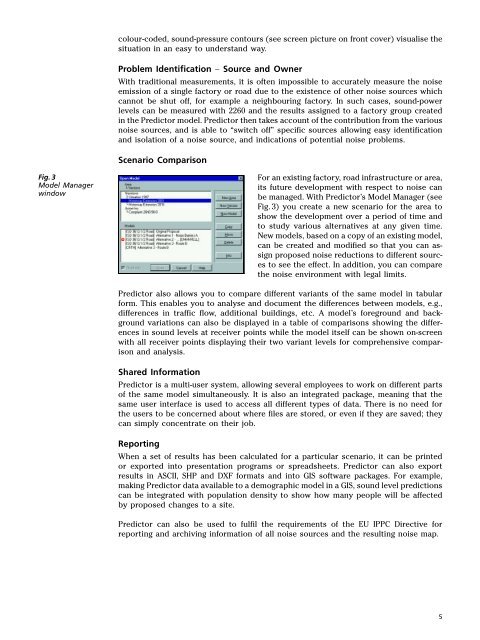
colour-coded, sound-pressure contours (see screen picture on front cover) visualise thesituation in an easy to underst<strong>and</strong> way.Problem Identification − Source <strong>and</strong> OwnerWith traditional measurements, it is often impossible to accurately measure the noiseemission of a single factory or road due to the existence of other noise sources whichcannot be shut off, <strong>for</strong> example a neighbouring factory. In such cases, sound-powerlevels can be measured with 2260 <strong>and</strong> the results assigned to a factory group createdin the <strong>Predictor</strong> model. <strong>Predictor</strong> then takes account of the contribution from the variousnoise sources, <strong>and</strong> is able to “switch off” specific sources allowing easy identification<strong>and</strong> isolation of a noise source, <strong>and</strong> indications of potential noise problems.Scenario ComparisonFig. 3Model ManagerwindowFor an existing factory, road infrastructure or area,its future development with respect to noise canbe managed. With <strong>Predictor</strong>’s Model Manager (seeFig. 3) you create a new scenario <strong>for</strong> the area toshow the development over a period of time <strong>and</strong>to study various alternatives at any given time.New models, based on a copy of an existing model,can be created <strong>and</strong> modified so that you can assignproposed noise reductions to different sourcesto see the effect. In addition, you can comparethe noise environment with legal limits.<strong>Predictor</strong> also allows you to compare different variants of the same model in tabular<strong>for</strong>m. This enables you to analyse <strong>and</strong> document the differences between models, e.g.,differences in traffic flow, additional buildings, etc. A model’s <strong>for</strong>eground <strong>and</strong> backgroundvariations can also be displayed in a table of comparisons showing the differencesin sound levels at receiver points while the model itself can be shown on-screenwith all receiver points displaying their two variant levels <strong>for</strong> comprehensive comparison<strong>and</strong> analysis.Shared In<strong>for</strong>mation<strong>Predictor</strong> is a multi-user system, allowing several employees to work on different partsof the same model simultaneously. It is also an integrated package, meaning that thesame user interface is used to access all different types of data. There is no need <strong>for</strong>the users to be concerned about where files are stored, or even if they are saved; theycan simply concentrate on their job.ReportingWhen a set of results has been calculated <strong>for</strong> a particular scenario, it can be printedor exported into presentation programs or spreadsheets. <strong>Predictor</strong> can also exportresults in ASCII, SHP <strong>and</strong> DXF <strong>for</strong>mats <strong>and</strong> into GIS software packages. For example,making <strong>Predictor</strong> data available to a demographic model in a GIS, sound level predictionscan be integrated with population density to show how many people will be affectedby proposed changes to a site.<strong>Predictor</strong> can also be used to fulfil the requirements of the EU IPPC Directive <strong>for</strong>reporting <strong>and</strong> archiving in<strong>for</strong>mation of all noise sources <strong>and</strong> the resulting noise map.5