Predictor Type 7810 Version 3.0 Software for Prediction and ... - nl3prc
Predictor Type 7810 Version 3.0 Software for Prediction and ... - nl3prc
Predictor Type 7810 Version 3.0 Software for Prediction and ... - nl3prc
Create successful ePaper yourself
Turn your PDF publications into a flip-book with our unique Google optimized e-Paper software.
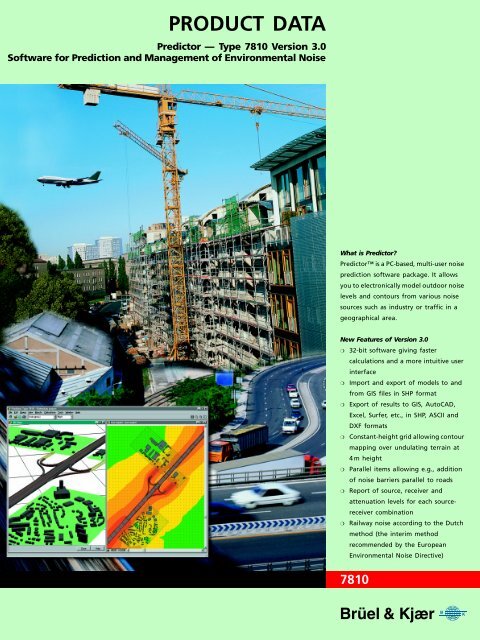
PRODUCT DATA<strong>Predictor</strong> — <strong>Type</strong> <strong>7810</strong> <strong>Version</strong> <strong>3.0</strong><strong>Software</strong> <strong>for</strong> <strong>Prediction</strong> <strong>and</strong> Management of Environmental NoiseWhat is <strong>Predictor</strong>?<strong>Predictor</strong> is a PC-based, multi-user noiseprediction software package. It allowsyou to electronically model outdoor noiselevels <strong>and</strong> contours from various noisesources such as industry or traffic in ageographical area.New Features of <strong>Version</strong> <strong>3.0</strong>❍ 32-bit software giving fastercalculations <strong>and</strong> a more intuitive userinterface❍ Import <strong>and</strong> export of models to <strong>and</strong>from GIS files in SHP <strong>for</strong>mat❍ Export of results to GIS, AutoCAD,Excel, Surfer, etc., in SHP, ASCII <strong>and</strong>DXF <strong>for</strong>mats❍ Constant-height grid allowing contourmapping over undulating terrain at4 m height❍ Parallel items allowing e.g., additionof noise barriers parallel to roads❍ Report of source, receiver <strong>and</strong>attenuation levels <strong>for</strong> each sourcereceivercombination❍ Railway noise according to the Dutchmethod (the interim methodrecommended by the EuropeanEnvironmental Noise Directive)<strong>7810</strong>
Data EntryTo create your model in <strong>Predictor</strong>, a geographical model of the area in question mustbe generated. You do this using a st<strong>and</strong>ard Windows interface. The input data can takethe <strong>for</strong>m of topographical maps in BMP/DXF file <strong>for</strong>mat, or digitised maps loaded directlyinto <strong>Predictor</strong>. You assign values to noise sources. These can be “real” values measuredusing 2260 Investigator, <strong>and</strong> downloaded directly into <strong>Predictor</strong>, along with GPS positionaldata. Other sources of noise can be taken from a catalogue of noise sourcesavailable in <strong>Predictor</strong> (see Fig. 1). Roads can be modelled according to traffic flow.As the majority of the data required in the model can be input electronically, you canbuild up a model very quickly. And polyline items can be connected <strong>for</strong> more accuratemodelling of intersections <strong>and</strong> hills. Noise receiver points can be automatically positionedat a defined, fixed distance from l<strong>and</strong>marks in your model, such as buildings<strong>and</strong> roads, to speed the modelling process. <strong>Predictor</strong> also offers the choice of displayingup to 6 receiver heights on the same vertical scale at the one time.Successive model items of the same type are automatically identified <strong>and</strong> numberedincremently if desired.Calculations can be interrupted, refined, <strong>and</strong> then resumed without loss of existingcalculation files, reducing total calculation time. Your <strong>Predictor</strong> database can be compressed/decompressedas required, saving disk space <strong>and</strong> quickening database exchange.Fig. 1<strong>Predictor</strong>’s inputs <strong>and</strong> outputs<strong>Predictor</strong> is designed to accept vastamounts of data about the realworld using actual noisemeasurements (captured using 2260Investigator), detailed topographicalmaps (e.g., 3D AutoCad DXF files orGIS data), <strong>and</strong> other, perhaps smaller,more localised <strong>Predictor</strong> models. Theresults can be graphical or tabular,exportable to various types ofsoftware <strong>and</strong> peripherals22602260A2260B2260F2260E(L W data)(SPL data)Other <strong>Predictor</strong> databasesL W data in tab-delimited <strong>for</strong>matTopographical maps inSHP, DXF or BMP <strong>for</strong>matsDigitizerManual data entryTabular results(Results, Attributes,Comparisons, Reductions,Attenuation)Graphical views(Results, Comparisons,Colour coded contours ,3D,Cross-section)Other <strong>Predictor</strong> databasesPrinter/PlotterSpreadsheet/WordProcessors / SurferAuto CAD (DXF <strong>for</strong>mat)GeographicalIn<strong>for</strong>mation System(GIS)(SHP <strong>for</strong>mat)010080Model RefinementOnce you have created a model in <strong>Predictor</strong>, you can compare predicted values withreal readings taken on-site with 2260 Investigator. This helps you to refine your model.Receiver points can be created automatically with control values from 2260 Investigatormeasurement. This speeds the building of your model while guaranteeing the accuracyof the receiver points.It is possible to isolate individual sections of the model <strong>for</strong> calculations, eliminating theneed to recalculate the entire system <strong>for</strong> every small change. Individual source-receivercombinations can be investigated in detail, showing all the attenuation terms, <strong>for</strong> assessmentof the model <strong>and</strong> the calculation.Multi-edit of sources <strong>and</strong> other model items is available <strong>for</strong> rapid model adjustmentwhile other simple but powerful tools such as cross-sectional <strong>and</strong> 3D visualisations helpyou build an accurate model.3
<strong>Predictor</strong> guards all modifications in a model. Only the results that become invalid dueto acoustic-relevant modifications need to be recalculated. This unique ‘acoustic eye’feature of <strong>Predictor</strong> not only reduces calculation time but, more importantly, ensuresconsistency between input <strong>and</strong> results.ResultsThe result of calculations can be displayed graphically or as a suite of result tables(see Fig. 2). You can now very quickly verify that the model represents reality, <strong>and</strong>identify noise problems by comparing predicted values to legal limits. In addition,source, receiver <strong>and</strong> attenuation levels <strong>for</strong> each source-receiver combination can beviewed to evaluate the quality of the calculations <strong>and</strong> as a help to determine how toreduce noise levels.Fig. 2Some of the modelviews <strong>and</strong> variousoutput resultsavailable with<strong>Predictor</strong>There are three types of table available <strong>for</strong> showing the sound level at receiving points:❍ Tables of results that present actual data, ranked if necessary, to find the maximumsound level (see Fig. 2)❍ Tables of comparison, showing compared results from the current model withreference levels set by measurements, user-defined limits, or another acoustic model❍ Tables of control, showing the calculated results compared to control values, <strong>for</strong>example permitted values. The table can also show the effect of reducing a group ofnoise sources when planning reductions.Noise Reduction <strong>and</strong> Noise ManagementRanking <strong>and</strong> ReductionIn complex environments, it can be difficult with traditional techniques to see exactlyhow much noise each source contributes to the overall noise picture. <strong>Predictor</strong> can dothis by ranking the individual noise sources to clearly show the importance of eachsource.The effect of noise reduction can also be studied by introducing a reduction to theemission of a source (or groups of sources). <strong>Predictor</strong> makes available immediate “whatif” results, <strong>for</strong> example, “what if all exhaust ventilators are reduced by 6 dB?” Moreover,4
colour-coded, sound-pressure contours (see screen picture on front cover) visualise thesituation in an easy to underst<strong>and</strong> way.Problem Identification − Source <strong>and</strong> OwnerWith traditional measurements, it is often impossible to accurately measure the noiseemission of a single factory or road due to the existence of other noise sources whichcannot be shut off, <strong>for</strong> example a neighbouring factory. In such cases, sound-powerlevels can be measured with 2260 <strong>and</strong> the results assigned to a factory group createdin the <strong>Predictor</strong> model. <strong>Predictor</strong> then takes account of the contribution from the variousnoise sources, <strong>and</strong> is able to “switch off” specific sources allowing easy identification<strong>and</strong> isolation of a noise source, <strong>and</strong> indications of potential noise problems.Scenario ComparisonFig. 3Model ManagerwindowFor an existing factory, road infrastructure or area,its future development with respect to noise canbe managed. With <strong>Predictor</strong>’s Model Manager (seeFig. 3) you create a new scenario <strong>for</strong> the area toshow the development over a period of time <strong>and</strong>to study various alternatives at any given time.New models, based on a copy of an existing model,can be created <strong>and</strong> modified so that you can assignproposed noise reductions to different sourcesto see the effect. In addition, you can comparethe noise environment with legal limits.<strong>Predictor</strong> also allows you to compare different variants of the same model in tabular<strong>for</strong>m. This enables you to analyse <strong>and</strong> document the differences between models, e.g.,differences in traffic flow, additional buildings, etc. A model’s <strong>for</strong>eground <strong>and</strong> backgroundvariations can also be displayed in a table of comparisons showing the differencesin sound levels at receiver points while the model itself can be shown on-screenwith all receiver points displaying their two variant levels <strong>for</strong> comprehensive comparison<strong>and</strong> analysis.Shared In<strong>for</strong>mation<strong>Predictor</strong> is a multi-user system, allowing several employees to work on different partsof the same model simultaneously. It is also an integrated package, meaning that thesame user interface is used to access all different types of data. There is no need <strong>for</strong>the users to be concerned about where files are stored, or even if they are saved; theycan simply concentrate on their job.ReportingWhen a set of results has been calculated <strong>for</strong> a particular scenario, it can be printedor exported into presentation programs or spreadsheets. <strong>Predictor</strong> can also exportresults in ASCII, SHP <strong>and</strong> DXF <strong>for</strong>mats <strong>and</strong> into GIS software packages. For example,making <strong>Predictor</strong> data available to a demographic model in a GIS, sound level predictionscan be integrated with population density to show how many people will be affectedby proposed changes to a site.<strong>Predictor</strong> can also be used to fulfil the requirements of the EU IPPC Directive <strong>for</strong>reporting <strong>and</strong> archiving in<strong>for</strong>mation of all noise sources <strong>and</strong> the resulting noise map.5
Fig. 4Isophone maps.The two maps show the samegeographical area, centred on aconcrete works by a waterwayThe left-h<strong>and</strong> map shows the noiseenvironment if a proposal to allowships to dock <strong>and</strong> begin loadingconcrete is permitted. Two ships areactive, each has two noise sources, aloading crane <strong>and</strong> a ventilation system.There is a noise-sensitive site on theNorth bank of the waterway. You cansee that the noise level here hasincreased from below 40 dB (see righth<strong>and</strong>map) to 40 − 45 dBNoise MappingNoise mapping, normally understood as mapping over a large area (<strong>for</strong> example, of alarge town or even over an entire country – see Fig. 5), typically involves the presentationof simple acoustic parameters, possibly combined with demographic factors such aspopulation or house prices, in varying levels of detail. The task is often quite dem<strong>and</strong>ing,both of computer capability <strong>and</strong> of time. Accurate models often take several days tocalculate, so getting the input data right is important as is the ability to make smallermodels <strong>and</strong> combine them into larger models.Fig. 5Noise map <strong>and</strong>populationexposure statisticsof a large area<strong>Predictor</strong> helps make these noise maps either onits own or in combination with GIS tools such asArcView. Large scale maps with medium-rangeresolution or small-scale maps with high resolutioncan be made using <strong>Predictor</strong> alone. Largermaps or combination with demography <strong>for</strong> populationexposure can be done through <strong>Predictor</strong>’sinterface, as can the import of digital data. Useof <strong>Predictor</strong> allows the user to focus on acousticmodelling with familiar tools thus saving time<strong>and</strong> energy <strong>and</strong> offering a well-defined <strong>and</strong> documentedinterface between the acoustic model<strong>and</strong> other software. Different types of high-quality data analysis <strong>and</strong> presentation areavailable, depending on whether <strong>Predictor</strong> is used st<strong>and</strong>-alone or not.<strong>Predictor</strong>’s advanced model management tools ease the development of current <strong>and</strong>future scenarios by doing them in parallel using common data.You have full control over the level of detail in the map. Small-scale maps can beextracted to check details <strong>and</strong> later integrated back into larger maps. In addition youcan also combine the physical levels from different maps in different ways to indicatemulti-source annoyance.All relevant source types are covered using recognised algorithms, such as the Dutchrailway noise method, <strong>and</strong> existing digital data such as topography, traffic flow <strong>and</strong>measured noise levels can be used to save time <strong>and</strong> prevent errors.6
<strong>Software</strong> Support <strong>for</strong> <strong>Predictor</strong><strong>Predictor</strong> <strong>Software</strong> Support is a service offered by Brüel & Kjær. It is your security <strong>for</strong>getting quick <strong>and</strong> professional help when you need it saving you time <strong>and</strong> cost. If youever have a software problem with <strong>Predictor</strong>, the <strong>Software</strong> Support agreement entitlesyou to help by:❍❍❍E-mailFaxTelephoneBrüel & Kjær will send you a response with the answer to your <strong>Predictor</strong> problem nomore than 2 working days 1 after we have received your request.1. All working days from 09.00 − 17.00 Central European Time(Closed at weekends <strong>and</strong> Danish Public Holidays)America:+ time difference to CETFar East <strong>and</strong> Asia: + time difference to CETSpecifications <strong>Type</strong> <strong>7810</strong>Functional SpecificationsCALCULATION METHODDepending on which specific option is chosen, the algorithm <strong>for</strong>calculating the propagation of sound from source to receiver viaintermediate items is based upon:• ISO 9613.1 <strong>and</strong> 9613.2• DAL 32 (Nordic industry method)• CRTN-88 (UK road method)• RLM2 (Dutch rail method)MODEL PROPERTIESModel Area: Expressed in metres to 2 decimal places; definedby user when a new area is created. Maximum size in x <strong>and</strong> ydirection is 2000 km × 2000 kmModel Items: Up to 16000 items (sources, receiver points,buildings, etc.) with up to 10000 receiver points in each grid.MODEL ITEMS(Including important item parameters)<strong>Type</strong>s of items available <strong>and</strong> their nomenclature are dependenton the variantPoint Source (not available in CRTN <strong>and</strong> RLM2): % emission perhour, emission; 1/1-oct. b<strong>and</strong>s from 31 Hz to 8 kHz, L w (dB(A)),reduction (dB) <strong>and</strong> L w(tot) (dB(A))Line Sources (ISO 9613 only): Polyline source, parameters as pointsource but L w is defined per metreRoad (ISO 9613 only): Polyline source, distribution (daily trafficflow <strong>and</strong> its distribution over periods, <strong>and</strong> 4 vehicle types), ortraffic flow (number of vehicles in 4 types), speed, gradient <strong>and</strong>surface.Road (CRTN only): Polyline source or traffic flow (light <strong>and</strong> heavyvehicles), speed, gradient <strong>and</strong> surfaceRailway (RLM2 only): Track construction, flow per train category,speed, stop-fractionBuilding: profile correction (0 or 2 dB), reflection; 1/1-oct. b<strong>and</strong>sBarrier: Polyline, reflection factorGround Region: Ground factorHousing Region: Surface density (%)Industrial Site: Attenuation (dB/km); 1/1-oct. b<strong>and</strong>sFoliage Region: Height above ground levelPoint Receiver: Height above ground levelGrid Receivers: Distance between receivers, number of receiversSurface Contour: Defined by 3D coordinatesVIEW PROPERTIESZoom: In <strong>and</strong> out of specified rectangular areaItems: Specification of colour, internal hatching, symbol, linestyle, text labelsBackground: Topographical maps in DXF or BMP <strong>for</strong>matimported onto model area as a model baseCross-section: Elevation view of surface contours at a definedline3D View: Perspective view of chosen area from a user-definedviewpointRESULTS DISPLAYOn Screen: Annotated maps, coloured contour maps or tables(see below)Periods: 4 user-defined plus 1 compound (day, evening, night,24 hr L DN , L DEN etc.)Table of Results: Shows calculated results at each specifiedreceiver, either total or octave valuesTable of Comparisons: Shows the difference in SPL between twospecified scenarios of the model − a “be<strong>for</strong>e <strong>and</strong> after” or “whatif” toolTable of Control: Shows calculated values compared to permittedvalues with ranking to identify the possible solutions to noisereduction. Table of control also shows which groups (<strong>for</strong>example, a specified factory site) that need to have reducednoise to fulfil requirementsCALCULATIONCalculation Features: Start; Test; Selective; Stop; Pause; Resume;BatchCalculation Parameters (ISO 9613):• Meteorological Correction: C 0• Ground Attenuation: Factor from 0.00 to 1.00• Temperature: Kelvin• Pressure: kPa7
• Humidity: Relative%• Air Absorption: dB / km in 1/1-oct. b<strong>and</strong>s from 31 Hz to 8 kHzINPUT TO MODELActual Measured Data: Automatic creation of receiver pointsfrom L eq , L 10 <strong>and</strong> L 90 measured with 2260 Investigator with GPSpositional dataAutomatic creation of point sources from L w measured with2260 Investigator (with GPS positional data)Import: From other <strong>Predictor</strong> databasesDigitizer: For specifying item position coordinates, <strong>for</strong> examplerelative to an existing map.DXF File Import: 3D coordinates extracted from DXF layers tocreate surface contours or background mapBMP File Import: Coloured pixel mapSHP File Import: All items (<strong>for</strong> import from GIS)SOUND POWER MANAGERDatabase of sound power in 1/3-octaveInput: Manual, from 2260 Investigator, from spreadsheet or otherdatabase via text file. Direct input of sound power levels withpositional data is also possibleFields: Sources, type, device, industry, sound power,measurement method, measurement date, source height,literature references, notesFilter Options: By any user-selected fieldOUTPUTOn Screen: Results displayed in tabular or graphical <strong>for</strong>mClipboard: Tables <strong>and</strong> screen pictures can be copied <strong>for</strong> inclusionin other Windows programsExport: To other <strong>Predictor</strong> databases <strong>and</strong> GIS systems (ASCII, SHP,POI <strong>and</strong> DXF <strong>for</strong>mats)Printing: Graphical display with extra annotation printable to allst<strong>and</strong>ard Windows output devicesPrint Model: Print preview available as well as option ofselectively removing components, such as GPS reference points<strong>and</strong> ground regions, from the model as desired. Storing <strong>and</strong> reusingof multiple plot settings possibleComputer SystemRECOMMENDED MINIMUM REQUIREMENTSPentium ® II 350 MHz with Windows NT64 Mb RAMAt least 50 Mb of free disk space, plus the disk space used as aworking areaCD-ROM driveSVGA graphics display/adaptorMouse or other pointing deviceFor larger <strong>Predictor</strong> models, these requirements should begreatly exceeded in order to improve data h<strong>and</strong>ling speed.Operating System: <strong>Predictor</strong> works with Windows 95, Windows98, Windows NT 3.51, Windows NT 4.0 <strong>and</strong> Windows 2000Ordering In<strong>for</strong>mation<strong>Type</strong> <strong>7810</strong> <strong>Predictor</strong> <strong>Version</strong> <strong>3.0</strong>includes the following calculation modules:• General Noise (ISO method)• Road Traffic Noise (ISO method)• Industrial Noise (Nordic method)• Road Traffic Noise (CRTN method)• Railway Noise (Dutch method)<strong>and</strong> includes the following accessories:Program on CD-ROM (all modules included in the one license)Program protection keyUser ManualAccessories Available2260 InvestigatorServices Available<strong>7810</strong> SIF <strong>Predictor</strong> Installation<strong>7810</strong> MS1 <strong>Predictor</strong> <strong>Software</strong> Maintenance <strong>and</strong> Upgrade<strong>7810</strong> MS2 <strong>Predictor</strong> <strong>Software</strong> Maintenance <strong>and</strong> Upgrade<strong>7810</strong> SH1 <strong>Predictor</strong> <strong>Software</strong> Support<strong>7810</strong> ED1 <strong>Predictor</strong> Basic Training (at Brüel & Kjær HQ, localBrüel & Kjær office or at customer site)Brüel & Kjær reserves the right to change specifications <strong>and</strong> accessories without noticeBP 1602−19 01/06 Rosendahls BogtrykkeriHEADQUARTERS: DK-2850 Nærum · Denmark · Telephone: +4545800500 · Fax: +4545801405 · http://www.bksv.com · e-mail: info@bksv.comAustralia (02)9450-2066 · Austria 0043-1-8657400 · Brazil (011)5182-8166 · Canada (514)695-8225 · China (86) 1068029906Czech Republic 02-67021100 · Finl<strong>and</strong> (0)9-755 950 · France (01)69907100 · Germany 06103/733 5-0 · Hong Kong 25487486 · Hungary (1)2158305Irel<strong>and</strong> (01)803 7600 · Italy 02 57 68061 · Japan 03-3779-8671 · Republic of Korea (02)3473-0605 · Netherl<strong>and</strong>s (31)318 559290 · Norway 66771155Pol<strong>and</strong> (22)858 9392 · Portugal (1)4711453 · Singapore (65) 377- 4512 · Slovak Republic 421 7 544 307 01 · Spain (91)6590820 · Sweden (08)4498600Switzerl<strong>and</strong> (0)1 880 70 35 · Taiwan (02)7139303 · United Kingdom (0)1438 739 000 · USA 800 332 2040Local representatives <strong>and</strong> service organisations worldwide


