VIBRATION EFFECT ON VICKERS HARDNESS MEASUREMENT
VIBRATION EFFECT ON VICKERS HARDNESS MEASUREMENT
VIBRATION EFFECT ON VICKERS HARDNESS MEASUREMENT

Create successful ePaper yourself
Turn your PDF publications into a flip-book with our unique Google optimized e-Paper software.
ORAL SESSI<strong>ON</strong> II : <strong>HARDNESS</strong> <strong>MEASUREMENT</strong>IMEKO 2010 TC3, TC5 and TC22 ConferencesMetrology in Modern ContextNovember 22−25, 2010, Pattaya, Chonburi, Thailand<strong>VIBRATI<strong>ON</strong></strong> <strong>EFFECT</strong> <strong>ON</strong> <strong>VICKERS</strong> <strong>HARDNESS</strong> <strong>MEASUREMENT</strong>Tassanai Sanponpute 1 , Apichaya Meesaplak 21National Institute of Metrology Thailand, Pathumthani, Thailand, Tassanai@nimt.or.th2National Institute of Metrology Thailand, Pathumthani, Thailand, Apichaya@nimt.or.thAbstract − The effect of environmental vibration onVickers hardness machine is reported in this paper. Testforce 9.807 N (HV1) and 98.07 N (HV10), representinglow-force hardness test and normal hardness test, wereselected for this experiment. Two machines with differentloading mechanism made indentation under influence ofsingle sinusoidal vibration with frequency ranging from 10Hz to 100 Hz and amplitude ranging from 0.002 m/s 2 to 0.04m/s 2 . Indentations were captured by CCD camera anddiagonal lengths were measured automatically by software.Response to vibration for each loading mechanism, hardnesslevel, and test force level is discussed in this paper. Thisexperiment shows that the relative errors are higher thanmaximum permissible error in ISO 6507-2 when vibrationamplitude higher than 0.005 m/s 2 or 0.0005 g n . Result fromthis paper can be used as a guideline to revise maximumallowable vibration acceleration and test force scale towhich the limit should be applied.Keywords : Vibration effect, Vickers hardness1. INTRODUCTI<strong>ON</strong>National Institute of Metrology Thailand had studied onvibration effect on Rockwell scale hardness measurement in2009 [1,2]. The research emphasized the importance ofsetting the allowable vibration limit as a guideline forRockwell hardness testing machine users. Althoughvibration limit according to ISO 6507-3[3] was applied,vibration still caused the error of Rockwell hardnessmeasurement higher than the maximum permissible error.Vibration effect on Vickers was assumed to cause errorhigher than maximum permissible error as similar as inRockwell hardness measurement. The maximum allowanceacceleration identified in ISO 6507-3 is applied only tomicro hardness testing only. Therefore, this research wasaimed to investigate the effect of vibration on Vickershardness measurement for vibration acceleration undermaximum allowance applied to low-force and normalVickers hardness test.2. EXPERIMENTAL SETUPIn this experiment, the vibration signal was singlesinusoidal wave. Accelerometer was used to confirmvibration frequencies and amplitudes and also to check thatno other vibration noises reaching the machines during theexperiment. The Vickers hardness testing machines wereplaced on the vibration table. In this study, only indentationprocess was under vibration influence. No vibration effectinvolved in diagonal length measuring process.To study the response-to-vibration behavior of differentloading mechanism of Vickers hardness testing machine,two machines with two types of mechanism, which are thecommon types in Vickers hardness testing machine, wereused in this experiment. First machine, machine A is capableof measure hardness scale HV0.01-HV1. Test force isgenerated directly from deadweight and transferred throughweight axle, which slides in the Teflon coated bush.Machine B composes of 2 loading devices. The first oneis for hardness measurement scale HV0.01-HV2. Weight ofindenter and deadweight is deducted by internal counterweight, so the initial force starts at 10 gf for scale HV0.01.Indenter moves vertically in ball bearing slot. This is calledas Machine B-I.The second loading device of machine B is used forhardness scale HV0.1 to HV10. This loading device hassimilar main structure as loading device I, but weight ofindenter and indenter rod was designed to generate initialforce at 100 gf. Therefore, counter weight is not needed forthe smallest scale, HV0.1. Machine B with loading device IIis called as B-II.To eliminate the effect of diagonal length measurement,the same microscope was used to measure all indentations inthis experiment. Indentations were captured by 12-Megapixel CCD camera. Then, diagonal lengths weredirectly measured by software with reproducibility 0.05%for 300 µm and 1% for 50 µm.Machine A, machine B-I and machine B-II were underthe experiment respectively. First, machines were verifiedby calibration procedure according to ISO 6507-2. Then, theexperiment started from hardness measurement at free fromvibration condition at nominal 200 HV1 and 900 HV1 formachine A, 200 HV1, 600 HV1, 900 HV1 for machine B-I,and 200 HV10, 600 HV10, 900 HV10 for machine B-II.This measurement values were used as reference for errorcalculation. Then, peak of error were found under vibrationat amplitude of 0.002, 0.005, 0.01, 0.02, and 0.04 m/s2. Foreach amplitude, frequencies were set depending on the errortrend to ensure that the error peak was found. However allfrequencies used in this research are between 5 Hz to 100Hz.Page 145
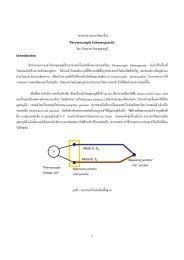
TC5 : <strong>HARDNESS</strong>The result analysis includes the behavioral response tovibration of each structure type, hardness level, and testforce level.3. RESULTS AND DISCUSSI<strong>ON</strong>3.1 Machine Calibration ResultBoth machines passed direct and indirect verificationaccording to ISO 6507-2:2005. However, during the testforce verification, some of observation was made as follows.- Repeatability of test force of machine A is larger thanone of machine B. During the 30-second loading time, creepof test force on precision balance shows the instability oftest force. This could be the result from friction between thebush and the indenter rod.- Test force verification result of machine B shows goodrepeatability. No creep occurred during calibration indicatesonly slightly friction remaining in the system. However,indenter rod can loosely move horizontally due to gapbetween bearing and indenter rod.3.2 Vibration modelThe hardness testing machine under vibration effectexperiment can be modeled as base excitation problem asshown in figure 2. It is assumed that base is Vickershardness testing machine, which moves as the vibrationinput in (1), and mass m is deadweight and indenter, whichmoves according to base excitation through linear spring, k,parallel with viscous damper, c.X denotes to magnitude of the solution and ϕ is phraseshift of mass oscillation. r is frequency ratio and ξ isdamping ratio. The ratio of maximum response magnitudeto the input displacement magnitude, displacementtransmissibility, is used to describe how motion istransmitted from the base to the mass as a function offrequency ratio, as shown in figure 3.Fig. 3 Displacement transmissibility as a function of frequencyratio of base excitation model.This plot shows that when frequency ratio is 1 (baseexcitation frequency is equal to natural frequency of thesystem), or resonance, the maximum amount of base motionis transferred to displacement of the mass, and themagnitude of displacement of mass depends on dampingratio. However, when damping ratio increase, the maximumdisplacement ratio does not occur at r = 1. Frequency ratiofor maximum displacement ratio was calculated in afunction of damping ratio and plotted in figure 4. The graphshows that when damping ratio increases, resonance occursat frequency ratio lower than 1(base excitation frequency islower than natural frequency). This will be used to explainthe different frequency between machine A and machine B.Fig.2 Base excitation models the motion of deadweight andIndenter weight on the vibration table.y( t)= Y sinω t(1)Where Y represents amplitude of the base motion andω is frequency of base excitation. The solution of x(t) isbsolved and shown in the simple form as in (2).x( t)= X sin( ωb t −ϕ)(2)Where2⎡ 1+(2ξr)⎤X = Y ⎢ 2 22(1 ) (2 )⎥⎣ − r + ξr⎦cb1/ 2r = ωbωn, ξ = , and ω k m2kmn =Fig. 4 Frequency ratio of resonance as a function ofdamping ratio.3.3 Absolute Error by MachinesTo compare absolute error by machine, result of HV1measurement from machine A and machine B-I at 200 HV1and 900 HV1 are illustrated in figure 5(a) and 1(b).Page 146
ORAL SESSI<strong>ON</strong> II : <strong>HARDNESS</strong> <strong>MEASUREMENT</strong>3.3 Absolute Error by Hardness Level(a)Fig. 6 Absolute error in HV1 of machine B-IFig 5. Absolute error in HV1 of machine A and machine B-I for (a)200HV1 and (b) 900 HV1.Overall, both machines responded to vibration in similarway. Error is direct proportional to magnitude of vibrationamplitude. The error peak is highest at one frequency, butboth machines are different in terms of frequency of errorpeak and magnitude of error.- Frequency of error peakMachine A is response to vibration at 20 Hz whileMachine B-I is response at 30 Hz. This could be the resultfrom higher friction in indenter guide slot in machine A thanone in machine B-I, as observations during test forcecalibration. This friction, acting as damping in the system,causes damping ratio to be larger. As shown in figure 4,therefore, the base excitation frequency causing resonanceof machine A is lower than one of machine B-I when bothmachine assumed to have same natural frequency.- Magnitude of errorFriction does not result only in frequency, but also inmagnitude of error. As in figure 3, when damping ratioincreases, the displacement ratio is lower. Thus themagnitude of error of machine A is lower than one ofmachine B-I with the same input.(b)Fig. 7 Absolute error in HV10 of machine B-IIFigure 6 and 7 show error of hardness measurementfrom machine B-I and B-II in terms of absolute error. Errorin HV directly varies to hardness level whereas error ofRockwell scale C varies indirectly as shown in figure 8. Thisinconsistency is discussed as follows.Fig. 8 Absolute error in HRC of Rockwell testing machineTo be comparable, errors in term of indentation depth ofVickers HV10 were calculated and compared with deptherror of Rockwell under vibration amplitude 0.02 and 0.04m/s 2 as illustrated in figure 9.Page 147
TC5 : <strong>HARDNESS</strong>Fig.9 Comparison of error of indentation depth between HV10 andHRCWhereF Test force in Newtons (N)d Mean of diagonal lengths in millimeters (mm)h Indentation depth in millimeters (mm)From (3), Rockwell hardness value is function of depth,so absolute hardness error is in linear correlation withhardness value as same as the depth error. For Vickershardness, on the other hand, HV is inversely proportional tosquare of depth, as in (4). Figure 11 illustrates correlationbetween absolute error of HV10 and HRC and hardnessvalue under vibration acceleration of 0.04 m/s2 at peak oferror and frequency and nearby frequencies.The graph clearly shows that in terms of depth error,indentations of all hardness level of both scale behavedsimilarly under vibration. The lower hardness specimen isless resistant to impact force than the harder specimen, soindentations are deeper. Moreover, it can be found that, atthe frequency of error peak of each scale, relationshipbetween depth error and hardness level is linear of bothscales as in figure 10.Fig.11 Absolute error of HV10 and HRC under vibrationacceleration of 0.04 m/s2 at peak of error and frequency andnearby frequenciesFig.10 Error of indentation depth of HV1, HV10, and HRCmeasurement at the frequency of error peakEven behavior in terms of depth is similar to both scalesas mentioned, behavior in terms of absolute error is differentbecause of the different definition of both hardness scales asin (3) and (4).HRCh= 100 −0.002(3)= f ( −h)3.4 Relative ErrorGraph of absolute error of HV10 in figure 11 shows thatthe slope of graph is high in low hardness level and lower inhigh hardness level, while the slope of HRC is constant.With this characteristic, relative error of HV as (4) behavessimilarly to slope of absolute error graph.HVo136F sin2= 0.1022dF sin= 0.102( h22 tanF sin= 0.10228htan1= f ( )2ho1362o1362o13622 o1362)2(4)Fig.12 Relative error in percentage of HV1 machine B-IPage 148
ORAL SESSI<strong>ON</strong> II : <strong>HARDNESS</strong> <strong>MEASUREMENT</strong>(a)Fig. 13 Relative error in percentage of HV10 machine B-IIRelative error responds to vibration amplitude, testforce, and hardness level. Relative error is directproportional to vibration amplitude and test force, but variesinversely to hardness level. The relative error resultsdisagree with the maximum permissible error (MPE)according to ISO 6507-2, which is set to be indirectproportional to test force and direct proportional to hardnesslevel. From experiment at 200 HV, 600 HV, 900 HV at testforce 1 kgf and 10 kgf, indentations under vibrationamplitude over 0.005 m/s 2 have relative error higher thanpermissible error especially for low hardness level, butindentations under vibration amplitude less than 0.005 m/s 2or g n , all hardness errors of all hardness level and test forcesare under 2%, which is under the limit of maximumpermissible error specified in 6508-2.3.3 Irregular indentationsOne difference between Vickers and Rockwell hardnesstesting is indentation measurement. In Rockwell hardness,indentation depth is measured during the indentationprocess, but in Vickers, diagonal measurement process isdone after indentation process. Thus Vickers hardness userscould be able to inspect the indentations if abnormalityhappens. From the experiment, besides causing indentationlarger, vibration also creates marking inside indentation or atthe end of diagonals. Figure 14 illustrates the comparisonsbetween non-vibration influenced diagonal and influencedone from machine B-I and machine B-II. The marking,especially at the end of diagonal, compounds the difficultyin estimating where the diagonal tip ends, and might createappreciable error in diagonal measurement. However thismarking cannot be observed for all vibration influencedindentations. There are still some indentations exceedingmaximum permissible error that cannot be detected.Indentations with or without effect from vibration ofmachine A are not different as shown in figure 15. Thiscould be the result from different loading mechanismbetween the two machines. Indenter rod of machine B canloosely move horizontally due to gap between bearing andindenter rod; thus causing the marking on indentations ofmachine B.Fig.14 Comparison between indentations with and without effectfrom vibration of machine (a) B-I and (b) B-IIFig. 15 Comparison between indentations with and without effectfrom vibration of machine A4. C<strong>ON</strong>CLUSI<strong>ON</strong>SResult from this experiment confirms that Vickershardness measurement is affected by vibration as inRockwell hardness measurement. Relative errors are directproportional to magnitude of test force and vibrationamplitude for frequency less than 100 Hz, but it is indirectproportional to hardness level. The relative errors are higherthan maximum permissible error in ISO 6507-2 whenvibration amplitude higher than 0.005 m/s2.This paper suggests that maximum allowable vibrationacceleration limit reaching Vickers hardness testing machinein ISO 6507-2 should be lower than 0.0005 g n and the limitin ISO 6507-3 should be revised to include higher test forceor all test force up to 50 kgf.REFERENCES[1] T. Sanponpute, A. Meesaplak, “Vibration Effect onRockwell scale C hardness measurement”, XIX IMEKOWorld Congress, Lisbon, Sept 2009.[2] T. Sanponpute, A. Meesaplak, “Vibration Effect on hardnessmeasurement”, Measurement 43 (2010) 631–636[3] ISO 6507 International Standard of Metallic Material-Vickers Hardness Test, 2005(b)Page 149