Hubble Deep Field Activity - Amazing Space - STScI
Hubble Deep Field Activity - Amazing Space - STScI
Hubble Deep Field Activity - Amazing Space - STScI

You also want an ePaper? Increase the reach of your titles
YUMPU automatically turns print PDFs into web optimized ePapers that Google loves.
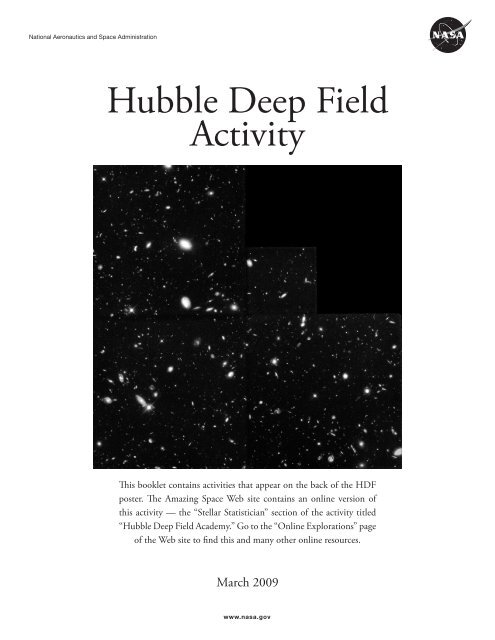
National Aeronautics and <strong>Space</strong> Administration<strong>Hubble</strong> <strong>Deep</strong> <strong>Field</strong><strong>Activity</strong>This booklet contains activities that appear on the back of the HDFposter. The <strong>Amazing</strong> <strong>Space</strong> Web site contains an online version ofthis activity — the “Stellar Statistician” section of the activity titled“<strong>Hubble</strong> <strong>Deep</strong> <strong>Field</strong> Academy.” Go to the “Online Explorations” pageof the Web site to find this and many other online resources.March 2009www.nasa.gov
Science IntroductionWhat is the <strong>Hubble</strong> <strong>Deep</strong> <strong>Field</strong>?The <strong>Hubble</strong> <strong>Deep</strong> <strong>Field</strong> represents a narrow view of the universe, covering a speck of sky. Essentiallya narrow, deep “core sample” of sky, the field is similar to a geologic core sample of the Earth’s crust.Just as a core sample represents a history of the evolution of the Earth’s surface, the <strong>Hubble</strong> <strong>Deep</strong><strong>Field</strong> image contains information about the universe at many different stages in time. Unlike ageologic sample, scientists cannot determine the age of the galaxies because the deep field imagedoes not clearly show their distance from Earth. <strong>Hubble</strong>’s narrow view shows the galaxies stackedagainst one another; scientists must disentangle them to determine their ages.The image was assembled from many separate exposures taken for 10 consecutive days betweenDec. 18 and 28, 1995. Three hundred forty-two exposures were taken using the <strong>Hubble</strong> <strong>Space</strong>Telescope’s Wide <strong>Field</strong> and Planetary Camera 2 (WFPC2); 276 have been fully processed andwere used for this picture.Why do we study it?The <strong>Hubble</strong> <strong>Space</strong> Telescope reached back 10 billion years to capture a view of young, neverbefore-seengalaxies in various stages of evolution. The view shows the dimmest, most distantobjects in the universe. Most are about 4 billion times fainter than can be seen by the human eye.Besides uncovering the classical spiral- and elliptical-shaped galaxies, <strong>Hubble</strong> found a bewilderingassortment of other galaxy shapes and sizes that may yield important clues to the evolution of theuniverse. Some of the galaxies may have formed less than 1 billion years after the Big Bang, theinitial cosmic explosion that many scientists believe jump-started the universe.“Words from the scientist”by Ray Lucas, Astronomer at the <strong>Space</strong> Telescope Science InstituteThe study of the <strong>Hubble</strong> <strong>Deep</strong> <strong>Field</strong> is typical of the work that astronomers face today in attemptingto understand how galaxies have formed and evolved over the history of the universe. When facedwith objects we do not fully understand, we try to classify them based on their observable traits.We first have to see which traits are the most important ones to be measured or counted, andsecond, we have to decide what procedure we will follow in our classification system. Sometimesthe most important characteristics or methods are also the easiest to see, but sometimes nature ismore subtle, and sometimes we find that our ways of studying a problem are unwieldy or somehow2
unsuitable. Sometimes even our fundamental assumptions about a problem are challenged, andwe find that different questions need to be asked.This is an exercise in which students can participate by identifying galaxies’ observable traits touse for classification and then by attempting to identify relationships and patterns among thetraits. Once such patterns and relationships are established, the questions of why they exist andtheir significance can be addressed, and tests can be designed to probe for more answers. Just asscientists find in their own everyday work, students will see that the answers are not always easyor clear and that some amount of interpretation is always required. Perhaps entirely new ways oflooking at data may be required in order to reach plausible answers to questions.This exercise helps students learn about the value of graphically representing data as a means ofidentifying trends, as well as the importance of sharing scientific results with peers. Although thelesson is designed for use in middle school science classes, it is hoped that these exercises will serveas a springboard which helps the student embark on a lifetime of learning in any field of study.After all, even the oldest professional scientist is still a student of nature!•3
<strong>Activity</strong> OverviewIn this activity, students will examine the <strong>Hubble</strong> <strong>Deep</strong> <strong>Field</strong> image and simulate the processastronomers have gone through to count the objects in the image. This is one of four activitiesin the <strong>Amazing</strong> <strong>Space</strong> “Online Exploration” called “<strong>Hubble</strong> <strong>Deep</strong> <strong>Field</strong> Academy,” found at:http://amazing-space.stsci.edu/resources/explorations/hdfFor other resources, follow the links to the <strong>Hubble</strong> <strong>Deep</strong> <strong>Field</strong> Academy Lesson Plan “Grab Bag,”in the “Teaching Tips” section of “<strong>Hubble</strong> <strong>Deep</strong> <strong>Field</strong> Academy.”<strong>Activity</strong> objectivesAfter completing this activity, students will be able to:• Generate questions that can be answered using scientific inquiry• Collect and interpret scientific data• Apply estimation skills to scientific data• Begin to conceptualize the vastness of the universeWarm-up activities• Describe a possible method for estimating the number of objects in the <strong>Hubble</strong> <strong>Deep</strong><strong>Field</strong> image.• Think about and then write down several questions that you would like to have answeredabout the objects on this poster.• Devise different ways to classify the objects in the <strong>Hubble</strong> <strong>Deep</strong> <strong>Field</strong> image.Suggestions for more ways to use the poster• Use the poster as a learning station for small groups of students.• Label objects with post-it notes and ask students to classify them based on color and shape.• Have students guess which objects are close and which are far away. Teachers should point outthat the size of an object in the <strong>Hubble</strong> <strong>Deep</strong> <strong>Field</strong> is not necessarily related to its distance.• Ask students to create their own classification system for the objects in the <strong>Hubble</strong><strong>Deep</strong> <strong>Field</strong>.• Ask students to research the varying colors and shapes of the objects and present theirinformation to the class.4
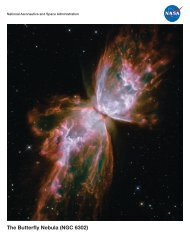
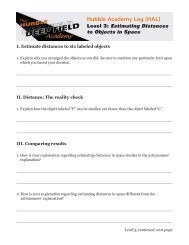
<strong>Hubble</strong> <strong>Deep</strong> <strong>Field</strong> <strong>Activity</strong>How Many Objects Are There?One of the questions astronomers ask is “How many objects are there?” Scientists often have tocome up with rough estimates, which they will later verify with further investigations. Using thisactivity, students can derive their own estimates.1. Ask students to estimate the number of objects in the <strong>Hubble</strong> <strong>Deep</strong> <strong>Field</strong> (shown above) andrecord their estimate on a worksheet.2. Assign each group one camera (“A,” “B,” or “C”) from the <strong>Hubble</strong> <strong>Deep</strong> <strong>Field</strong> to use forrepresentative sampling. Reproducible copies of the three cameras are provided on pages 7, 8, and9. Each student can count a different section of the camera (12 sections in each). Students thencan use this information to calculate a group as well as a class average.5
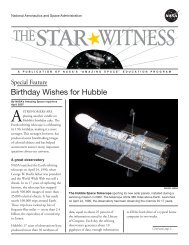
ABPCCWhy is the image chevron-shaped?The Wide <strong>Field</strong> and Planetary Camera 2, used to take the deepfield image, is actually four cameras that look at adjacent pieces ofthe sky. The three wide field cameras are labeled A, B, and C. Theplanetary camera, which provides more detail of a smaller field, islabeled PC. The resulting four separate pictures are combined, liketiles, to create a mosaic. Astronomers prefer to work with reversedimages, such as the black on white camera images provided for thestudent activity, because it makes objects easier to see.3. The teacher should decide whether to use individual, group, or class estimates to do thefollowing three calculations:(Student count fromone section of onecamera field)× 12 = xwhere x = objects in one camera fieldx × 3 = ywhere y = objects in the <strong>Hubble</strong><strong>Deep</strong> <strong>Field</strong>y × 3 × 10 7 = zwhere z = objects in the UniverseNotes:1. It would take about 3 x 10 7 (or, 30 million) WFPC2 images to cover theentire sky.2. For purposes of this activity, the PC has not been factored into thesecalculations.3. To help students comprehend how large a million is, the exercise “WhatDoes a Million Look Like?” is included as part of this activity.6
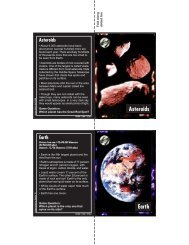
Camera Aa b c12347
Camera Ba b c12348
Camera Ca b c12349
Name:Date:What Does a Million Look Like?When we study the age of the earth, the solar system, and the universe, we are dealing with hugenumbers. The size of these numbers is very hard for people to comprehend. To gain a better ideaof the magnitude of these numbers, we are going to count dots – millions, billions, and trillionsof them.Please read all questions carefully and show any work necessary to calculate your answers. Allquestions refer to the number of dots on the worksheet.1. How many dots are there on the worksheet?2. How many pages would it take to make 1 million (1,000,000) dots?3. How many pages would it take to make 1 billion (1,000,000,000) dots?1 trillion (1,000,000,000,000) dots?4. If 250 stacked pages equals 2.5 centimeters, how many centimeters of paperwould it take to make 1 million dots?To make 1 billion dots?To make 1 trillion dots?5. There are approximately 5 billion people in the world. If each dot representedone person, how many pages would be necessary to show the Earth’s population?6. How many centimeters of dotted paper would represent the populationof the world?How many meters?Compare the height of this stack of papers to a tall office building.If each story equals 3 meters, how tall would the building be?Answers: centimeters; meters; stories10
“What Does a Million Look Like?”WorksheetPlease show all your work.11
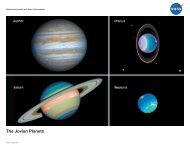
Science BackgroundGalaxies• Galaxies are massive systems made of billions of stars, dust, and gas clouds that are held togetherby gravity.• Stars are massive gaseous bodies that undergo nuclear reactions and emit light.Estimation• Astronomers have long tried to estimate the number of galaxies in the universe.• They use a method called “representative sampling” to obtain their estimate. They divide thesky into sections of equal size and count the number of galaxies in one section. They then multiplythe count from that one section by the total number of sections in the sky.• Astronomers have estimated the number of galaxies in the universe to be between 50 and 100billion.Shape• Astronomers use shape to classify galaxies.• There are three commonly recognized shapes: spiral, elliptical, and irregular.❏ Spiral galaxies have two or more “arms” winding out from a central disk. When viewedfrom the side, spiral galaxies look like fried eggs.❏ Elliptical galaxies appear smooth and featureless, with round or oval shapes, and appearbasically the same when viewed from any angle.❏ Irregular galaxies do not have arms or a uniform appearance. Their stars and gas cloudsare scattered in random patches.• The most difficult part about identifying galaxies by their shape is recognizing them when theirorientation is unknown.Color• Galaxies come in a variety of colors.• As a galaxy ages, its color changes.• Galaxies with young stars would appear blue; galaxies with old stars would appear red.• Galaxies with stars of varying ages may appear to be a combination of colors. For example, agalaxy with some old and young stars may appear to be a combination of blue and red.• The presence of dust in a galaxy can make it appear more red than it actually is.• By studying the light from a galaxy, astronomers can also get information about its chemicalcomposition, its distance from Earth, and the speed at which it is traveling away from us.12
Size/Distance• Determining the distance from Earth for objects in space is a difficult task for astronomers.• The size of a galaxy is not useful because objects that are nearer to Earth can appear small nextto other objects that are extremely large and far away.• Astronomers use the speed at which a galaxy is moving to determine its distance, measured inlight-years.• A light-year is equal to the distance light can travel in a year, approximately 6 trillion miles.http://amazing-space.stsci.edu<strong>STScI</strong> P99-01 NW1999-05-007-GSFC13