Math 146 – Practice Test 4: Chs. 8 & 9
Math 146 – Practice Test 4: Chs. 8 & 9
Math 146 – Practice Test 4: Chs. 8 & 9
You also want an ePaper? Increase the reach of your titles
YUMPU automatically turns print PDFs into web optimized ePapers that Google loves.
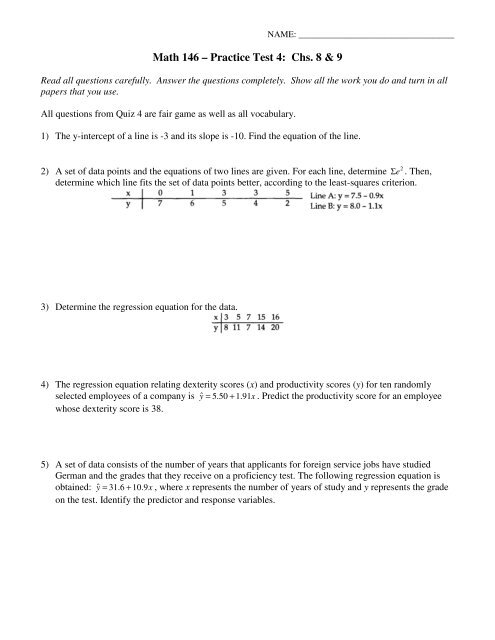
<strong>Math</strong> <strong>146</strong> – <strong>Practice</strong> <strong>Test</strong> 4: <strong>Chs</strong>. 8 & 9NAME: ___________________________________Read all questions carefully. Answer the questions completely. Show all the work you do and turn in allpapers that you use.All questions from Quiz 4 are fair game as well as all vocabulary.1) The y-intercept of a line is -3 and its slope is -10. Find the equation of the line.22) A set of data points and the equations of two lines are given. For each line, determine Σ e . Then,determine which line fits the set of data points better, according to the least-squares criterion.3) Determine the regression equation for the data.4) The regression equation relating dexterity scores (x) and productivity scores (y) for ten randomlyselected employees of a company is yˆ = 5.50 + 1. 91x. Predict the productivity score for an employeewhose dexterity score is 38.5) A set of data consists of the number of years that applicants for foreign service jobs have studiedGerman and the grades that they receive on a proficiency test. The following regression equation isobtained: yˆ = 31.6 + 10. 9x, where x represents the number of years of study and y represents the gradeon the test. Identify the predictor and response variables.
6) The data below consist of heights (x), in meters, and masses (y), in kilograms, of 6 randomly selectedadults. The regression equation is yˆ = −181.342+ 144. 46x. Given a height of 1.75 m, answer thefollowing.a. Find s e . b. Find E. c. Find the prediction interval.7) The regression equation for the data below is yˆ = 3x. Compute the coefficient of determination.8) Obtain the linear correlation coefficient for the data. At the 5% significance level, is there asignificant linear correlation?9) A study was conducted to compare the number of hours spent in the computer lab on an assignment(x) and the grade on the assignment (y), for each of eight randomly selected students in a computerclass. The results are recorded in the table below. Obtain the linear correlation coefficient for the data.
10) a. Create a scatter diagram that shows a perfect positive linear correlation between x and y.How would the scatter diagram change if the correlation showed each of the following? Makesketches.b. a strong positive linear correlation;c. a weak positive linear correlation;d. no linear correlation.


