Subacute Ruminal Acidosis in Dairy Herds - University of Wisconsin ...
Subacute Ruminal Acidosis in Dairy Herds - University of Wisconsin ...
Subacute Ruminal Acidosis in Dairy Herds - University of Wisconsin ...

You also want an ePaper? Increase the reach of your titles
YUMPU automatically turns print PDFs into web optimized ePapers that Google loves.
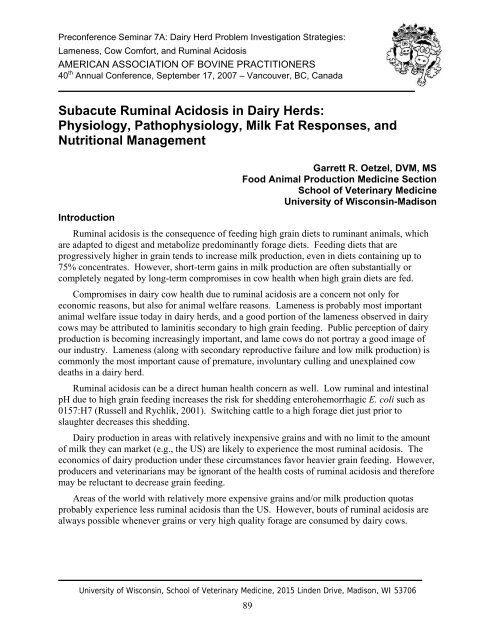
Preconference Sem<strong>in</strong>ar 7A: <strong>Dairy</strong> Herd Problem Investigation Strategies:Lameness, Cow Comfort, and <strong>Rum<strong>in</strong>al</strong> <strong>Acidosis</strong>AMERICAN ASSOCIATION OF BOVINE PRACTITIONERS40 th Annual Conference, September 17, 2007 – Vancouver, BC, Canada<strong>Subacute</strong> <strong>Rum<strong>in</strong>al</strong> <strong>Acidosis</strong> <strong>in</strong> <strong>Dairy</strong> <strong>Herds</strong>:Physiology, Pathophysiology, Milk Fat Responses, andNutritional ManagementIntroductionGarrett R. Oetzel, DVM, MSFood Animal Production Medic<strong>in</strong>e SectionSchool <strong>of</strong> Veter<strong>in</strong>ary Medic<strong>in</strong>e<strong>University</strong> <strong>of</strong> Wiscons<strong>in</strong>-Madison<strong>Rum<strong>in</strong>al</strong> acidosis is the consequence <strong>of</strong> feed<strong>in</strong>g high gra<strong>in</strong> diets to rum<strong>in</strong>ant animals, whichare adapted to digest and metabolize predom<strong>in</strong>antly forage diets. Feed<strong>in</strong>g diets that areprogressively higher <strong>in</strong> gra<strong>in</strong> tends to <strong>in</strong>crease milk production, even <strong>in</strong> diets conta<strong>in</strong><strong>in</strong>g up to75% concentrates. However, short-term ga<strong>in</strong>s <strong>in</strong> milk production are <strong>of</strong>ten substantially orcompletely negated by long-term compromises <strong>in</strong> cow health when high gra<strong>in</strong> diets are fed.Compromises <strong>in</strong> dairy cow health due to rum<strong>in</strong>al acidosis are a concern not only foreconomic reasons, but also for animal welfare reasons. Lameness is probably most importantanimal welfare issue today <strong>in</strong> dairy herds, and a good portion <strong>of</strong> the lameness observed <strong>in</strong> dairycows may be attributed to lam<strong>in</strong>itis secondary to high gra<strong>in</strong> feed<strong>in</strong>g. Public perception <strong>of</strong> dairyproduction is becom<strong>in</strong>g <strong>in</strong>creas<strong>in</strong>gly important, and lame cows do not portray a good image <strong>of</strong>our <strong>in</strong>dustry. Lameness (along with secondary reproductive failure and low milk production) iscommonly the most important cause <strong>of</strong> premature, <strong>in</strong>voluntary cull<strong>in</strong>g and unexpla<strong>in</strong>ed cowdeaths <strong>in</strong> a dairy herd.<strong>Rum<strong>in</strong>al</strong> acidosis can be a direct human health concern as well. Low rum<strong>in</strong>al and <strong>in</strong>test<strong>in</strong>alpH due to high gra<strong>in</strong> feed<strong>in</strong>g <strong>in</strong>creases the risk for shedd<strong>in</strong>g enterohemorrhagic E. coli such as0157:H7 (Russell and Rychlik, 2001). Switch<strong>in</strong>g cattle to a high forage diet just prior toslaughter decreases this shedd<strong>in</strong>g.<strong>Dairy</strong> production <strong>in</strong> areas with relatively <strong>in</strong>expensive gra<strong>in</strong>s and with no limit to the amount<strong>of</strong> milk they can market (e.g., the US) are likely to experience the most rum<strong>in</strong>al acidosis. Theeconomics <strong>of</strong> dairy production under these circumstances favor heavier gra<strong>in</strong> feed<strong>in</strong>g. However,producers and veter<strong>in</strong>arians may be ignorant <strong>of</strong> the health costs <strong>of</strong> rum<strong>in</strong>al acidosis and thereforemay be reluctant to decrease gra<strong>in</strong> feed<strong>in</strong>g.Areas <strong>of</strong> the world with relatively more expensive gra<strong>in</strong>s and/or milk production quotasprobably experience less rum<strong>in</strong>al acidosis than the US. However, bouts <strong>of</strong> rum<strong>in</strong>al acidosis arealways possible whenever gra<strong>in</strong>s or very high quality forage are consumed by dairy cows.<strong>University</strong> <strong>of</strong> Wiscons<strong>in</strong>, School <strong>of</strong> Veter<strong>in</strong>ary Medic<strong>in</strong>e, 2015 L<strong>in</strong>den Drive, Madison, WI 5370689
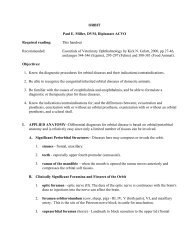
Preconvention Sem<strong>in</strong>ar 7A: <strong>Dairy</strong> Herd Problem Investigation Strategies:Lameness, Cow Comfort, and <strong>Rum<strong>in</strong>al</strong> <strong>Acidosis</strong>Physiology <strong>of</strong> <strong>Rum<strong>in</strong>al</strong> pHFermentable carbohydrate <strong>in</strong>take. <strong>Rum<strong>in</strong>al</strong> pH drops below physiological levels whenrum<strong>in</strong>ants consume excessive amounts <strong>of</strong> rapidly fermentable (non-fiber) carbohydrates. Eachcow’s <strong>in</strong>herent capacity to buffer and absorb acid determ<strong>in</strong>es how much her rum<strong>in</strong>al pH will fallafter a meal conta<strong>in</strong><strong>in</strong>g large amounts <strong>of</strong> fermentable carbohydrates.<strong>Dairy</strong> cattle and beef feedlot cattle are at similar risk to develop rum<strong>in</strong>al acidosis. Althoughdairy cattle are typically fed diets that are higher <strong>in</strong> forage and fiber compared to beef feedlotcattle, this is <strong>of</strong>fset by their much higher dry matter <strong>in</strong>takes. Total consumption <strong>of</strong> non-fibercarbohydrates is similar between these two classes <strong>of</strong> livestock (Table 1). Not surpris<strong>in</strong>gly,rum<strong>in</strong>al pH values measured by cont<strong>in</strong>uous data acquisition <strong>in</strong> feedlot steers and lactat<strong>in</strong>g dairycattle were similar when the cattle consumed similar total amounts <strong>of</strong> non-fiber carbohydrates.The prevalence <strong>of</strong> rum<strong>in</strong>al acidosis <strong>in</strong> dairy herds is probably about the same as it is <strong>in</strong> beeffeedlots.Table 1. A comparison <strong>of</strong> diet and rum<strong>in</strong>al pH <strong>in</strong> beef feedlot and lactat<strong>in</strong>g dairy cow studies.Item Steer study a Lactat<strong>in</strong>g cow study bExperimental animals, weights 8 Holste<strong>in</strong> steers, ~1000 lbs. 8 Holste<strong>in</strong> cows, ~1400 lbs.Stage <strong>of</strong> feed<strong>in</strong>g or lactation Compensatory ga<strong>in</strong> Early lactationStudy design 2 x 2 crossover design 4 x 4 Lat<strong>in</strong> square designAverage daily rum<strong>in</strong>al pH c 5.99 5.90Forage <strong>in</strong> diet, % 26.3 52.9Daily dry matter <strong>in</strong>take, lbs 29.1 47.1Neutral detergent fiber, % 20.0 28.9Non-fiber carbohydrates, d % 58.3 36.9Non-fiber carbohydrates, lbs/day 17.0 17.4a Data adapted from (Prentice et al., 2000).b Data adapted from (Oetzel and Nordlund, 1998).c<strong>Rum<strong>in</strong>al</strong> pH was measured once per m<strong>in</strong>ute by <strong>in</strong>dwell<strong>in</strong>g rum<strong>in</strong>al electrode and averaged daily.d Non-fiber carbohydrates (NFC), calculated as 100 – % crude prote<strong>in</strong> - % neutral detergent fiber - %ether extract - % ash.Total daily <strong>in</strong>take <strong>of</strong> rum<strong>in</strong>ally fermentable carbohydrates depends equally on total drymatter <strong>in</strong>take and the density <strong>of</strong> non-fiber carbohydrates <strong>in</strong> the diet. High <strong>in</strong>takes <strong>in</strong> dairy cattleare associated with lower rum<strong>in</strong>al pH (Figure 1). This suggests that rum<strong>in</strong>al acidosis willbecome an even more common problem as genetic progress and better feed<strong>in</strong>g managementallow cows to eat more.<strong>University</strong> <strong>of</strong> Wiscons<strong>in</strong>, School <strong>of</strong> Veter<strong>in</strong>ary Medic<strong>in</strong>e, 2015 L<strong>in</strong>den Drive, Madison, WI 5370690
Preconvention Sem<strong>in</strong>ar 7A: <strong>Dairy</strong> Herd Problem Investigation Strategies:Lameness, Cow Comfort, and <strong>Rum<strong>in</strong>al</strong> <strong>Acidosis</strong>7.0Daily Mean <strong>Rum<strong>in</strong>al</strong> pH6.56.05.55.0R 2 = .2925 30 35 40 45 50 55 60DM Intake, lb/dayFigure 1. Effect <strong>of</strong> dry matter <strong>in</strong>take on rum<strong>in</strong>al pH <strong>in</strong> early lactation Holste<strong>in</strong> cows.Oetzel, unpublished data, 1997.Cl<strong>in</strong>ical data from our herd <strong>in</strong>vestigations also supports the concept that total dry matter<strong>in</strong>take is a major determ<strong>in</strong>ant <strong>of</strong> rum<strong>in</strong>al pH (Figure 2). With <strong>in</strong>creas<strong>in</strong>g days <strong>in</strong> milk, we haveobserved <strong>in</strong>creas<strong>in</strong>g risk for low rum<strong>in</strong>al pH. This pattern somewhat follows cows’ expectedpattern <strong>of</strong> <strong>in</strong>creas<strong>in</strong>g dry matter <strong>in</strong>take until about the third month <strong>of</strong> lactation.% Cows Tested with RpH139DIM CategoryFigure 2. Risk for low rum<strong>in</strong>al pH (
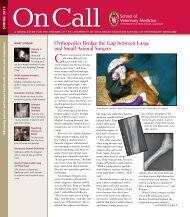
Preconvention Sem<strong>in</strong>ar 7A: <strong>Dairy</strong> Herd Problem Investigation Strategies:Lameness, Cow Comfort, and <strong>Rum<strong>in</strong>al</strong> <strong>Acidosis</strong><strong>Rum<strong>in</strong>al</strong> pH varies considerably dur<strong>in</strong>g the course <strong>of</strong> a day, and is particularly driven by theamount <strong>of</strong> fermentable carbohydrate <strong>in</strong> each meal. Shifts <strong>of</strong> 0.5 to 1.0 pH units with<strong>in</strong> a 24-hourperiod are common. This represents a 5- to 10-fold change <strong>in</strong> hydrogen ion concentration <strong>in</strong> therumen (pH is a log base 10 transformation <strong>of</strong> hydrogen ion concentration). A typical pattern <strong>of</strong>rum<strong>in</strong>al pH variation dur<strong>in</strong>g the day is presented <strong>in</strong> Figure 3.7.006.756.50Meal #1 Meal #2<strong>Rum<strong>in</strong>al</strong> pH6.256.005.755.505.255.006:30AM8:30AM10:30AM12:30PM2:30PM4:30PM6:30PMTime <strong>of</strong> Day8:30PM10:30PM12:30AM2:30AM4:30AM6:30AMFigure 3. Changes <strong>in</strong> rum<strong>in</strong>al pH after feed<strong>in</strong>g; early lactation cow fed TMR twice daily.(Oetzel, unpublished data, 1997).Feed<strong>in</strong>g TMR more frequently (e.g., six times daily) will not necessarily solve the problem<strong>of</strong> post-feed<strong>in</strong>g rum<strong>in</strong>al pH variation. In fact, more frequent feed<strong>in</strong>g will <strong>in</strong>crease dry matter<strong>in</strong>take and can lower rum<strong>in</strong>al pH more than less frequent feed<strong>in</strong>g (Figure 4).The enormous changes <strong>in</strong> rum<strong>in</strong>al pH after eat<strong>in</strong>g make it very difficult to evaluate rum<strong>in</strong>alpH, even <strong>in</strong> research sett<strong>in</strong>gs. Cont<strong>in</strong>uous acquisition <strong>of</strong> rum<strong>in</strong>al pH data by <strong>in</strong>dwell<strong>in</strong>gelectrode provides the most <strong>in</strong>formation possible about post-feed<strong>in</strong>g variations <strong>in</strong> rum<strong>in</strong>al pH.Intake depression. Because rum<strong>in</strong>al acid production from fermentation <strong>of</strong> carbohydratesvaries so much from meal to meal, rum<strong>in</strong>ants possess highly developed systems to ma<strong>in</strong>ta<strong>in</strong>rum<strong>in</strong>al pH with<strong>in</strong> a physiological range <strong>of</strong> about 5.5 to 7.0. As rum<strong>in</strong>al pH beg<strong>in</strong>s to dropfollow<strong>in</strong>g a meal, the rum<strong>in</strong>ant’s first response is to stop eat<strong>in</strong>g. Low rum<strong>in</strong>al pH may also beassociated with <strong>in</strong>creased osmolality <strong>of</strong> the rum<strong>in</strong>al contents, which <strong>in</strong> turn <strong>in</strong>hibits feed <strong>in</strong>take(Carter and Grovum, 1990). Inflammation <strong>of</strong> the rum<strong>in</strong>al epithelium (rumenitis) could also playa role <strong>in</strong> depress<strong>in</strong>g feed <strong>in</strong>take follow<strong>in</strong>g rum<strong>in</strong>al acidosis.<strong>University</strong> <strong>of</strong> Wiscons<strong>in</strong>, School <strong>of</strong> Veter<strong>in</strong>ary Medic<strong>in</strong>e, 2015 L<strong>in</strong>den Drive, Madison, WI 5370692
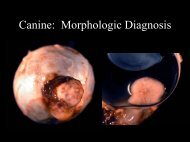
Preconvention Sem<strong>in</strong>ar 7A: <strong>Dairy</strong> Herd Problem Investigation Strategies:Lameness, Cow Comfort, and <strong>Rum<strong>in</strong>al</strong> <strong>Acidosis</strong>production is not triggered by decl<strong>in</strong><strong>in</strong>g rum<strong>in</strong>al pH, but rather is determ<strong>in</strong>ed almost entirely by theamount <strong>of</strong> physical fiber present <strong>in</strong> the diet. Saliva is secreted dur<strong>in</strong>g chew<strong>in</strong>g activity (eat<strong>in</strong>g andrum<strong>in</strong>ation) <strong>in</strong> response to the amount <strong>of</strong> physical fiber present <strong>in</strong> the diet.Acid absorption. The ability <strong>of</strong> the rumen to rapidly absorb organic acids from the rumencontributes greatly to the stability <strong>of</strong> rum<strong>in</strong>al pH. It is rarely difficult for peripheral tissues toutilize VFA already absorbed from the rumen; however, absorption <strong>of</strong> these VFA from therumen can be an important bottleneck.Absorption <strong>of</strong> VFA from the rumen occurs passively across the rum<strong>in</strong>al wall. This passiveabsorption is enhanced by f<strong>in</strong>ger-like papillae that project away from the rumen wall. Thesepapillae provide a huge surface area for VFA absorption. <strong>Rum<strong>in</strong>al</strong> papillae <strong>in</strong>crease <strong>in</strong> lengthwhen cattle fed higher gra<strong>in</strong> diets; this presumably <strong>in</strong>creases the surface area and absorptivecapacity, which protects the animal from acid accumulation <strong>in</strong> the rumen. If the absorptivecapacity <strong>of</strong> these cells is impaired (e.g., chronic rumenitis with fibrosis), then it becomes muchmore difficult for the animal to ma<strong>in</strong>ta<strong>in</strong> a stable rum<strong>in</strong>al pH follow<strong>in</strong>g a meal.Net rum<strong>in</strong>al pH regulation. Mean rum<strong>in</strong>al pH values are not dramatically affected by largedietary changes, but the lowest (nadir) pH values are greatly affected by diet (Table 3). Thisresponse is <strong>in</strong> keep<strong>in</strong>g with the nature <strong>of</strong> regulation <strong>of</strong> rum<strong>in</strong>al pH that has been described above.Cattle are generally able to ma<strong>in</strong>ta<strong>in</strong> rum<strong>in</strong>al pH with<strong>in</strong> physiological limits by their ownregulation <strong>of</strong> <strong>in</strong>take, endogenous buffer production, microbial adaptation, and VFA absorption.However, if the amount <strong>of</strong> fermentable carbohydrate consumed results <strong>in</strong> more acid productionthan the system can accommodate, rum<strong>in</strong>al pH compensation fails and rum<strong>in</strong>al pH dropsdrastically.Table 3. Effect <strong>of</strong> concentrate level <strong>of</strong> feed<strong>in</strong>g on <strong>in</strong>take, milk yield, and production <strong>in</strong>Holste<strong>in</strong> cows (17 daily cannula collections)OutcomeMedium Concentrate (50%) High Concentrate (25%)ADF, % <strong>of</strong> DM 17.4 12.1NDF, % <strong>of</strong> DM 35.4 31.0DM <strong>in</strong>take, lbs/day 44.7 44.2<strong>Rum<strong>in</strong>al</strong> pH, mean 6.28 6.13<strong>Rum<strong>in</strong>al</strong> pH, nadir ~6.1 ~5.6Data adapted from Kennelly et al., 1999.As rum<strong>in</strong>al pH drops below the physiological threshold <strong>of</strong> about 5.5, cattle develop subacuterum<strong>in</strong>al acidosis (SARA). Fortunately, rum<strong>in</strong>al VFA have a pKa <strong>of</strong> about 4.9, which means thatthey are rapidly shift<strong>in</strong>g toward the undissociated (protonated) form at this pH. This removes afree hydrogen ion from the rum<strong>in</strong>al fluid and greatly facilitates their absorption across therum<strong>in</strong>al epithelium, s<strong>in</strong>ce only undissociated acids can be passively absorbed.Lactate production. Unfortunately, ga<strong>in</strong>s <strong>in</strong> VFA absorption at rum<strong>in</strong>al pH below 5.5 can be<strong>of</strong>fset by lactate production. As pH drops, Strep. bovis beg<strong>in</strong>s to ferment glucose to lactate<strong>in</strong>stead <strong>of</strong> VFA. This is a dangerous situation, s<strong>in</strong>ce lactate has a much lower pKa than VFA(3.9 vs. 4.8 - see Figure 5).<strong>University</strong> <strong>of</strong> Wiscons<strong>in</strong>, School <strong>of</strong> Veter<strong>in</strong>ary Medic<strong>in</strong>e, 2015 L<strong>in</strong>den Drive, Madison, WI 5370694
Preconvention Sem<strong>in</strong>ar 7A: <strong>Dairy</strong> Herd Problem Investigation Strategies:Lameness, Cow Comfort, and <strong>Rum<strong>in</strong>al</strong> <strong>Acidosis</strong>g100%Dissociated VFA, %75%50%MORE [HA]:- Undissociated(Associated)- Protonated- Uncharged- Non-Ionized- Bound- Conjugate Acid(H + donor)"Acetic Acid" formRapidly Absorbed(diffuses acrossrum<strong>in</strong>al epithelium)LactatepKa = 3.9VFApKa = 4.8MORE [A - ] + [H + ]:- Dissociated- Unprotonated- Charged- Ionized (Anionic)- Free- Conjugate Base(H + acceptor)"Acetate" formSlowly Absorbed(wait<strong>in</strong>g to be protonated,some active absorption?)25%0%1.0 2.0 3.0 4.0 5.0 6.0 7.0 8.0Figure 5. Titration curves for VFA and lactate.<strong>Rum<strong>in</strong>al</strong> pHAt a rum<strong>in</strong>al pH <strong>of</strong> 5.0 lactate is 5.2 times less dissociated than VFA. As a result, the lactatestays <strong>in</strong> the rumen and contributes to the downward spiral <strong>in</strong> rum<strong>in</strong>al pH. Fiber-digest<strong>in</strong>gbacteria are severely <strong>in</strong>hibited as pH decl<strong>in</strong>es. Pure lactate producers such as Lactobacillus maybeg<strong>in</strong> to proliferate at these lower pHs.Additional adaptive responses are <strong>in</strong>voked when rum<strong>in</strong>al pH drops below 5.5 and lactateproduction beg<strong>in</strong>s. Lactate-utiliz<strong>in</strong>g bacteria, such as Megasphaera elsdenii and Selenomonasrum<strong>in</strong>antium beg<strong>in</strong> to proliferate. These beneficial bacteria convert lactate to other VFA, whichare then easily protonated and absorbed. However, the turnover time <strong>of</strong> lactate utilizers is muchslower than for Strep. bovis. Thus, this mechanism may not be <strong>in</strong>voked quickly enough to fullystabilize rum<strong>in</strong>al pH. Periods <strong>of</strong> very high rum<strong>in</strong>al pH, as dur<strong>in</strong>g feed deprivation, may <strong>in</strong>hibitpopulations <strong>of</strong> lactate utilizers (which are sensitive to higher rum<strong>in</strong>al pH) and leave them moresusceptible to severe rum<strong>in</strong>al acidosis. Other aspects <strong>of</strong> this delicate rum<strong>in</strong>al microbial balancemay be disrupted when rum<strong>in</strong>ants are deprived <strong>of</strong> feed for a time.Besides disrupt<strong>in</strong>g microbial balance, feed deprivation causes cattle to overeat when feed isre-<strong>in</strong>troduced. This creates a double effect <strong>in</strong> lower<strong>in</strong>g rum<strong>in</strong>al pH. As a result, cycles <strong>of</strong> feeddeprivation and re-feed<strong>in</strong>g are more important risk factors for SARA than is diet formulationitself. An example <strong>of</strong> rum<strong>in</strong>al pH follow<strong>in</strong>g a period <strong>of</strong> feed deprivation and re-feed<strong>in</strong>g ispresented <strong>in</strong> Figure 6.<strong>University</strong> <strong>of</strong> Wiscons<strong>in</strong>, School <strong>of</strong> Veter<strong>in</strong>ary Medic<strong>in</strong>e, 2015 L<strong>in</strong>den Drive, Madison, WI 5370695
Preconvention Sem<strong>in</strong>ar 7A: <strong>Dairy</strong> Herd Problem Investigation Strategies:Lameness, Cow Comfort, and <strong>Rum<strong>in</strong>al</strong> <strong>Acidosis</strong>(Holste<strong>in</strong> steer)8.07.57.0Feed and waterre-<strong>in</strong>troduced<strong>Rum<strong>in</strong>al</strong> pH6.56.05.55.0Accidentallylocked away fromfeed and water4.5-12 -6 0 6 12 18 24 30 36 42 48 54 60 66 72 78 84Time from Onset, HoursFigure 6. <strong>Rum<strong>in</strong>al</strong> pH after feed deprivation <strong>in</strong> a Holste<strong>in</strong> steer. Unpublished data, PrenticeSchaefer, and Oetzel, 2000.Low rum<strong>in</strong>al pH dur<strong>in</strong>g SARA reduces the number <strong>of</strong> species <strong>of</strong> bacteria <strong>in</strong> the rumen,although the metabolic activity <strong>of</strong> the bacteria that rema<strong>in</strong> is very high (Garry, 1996). Protozoalpopulations are also limited as rum<strong>in</strong>al pH approaches 5.0. When fewer species <strong>of</strong> bacteria andprotozoa are present, the rum<strong>in</strong>al micr<strong>of</strong>lora are less stable and less able to ma<strong>in</strong>ta<strong>in</strong> normalrum<strong>in</strong>al pH dur<strong>in</strong>g periods <strong>of</strong> sudden dietary changes (Garry, 1996). Thus, pre-exist<strong>in</strong>g SARAcould <strong>in</strong>crease the risk for acute rum<strong>in</strong>al acidosis <strong>in</strong> the event <strong>of</strong> accidental <strong>in</strong>gestion <strong>of</strong> excessiveamounts <strong>of</strong> gra<strong>in</strong>.<strong>Rum<strong>in</strong>al</strong> atony. Additional drops <strong>in</strong> rum<strong>in</strong>al pH may result <strong>in</strong> complete rum<strong>in</strong>al atony. Thisresponse decreases absorption <strong>of</strong> acids by keep<strong>in</strong>g them away from the rum<strong>in</strong>al wall. In essence,the animal now senses that systemic acid-base balance is be<strong>in</strong>g jeopardized by the absorption <strong>of</strong>lactic acid, so it seeks to preserve the whole animal at the expense <strong>of</strong> the rumen. <strong>Rum<strong>in</strong>al</strong> pHwill drop even faster now - to 5.0 or below. At this po<strong>in</strong>t, the animal is <strong>in</strong> acute rum<strong>in</strong>al acidosis,which can be life-threaten<strong>in</strong>g. The cow is “bett<strong>in</strong>g her life” that the rumen will run out <strong>of</strong> itssupply <strong>of</strong> fermentable carbohydrates before death occurs. This may or may not be true,depend<strong>in</strong>g on the load <strong>of</strong> carbohydrates consumed before she received the signal to stop eat<strong>in</strong>g.Pathophysiology <strong>of</strong> <strong>Rum<strong>in</strong>al</strong> <strong>Acidosis</strong> <strong>in</strong> <strong>Dairy</strong> CattleThe rum<strong>in</strong>al epithelial cells are not protected by mucus (as abomasal cells are), so they arevulnerable to the chemical damage by acids. Thus, low rum<strong>in</strong>al pH leads to rumenitis, erosion,and ulceration <strong>of</strong> the rum<strong>in</strong>al epithelium. Rumenitis is the fundamental lesion <strong>of</strong> SARA, and itleads to chronic health problems. In contrast, systemic acidemia is the fundamental lesion <strong>of</strong>acute rum<strong>in</strong>al acidosis, and acute death is its ma<strong>in</strong> health risk.Cl<strong>in</strong>ical signs from the health effects <strong>of</strong> SARA are delayed <strong>in</strong> onset from the time <strong>of</strong> the lowrum<strong>in</strong>al pH <strong>in</strong>sult. These signs are the result <strong>of</strong> a pathophysiological cascade <strong>of</strong> events thatbeg<strong>in</strong>s with rumenitis. Once the rum<strong>in</strong>al epithelium is <strong>in</strong>flamed, bacteria may colonize the<strong>University</strong> <strong>of</strong> Wiscons<strong>in</strong>, School <strong>of</strong> Veter<strong>in</strong>ary Medic<strong>in</strong>e, 2015 L<strong>in</strong>den Drive, Madison, WI 5370696
Preconvention Sem<strong>in</strong>ar 7A: <strong>Dairy</strong> Herd Problem Investigation Strategies:Lameness, Cow Comfort, and <strong>Rum<strong>in</strong>al</strong> <strong>Acidosis</strong>papillae and leak <strong>in</strong>to portal circulation. These bacteria may cause liver abscesses, whichsometimes cause peritonitis around the site <strong>of</strong> the abscess. If the rum<strong>in</strong>al bacteria clear the liver(or if bacteria from liver <strong>in</strong>fections are released <strong>in</strong>to circulation), they may colonize the lungs,heart valves, kidneys, or jo<strong>in</strong>ts. The result<strong>in</strong>g pneumonia, endocarditis, pyelonephritis, andarthritis are all chronic <strong>in</strong>flammatory diseases that are difficult to diagnose ante-mortem. Postmortemmonitor<strong>in</strong>g <strong>of</strong> these conditions <strong>in</strong> cull cows or cows that die on the dairy could be verybeneficial, but has not been described.There are few research reports that directly attribute specific health problems with lowrum<strong>in</strong>al pH. In one study, we were able to document a rise <strong>in</strong> serum haptoglob<strong>in</strong>s (acute-phase<strong>in</strong>flammatory prote<strong>in</strong>s) and an <strong>in</strong>crease <strong>in</strong> the prevalence <strong>of</strong> rum<strong>in</strong>al biopsy samples withhistological evidence <strong>of</strong> rumenitis when Holste<strong>in</strong> steers were fed to a low target rum<strong>in</strong>al pH(Table 4).Table 4. Effect <strong>of</strong> target rum<strong>in</strong>al pH on serum haptoglob<strong>in</strong> concentrationsand rum<strong>in</strong>al biopsy results <strong>in</strong> Holste<strong>in</strong> steers.OutcomeHaptoglob<strong>in</strong>, mg/dl,meanHaptoglob<strong>in</strong>, % > 20mg/dlBiopsies, % withrumenitisExperiment 1Target pH = 6.0Experiment 2Target pH = 5.516.7 25.811.5 22.537.5 87.5Data adapted from Prentice et al., 2000.Caudal vena cava syndrome can cause hemoptysis and peracute deaths due to massivepulmonary hemorrhage <strong>in</strong> cows that are affected with SARA (Nordlund et al., 1995). In thesecases, septic emboli from liver abscesses lead to lung <strong>in</strong>fections which ultimately <strong>in</strong>vadepulmonary vessels and cause their rupture (Radostits et al., 1994; Rebhun, 1995).SARA may also be associated with lam<strong>in</strong>itis and subsequent ho<strong>of</strong> overgrowth, soleabscesses, and sole ulcers. These foot problems generally do not appear until weeks or monthsafter the bout <strong>of</strong> rum<strong>in</strong>al acidosis that caused them. The mechanism by which SARA <strong>in</strong>creasesthe risk for lam<strong>in</strong>itis has not been characterized. New <strong>in</strong>formation from equ<strong>in</strong>e studies suggeststhat metalloprote<strong>in</strong>ase enzymes produced by Strep. bovis <strong>in</strong> the h<strong>in</strong>dgut may be the <strong>in</strong>cit<strong>in</strong>gcause for lam<strong>in</strong>itis (Pollitt, 1999). If these enzymes are <strong>in</strong>deed the culprits <strong>in</strong> dairy cattlelam<strong>in</strong>itis, then they may be <strong>of</strong> h<strong>in</strong>dgut orig<strong>in</strong> as well. This hypothesis has not been tested <strong>in</strong>cattle, but some research data support the general concept that lam<strong>in</strong>itis is the result <strong>of</strong> abnormalh<strong>in</strong>dgut fermentation <strong>of</strong> carbohydrates <strong>in</strong>stead <strong>of</strong> rum<strong>in</strong>al acidosis per se.Effect <strong>of</strong> SARA on Milk Fat PercentageThe relationship between SARA and milk fat depression is <strong>in</strong>consistent and complex.Sometimes veter<strong>in</strong>ary practitioners pursue milk fat test depression problems that are <strong>in</strong> fact notproblems at all. It is surpris<strong>in</strong>gly difficult, at times, to determ<strong>in</strong>e if a herd really has a low milkfat test or not. Normal milk fat percentage depends greatly on breed, season, and days <strong>in</strong> milk.<strong>University</strong> <strong>of</strong> Wiscons<strong>in</strong>, School <strong>of</strong> Veter<strong>in</strong>ary Medic<strong>in</strong>e, 2015 L<strong>in</strong>den Drive, Madison, WI 5370697
Preconvention Sem<strong>in</strong>ar 7A: <strong>Dairy</strong> Herd Problem Investigation Strategies:Lameness, Cow Comfort, and <strong>Rum<strong>in</strong>al</strong> <strong>Acidosis</strong>Nutritional causes <strong>of</strong> milk fat depression (which may <strong>in</strong>clude SARA) only become a concernwhen these three major factors have already been taken <strong>in</strong>to account.The expected effect <strong>of</strong> season on milk fat percentage is presented <strong>in</strong> Figure 7. Milk fat test isnormally about .25% lower <strong>in</strong> the summer than <strong>in</strong> the fall months. This effect is not completelyunderstood, but could be mediated by <strong>in</strong>creased risk for SARA. Cows are apparently at higherrisk for SARA <strong>in</strong> the summer due to lack <strong>of</strong> rum<strong>in</strong>al buffer<strong>in</strong>g caused by heat stress, <strong>in</strong>creasedrespiratory rate, respiratory alkalosis, and low blood bicarbonate concentrations. Other causes <strong>of</strong><strong>in</strong>creased SARA <strong>in</strong> the summer months could <strong>in</strong>clude atypical meal patterns <strong>in</strong> response to heatavoidance and ration formulation errors made when nutritionists attempt to compensate forreduced dry matter <strong>in</strong>take dur<strong>in</strong>g heat stress by decreas<strong>in</strong>g dietary fiber. This only makes cowperformance and milk fat test worse.4.0Seasonal Effect on Milk Yield and Components1.2 M Holste<strong>in</strong> cows <strong>in</strong> 10,980 herds66Milk Fat or Prote<strong>in</strong>, %3.83.63.43.2646260Milk, lbs3.0Jan Feb Mar April May June July Aug Sept Oct Nov DecMonthMilk fat, % Milk prote<strong>in</strong>, % Milk, lbs58Figure 7. Milk yield, milk fat percentage, and milk prote<strong>in</strong> percentage by month forHolste<strong>in</strong> cows. Data adapted from Hutjens, Hoards <strong>Dairy</strong>man 144(12):494, 1999.Breed also has a pr<strong>of</strong>ound effect on milk fat percentage. Normal milk fat percentage forHolste<strong>in</strong> herds is between about 3.4 and 4.0%. Ayrshire and Milk<strong>in</strong>g Shorthorn herds have aboutthe same milk fat percentage. Jersey cows have normal milk fat tests between about 4.2 and5.0%. They exhibit the same seasonality <strong>of</strong> milk fat percentage as Holste<strong>in</strong>s do. Normal milk fatpercentage for Brown Swiss herds is between about 3.6 and 4.2%; and for Guernsey herds isbetween 4.0 and 4.8%.Milk fat depression is broadly def<strong>in</strong>ed as milk fat test below 3.2% <strong>in</strong> Holste<strong>in</strong>, Ayrshire, andMilk<strong>in</strong>g Shorthorn herds, below 3.4% for Brown Swiss herds, below 4.0% for Guernsey herds,and below 4.2% <strong>in</strong> Jersey herds. However, these def<strong>in</strong>itions are really cl<strong>in</strong>ical impressions thatare not based on rigorous epidemiological research.<strong>University</strong> <strong>of</strong> Wiscons<strong>in</strong>, School <strong>of</strong> Veter<strong>in</strong>ary Medic<strong>in</strong>e, 2015 L<strong>in</strong>den Drive, Madison, WI 5370698
Preconvention Sem<strong>in</strong>ar 7A: <strong>Dairy</strong> Herd Problem Investigation Strategies:Lameness, Cow Comfort, and <strong>Rum<strong>in</strong>al</strong> <strong>Acidosis</strong>Milk fat depression cannot be def<strong>in</strong>ed without first know<strong>in</strong>g the days <strong>in</strong> milk <strong>of</strong> the cowsbe<strong>in</strong>g evaluated. <strong>Herds</strong> typically do not have a wide variation <strong>in</strong> days <strong>in</strong> milk (unless they areseasonally calv<strong>in</strong>g). However, <strong>in</strong>dividual cows can have quite variable milk fat percentage dueto days <strong>in</strong> milk alone. Days <strong>in</strong> milk can account for changes <strong>in</strong> milk fat percentage up to about.75% (see Figure 8).4.2Effect <strong>of</strong> Days <strong>in</strong> Milk on Milk Fat Test; Holste<strong>in</strong> <strong>Herds</strong>4.0Milk Fat Test, %3.83.63.43.21 2 3 4 5 6 7 8 9 10DHI Test NumberFigure 8. Average milk fat percentage by DHI test number.Laboratory methods for milk fat test<strong>in</strong>g are notoriously fallible. Most milk is tested for fatcontent by near <strong>in</strong>frared reflectance spectroscopy (NIRS). This test performs well compared towet chemistry procedures (e.g., the Babcock test) when milk fat percentage is <strong>in</strong> the middlerange. Thus, NIRS works well for bulk tank samples. However, it is not as accurate for veryhigh or very low milk fat percentage <strong>in</strong> <strong>in</strong>dividual cows. It also may be affected by somatic cellcount or other changes <strong>in</strong> milk properties.Milk fat (the cream) rises to the top <strong>of</strong> a milk sample that has not been agitated orhomogenized. This can cause error <strong>in</strong> any type <strong>of</strong> milk fat sampl<strong>in</strong>g. Bulk tanks must beagitated before sampl<strong>in</strong>g for milk fat percentage. And <strong>in</strong>dividual cow samples must be shakenbefore test<strong>in</strong>g <strong>in</strong> the lab.Bulk tanks can be agitated too vigorously, which results butter formation with<strong>in</strong> the tank.This could artificially lower milk fat percentage.Milk fat percentage also varies dramatically from the start to the end <strong>of</strong> milkout. Thus, milksamples from <strong>in</strong>dividual cows must be collected with a proportion<strong>in</strong>g device that meters out arepresentative portion <strong>of</strong> the entire milk<strong>in</strong>g. Strip samples from cows have no value whatsoeverfor milk fat test<strong>in</strong>g.<strong>University</strong> <strong>of</strong> Wiscons<strong>in</strong>, School <strong>of</strong> Veter<strong>in</strong>ary Medic<strong>in</strong>e, 2015 L<strong>in</strong>den Drive, Madison, WI 5370699
Preconvention Sem<strong>in</strong>ar 7A: <strong>Dairy</strong> Herd Problem Investigation Strategies:Lameness, Cow Comfort, and <strong>Rum<strong>in</strong>al</strong> <strong>Acidosis</strong>DHI milk fat tests for the entire herd are determ<strong>in</strong>ed by test<strong>in</strong>g the milk fat percentage andmilk volume from each cow. This is usually done for just one daily milk<strong>in</strong>g, and only once amonth. The milk fat test for the herd is then calculated by a weighted average <strong>of</strong> the milk fat andmilk volume contribution from each cow. Milk fat percentages are adjusted for AM or PMmilk<strong>in</strong>gs, s<strong>in</strong>ce the AM milk<strong>in</strong>g typically has higher volume and lower milk fat percentage.However, these corrections are estimates only, and become even less accurate when cows aremilked more than twice daily. DHI milk fat test results are useful for look<strong>in</strong>g at trends by days<strong>in</strong> milk and for variation <strong>in</strong> milk fat test. But they are not a particularly accurate measure <strong>of</strong>whole herd milk fat percentage. The milk fat test from the bulk tank is a much more accurate<strong>in</strong>dication <strong>of</strong> whole herd milk fat percentage. Bulk tank milk fat percentages are also availableon a daily or every other day basis. In contrast, DHI milk fat percentages usually represent onlyone milk<strong>in</strong>g per month.Milk fat tests are typically <strong>in</strong>terpreted as group or herd means. This is generally appropriateand is certa<strong>in</strong>ly convenient. However, group means may obscure outlier cows with very high orvery low fat tests. And cyclic milk fat depression could be completely missed if <strong>in</strong>dividual cowswith<strong>in</strong> a group have milk fat depression at different and <strong>of</strong>fsett<strong>in</strong>g times. Thus, it can be helpfulto <strong>in</strong>terpret milk fat percentages as a proportion <strong>of</strong> cows with very high or very low test results.Very low milk fat tests (milk fat percentage) is a better reflection <strong>of</strong> milk fat depression than the milk fat percentagealone. This concept is not supported by science. Milk fat synthesis and milk prote<strong>in</strong> synthesisare separate physiologic processes. Interpret<strong>in</strong>g one only <strong>in</strong> light <strong>of</strong> the other most likely<strong>in</strong>troduces even more error <strong>in</strong>to the diagnosis <strong>of</strong> milk fat depression. It is <strong>in</strong>terest<strong>in</strong>g to note thatthe <strong>in</strong>terpretation <strong>of</strong> milk fat: prote<strong>in</strong> ratios did not appear to change after the basis for milkprote<strong>in</strong> report<strong>in</strong>g was changed from crude prote<strong>in</strong> to true prote<strong>in</strong> <strong>in</strong> early 2000 <strong>in</strong> the US. I donot recommend attempt<strong>in</strong>g to <strong>in</strong>terpret milk fat: prote<strong>in</strong> ratios when <strong>in</strong>vestigat<strong>in</strong>g milk fatdepression problems.Milk fat to milk prote<strong>in</strong> ratios may have value <strong>in</strong> support<strong>in</strong>g a diagnosis <strong>of</strong> subcl<strong>in</strong>ical ketosis<strong>in</strong> early lactation cows (as previously discussed <strong>in</strong> the ketosis proceed<strong>in</strong>gs paper). This is truebecause subcl<strong>in</strong>ical ketosis causes both an <strong>in</strong>crease <strong>in</strong> milk fat percentage and a decrease <strong>in</strong> milkprote<strong>in</strong> percentage. However, keep <strong>in</strong> m<strong>in</strong>d that this is a completely different cl<strong>in</strong>ical issue thandiagnos<strong>in</strong>g milk fat depression.If a diagnosis <strong>of</strong> milk fat depression is clearly made <strong>in</strong> a dairy herd, then the cl<strong>in</strong>ician hasthree major causes to rule out –over-feed<strong>in</strong>g unsaturated fats, monens<strong>in</strong> feed<strong>in</strong>g, and rum<strong>in</strong>alacidosis. All three causes share the same end pathway – the absorption <strong>of</strong> excessive amounts <strong>of</strong>certa<strong>in</strong> trans fatty acids from the small <strong>in</strong>test<strong>in</strong>e.Excessive <strong>in</strong>take <strong>of</strong> unsaturated fats is the most predictable and repeatable <strong>of</strong> all the causes <strong>of</strong>milk fat depression. Unsaturated fats cause milk fat depression when they are transformed andthen <strong>in</strong>completely biohydrogenated <strong>in</strong> the rumen. Some <strong>of</strong> the <strong>in</strong>termediate forms <strong>of</strong> these fattyacids (particularly trans 18:1 fatty acids) are then absorbed at the small <strong>in</strong>test<strong>in</strong>e and taken up by<strong>University</strong> <strong>of</strong> Wiscons<strong>in</strong>, School <strong>of</strong> Veter<strong>in</strong>ary Medic<strong>in</strong>e, 2015 L<strong>in</strong>den Drive, Madison, WI 53706100
Preconvention Sem<strong>in</strong>ar 7A: <strong>Dairy</strong> Herd Problem Investigation Strategies:Lameness, Cow Comfort, and <strong>Rum<strong>in</strong>al</strong> <strong>Acidosis</strong>the mammary gland (Figures 9 and 10). There they strongly <strong>in</strong>hibit milk fat synthesis, even atvery low doses (5 grams or less per day).Fat Digestion <strong>in</strong> the Rumen: Plant Source FatsPlant Fats -Mostly TriglyceridesGlycerol backbone3 fatty acids (C16, C18, etc.)Unsaturated fatty acidsBiohydrogenationHydrolysisMicrobial toxicity!Absorbed at small <strong>in</strong>test<strong>in</strong>eMilk fat (saturated fatty acids)No milk fat depressionFigure 9. Normal digestion <strong>of</strong> plant source fats <strong>in</strong> the rumen.Fat Digestion <strong>in</strong> the Rumen: Plant Source FatsPlant Fats -Mostly TriglyceridesExcessiveGlycerol backbone3 fatty acids (C16, C18, etc.)Unsaturated fatty acidsIncompleteBiohydrogenationHydrolysisMicrobial toxicitytrans fatty acidsMilk fatdepressionAbsorbed at small <strong>in</strong>test<strong>in</strong>eMilk fat (saturated fatty acids)Figure 10. Milk fat depression follow<strong>in</strong>g <strong>in</strong>take <strong>of</strong> excessive amounts <strong>of</strong> unsaturated plant fats.<strong>University</strong> <strong>of</strong> Wiscons<strong>in</strong>, School <strong>of</strong> Veter<strong>in</strong>ary Medic<strong>in</strong>e, 2015 L<strong>in</strong>den Drive, Madison, WI 53706101
Preconvention Sem<strong>in</strong>ar 7A: <strong>Dairy</strong> Herd Problem Investigation Strategies:Lameness, Cow Comfort, and <strong>Rum<strong>in</strong>al</strong> <strong>Acidosis</strong>The degree <strong>of</strong> escape <strong>of</strong> trans fatty acids from the rumen depends largely on the amounts <strong>of</strong>their unsaturated fat precursors (18:2 and 18:3 fatty acids) are present <strong>in</strong> the diet. High rates <strong>of</strong>passage also contribute to more escape <strong>of</strong> these fatty acids to the rumen. These fatty acids do nothave detrimental health effects themselves; thus, it is possible for a herd to have milk fatdepression without cow health problems.The potential for plant source fats to cause milk fat depression depends on both their content<strong>of</strong> unsaturated fatty acids (see Table 5) and on their rate <strong>of</strong> release <strong>in</strong> the rumen. Slowly releasedplant fat sources such as whole cottonseeds present much less risk for milk fat depression than dorapidly released plant fat sources such as wet distillers gra<strong>in</strong>s.Table 5. Typical Fatty Acid Analysis <strong>of</strong> Fats and OilsFatty Acid Corn Cottonseed Lard Canola Soybean TallowC14-1 (Myristic) 1.0 1.5 3.0C16 (Palmitic) 12.5 26.0 27.0 4.0 11.5 25.0C16-1 (Palmitoleic) 1.0 3.0 2.5C17 (Margaric) .5 1.5C18 (Stearic) 2.5 3.0 13.5 2.0 4.0 21.5C18-1 (Oleic) 29.0 17.5 43.4 60.0 24.5 42.0C18-2 (L<strong>in</strong>oleic) 55.0 51.5 10.5 20.0 53.0 3.0C18-3 (L<strong>in</strong>olenic) .5 .5 10.0 7.0C20 and over 4.0Unsat/Sat Ratio 5.7 2.2 1.4 15.7 5.5 1.0Animal source fats or rum<strong>in</strong>al by-pass fats pose little risk for <strong>in</strong>complete biohydrogenationand milk fat depression (Figure 11). Rather, the risk with these fats can be reduced total tractdigestibility as they by-pass not only the rumen, but the entire digestive tract as well.Monens<strong>in</strong> supplementation may contribute to milk fat depression. Supplement<strong>in</strong>g monens<strong>in</strong>on the high end <strong>of</strong> the dosage range (16 to 24 ppm – the same as 15 to 22 grams per ton)depresses milk fat percentage about .1 to .2%. The degree <strong>of</strong> depression may wane as themonens<strong>in</strong> if fed for a longer time period. Monens<strong>in</strong> feed<strong>in</strong>g appears to <strong>in</strong>teract with excessivefeed<strong>in</strong>g <strong>of</strong> unsaturated fats and rum<strong>in</strong>al acidosis to cause milk fat depression. Interest<strong>in</strong>gly,monens<strong>in</strong> helps prevent rum<strong>in</strong>al acidosis (probably by <strong>in</strong>hibit<strong>in</strong>g lactate producers and favor<strong>in</strong>glactate utilizers), yet still has the overall effect <strong>of</strong> reduc<strong>in</strong>g milk fat percentage. If a herdexperiences noticeable milk fat depression soon after start<strong>in</strong>g to feed monens<strong>in</strong>, it is better to<strong>in</strong>vestigate and correct other causes <strong>of</strong> the milk fat depression rather than to automaticallyremove the monens<strong>in</strong> from the diet.<strong>University</strong> <strong>of</strong> Wiscons<strong>in</strong>, School <strong>of</strong> Veter<strong>in</strong>ary Medic<strong>in</strong>e, 2015 L<strong>in</strong>den Drive, Madison, WI 53706102
PartialHydrolysisPreconvention Sem<strong>in</strong>ar 7A: <strong>Dairy</strong> Herd Problem Investigation Strategies:Lameness, Cow Comfort, and <strong>Rum<strong>in</strong>al</strong> <strong>Acidosis</strong>Fat Digestion <strong>in</strong> the Rumen: Animal Source FatsAnimal Fats -Mostly TriglyceridesGlycerol backbone3 fatty acids (C16, C18, etc.)Saturated / Unsaturated fatty acidsBiohydrogenationLittle microbial toxicityMilk fat (saturated fatty acids)No milk fat depressionFatty acids -Absorbed at small <strong>in</strong>test<strong>in</strong>eFigure 11. Digestion <strong>of</strong> animal fats <strong>in</strong> the rumen.<strong>Rum<strong>in</strong>al</strong> acidosis is the third major rule-out as a cause for milk fat depression. <strong>Rum<strong>in</strong>al</strong>acidosis does not depress milk fat percentage by reduc<strong>in</strong>g the proportion <strong>of</strong> propionate absorbedfrom the rumen, as was previously thought. Rather, it apparently causes milk fat depression by<strong>in</strong>hibit<strong>in</strong>g bacteria responsible for fatty acid biohydrogenation <strong>in</strong> the rumen. Thus, more transfatty acids are absorbed, even if the <strong>in</strong>take <strong>of</strong> unsaturated fatty acids was not necessarily high.Cl<strong>in</strong>ical evidence suggests that the l<strong>in</strong>k between rum<strong>in</strong>al pH and milk fat depression is weak.Many herds with substantially depressed rum<strong>in</strong>al pH have no milk fat depression at all (Figure12). This suggests that low rum<strong>in</strong>al pH probably has to <strong>in</strong>teract with some aspect <strong>of</strong> dietary fatfeed<strong>in</strong>g or time before milk fat depression occurs.<strong>University</strong> <strong>of</strong> Wiscons<strong>in</strong>, School <strong>of</strong> Veter<strong>in</strong>ary Medic<strong>in</strong>e, 2015 L<strong>in</strong>den Drive, Madison, WI 53706103
Preconvention Sem<strong>in</strong>ar 7A: <strong>Dairy</strong> Herd Problem Investigation Strategies:Lameness, Cow Comfort, and <strong>Rum<strong>in</strong>al</strong> <strong>Acidosis</strong>70%Herd Milk Fat Test vs. % <strong>Rum<strong>in</strong>al</strong> pH
Preconvention Sem<strong>in</strong>ar 7A: <strong>Dairy</strong> Herd Problem Investigation Strategies:Lameness, Cow Comfort, and <strong>Rum<strong>in</strong>al</strong> <strong>Acidosis</strong>Milk fat test data has the potential to give us some <strong>in</strong>formation about whether we are overfeed<strong>in</strong>ggra<strong>in</strong> (and caus<strong>in</strong>g rum<strong>in</strong>al acidosis with subsequent health problems) or are underfeed<strong>in</strong>ggra<strong>in</strong> and los<strong>in</strong>g pr<strong>of</strong>it. Unfortunately, the <strong>in</strong>ference on rum<strong>in</strong>al pH provided by milk fattest is too <strong>of</strong>ten <strong>in</strong>accurate and <strong>in</strong>fluenced more by other factors. A direct measurement <strong>of</strong>rum<strong>in</strong>al pH is vastly more useful.Nutritional Management and SARAOnce a diagnosis <strong>of</strong> SARA has been established <strong>in</strong> a herd, then the cause <strong>of</strong> the acidosis mustbe determ<strong>in</strong>ed before appropriate preventive measures can be <strong>in</strong>stituted. Causes <strong>of</strong> rum<strong>in</strong>alacidosis can be grouped <strong>in</strong>to three categories: excessive <strong>in</strong>take <strong>of</strong> rapidly fermentablecarbohydrates, <strong>in</strong>adequate rum<strong>in</strong>al buffer<strong>in</strong>g, and <strong>in</strong>adequate rum<strong>in</strong>al adaptation to a highlyfermentable diet.Excessive <strong>in</strong>take <strong>of</strong> rapidly fermentable carbohydrates. This is the most obvious cause <strong>of</strong>rum<strong>in</strong>al acidosis <strong>in</strong> dairy cattle. Because <strong>of</strong> their relatively high dry matter <strong>in</strong>takes, dairy cattlecannot tolerate diets as proportionately high <strong>in</strong> concentrates as beef feedlot diets. An importantgoal <strong>of</strong> effective dairy cow nutrition is to feed as much concentrate as possible, <strong>in</strong> order tomaximize production, without caus<strong>in</strong>g rum<strong>in</strong>al acidosis. This is a difficult and challeng<strong>in</strong>g taskbecause the <strong>in</strong>dications <strong>of</strong> feed<strong>in</strong>g excessive amounts <strong>of</strong> fermentable carbohydrates (decreaseddry matter <strong>in</strong>take and milk production) are very similar to the results from feed<strong>in</strong>g excessivefiber (aga<strong>in</strong>, decreased dry matter <strong>in</strong>take and milk production). An important dist<strong>in</strong>ction is thateven slightly over-feed<strong>in</strong>g fermentable carbohydrates causes chronic health problems, whileslightly under-feed<strong>in</strong>g fermentable carbohydrates does not compromise cow health.<strong>Dairy</strong> nutritionists have carefully def<strong>in</strong>ed fiber requirements for dairy cattle <strong>in</strong> terms <strong>of</strong> aciddetergent fiber (ADF) and neutral detergent fiber (NDF) (National Research Council, 2001).Nutritionists <strong>of</strong>ten go beyond the measures <strong>of</strong> carbohydrate nutrition def<strong>in</strong>ed by the NationalResearch Council to <strong>in</strong>clude nutrients such as non-fiber carbohydrates (NFC), starch, effectiveNEF (eNDF), physically effective NDF (peNDF), (Mertens, 1997) and long fiber particles(Oetzel, 2000). Each <strong>of</strong> these nutrients looks at a slightly different aspect <strong>of</strong> carbohydratenutrition.Evaluat<strong>in</strong>g the dietary content for each <strong>of</strong> these nutrients is an important first step <strong>in</strong>determ<strong>in</strong><strong>in</strong>g the cause <strong>of</strong> SARA <strong>in</strong> a dairy herd. This requires a careful evaluation <strong>of</strong> the rationactually be<strong>in</strong>g consumed by the cows. A cursory evaluation <strong>of</strong> the “paper” ration formulated bythe herd nutritionist is usually <strong>of</strong> little value. Ascerta<strong>in</strong><strong>in</strong>g the ration actually consumed by thecows requires a careful <strong>in</strong>vestigation <strong>of</strong> how feed is delivered to the cows, accurate weights <strong>of</strong>the feed delivered, and updated nutrient analyses <strong>of</strong> the feeds delivered (particularly the drymatter content <strong>of</strong> the fermented feed <strong>in</strong>gredients). Careful bunk sampl<strong>in</strong>g and wet chemistryanalyses <strong>of</strong> total mixed rations (TMR) may uncover unknown errors <strong>in</strong> feed composition or feeddelivery. The total <strong>in</strong>take <strong>of</strong> rapidly fermentable carbohydrates is probably more important thanthe percentage <strong>of</strong> the carbohydrates <strong>in</strong> the diet (Oetzel and Nordlund, 1998). <strong>Herds</strong> or groupswith<strong>in</strong> herds with higher dry matter <strong>in</strong>takes will be at <strong>in</strong>herently higher risk for SARA and mayneed to be more conservative <strong>in</strong> carbohydrate nutrition than other herds or groups.<strong>Dairy</strong> herds that use component feed<strong>in</strong>g <strong>in</strong> early lactation <strong>of</strong>ten br<strong>in</strong>g cows up on gra<strong>in</strong> fasterthan their actual rise <strong>in</strong> dry matter <strong>in</strong>take. This puts cows at great risk for SARA, s<strong>in</strong>ce theycannot eat enough forage to compensate for the extra gra<strong>in</strong> consumed (Nordlund et al., 1995).<strong>University</strong> <strong>of</strong> Wiscons<strong>in</strong>, School <strong>of</strong> Veter<strong>in</strong>ary Medic<strong>in</strong>e, 2015 L<strong>in</strong>den Drive, Madison, WI 53706105
Preconvention Sem<strong>in</strong>ar 7A: <strong>Dairy</strong> Herd Problem Investigation Strategies:Lameness, Cow Comfort, and <strong>Rum<strong>in</strong>al</strong> <strong>Acidosis</strong>Careful model<strong>in</strong>g <strong>of</strong> early lactation diets <strong>in</strong> such herds <strong>of</strong>ten reveals drastic fiber deficienciesaround one to three weeks post-calv<strong>in</strong>g (Figure 14). As a general rule <strong>of</strong> thumb, cows shouldreceive no more than 8 to 12 lbs <strong>of</strong> dry matter from gra<strong>in</strong> <strong>in</strong> the first week after calv<strong>in</strong>g. Gra<strong>in</strong>feed<strong>in</strong>g should then <strong>in</strong>crease by about .25 to .50 lbs/cow/day until peak gra<strong>in</strong> feed<strong>in</strong>g is reachedat six to eight weeks post-calv<strong>in</strong>g. Maximal prote<strong>in</strong> feed<strong>in</strong>g can be reached <strong>in</strong> three weeks.The physical form <strong>of</strong> feed <strong>in</strong>gredients can be just as important as their chemical composition<strong>in</strong> determ<strong>in</strong><strong>in</strong>g how rapidly and completely they are fermented <strong>in</strong> the rumen. Gra<strong>in</strong>s that aref<strong>in</strong>ely ground, steam-flaked, extruded, and/or very wet will ferment more rapidly and completely<strong>in</strong> the rumen than unprocessed or dry gra<strong>in</strong>s, even if their chemical composition is identical.Similarly, starch from wheat or barley is more rapidly and completely fermented <strong>in</strong> the rumenthat starch from corn. Corn silage that is very wet, f<strong>in</strong>ely chopped, or kernel-processed alsoposes a greater risk for SARA than drier, coarsely chopped, or unprocessed corn silage.60Early Lactation Forage:Conc Ratios(rapid <strong>in</strong>troduction <strong>of</strong> concentrates)Dry Matter Intake, lbs50403020Forage DMConc. DM100-1 0 1 2 3 4 5 6 7 8 9 10Weeks Relative to Calv<strong>in</strong>gFigure 14. Forage:concentrate ratios result<strong>in</strong>g from rapid <strong>in</strong>troduction <strong>of</strong> concentrates <strong>in</strong> earlylactation.Particle size analysis <strong>of</strong> gra<strong>in</strong>s is a useful adjunct test when assess<strong>in</strong>g the risk for SARA <strong>in</strong> adairy herd. Very f<strong>in</strong>ely ground gra<strong>in</strong>s, especially if they are moist, will <strong>in</strong>crease their rate <strong>of</strong>fermentation <strong>in</strong> the rumen and <strong>in</strong>crease the risk for SARA. A detailed equipment list, protocol,and <strong>in</strong>terpretation guide for gra<strong>in</strong> particle size evaluation is presented <strong>in</strong> Appendix I.Feed<strong>in</strong>g a large proportion <strong>of</strong> a lactation diet as corn silage puts cows at higher risk forSARA compared to diets conta<strong>in</strong><strong>in</strong>g more dry hay or hay crop silages. Corn silages varyconsiderably <strong>in</strong> their NDF digestibility, due to genetic design (e.g., brown midrib varieties) ordue to grow<strong>in</strong>g / harvest conditions. Tests that estimate NDF digestibility can be very useful <strong>in</strong>identify<strong>in</strong>g corn silages with unusually high rates and extents <strong>of</strong> rum<strong>in</strong>al fermentation.<strong>University</strong> <strong>of</strong> Wiscons<strong>in</strong>, School <strong>of</strong> Veter<strong>in</strong>ary Medic<strong>in</strong>e, 2015 L<strong>in</strong>den Drive, Madison, WI 53706106
Preconvention Sem<strong>in</strong>ar 7A: <strong>Dairy</strong> Herd Problem Investigation Strategies:Lameness, Cow Comfort, and <strong>Rum<strong>in</strong>al</strong> <strong>Acidosis</strong>Unfortunately, most <strong>of</strong> these tests <strong>in</strong>terfere with precise evaluation because they first requiregr<strong>in</strong>d<strong>in</strong>g the corn silage sample.Corn silages also vary considerably <strong>in</strong> the extent <strong>of</strong> process<strong>in</strong>g <strong>of</strong> the corn gra<strong>in</strong> (e.g., kernelprocess<strong>in</strong>g). Tests are be<strong>in</strong>g developed to help measure the extent <strong>of</strong> gra<strong>in</strong> process<strong>in</strong>g with<strong>in</strong>corn silage. Comb<strong>in</strong><strong>in</strong>g these test results with digestibility data and particle length data furthersour ability to feed corn silages heavily without unnecessary risk for SARA.Corn silage is also difficult to feed because it typically does not contribute enough longparticles to a TMR. Very long chopp<strong>in</strong>g <strong>of</strong> corn silage is not recommended, because it impairsfermentation and <strong>in</strong>creases the risk for sort<strong>in</strong>g at the feedbunk. It is a common (and necessary)practice to add chopped long-stem dry hay or chopped dry straw to TMR conta<strong>in</strong><strong>in</strong>g a highproportion <strong>of</strong> the forage as corn silage. However, can be difficult to process the dry forage sothat it distributes evenly throughout the TMR and so that the cows cannot sort it. Vertical mixersor prior tub gr<strong>in</strong>d<strong>in</strong>g <strong>of</strong> the dry forage usually works the best.Feed delivery and access are <strong>of</strong>ten overlooked as important contributors to SARA. <strong>Dairy</strong>cattle groups are commonly fed for ad libitum <strong>in</strong>take (typically a 5% daily feed refusal) <strong>in</strong> orderto maximize potential dry matter <strong>in</strong>take and milk yield. However, slightly limit<strong>in</strong>g <strong>in</strong>take <strong>in</strong>dairy cattle at high risk for SARA would <strong>in</strong> theory reduce their risk <strong>of</strong> periodic overconsumptionand SARA. Feed efficiency might also be improved. This approach has beensuccessfully used <strong>in</strong> beef feedlots. However, dairy cow groups are much more dynamic thanfeedlot groups. This makes it considerably more challeng<strong>in</strong>g for dairy cattle feeders to slightlylimit <strong>in</strong>takes without lett<strong>in</strong>g the feed bunks be without palatable feed more than about four hoursa day. It can be done, but only with adequate bunk space and excellent feed bunk management.Perhaps ad libitum feed<strong>in</strong>g with a 5% daily feed refusal is the best option for most dairy herds.This would especially apply to the pre- and post-fresh cow groups because they have rapid cowturnover and because <strong>in</strong>dividual cows have rapidly chang<strong>in</strong>g dry matter <strong>in</strong>takes dur<strong>in</strong>g these timeperiods.Research studies with SARA suggest that meal size is an extremely important aspect <strong>of</strong>nutritional management <strong>of</strong> SARA. Cows are able to self-regulate their rum<strong>in</strong>al pH veryeffectively if they have cont<strong>in</strong>uous and predictable access to the same TMR every day.However, even modest bouts <strong>of</strong> feed restriction can cause cows to subsequently consume mealsthat are too large. Therefore, good feedbunk management practices are critical SARAprevention - even when chemical fiber, particle length, and gra<strong>in</strong> process<strong>in</strong>g are optimal.Because first lactation heifers have lower dry matter <strong>in</strong>takes than older cows, it would seemthat they should be a lower risk for SARA. However, cl<strong>in</strong>ical data from our herd <strong>in</strong>vestigationsshows that first lactation heifers may actually be a higher risk (see Figure 15). First lactationheifers sampled had a higher prevalence <strong>of</strong> SARA (28% vs. 17% <strong>in</strong> second or greater lactationcows) and also appeared to be at risk for SARA earlier <strong>in</strong> lactation than the older cows. Theseare observational data only, and should be <strong>in</strong>terpreted with caution until they are validated (orrefuted) by results <strong>of</strong> controlled studies. It is possible that first lactation heifers have difficultygett<strong>in</strong>g access to feedbunk when older cows are present, so they could be prone to eat<strong>in</strong>g largemeals. It is also possible that first lactation heifers need time to learn to self-regulate their ownrum<strong>in</strong>al pH after they beg<strong>in</strong> consum<strong>in</strong>g large amounts <strong>of</strong> fermentable carbohydrates aftercalv<strong>in</strong>g. S<strong>in</strong>ce first lactation heifers represent a largely unculled population, it is possible thatthe heifers that are unable to learn to self-regulate their own rum<strong>in</strong>al pH have not yet been<strong>University</strong> <strong>of</strong> Wiscons<strong>in</strong>, School <strong>of</strong> Veter<strong>in</strong>ary Medic<strong>in</strong>e, 2015 L<strong>in</strong>den Drive, Madison, WI 53706107
Preconvention Sem<strong>in</strong>ar 7A: <strong>Dairy</strong> Herd Problem Investigation Strategies:Lameness, Cow Comfort, and <strong>Rum<strong>in</strong>al</strong> <strong>Acidosis</strong>removed from the herd. However, they will be removed by the second or third lactation due tocomplications <strong>of</strong> SARA.(617 cows <strong>in</strong> 55 herds)% Cows Tested with RpH=125DIM Category1st Lact2+ LactFigure 15. Incidence <strong>of</strong> low rum<strong>in</strong>al pH by days <strong>in</strong> milk category and by parity. Data are from617 cows <strong>in</strong> 55 herds.Inadequate rum<strong>in</strong>al buffer<strong>in</strong>g. Rum<strong>in</strong>ant animals have a highly developed system forbuffer<strong>in</strong>g the organic acids produced by rum<strong>in</strong>al fermentation <strong>of</strong> carbohydrates. While the totaleffect <strong>of</strong> buffer<strong>in</strong>g on rum<strong>in</strong>al pH is relatively small, it can still account for the marg<strong>in</strong> betweenhealth and disease <strong>in</strong> dairy cows fed large amounts <strong>of</strong> fermentable carbohydrates (Firk<strong>in</strong>s, 1997).<strong>Rum<strong>in</strong>al</strong> buffer<strong>in</strong>g has two aspects – dietary and endogenous buffer<strong>in</strong>g.Dietary buffer<strong>in</strong>g is the <strong>in</strong>herent buffer<strong>in</strong>g capacity <strong>of</strong> the diet and is largely expla<strong>in</strong>ed bydietary cation-anion difference (DCAD). Diets high <strong>in</strong> Na and K relative to Cl and S have higherDCAD concentrations, tend to support higher rum<strong>in</strong>al pH, and <strong>in</strong>crease dry matter <strong>in</strong>take andmilk yield (Sanchez et al., 1994) (Block and Sanchez, 2000). Optimal DCAD for early lactationdiets is about +400 mEq/kg <strong>of</strong> (Na +K) – (Cl + S) (Block and Sanchez, 2000). Mid-lactationcows have an optimal DCAD <strong>of</strong> about +275 to +400 mEq/kg. Formulat<strong>in</strong>g diets with a highDCAD typically requires the addition <strong>of</strong> buffers such as sodium bicarbonate or potassiumcarbonate. Alfalfa forages tend to have a higher DCAD than corn silage, although this dependsconsiderably on the m<strong>in</strong>eral composition <strong>of</strong> the soil on which they were grown. Concentratefeeds typically have low or negative DCAD, which adds to their already high potential to causerum<strong>in</strong>al acidosis because <strong>of</strong> their high fermentable carbohydrate content.Endogenous buffers are produced by the cow and secreted <strong>in</strong>to the rumen via the saliva. Theamount <strong>of</strong> physical fiber <strong>in</strong> the diet determ<strong>in</strong>es the extent <strong>of</strong> buffer production by the salivaryglands. Coarse, fibrous feeds conta<strong>in</strong> more effective fiber and stimulate more saliva productiondur<strong>in</strong>g eat<strong>in</strong>g than do f<strong>in</strong>ely ground feeds or fresh pasture (Bailey, 1961). Coarse, fibrous feedsalso make up the mat layer <strong>of</strong> the rumen, which is the stimulus for rum<strong>in</strong>ation. Fiber particles<strong>University</strong> <strong>of</strong> Wiscons<strong>in</strong>, School <strong>of</strong> Veter<strong>in</strong>ary Medic<strong>in</strong>e, 2015 L<strong>in</strong>den Drive, Madison, WI 53706108
Preconvention Sem<strong>in</strong>ar 7A: <strong>Dairy</strong> Herd Problem Investigation Strategies:Lameness, Cow Comfort, and <strong>Rum<strong>in</strong>al</strong> <strong>Acidosis</strong>need to be longer than about 1.5 <strong>in</strong>ches <strong>in</strong> order to contribute to mat layer formation.Rum<strong>in</strong>ation promotes much chew<strong>in</strong>g activity and therefore the secretion <strong>of</strong> large amounts <strong>of</strong>saliva <strong>in</strong>to the rumen. As expected, rum<strong>in</strong>al pH <strong>in</strong>creases noticeably dur<strong>in</strong>g bouts <strong>of</strong> rum<strong>in</strong>ation(Allen, 1997).The ability <strong>of</strong> a diet and feed<strong>in</strong>g system to promote maximal amounts <strong>of</strong> rum<strong>in</strong>al buffer<strong>in</strong>gshould be evaluated as part <strong>of</strong> the work-up <strong>of</strong> a herd diagnosed with SARA. Wet chemistryanalysis <strong>of</strong> a carefully collected TMR bunk sample can be particularly effective <strong>in</strong> determ<strong>in</strong><strong>in</strong>gthe actual DCAD <strong>of</strong> the diet delivered to the lactation cows. Diets with measured DCAD valuesbelow about +275 to +400 mEq/kg <strong>of</strong> (Na + K) – (Cl + S) should be supplemented withadditional buffers to provide more Na or K relative to Cl and S.Endogenous buffer<strong>in</strong>g can be estimated by observ<strong>in</strong>g the number <strong>of</strong> cows rum<strong>in</strong>at<strong>in</strong>g (a goalis at least 40% <strong>of</strong> cows rum<strong>in</strong>at<strong>in</strong>g at any given time) and by measur<strong>in</strong>g the particle length <strong>of</strong> theTMR actually consumed by the cows us<strong>in</strong>g the Penn State Forage Particle Separator (Lammerset al., 1996; Oetzel, 2000). A detailed equipment list, protocol, and <strong>in</strong>terpretation guidel<strong>in</strong>es forforage particle length are presented <strong>in</strong> Appendix II.Diets with less than 7% long particles put cows at <strong>in</strong>creased risk for SARA, particularly ifthese diets are also borderl<strong>in</strong>e or low <strong>in</strong> chemical fiber content (Grant et al., 1990) (Woodfordand Murphy, 1988). Increas<strong>in</strong>g chemical fiber content <strong>of</strong> the diet may compensate for shortparticle length (Beauchem<strong>in</strong> et al., 1994).Diets with excessive (over about 15%) long forage particles can paradoxically <strong>in</strong>crease therisk for SARA. This happens when the long particles are unpalatable and sortable. Sort<strong>in</strong>g <strong>of</strong>the long particles occurs soon after feed delivery, caus<strong>in</strong>g the cows to consume a diet that is low<strong>in</strong> physically effective fiber after feed<strong>in</strong>g. The diet consumed later <strong>in</strong> the feed<strong>in</strong>g period is thenexcessively high <strong>in</strong> physically effective fiber and low <strong>in</strong> energy. Socially dom<strong>in</strong>ant cows areparticularly susceptible to SARA <strong>in</strong> this scenario, s<strong>in</strong>ce they are likely to consume more <strong>of</strong> thef<strong>in</strong>e TMR particles soon after feed delivery. Cows lower on the peck order then consume a verylow energy diet. Thus, cows on both ends <strong>of</strong> the social spectrum become th<strong>in</strong> and producepoorly. Limit<strong>in</strong>g bunk space to less than 30 <strong>in</strong>ches per cow exacerbates the effect <strong>of</strong> TMRsort<strong>in</strong>g <strong>in</strong> a group <strong>of</strong> cows. Sort<strong>in</strong>g <strong>of</strong> long particles dur<strong>in</strong>g the feed-out period can be evaluatedby conduct<strong>in</strong>g sequential analysis <strong>of</strong> the TMR bunk samples at differ<strong>in</strong>g times after feed<strong>in</strong>g.It is very difficult to quantitatively evaluate the extent that a TMR is sorted. The mostrigorous approach is to gather representative samples <strong>of</strong> the TMR at approximately 2 hours afterfeed<strong>in</strong>g and then do particle length analysis at each time po<strong>in</strong>t. Gather<strong>in</strong>g representative TMRbunk samples is tedious (gather 12 or more representative along the length <strong>of</strong> the bunk, mix, and,and then shake down two six-cup subsamples), and repeat<strong>in</strong>g this procedure six to ten times overthe course <strong>of</strong> a day is not very practical. A more reasonable approach is to first evaluate theparticle length, coarseness <strong>of</strong> the long forage particles, and dry matter <strong>of</strong> the TMR. If theproportion <strong>of</strong> long particles is
Preconvention Sem<strong>in</strong>ar 7A: <strong>Dairy</strong> Herd Problem Investigation Strategies:Lameness, Cow Comfort, and <strong>Rum<strong>in</strong>al</strong> <strong>Acidosis</strong>particles and the TMR refusal is 24% long particles, then sort<strong>in</strong>g is probably not a major issue.But if the TMR refusal conta<strong>in</strong>s >28% long particles, then this is cause for concern.The most common cause <strong>of</strong> excessive TMR sort<strong>in</strong>g is the <strong>in</strong>clusion <strong>of</strong> unprocessed, coarse,dry baled hay <strong>in</strong> a TMR. Despite the claims <strong>of</strong> manufacturers, most TMR mixers (except forsome vertical mixers) are unable to adequately reduce the particle size <strong>of</strong> coarse dry hay.Process<strong>in</strong>g this hay before add<strong>in</strong>g it to the mixer is <strong>of</strong>ten necessary. In many cases, the dry haycan be elim<strong>in</strong>ated from the TMR, provided there are adequate long particles from haylage andcorn silage. It seems paradoxical, but the risk for SARA <strong>in</strong> a herd can sometimes be lowered byremov<strong>in</strong>g the baled hay from the TMR.Inadequate adaptation to highly fermentable, high carbohydrate diets. In theory, cows <strong>in</strong>early lactation should be particularly susceptible to SARA if they are poorly prepared for thelactation diet they will receive. <strong>Rum<strong>in</strong>al</strong> adaptation to diets high <strong>in</strong> fermentable carbohydratesapparently has two key aspects – microbial adaptation (particularly the lactate-utiliz<strong>in</strong>g bacteria,which grow more slowly than the lactate-produc<strong>in</strong>g bacteria) and rum<strong>in</strong>al papillae length (longerpapillae promote greater VFA absorption and thus lower rum<strong>in</strong>al pH) (Dirksen et al., 1985).Beef feedlots recognize the importance <strong>of</strong> gradually <strong>in</strong>troduc<strong>in</strong>g steers to higher gra<strong>in</strong> diets(Radostits et al., 1994).The known pr<strong>in</strong>ciples <strong>of</strong> rum<strong>in</strong>al adaptation suggest that <strong>in</strong>creas<strong>in</strong>g gra<strong>in</strong> feed<strong>in</strong>g toward theend <strong>of</strong> the dry period should decrease the risk for SARA <strong>in</strong> early lactation cows. However, arecent field study <strong>in</strong> TMR-fed herds found no effect <strong>of</strong> dry period feed<strong>in</strong>g on early lactationrum<strong>in</strong>al pH. And rum<strong>in</strong>al pH <strong>in</strong> this study was unexpectedly lower <strong>in</strong> cows at 106 average days<strong>in</strong> milk compared to cows at 15 average days <strong>in</strong> milk (Garrett et al., 1997). These results suggestthat high dry matter <strong>in</strong>take is a more important risk factor for SARA than rum<strong>in</strong>al adaptationproblems <strong>in</strong> dairy herds. Also, a controlled study <strong>in</strong> component-fed cows found no positiveeffect <strong>of</strong> <strong>in</strong>creased gra<strong>in</strong> feed<strong>in</strong>g dur<strong>in</strong>g the dry period on early lactation rum<strong>in</strong>al pH or drymatter <strong>in</strong>take (Andersen et al., 1999). These results suggest that the practical impacts <strong>of</strong> rum<strong>in</strong>aladaptation may be small or even <strong>in</strong>consequential <strong>in</strong> dairy herds - particularly when cows are feda TMR after calv<strong>in</strong>g.Prevention <strong>of</strong> <strong>Subacute</strong> <strong>Rum<strong>in</strong>al</strong> <strong>Acidosis</strong> <strong>in</strong> <strong>Dairy</strong> <strong>Herds</strong>The basic pr<strong>in</strong>ciples <strong>of</strong> prevent<strong>in</strong>g SARA <strong>in</strong> dairy herds have been discussed above and<strong>in</strong>clude limit<strong>in</strong>g the <strong>in</strong>take <strong>of</strong> rapidly fermentable carbohydrates, provid<strong>in</strong>g adequate rum<strong>in</strong>albuffer<strong>in</strong>g, and allow<strong>in</strong>g for rum<strong>in</strong>al adaptation to high gra<strong>in</strong> diets. However, I expect SARA torema<strong>in</strong> an important dairy cow problem even when these pr<strong>in</strong>ciples are understood and applied,because the l<strong>in</strong>e between optimal milk production and over-feed<strong>in</strong>g gra<strong>in</strong> is exceed<strong>in</strong>gly f<strong>in</strong>e. Inmany dairy herd situations, milk production can appear to be temporarily <strong>in</strong>creased by overfeed<strong>in</strong>ggra<strong>in</strong> and caus<strong>in</strong>g SARA; however, the long-term health and economic consequences <strong>of</strong>this approach are devastat<strong>in</strong>g. Any additional nutritional <strong>in</strong>terventions that might prevent SARAwithout limit<strong>in</strong>g gra<strong>in</strong> feed<strong>in</strong>g are highly desirable. Several <strong>of</strong> these approaches are summarizedbelow.Enhanc<strong>in</strong>g rum<strong>in</strong>al lactate utilizers. An important aspect <strong>of</strong> ma<strong>in</strong>ta<strong>in</strong><strong>in</strong>g a stable rumenenvironment is ma<strong>in</strong>ta<strong>in</strong><strong>in</strong>g a balance between lactate production and lactate utilization bybacteria that convert lactate to less dangerous VFA. Enhanc<strong>in</strong>g rum<strong>in</strong>al lactate utilizers reducesthe risk for rum<strong>in</strong>al acidosis (particularly the acute form <strong>of</strong> rum<strong>in</strong>al acidosis). Supplementation<strong>University</strong> <strong>of</strong> Wiscons<strong>in</strong>, School <strong>of</strong> Veter<strong>in</strong>ary Medic<strong>in</strong>e, 2015 L<strong>in</strong>den Drive, Madison, WI 53706110
Preconvention Sem<strong>in</strong>ar 7A: <strong>Dairy</strong> Herd Problem Investigation Strategies:Lameness, Cow Comfort, and <strong>Rum<strong>in</strong>al</strong> <strong>Acidosis</strong>with specific yeast stra<strong>in</strong>s may enhance lactate utilization with<strong>in</strong> the rumen under certa<strong>in</strong> dietaryconditions (Dawson, 1995).Precondition<strong>in</strong>g microbes to handle lactate. Add<strong>in</strong>g lactate to the diet or us<strong>in</strong>g feed<strong>in</strong>gredients high <strong>in</strong> lactate may improve the ability <strong>of</strong> the rumen to adapt to sudden <strong>in</strong>creases <strong>in</strong>lactate production (Owens et al., 1998). Direct-fed microbials might also be used to provide asteady source <strong>of</strong> lactate <strong>in</strong> the rumen. A mixture <strong>of</strong> direct-fed microbials added to the rumen <strong>of</strong>dairy cows at the 1 x 10 5 dose <strong>in</strong>creased corn digestibility and <strong>in</strong>creased rum<strong>in</strong>al pH compared tohigher doses <strong>of</strong> microbials (Nocek et al., 1999).Selenomonas rum<strong>in</strong>antium is one <strong>of</strong> the bacteria that convert rum<strong>in</strong>al lactate to VFA. S.rum<strong>in</strong>antium is apparently stimulated to utilize lactate by malate (Mart<strong>in</strong> and Streeter, 1995).Supplement<strong>in</strong>g diets with malate as a feed additive may be cost-prohibitive; however,<strong>in</strong>corporation <strong>of</strong> forage varieties high <strong>in</strong> malate may allow for economical <strong>in</strong>clusion <strong>of</strong> malate <strong>in</strong>dairy diets (Callaway et al., 2000). Stage <strong>of</strong> maturity and variety affects malate concentrations <strong>in</strong>alfalfa (Callaway et al., 2000).Supplementation with ionophores. Feed<strong>in</strong>g ionophores reduces rum<strong>in</strong>al lactate production;this effect appears to be caused by <strong>in</strong>hibition <strong>of</strong> lactate-produc<strong>in</strong>g bacteria, competitiveenhancement <strong>of</strong> lactate utilizers, and possibly by reduc<strong>in</strong>g meal size (Owens et al., 1998).Monens<strong>in</strong> is now approved for use <strong>in</strong> lactat<strong>in</strong>g dairy cattle <strong>in</strong> the US. It appears that the benefits<strong>of</strong> monens<strong>in</strong> <strong>in</strong> prevent<strong>in</strong>g SARA are m<strong>in</strong>or. It is probably more effective <strong>in</strong> prevent<strong>in</strong>g acuterum<strong>in</strong>al acidosis, which is consistently characterized by very high rum<strong>in</strong>al lactate concentrations.ReferencesAllen, M. S. 1997. Relationship between fermentation acid production <strong>in</strong> the rumen and the requirementfor physically effective fiber. J. <strong>Dairy</strong> Sci. 80:1447-1462.Andersen, J. B., J. Sehested, and L. Ingvartsen. 1999. Effect <strong>of</strong> dry cow feed<strong>in</strong>g strategy on rumen pH,concentration <strong>of</strong> volatile fatty acids and rumen epithelium development. Acta Agric. Scand., Sect. A,Animal Sci. 49:149-155.Bailey, C. B. 1961. Saliva secretion and its relation to feed<strong>in</strong>g <strong>in</strong> cattle. 3. The rate <strong>of</strong> secretion <strong>of</strong> mixedsaliva <strong>in</strong> the cow dur<strong>in</strong>g eat<strong>in</strong>g with an estimate <strong>of</strong> the magnitude <strong>of</strong> the total daily secretion <strong>of</strong> mixedsaliva. Br. J. Nutr. 15:443-451.Beauchem<strong>in</strong>, K. A., B. I. Farr, L. M. Rode, and G. B. Schaalje. 1994. Effects <strong>of</strong> alfalfa silage chop lengthand supplementary long hay on chew<strong>in</strong>g and milk production <strong>of</strong> dairy cows. J. <strong>Dairy</strong> Sci. 77:1326-1339.Block, E., and W. K. Sanchez. 2000. Is it important to adjust the dietary cation-anion difference forlactat<strong>in</strong>g dairy cows? Pages 27-39 <strong>in</strong> Proc. Tri-State <strong>Dairy</strong> Nutr Conf, Columbus, OH.Callaway, T. R., S. A. Mart<strong>in</strong>, J. L. Wampler, N. S. Hill, and G. M. Hill. 2000. Malate content <strong>of</strong> foragevarieties commonly fed to cattle. J. <strong>Dairy</strong> Sci. 80:1651-1655.Carter, R. R., and W. L. Grovum. 1990. A review <strong>of</strong> the physiological significance <strong>of</strong> hypertonic bodyfluids on feed <strong>in</strong>take and rum<strong>in</strong>al function: Salivation, motility and microbes. J. Anim. Sci. 68:2811-2832.Dawson, K. A. 1995. The use <strong>of</strong> yeast stra<strong>in</strong> 8417 <strong>in</strong> manipulat<strong>in</strong>g rum<strong>in</strong>ant high concentrate diets. Pages25-36 <strong>in</strong> Proc. 56th M<strong>in</strong>nesota Nutrition Conference & Alltech, Inc. Technical Symposium, St. Paul,MN.<strong>University</strong> <strong>of</strong> Wiscons<strong>in</strong>, School <strong>of</strong> Veter<strong>in</strong>ary Medic<strong>in</strong>e, 2015 L<strong>in</strong>den Drive, Madison, WI 53706111
Preconvention Sem<strong>in</strong>ar 7A: <strong>Dairy</strong> Herd Problem Investigation Strategies:Lameness, Cow Comfort, and <strong>Rum<strong>in</strong>al</strong> <strong>Acidosis</strong>Dirksen, G. U., H. G. Liebich, and E. Mayer. 1985. Adaptive changes <strong>of</strong> the rum<strong>in</strong>al mucosa and theirfunctional and cl<strong>in</strong>ical significance. Bov<strong>in</strong>e Practitioner 20:116-120.Firk<strong>in</strong>s, J. 1997. Effect <strong>of</strong> physical process<strong>in</strong>g <strong>of</strong> corn silage and gra<strong>in</strong>. Pages 205-218 <strong>in</strong> Proc. Tri-State<strong>Dairy</strong> Nutr Conf, Columbus, OH.Garrett, E. F., K. V. Nordlund, W. J. Goodger, and G. R. Oetzel. 1997. A cross-sectional field study<strong>in</strong>vestigat<strong>in</strong>g the effect <strong>of</strong> periparturient dietary management on rum<strong>in</strong>al pH <strong>in</strong> early lactation dairycows. J. <strong>Dairy</strong> Sci. 80(Suppl. 1):169-169. (Abstr.)Garry, F. B. 1996. Indigestion <strong>in</strong> rum<strong>in</strong>ants. Pages 824-858 <strong>in</strong> Large Animal Internal Medic<strong>in</strong>e. B. P.Smith, ed. Mosby-Year Book, Inc., St. Louis.Grant, R. J., V. F. Colenbrander, and D. R. Mertens. 1990. Milk fat depression <strong>in</strong> dairy cows: Role <strong>of</strong>silage particle size. J. <strong>Dairy</strong> Sci. 73:1834-1842.Kennelly, J. J., B. Rob<strong>in</strong>son, and G. R. Khorasani. 1999. Influence <strong>of</strong> carbohydrate source and buffer onrumen fermentation characteristics, milk yield, and milk composition <strong>in</strong> early-lactation Holste<strong>in</strong>cows. J. <strong>Dairy</strong> Sci. 82:2486-2496.Lammers, B. P., D. R. Buckmaster, and A. J. He<strong>in</strong>richs. 1996. A simple method for the analysis <strong>of</strong>particle sizes <strong>of</strong> forage and total mixed rations. J. <strong>Dairy</strong> Sci. 79:922-928.Mart<strong>in</strong>, S. A., and M. N. Streeter. 1995. Effect <strong>of</strong> malate on <strong>in</strong> vitro mixed rum<strong>in</strong>al microorganismfermentation. J. Anim. Sci. 73:2141-2145.Mertens, D. R. 1997. Creat<strong>in</strong>g a system for meet<strong>in</strong>g the fiber requirements <strong>of</strong> dairy cows. J. <strong>Dairy</strong> Sci.80:1463-1481.National Research Council. 2001. Nutrient Requirements <strong>of</strong> <strong>Dairy</strong> Cattle. 7th rev. ed. Natl. Acad. Press,Wash<strong>in</strong>gton, DC.Nocek, J. E., W. P. Kautz, J. A. Z. Leedle, and J. G. Allman. 1999. The effect <strong>of</strong> rum<strong>in</strong>al supplementation<strong>of</strong> direct-fed microbials on diurnal pH variation and <strong>in</strong> situ digestion <strong>in</strong> dairy cattle. J. <strong>Dairy</strong> Sci.82(Suppl. 1):69-70. (Abstr.)Nordlund, K. V., E. F. Garrett, and G. R. Oetzel. 1995. Herd-based rumenocentesis: A cl<strong>in</strong>ical approachto the diagnosis <strong>of</strong> subacute rumen acidosis. Compend. Cont<strong>in</strong>. Educ. Pract. Vet. 17:S48-S56.Oetzel, G. R. 2001. Application <strong>of</strong> forage particle length determ<strong>in</strong>ation <strong>in</strong> dairy practice. Compend.Cont<strong>in</strong>. Educ. Pract. Vet. 23:S30-38.Oetzel, G. R., and K. V. Nordlund. 1998. Effect <strong>of</strong> dry matter <strong>in</strong>take and feed<strong>in</strong>g frequency on rum<strong>in</strong>alpH <strong>in</strong> lactat<strong>in</strong>g dairy cows. J. <strong>Dairy</strong> Sci. 81(Suppl. 1):297-Owens, F. N., D. S. Secrist, W. J. Hill, and D. R. Gill. 1998. <strong>Acidosis</strong> <strong>in</strong> cattle: A review. J. Anim. Sci.76:275-286.Pollitt, C. C. 1999. Equ<strong>in</strong>e lam<strong>in</strong>itis: A revised pathophysiology. AAEP Proceed<strong>in</strong>gs 45:188-192.Prentice, D. L., D. M. Schaefer, and G. R. Oetzel. 2000. Effect <strong>of</strong> lasalocid on the forage to concentrateratio fed to steers ma<strong>in</strong>ta<strong>in</strong>ed at a pre-determ<strong>in</strong>ed daily average rum<strong>in</strong>al pH. J. <strong>Dairy</strong> Sci. 83:246-247.(Abstr.)Radostits, O. M., D. C. Blood, and C. C. Gay. 1994. Acute carbohydrate engorgement <strong>of</strong> rum<strong>in</strong>ants(rumen overload). Pages 262-269 <strong>in</strong> Veter<strong>in</strong>ary Medic<strong>in</strong>e. O. W. Radostits, D. C. Blood, and C. C.Gay, ed. W. B. Saunders, Philadelphia, PA.Rebhun, W. C. 1995. Abdom<strong>in</strong>al diseases. Pages 106-154 <strong>in</strong> Diseases <strong>of</strong> <strong>Dairy</strong> Cattle. W. C. Rebhun, ed.Williams and Wilk<strong>in</strong>s, Media, PA.Russell, J. B., and J. L. Rychlik. 2001. Factors that alter rumen microbial ecology. Science 292:1119-1122.<strong>University</strong> <strong>of</strong> Wiscons<strong>in</strong>, School <strong>of</strong> Veter<strong>in</strong>ary Medic<strong>in</strong>e, 2015 L<strong>in</strong>den Drive, Madison, WI 53706112
Preconvention Sem<strong>in</strong>ar 7A: <strong>Dairy</strong> Herd Problem Investigation Strategies:Lameness, Cow Comfort, and <strong>Rum<strong>in</strong>al</strong> <strong>Acidosis</strong>Sanchez, W. K., D. K. Beede, and M. A. Delorenzo. 1994. Macrom<strong>in</strong>eral element <strong>in</strong>terrelationships andlactational performance: Empirical models from a large data set. J. <strong>Dairy</strong> Sci. 77:3096-3110.Van Soest, P. J. 1994. Nutritional ecology <strong>of</strong> the rum<strong>in</strong>ant. 2nd ed. Cornell <strong>University</strong> Press, Ithaca, NY.Woodford, S. T., and M. R. Murphy. 1988. Effect <strong>of</strong> forage physical form on chew<strong>in</strong>g activity, dry matter<strong>in</strong>take, and rumen function <strong>of</strong> dairy cows <strong>in</strong> early lactation. J. <strong>Dairy</strong> Sci. 71:674-686.<strong>University</strong> <strong>of</strong> Wiscons<strong>in</strong>, School <strong>of</strong> Veter<strong>in</strong>ary Medic<strong>in</strong>e, 2015 L<strong>in</strong>den Drive, Madison, WI 53706113
Preconvention Sem<strong>in</strong>ar 7A: <strong>Dairy</strong> Herd Problem Investigation Strategies:Lameness, Cow Comfort, and <strong>Rum<strong>in</strong>al</strong> <strong>Acidosis</strong>Appendix I - Gra<strong>in</strong> Particle Size Determ<strong>in</strong>ationEquipment:Metal sieves for separat<strong>in</strong>g gra<strong>in</strong>s (USA Standard Test<strong>in</strong>g Sieve; ASTME-11 Specification).I use the 8-<strong>in</strong>ch diameter, brass screens from Fisher Scientific (800/766-7000, www3.fishersci.com).These were the cheapest type <strong>of</strong> metal sieves that they sell - about $250 USD for the set. An alternatesource is Seedburo Equipment Corp., Chicago, IL (312/738-3700, www.seedburo.com). You need thefollow<strong>in</strong>g size screens <strong>in</strong> the sieves:#4 (1/4 <strong>in</strong>ch)#8 (1/8 <strong>in</strong>ch)#16 (1/16 <strong>in</strong>ch)#30 (1/30 <strong>in</strong>ch)Pan(Note: screens and pan must be the same size and type, so they will properly stack together)“Gram” scale with accuracy <strong>of</strong> 0.1 grams, capacity <strong>of</strong> 400 grams or more.(the same scale can be used for the forage particle length determ<strong>in</strong>ations)Scales I have used:Ohaus Scout II electronic scale (400 g capacity x 0.1 g readability)(about $145 USD from Nasco, Agricultural Sciences Catalog)(800/558-9595, www.enasco.com)Ohaus Triple Beam Balance scale (500 g capacity x 0.1 g readability)(about $90 USD, also from Nasco, Agricultural Sciences Catalog)Plastic tray to collect and weigh separated gra<strong>in</strong> particles(same tray as used for the forage particle length determ<strong>in</strong>ations)Measur<strong>in</strong>g cup for 1-cup measurementForm to record and calculate results (see attached)Test Procedure:1. Carefully sample the gra<strong>in</strong> – make sure that the sample you are separat<strong>in</strong>g is representative <strong>of</strong> theentire lot <strong>of</strong> gra<strong>in</strong>.2. Measure 1 cup <strong>of</strong> the gra<strong>in</strong>.3. Stack the screens and pan, with the coarsest screen on top and the pan on the bottom.4. Pour the 1-cup sample onto the top screen.5. Shake and tap the screens until the amount <strong>of</strong> gra<strong>in</strong> rema<strong>in</strong><strong>in</strong>g on the top (#4) screen is constant. Weare not worried about long particles tipp<strong>in</strong>g up and slid<strong>in</strong>g through the screen, so over-shak<strong>in</strong>g is notpossible. Once the top screen is f<strong>in</strong>ished, take it <strong>of</strong>f, set it aside, and shake/tap the rema<strong>in</strong><strong>in</strong>g screensuntil the amount <strong>of</strong> gra<strong>in</strong> on the next screen (#8) is consistent. Set this screen aside, and shake/tapuntil the next screen (#16) is done. Repeat this until all <strong>of</strong> the screens are f<strong>in</strong>ished.6. Weigh the amount <strong>of</strong> gra<strong>in</strong> present on each <strong>of</strong> the 4 screens and on the bottom pan. Calculate the %particles on each screen and on the pan. All <strong>of</strong> these calculations are done on an as-fed basis – it isnot necessary to correct the amounts for % dry matter.<strong>University</strong> <strong>of</strong> Wiscons<strong>in</strong>, School <strong>of</strong> Veter<strong>in</strong>ary Medic<strong>in</strong>e, 2015 L<strong>in</strong>den Drive, Madison, WI 53706114
Preconvention Sem<strong>in</strong>ar 7A: <strong>Dairy</strong> Herd Problem Investigation Strategies:Lameness, Cow Comfort, and <strong>Rum<strong>in</strong>al</strong> <strong>Acidosis</strong>7. Compare your results to those listed on the table below. The recommended particle size distributiondepends on the moisture <strong>of</strong> the gra<strong>in</strong> be<strong>in</strong>g tested. Interpret the results loosely - no gra<strong>in</strong> sample willfit the ideal distribution perfectly. We are look<strong>in</strong>g for major errors <strong>in</strong> gra<strong>in</strong> process<strong>in</strong>g with this test.It is not <strong>in</strong>tended to “f<strong>in</strong>e tune” a dairy’s gra<strong>in</strong> process<strong>in</strong>g methods.Interpretation <strong>of</strong> Gra<strong>in</strong> Screen<strong>in</strong>g Results:Percent on Top <strong>of</strong> Screen:Feed Ingredient: #4 #8 #16 #30 PanHMSC,
Preconvention Sem<strong>in</strong>ar 7A: <strong>Dairy</strong> Herd Problem Investigation Strategies:Lameness, Cow Comfort, and <strong>Rum<strong>in</strong>al</strong> <strong>Acidosis</strong>Gra<strong>in</strong> Screen<strong>in</strong>g ResultsUSA Standard Test<strong>in</strong>g Sieve; ASTME-11 SpecificationFarm Name:_________________________________________Date:__________Sample Sample SampleAmt. % Amt. % Amt. %#4 #4 #4#8 #8 #8#16 #16 #16#30 #30 #30Pan Pan PanTotal Total TotalSample Sample SampleAmt. % Amt. % Amt. %#4 #4 #4#8 #8 #8#16 #16 #16#30 #30 #30Pan Pan PanTotal Total TotalSample Sample SampleAmt. % Amt. % Amt. %#4 #4 #4#8 #8 #8#16 #16 #16#30 #30 #30Pan Pan PanTotal Total TotalSample Sample SampleAmt. % Amt. % Amt. %#4 #4 #4#8 #8 #8#16 #16 #16#30 #30 #30Pan Pan PanTotal Total Total<strong>University</strong> <strong>of</strong> Wiscons<strong>in</strong>, School <strong>of</strong> Veter<strong>in</strong>ary Medic<strong>in</strong>e, 2015 L<strong>in</strong>den Drive, Madison, WI 53706116
Preconvention Sem<strong>in</strong>ar 7A: <strong>Dairy</strong> Herd Problem Investigation Strategies:Lameness, Cow Comfort, and <strong>Rum<strong>in</strong>al</strong> <strong>Acidosis</strong>Appendix II - Forage Particle Length Determ<strong>in</strong>ation, Penn State Shaker BoxEquipment:Penn State Forage Particle separator box(about $250 USD from Nasco, Farm Catalog)(800/558-9595, www.enasco.com)“Gram” scale with accuracy <strong>of</strong> 0.1 grams, capacity <strong>of</strong> 400 grams(same scale as for gra<strong>in</strong> particle size analysis - see earlier page)Plastic tray to collect and weigh separated feed <strong>in</strong>gredientsprovided with the separator box, or use a plastic food storage conta<strong>in</strong>er that is about 7 <strong>in</strong>ches wideby 4 <strong>in</strong>ches wide by 1 to 2 <strong>in</strong>ches deepSix-cup capacity measur<strong>in</strong>g cupA hard, flat surface for shak<strong>in</strong>g the box(I take a sturdy portable table with a hard top surface with me to the farm)Form to record and calculate results (see attached)Test Procedure:1. Carefully sample the feed – make sure that the sample you are shak<strong>in</strong>g down is representative <strong>of</strong> theentire lot <strong>of</strong> feed.2. Measure 6 cups <strong>of</strong> the forage to be tested. This is critical! We use a plastic, 6-cup kitchen measur<strong>in</strong>gcup for this purpose.3. Place the 6-cup sample on the top screen <strong>of</strong> the shaker box.4. Shake the box a total <strong>of</strong> 40 times – 5 shakes, then rotate 90 degrees, 5 shakes aga<strong>in</strong>, etc. until youhave rotated around the box twice (8 rotations times 5 shakes). Note that one shake is mov<strong>in</strong>g thebox across and back aga<strong>in</strong>. Hold the box as flat as possible when shak<strong>in</strong>g. Shake forcefully enoughthat the feed sample travels completely across the top <strong>of</strong> the first screen. Stroke length for each shakeshould be about 7 <strong>in</strong>ches (17 cm) and 5 shakes should take about 5.5 seconds to complete (1.1 shakesper second).Smaller particles <strong>in</strong> set haylages may adhere to long particles on the top screen. If this happens,gently separate the material on the top screen and shake the sample aga<strong>in</strong>. Do not <strong>in</strong>clude clumps <strong>of</strong>haylage on the top screen as long particles – either break them up by hand or discard them.If long particles <strong>of</strong> forage tip up on end and fall <strong>in</strong>to the next lower screen (or tray), you can manuallymove these particles back to the screen where they belong. For example, particles over 1.5 <strong>in</strong>cheslong should all be on the top screen. This is usually a small number <strong>of</strong> particles.5. Weigh the amount <strong>of</strong> feed present on each <strong>of</strong> the 2 screens and on the bottom tray. Calculate the %coarse particles (% particles on the top screen). Also compare the amount <strong>of</strong> material on the middlescreen to the amount <strong>of</strong> feed on the bottom tray – there should be more particles on the middle screenthan the bottom tray for properly chopped feeds. All <strong>of</strong> these calculations are done on an as-fed basis– it is not necessary to correct the amounts for % dry matter.6. Mean particle length can be calculated based on these results, but the calculations are difficult and notparticularly useful.<strong>University</strong> <strong>of</strong> Wiscons<strong>in</strong>, School <strong>of</strong> Veter<strong>in</strong>ary Medic<strong>in</strong>e, 2015 L<strong>in</strong>den Drive, Madison, WI 53706117
Preconvention Sem<strong>in</strong>ar 7A: <strong>Dairy</strong> Herd Problem Investigation Strategies:Lameness, Cow Comfort, and <strong>Rum<strong>in</strong>al</strong> <strong>Acidosis</strong>Interpretation <strong>of</strong> Particle Length Results:Corn Silage, unprocessed5 to 10 % coarse particles (top screen), andmore particles on middle screen than bottom tray (or screen plus the bottomtray, if your box has the new screen)Corn Silage, processedHaylages, alfalfa or grassTMR’s10 to 20% coarse particles, andmore particles on middle screen than bottom tray (or screen plus the bottomtray, if your box has the new screen)15 to 25% coarse particles, andmore particles on middle screen than bottom tray (or screen plus the bottomtray, if your box has the new screen)7 to 12% coarse particles, andmore particles on middle screen than bottom tray (or screen plus the bottomtray, if your box has the new screen)<strong>University</strong> <strong>of</strong> Wiscons<strong>in</strong>, School <strong>of</strong> Veter<strong>in</strong>ary Medic<strong>in</strong>e, 2015 L<strong>in</strong>den Drive, Madison, WI 53706118
Preconvention Sem<strong>in</strong>ar 7A: <strong>Dairy</strong> Herd Problem Investigation Strategies:Lameness, Cow Comfort, and <strong>Rum<strong>in</strong>al</strong> <strong>Acidosis</strong>Forage Particle Length Determ<strong>in</strong>ations(Penn State Forage Particle Separator)Farm Name:_________________________________________Date:__________Sample Sample SampleAmt. % Amt. % Amt. %Top Top TopMiddle Middle MiddleBottom Bottom BottomTotal Total TotalSample Sample SampleAmt. % Amt. % Amt. %Top Top TopMiddle Middle MiddleBottom Bottom BottomTotal Total TotalSample Sample SampleAmt. % Amt. % Amt. %Top Top TopMiddle Middle MiddleBottom Bottom BottomTotal Total TotalSample Sample SampleAmt. % Amt. % Amt. %Top Top TopMiddle Middle MiddleBottom Bottom BottomTotal Total TotalSample Sample SampleAmt. % Amt. % Amt. %Top Top TopMiddle Middle MiddleBottom Bottom BottomTotal Total Total<strong>University</strong> <strong>of</strong> Wiscons<strong>in</strong>, School <strong>of</strong> Veter<strong>in</strong>ary Medic<strong>in</strong>e, 2015 L<strong>in</strong>den Drive, Madison, WI 53706119