Variable Rate P Application Increases Rice and Soybean Yields
Variable Rate P Application Increases Rice and Soybean Yields
Variable Rate P Application Increases Rice and Soybean Yields

You also want an ePaper? Increase the reach of your titles
YUMPU automatically turns print PDFs into web optimized ePapers that Google loves.
Drs. T. Walker, M. Cox, W. Kingery, S. Martin, L. Oldham, J. Street<strong>Variable</strong> <strong>Rate</strong> P <strong>Application</strong> <strong>Increases</strong><strong>Rice</strong> <strong>and</strong> <strong>Soybean</strong> <strong>Yields</strong>More precise application of P helps maximize yield <strong>and</strong> stabilize productionSummary: Low rice <strong>and</strong> soybean yieldswere associated with low soil P <strong>and</strong>compaction in cut areas. <strong>Variable</strong> rateP application increased whole fieldyield <strong>and</strong> reduced yield variability.Higher crop yields <strong>and</strong> potentiallygreater uptake of applied P should alsoresult in reduced environmental Prisks.Approximately 1.1 million acres ofsoybeans <strong>and</strong> 250,000 acres ofrice were produced in theMississippi Delta region in 2003.Because of the alluvial nature of Deltasoils, the variability in soil properties canbe extensive. In addition to this naturalvariability, the practice of precision l<strong>and</strong>leveling of fields for irrigation purposescan significantly contribute to soil <strong>and</strong>crop variability. Soil <strong>and</strong> crop variabilitythat results from the l<strong>and</strong>-levelingprocess is now being more accuratelyquantified by using precision farming(PF) tools such as differential-correctedglobal positioning systems (DGPS),yield monitors, <strong>and</strong> geographicalinformation systems (GIS).The implementation of PF toolsis not just beneficial to researchers. Ifused correctly, PF tools have the abilityto help producers operate moreefficiently, which often increases cashflow. The use of PF tools has increasedsince the technologies becamecommercially available in the mid-1990s.One important PF tool used by manyrice <strong>and</strong> soybean producers in theMississippi delta is the DGPS yieldmonitor that allows producers to collectenormous amounts of data each year.Many producers, however, havebegun to experience difficulties indata management <strong>and</strong> synthesis afterhaving collected multiple years of yielddata. As a result, implementation of sitespecificpractices designed to help theircrop management programs hasbeen seriously impaired, causing manyproducers to question the feasibility ofthis technology.The objectives of the research asoutlined in this article were to use PFtools to: 1) define zones within a rice/soybean field where yields wereconsistently high, average, or low, 2)determine the factors that cause yieldWinter 2006Fluid Journal 1
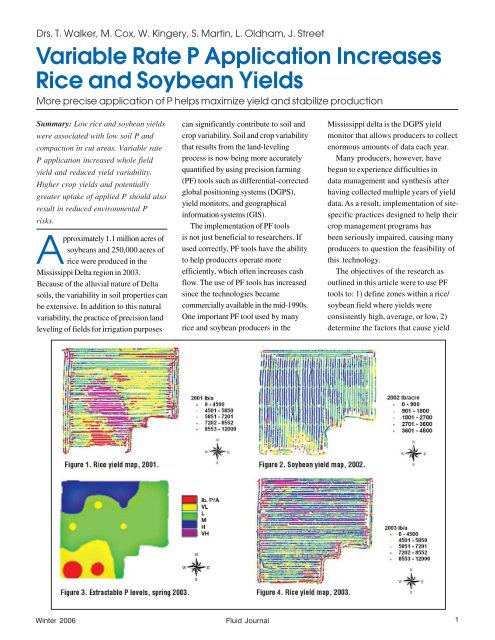
variability <strong>and</strong> address these factors,<strong>and</strong> 3) determine the economicfeasibility of implementing thesetechnologies in a productionenvironment.<strong>Yields</strong><strong>Rice</strong>/soybean. Average rice yield in2001 (Table 1) was highly variable withinthe yield map (Figure 1). Though theyield variability or coefficient ofvariation (C.V.) was much less in thesubsequent soybean crop (Table 1), theapparent yield zones (Figure 2) appearto be consistent with what was seen inthe previous rice crop. The yield zoneconsistency was confirmed byperforming a Multi-Year Yield Analysisin which those management zones weredefined: high yield, average yield, <strong>and</strong>low yield. Soil test P results indicatedthat a P application was warranted overthe majority of the field, but the southernportion of the field had a greaterprobability of obtaining a yieldresponse (Figure 3). Analyses of theyield data collected from the 2003 ricecrop indicated a substantial decrease invariability compared to the 2001 crop(Table 1). Figure 4 indicates a definiteincrease in rice yield in the P-limitingareas of the field as a likely result ofvariable rate (VTR) P application.Weather differences or other factorsmay also have been involved.Our studies also showed that Pfertility may not have been the onlysource of yield variability. Onehypothesis from our data is thatcompaction after precision l<strong>and</strong> levelingmay have been limiting yields the firsttwo years.Further research has additionallyshown a strong correlation betweenYear Crop Average, lbs/A C.V.%2001 <strong>Rice</strong> 6,932 38.92002 <strong>Soybean</strong>s 2,662 23.62003 <strong>Rice</strong> 7,159 2.22Table 1. Crop Yield average <strong>and</strong> coefficientof variation (C.V.) over time.total soil volume that was cut <strong>and</strong> thedifference in yield compared to the fillarea. Thus, a second hypothesis thatmay further define the decrease in fieldvariability from 2001 to 2003 is thatorganic matter additions (e.g., cropstubble) from the previous croppingyear aided in the restoration of thedisturbed microbiological ecology thatwas caused by the l<strong>and</strong>-formingprocess.EconomicsA question that is asked often byproducers when discussing theimplementation of PF is: “Will thistechnology pay for itself?”A cost analysis was conducted forthe field from which these data arereported. When comparing the wholefield average rice yield in 2001 to that of2003, the net increase in grain of 227lbs/A would amount to a net return of$21.44/A.The cost of applying these PFtechnologies would be approximately$16.57/A. The Mississippi StateUniversity Extension Service (MSU-ES)recommends that when fields have beenrecently l<strong>and</strong> leveled, that soil samplesbe r<strong>and</strong>omly collected <strong>and</strong> compositedbased on whether the area has been‘cut’ or ‘filled.’ If this method had beenused, based on the soil samples thatwere collected from areas of ‘cut’ <strong>and</strong>‘fill’, it is highly probable that a blanketapplication of 30 lbs/A of P 2O 5wouldhave been recommended. This wouldhave cost $12.96/A, or $453.60 for the35-acre field. That is less than the costof the VRT-P treatment. However, studiesby MSU scientists indicate that if P hadbeen uniformly applied at therecommended rate, maximum rice yieldswould not have been obtained in thearea of the field where soil test P was inthe very low to low range. Thattheoretically would have resulted in alower whole-field yield average.ConclusionsUse of PF tools (i.e., DGPS yieldmonitors, GIS, grid soil sampling, <strong>and</strong>VTR), coupled with topography maps(i.e., “cut” <strong>and</strong> “fill” maps): 1)successfully defined management zones,2) determined yield limiting factors, <strong>and</strong>3) addressed one of the key limitingfactors: inadequate P fertility. Thesetools decreased whole-field yieldvariability <strong>and</strong> increased total riceproduction.Although there was an added expenseof applying P with VRT, this methodwas more agronomically appropriate.More precise application of P to areasof need helped to maximize yield <strong>and</strong>resulted in more consistent productionof rice within management zones.Dr. Walker is assistant professor ofagronomy at the Delta Research <strong>and</strong>Extension Center in Stoneville, Mississippi,Dr. Cox is associate professor, Dr. Kingeryis professor, <strong>and</strong> Dr. Oldham is associateextension professor, all in the Department ofPlant <strong>and</strong> Soil Sciences at MSU.Dr. Martin is associate extension professorof agricultural economics <strong>and</strong> Dr. Street isextension rice specialist at the DeltaResearch <strong>and</strong> Extension Center in Stoneville.Credit: Better Crops/Vol. 88 (2004, No. 1). ❏Winter 2006 Fluid Journal 2