Exploring North Alabama Exploring North Alabama - Huntsville ...
Exploring North Alabama Exploring North Alabama - Huntsville ...
Exploring North Alabama Exploring North Alabama - Huntsville ...

Create successful ePaper yourself
Turn your PDF publications into a flip-book with our unique Google optimized e-Paper software.
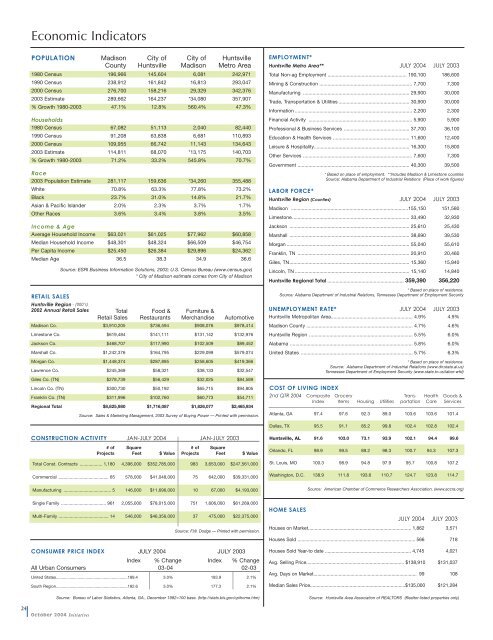
Economic IndicatorsPOPULATION Madison City of City of <strong>Huntsville</strong>County <strong>Huntsville</strong> Madison Metro Area1980 Census 196,966 145,604 6,081 242,9711990 Census 238,912 161,842 16,813 293,0472000 Census 276,700 158,216 29,329 342,3762003 Estimate 289,662 164,237 *34,080 357,907% Growth 1980-2003 47.1% 12.8% 560.4% 47.3%Households1980 Census 67,082 51,113 2,040 82,4401990 Census 91,208 63,838 6,681 110,8932000 Census 109,955 66,742 11,143 134,6432003 Estimate 114,811 68,070 *13,175 140,703% Growth 1980-2003 71.2% 33.2% 545.8% 70.7%Race2003 Population Estimate 281,117 159,636 *34,260 355,488White 70.8% 63.3% 77.8% 73.2%Black 23.7% 31.0% 14.8% 21.7%Asian & Pacific Islander 2.0% 2.3% 3.7% 1.7%Other Races 3.6% 3.4% 3.8% 3.5%Income & AgeAverage Household Income $63,021 $61,025 $77,962 $60,858Median Household Income $48,301 $48,324 $66,509 $46,754Per Capita Income $25,450 $26,384 $29,896 $24,362Median Age 36.5 38.3 34.9 36.6RETAIL SALES<strong>Huntsville</strong> Region - (000’s)2002 Annual Retail SalesSource: ESRI Business Information Solutions, 2003; U.S. Census Bureau (www.census.gov)* City of Madison estimate comes from City of MadisonTotalRetail SalesFood &RestaurantsFurniture &MerchandiseAutomotiveMadison Co. $3,910,205 $736,594 $908,076 $978,414Limestone Co. $619,484 $141,111 $131,142 $132,976Jackson Co. $468,707 $117,990 $102,509 $89,452Marshall Co. $1,242,376 $164,795 $229,099 $579,074Morgan Co. $1,448,374 $287,895 $258,605 $419,366Lawrence Co. $245,369 $58,321 $38,133 $32,547Giles Co. (TN) $278,739 $56,429 $32,025 $84,589Lincoln Co. (TN) $300,730 $50,192 $65,715 $94,805Franklin Co. (TN) $311,996 $102,760 $60,773 $54,711Regional Total $8,825,980 $1,716,087 $1,826,077 $2,465,934Source: Sales & Marketing Management, 2003 Survey of Buying Power — Printed with permission.EMPLOYMENT*<strong>Huntsville</strong> Metro Area** JULY 2004 JULY 2003Total Non-ag Employment .......................................................... 190,100 186,600Mining & Construction .................................................................... 7,700 7,300Manufacturing .............................................................................. 29,900 30,000Trade, Transportation & Utilities .................................................... 30,900 30,000Information ...................................................................................... 2,200 2,300Financial Activity ............................................................................ 5,900 5,900Professional & Business Services ................................................ 37,700 36,100Education & Health Services ........................................................ 11,600 12,400Leisure & Hospitality...................................................................... 16,300 15,800Other Services ................................................................................ 7,600 7,300Government .................................................................................. 40,300 39,500LABOR FORCE** Based on place of employment. **Includes Madison & Limestone countiesSource: <strong>Alabama</strong> Department of Industrial Relations (Place of work figures)<strong>Huntsville</strong> Region (Counties) JULY 2004 JULY 2003Madison ......................................................................................155,150 151,580Limestone...................................................................................... 33,490 32,930Jackson ........................................................................................ 25,610 25,430Marshall ........................................................................................ 38,690 39,530Morgan .......................................................................................... 55,040 55,610Franklin, TN .................................................................................. 20,910 20,460Giles, TN........................................................................................ 15,360 15,840Lincoln, TN .................................................................................... 15,140 14,840<strong>Huntsville</strong> Regional Total ........................................................ 359,390 356,220* Based on place of residence.Source: <strong>Alabama</strong> Department of Industrial Relations, Tennessee Department of Employment SecurityUNEMPLOYMENT RATE* JULY 2004 JULY 2003<strong>Huntsville</strong> Metropolitan Area............................................................ 4.9% 4.9%Madison County .............................................................................. 4.7% 4.6%<strong>Huntsville</strong> Region ............................................................................ 5.5% 6.0%<strong>Alabama</strong> .......................................................................................... 5.8% 6.0%United States .................................................................................. 5.7% 6.3%* Based on place of residence.Source: <strong>Alabama</strong> Department of Industrial Relations (www.dir.state.al.us)Tennessee Department of Employment Security (www.state.tn.us/labor-wfd)COST OF LIVING INDEX2nd QTR 2004 Composite Grocery Trans- Health Goods &Index Items Housing Utilities portation Care ServicesAtlanta, GA 97.4 97.6 92.3 89.0 103.6 103.6 101.4Dallas, TX 95.5 91.1 85.2 99.8 102.4 102.8 102.4CONSTRUCTION ACTIVITY JAN-JULY 2004 JAN-JULY 2003# of Square # of SquareProjects Feet $ Value Projects Feet $ ValueTotal Const. Contracts .................. 1,180 4,396,000 $352,785,000 983 3,653,000 $247,561,000Commercial ........................................ 65 578,000 $41,048,000 75 642,000 $39,331,000<strong>Huntsville</strong>, AL 91.6 103.0 73.1 93.9 102.1 94.4 99.6Orlando, FL 98.9 99.5 89.2 98.3 100.7 94.3 107.3St. Louis, MO 100.3 98.9 94.8 97.9 95.7 100.8 107.2Washington, D.C. 138.9 111.8 193.6 110.7 124.7 123.8 114.7Manufacturing ...................................... 5 146,000 $11,696,000 10 67,000 $4,193,000Source: American Chamber of Commerce Researchers Association. (www.accra.org)Single Family .................................... 961 2,055,000 $78,015,000 751 1,606,000 $61,269,000Multi-Family ........................................ 14 546,000 $46,356,000 37 475,000 $22,375,000HOME SALESJULY 2004 JULY 2003Source: F.W. Dodge — Printed with permission.Houses on Market.............................................................................. 1,862 3,571Houses Sold ......................................................................................... 566 718CONSUMER PRICE INDEX JULY 2004 JULY 2003Index % Change Index % ChangeAll Urban Consumers 03-04 02-03United States...............................................................189.4 3.0% 183.9 2.1%South Region...............................................................182.6 3.0% 177.3 2.1%Houses Sold Year-to date ................................................................. 4,745 4,021Avg. Selling Price.......................................................................... $138,910 $131,037Avg. Days on Market.............................................................................. 99 108Median Sales Price........................................................................$135,000 $121,284Source: Bureau of Labor Statistics, Atlanta, GA., December 1982=100 base. (http://stats.bls.gov/cpihome.htm)Source: <strong>Huntsville</strong> Area Association of REALTORS (Realtor-listed properties only)24October 2004 Initiatives