

Precision of Population Viability Analysis - ResearchGate
Precision of Population Viability Analysis - ResearchGate
Precision of Population Viability Analysis - ResearchGate

Create successful ePaper yourself
Turn your PDF publications into a flip-book with our unique Google optimized e-Paper software.
<strong>Precision</strong> <strong>of</strong> <strong>Population</strong> <strong>Viability</strong> <strong>Analysis</strong>STEPHEN P. ELLNER,*#§ JOHN FIEBERG,* DONALD LUDWIG,† AND CHRIS WILCOX‡*Biomathematics Program, Department <strong>of</strong> Statistics, North Carolina State University, Raleigh, NC 27695–8203, U.S.A.†Department <strong>of</strong> Mathematics, University <strong>of</strong> British Columbia, 1984 Mathematics Road, Vancouver, British ColumbiaV6T 1Z2, Canada‡Environmental Studies Department, 339 Natural Sciences 2, University <strong>of</strong> California, Santa Cruz, CA 95064, U.S.A.Although population viability analysis (PVA) is widely usedin setting conservation policy, there is disagreement aboutthe usefulness <strong>of</strong> this method. Objections have been raisedconcerning the precision <strong>of</strong> predictions in view <strong>of</strong> theshort time series <strong>of</strong> data available and the sensitivity <strong>of</strong> estimates<strong>of</strong> extinction risk to estimated parameters (Hamilton& Moller 1995; Taylor 1995; Groom & Pascual 1998;Ludwig 1999). Beissinger and Westphal (1998) reviewedthe use <strong>of</strong> demographic models for endangered-speciesmanagement. They pointed out that poor data cause difficultiesin parameter estimation, which in turn lead to unreliableestimates <strong>of</strong> extinction risk. There are additionalproblems with model validation, especially if all availabledata have been used to estimate parameters. Beissingerand Westphal (1998) recommend that PVA be used toevaluate relative rather than absolute extinction risk, thatprojections be made only over short time periods, and thatsimple models be used rather than complicated ones. Fiebergand Ellner (2000) showed that values <strong>of</strong> the quasiextinctionprobability—the probability <strong>of</strong> decline to alower population threshold—for a simple model rangebetween 80% and 5% as the value <strong>of</strong> the intrinsic growthrate r varies between 0.03 and 0.02. Such a range inestimates <strong>of</strong> r is common for data sets <strong>of</strong> moderate size.They also show that a precise estimate <strong>of</strong> extinction probabilityover a horizon <strong>of</strong> t years requires between 5t and10t years <strong>of</strong> data, and that similar results hold for agestructuredmodels. In a recent article, Brook et al. (2000)used field data on declining species to test the accuracyand bias <strong>of</strong> PVA models for predicting extinction riskand concluded that “PVA is a valid and sufficiently accuratetool for categorizing and managing endangered species.”We examined the reasons for these differing assessments<strong>of</strong> the value <strong>of</strong> PVA.#Order <strong>of</strong> authorship is alphabetical§Current address: Department <strong>of</strong> Ecology and Evolutionary Biology,and Center for Applied Mathematics, Cornell University, E145 CorsonHall, Ithaca, NY 14853–2701, U.S.A.Paper submitted December 19, 2000; revised manuscript acceptedJuly 9, 2001.258Brook et al. (2000) considered 21 long-term data sets(11–57 years, mean 24.9). They used the first half <strong>of</strong>each set to estimate parameters, with a variety <strong>of</strong> PVAs<strong>of</strong>tware packages. They used the second half <strong>of</strong> eachset to test the predictions <strong>of</strong> each package. The predictionswere tested by comparing the actual and predictednumbers <strong>of</strong> species that declined below a given thresholdabundance, which was defined by specifying a targetrisk level and using the PVA model to identify the correspondingthreshold. They applied a significance test tothese differences between the predicted and actual number<strong>of</strong> species falling below the thresholds, and failed todetect any significant differences (their Table 1 & Fig.1). They applied similar tests to final population sizeswith analogous results.Brook et al. (2000) tested PVA models only on actualfield data, whereas other authors used simulated data.Various methods for testing PVA predictions with fielddata are reviewed by McCarthy and Broome (2000) andMcCarthy et al. (2001). As McCarthy et al. (2001) emphasize,a valid test must be based on data that were notused to fit the model. In view <strong>of</strong> the amount and quality<strong>of</strong> data necessary for parameterizing a complex populationmodel, field data sets adequate for both parameterizingand testing a model will generally be scarce. In contrast,simulated data allow for the replication necessaryto evaluate the precision <strong>of</strong> model-derived estimates relativeto the true extinction risk or population growth rate,which are known exactly for a simulated population. Simulateddata may also have shortcomings. Taylor et al. (2000)discuss the merits <strong>of</strong> using simulated data for model testing.Modern statistical practice requires that every statisticalestimate be accompanied by a measure <strong>of</strong> its precisionif inferences are to be drawn from these estimates(Sokal & Rohlf 1981). This general principle has specialforce for extinction-risk estimates based on PVA, forwhich investigations have repeatedly shown lack <strong>of</strong> precision.For complicated statistical models such as thoseused in PVAs, there may be no way to derive confidenceintervals analytically, but they are readily obtained fromConservation Biology, Pages 258–261Volume 16, No. 1, February 2002
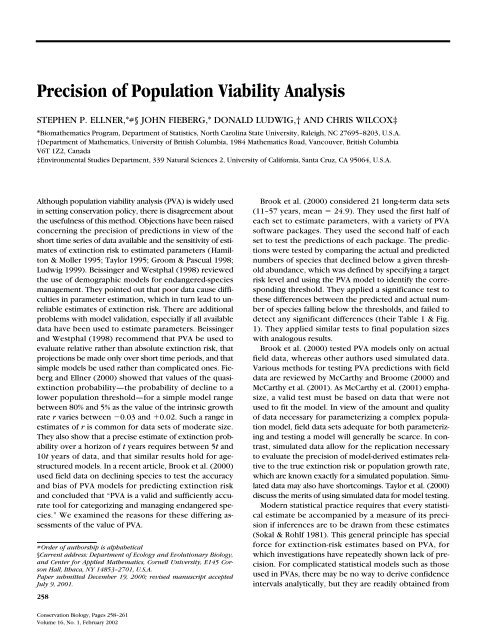
Ellner et al. <strong>Precision</strong> <strong>of</strong> PVA 259simulations. White (2000) and Sæther et al. (2000) showhow to use simulations to obtain confidence intervals forcomplicated models. Alternatively, confidence intervalscan be obtained for some models by repeatedly resamplingreal data (Sokal & Rohlf 1981). Brook et al. (2000)do not estimate confidence intervals for their extinctionriskestimates, leaving the precision <strong>of</strong> their estimates unclear.The tests <strong>of</strong> Brook et al. (2000) are applied to an ensemble<strong>of</strong> species rather than to individual species. Such atest provides information about the bias in the risk estimates,but it provides little information about their precisionbecause the expected total number <strong>of</strong> extinctionsdepends only on the average risk over the ensemble. Weillustrate this distinction with two models ( Fig. 1) basedon Tables 2 and 3 in the supplementary material <strong>of</strong> Brooket al. (2000). The first model ( Fig. 1a & 1b) is the unstructureddensity-independent growth model n(t 1) n(t)exp(r (t )) (the model used for theoretical analyses byDennis et al. [1991] and Fieberg & Ellner [2000]), withr(t) a Gaussian(, 2 ) random variable with 0.044, 0.3. The value <strong>of</strong> is a rounded average over species<strong>of</strong> the values in Brook et al.’s Table 2, and the absolutevalue <strong>of</strong> (0.044) equals the average <strong>of</strong> || overspecies. The second model (Fig. 1c & 1d) is an age-structuredLeslie matrix model with logistic density dependencein neonate survival. The mean and coefficient <strong>of</strong>variation <strong>of</strong> each vital rate for this model were derivedby taking the average <strong>of</strong> the corresponding values foreach species in Brook et al.’s Table 3, and roundingFigure 1. Results from simulatedpopulation viability analyses(PVA) using parameters based onTables 2 and 3 in the supplementarymaterial <strong>of</strong> Brook et al.(2000). (a) Comparison <strong>of</strong> observedand predicted total number<strong>of</strong> extinctions for a set <strong>of</strong> 21 species,as in Fig. 1 <strong>of</strong> Brook et al.(2000), based on the unstructuredmodel described in the text. Fivereplicates are plotted. For each <strong>of</strong>the 105 trials (21 species 5 replicates),we simulated a PVA as describedin the text. (b) Comparison<strong>of</strong> actual and estimated extinctionrisks for each <strong>of</strong> the 105 trials usedin panel (a). Actual extinction riskswere calculated by running 25,000simulations <strong>of</strong> the model using thetrue parameter values and recordingthe fraction <strong>of</strong> runs crossing beloweach estimated threshold from(a). Dashed lines show the tenthand ninetieth percentiles <strong>of</strong> the distributions<strong>of</strong> estimated extinctionrisks. (c) Comparison <strong>of</strong> observedand predicted total number <strong>of</strong> extinctions,as in panel (a), based onthe age-structured, density-dependentmodel described in the text. Allsimulations began with a populationin stable age distribution forthe mean matrix with a populationdensity <strong>of</strong> 500. (d) Comparison <strong>of</strong>actual and estimated extinctionrisks, as in panel (b), for the 105trials with the age-structured, density-dependentmodel.Conservation BiologyVolume 16, No. 1, February 2002
260 <strong>Precision</strong> <strong>of</strong> PVA Ellner et al.slightly. Our model species had juvenile and adultstages, with first breeding at 2 years <strong>of</strong> age and a maximumage <strong>of</strong> 15 years. The mean (coefficient <strong>of</strong> variation) <strong>of</strong>vital rates were as follows: adult annual fecundity, 0.6(40%), juvenile survival, 0.6 (15%), adult survival, 0.75(20%). Gaussian distributions truncated at 0 were used forrandom variations in vital rates. We assumed that neonatesurvival (or, equivalently, adult fecundity) was a function<strong>of</strong> adult density, with the value given above holding at500 adults and decreasing linearly to zero at 1000adults—hence, a maximum adult fecundity <strong>of</strong> 1.2/year atlow adult densities. We assumed that this form <strong>of</strong> densitydependence was known a priori, but the mean and variance<strong>of</strong> the survival rates and maximum fecundity had tobe estimated from data.For each model we simulated a PVA as follows. We assumedn 24 years <strong>of</strong> data and generated 12 simulatedyears <strong>of</strong> data to simulate the data-collection process (i.e.,12 simulated r(t) values for the unstructured model, 12values each <strong>of</strong> adult survival, juvenile survival, and maximumadult fecundity for the age-structured model). We parameterizedthe models by computing the sample meanand standard deviation <strong>of</strong> the simulated data for each vitalrate. We then simulated the parameterized model 25,000times to determine a series <strong>of</strong> quasi-extinction thresholdsyielding extinction risks <strong>of</strong> 5%, 10%, 20%, and so forth, overa 12-year time period. We performed one model run withthe true parameter values for each species, and we recordedthe total number <strong>of</strong> species crossing below each threshold.Figures 1a and 1c are analogous to Fig. 1 <strong>of</strong> Brook etal., showing good agreement between actual and PVA–estimated total number <strong>of</strong> extinctions over ensembles <strong>of</strong>21 test cases. Figures 1b and 1d compare the actual andestimated risks for each species individually. The spreadin individual risk estimates is wide, so these estimates wouldnot be reliable for assessing or comparing individual species.Fig. 1d illustrates that using a more realistic (and thereforemore complicated) model only aggravates the problem,even though the amount <strong>of</strong> data was increased inexact proportion to the larger number <strong>of</strong> parameters inthe more complex model and the density dependencewas assumed to be known a priori. These results showthat the ensemble-level tests <strong>of</strong> Brook et al. (2000) wereinadequate to assess the precision <strong>of</strong> PVA risk estimates.The results <strong>of</strong> Fieberg and Ellner (2000) suggest thatPVA will not be precise unless the sample size greatlyexceeds the prediction interval.There is an additional reason for caution in applyingthe results <strong>of</strong> Brook et al. (2000): their conclusions weredrawn from failure to reject null hypotheses. In such acase, proper inference requires that the size <strong>of</strong> the TypeII error be examined by a power analysis (Peterman 1990;Thompson et al. 2000), but Brook et al. do not provide suchan analysis. The bottom line <strong>of</strong> their Table 1, where errors<strong>of</strong> a factor <strong>of</strong> two too high or too low are not statistically significant,suggests that extremely large differences would berequired to reject the null hypothesis for the 5% extinctionrisk typical <strong>of</strong> published PVAs. This lack <strong>of</strong> power is not dueto poor choice <strong>of</strong> methods but is an unavoidable consequence<strong>of</strong> the scarcity <strong>of</strong> long-term data sets.How useful is PVA, in view <strong>of</strong> its limitations? Thompsonet al. (2000) provide an example to be emulated. They usePVA and power analysis to explore the consequences <strong>of</strong>some management strategies. They base their analysis on arange <strong>of</strong> assumptions about the rate <strong>of</strong> population decline,rather than relying on a single estimated rate. They usepower analysis to determine the length <strong>of</strong> data series requiredto detect the decline. An important feature <strong>of</strong> thisanalysis and others presented in the same special section<strong>of</strong> Conservation Biology is careful accounting for uncertaintyand its consequences for management.Similar uses <strong>of</strong> PVA for comparative purposes take advantage<strong>of</strong> its ability to summarize diverse data and explorethe consequences <strong>of</strong> alternative actions (Groom &Pascual 1998; Burgman & Possingham 2000). For example,Lindenmayer and Possingham (1996) used PVA tocompare timber-management options for conservation<strong>of</strong> Leadbetter’s possum (Gymnobelideus leadbeateri ) insoutheastern Australia and found that the ranking amongthe options was robust to parameter and model uncertainties.This is quite different from attempting to makequantitative predictions <strong>of</strong> extinction risk based onsmall data sets. It is limited, however, to within-speciescomparisons <strong>of</strong> relative risk under different managementscenarios. When a comparison between species is attempted—forexample, to assay which has the greatestneed for immediate intervention—the uncertainties inthe absolute risk estimates for each species are likely tobe too high for such comparisons to be meaningful.Brook et al. (2000) tested predictions over an averagetime interval <strong>of</strong> about 13 years, so their results are relevantto 10- and 20-year time frames used for World ConservationUnion listing <strong>of</strong> critically endangered and endangeredspecies. Such short-term predictions can beimportant for formulating a management framework. Butpublished PVAs generally have used much longer time intervals,50–200 years, with 100 years the most common( Beissinger & Westphal 1998; Fieberg & Ellner 2001). Asour results indicate, risk estimates for longer time intervalsare increasingly imprecise, with most estimates nearzero or 1 because the predicted long-term risk is extremelysensitive to the estimated mean growth rate ( Dennis et al.1991; Ludwig 1999; Fieberg & Ellner 2000).Coulson et al. (2001) raise additional concerns about theconclusions <strong>of</strong> Brook et al. (2000). They caution thatdata for most threatened or endangered species will besparse and <strong>of</strong> lower quality than the data sets analyzedby Brook et al. Furthermore, they argue that predictionsare likely to be accurate only if future mean and variation<strong>of</strong> vital rates or population growth will be similar tothe data used to parameterize the model. <strong>Population</strong>sthat are subject to rare high-recruitment events or cata-Conservation BiologyVolume 16, No. 1, February 2002
Ellner et al. <strong>Precision</strong> <strong>of</strong> PVA 261strophic mortalities will therefore provide additional difficultieswith regard to model parameterization and reliability.In summary, the results <strong>of</strong> Brook et al. (2000) arenot sufficient to justify PVA as an accurate tool for categorizingindividual species, even for short (10- to 20-year) time intervals. Their results provide evidence (subjectto concerns about power) that risk and growth rateestimates are unbiased, which implies that PVA could beuseful in predicting the total loss rate for a large group<strong>of</strong> species.For assessment <strong>of</strong> individual species, it is essential toaccount for imprecision in parameter estimates and its consequencesfor risk assessment. A variety <strong>of</strong> tools are available.We have already mentioned confidence intervals onthe risk <strong>of</strong> extinction within a given time horizon. An analogoustool is prediction intervals for the time to extinction( Engen & Sæther 2000), but methods to computethese are available only for very simple models. Alternatively,extinction probabilities can be calculated for therange <strong>of</strong> plausible parameter values by Bayesian methods( Ludwig 1996). Similarly, using frequentist methodology,one can calculate the level <strong>of</strong> confidence that the trueprobability <strong>of</strong> extinction is less than any value (essentiallya p value associated with the true probability <strong>of</strong> extinction).One may then display the range <strong>of</strong> likely extinctionprobabilities or weight them by a measure <strong>of</strong> their plausibilityin light <strong>of</strong> the data. A weighting procedure has themerit <strong>of</strong> producing a single measure <strong>of</strong> risk, but this measureis sensitive to various assumptions made in the assessmentprocess. Perhaps a better strategy would be to producea prediction interval for the population size over theentire time horizon <strong>of</strong> interest, taking into account uncertaintyin parameter estimates (as described by Sæther et al.2000). This eliminates the subjective choices <strong>of</strong> a specifictime horizon and quasi-extinction threshold for computingan extinction risk. <strong>Population</strong> viability analysis may thenbe one useful tool among a variety <strong>of</strong> decision-making aids,which might include historical and predicted future habitatlosses, recent population trends, and genetic considerations.As is <strong>of</strong>ten the case with important environmental problems,even the best available science may be unable to provide thelevel <strong>of</strong> predictability and accuracy we might wish.AcknowledgmentsWe thank M. Mangel for his stimulating input in the preparation<strong>of</strong> this paper, and H. Possingham and an anonymousreferee for comments on the manuscript.Literature CitedBeissinger, S. R., and M. I. Westphal. 1998. On the use <strong>of</strong> demographicmodels <strong>of</strong> population viability in endangered species management.Journal <strong>of</strong> Wildlife Management 62:821–841.Brook, B. W., J. J. O’Grady, A. P. Chapman, M. A. Burgman, R. Akcakaya,and R. Frankham. 2000. Predictive accuracy <strong>of</strong> populationviability analysis in conservation biology. Nature 404:385–387.Burgman, M., and H. P. Possingham, 2000. <strong>Population</strong> viability analysisfor conservation: the good, the bad and the undescribed. Pages 97–112 in A. G. Young and G. M. Clarke, editors. Genetics, demographyand viability <strong>of</strong> fragmented populations. Cambridge UniversityPress, Cambridge, United Kingdom.Coulson, T., G. M. Mace, E. Hudson, and H. Possingham. 2001. The useand abuse <strong>of</strong> population viability analysis. Trends in Ecology andEvolution 16:219–221.Dennis, B., P. L. Mulholland, and J. M. Scott. 1991. Estimation <strong>of</strong>growth and extinction parameters for endangered species. EcologicalMonographs 61:115–143.Engen, S., and B-E. Sæther. 2000. Predicting the time to quasi-extinctionfor populations far below their carrying capacity. Journal <strong>of</strong>Theoretical Biology 205:649–658.Fieberg, J., and S. P. Ellner. 2000. When is it meaningful to estimate anextinction probability? Ecology 81:2040–2047.Fieberg, J., and S. P. Ellner. 2001. Stochastic matrix models for conservationbiology: a comparative review <strong>of</strong> methods. Ecology Letters4:244–266.Groom, M. J., and M. A. Pascual. 1998. The analysis <strong>of</strong> population persistence:an outlook on the practice <strong>of</strong> viability analysis. Pages 4–27in P. L. Fiedler and P. M. Kareiva, editors. Conservation biology.2nd edition. Chapman and Hall, New York.Hamilton, S., and H. Moller 1995. Can PVA models using computerpackages <strong>of</strong>fer useful conservation advice? Sooty ShearwatersPuffinus griseus in New Zealand as a case study. Biological Conservation73:107–117.Lindenmayer, D. B., and H. P. Possingham. 1996. Ranking conservationand timber management options for Leadbeater’s possum insoutheastern Australia using population viability analysis. ConservationBiology 10:235–251.Ludwig, D. 1996. Uncertainty and the assessment <strong>of</strong> extinction probabilities.Ecological Applications 6:1067–1076.Ludwig, D. 1999. Is it meaningful to estimate a probability <strong>of</strong> extinction?Ecology 80: 298–310.McCarthy, M. A., and L. S. Broome. 2000. A method for validating stochasticmodels <strong>of</strong> population viability: a case study <strong>of</strong> the mountainpygmy-possum (Burramys parvus). Journal <strong>of</strong> Animal Ecology 69:599–607.McCarthy, M. A., H. P. Possingham, J. R. Day, and A. J. Tyre. 2001.Testing the accuracy <strong>of</strong> population viability analysis. ConservationBiology 15:1030–1038.Peterman, R. M. 1990. Statistical power analysis can improve fisheriesresearch and management. Canadian Journal <strong>of</strong> Fisheries andAquatic Sciences 47:2–15.Sæther, B-E., S. Engen, R. Lande, P. Arcese, and J. N. M. Smith. 2000.Estimating the time to extinction in an island population <strong>of</strong> SongSparrows. Proceedings <strong>of</strong> the Royal Society <strong>of</strong> London, Series B267:621–626.Sokal, R., and F. J. Rohlf. 1981. Biometry. 2nd edition. W. H. Freeman,San Francisco.Taylor, B. L. 1995. The reliability <strong>of</strong> using population viability analysisfor risk classification <strong>of</strong> species. Conservation Biology 9:551–558.Taylor, B. L., S. J. Chivers, S. Sexton, and A. Dizon. 2000. Evaluatingdispersal estimates using mtDNA data: comparing analytical andsimulation approaches. Conservation Biology 14:1287–1297.Thompson, P. M., B. Wilson, K. Grellier, and P. S. Hammond. 2000.Combining power analysis and population viability analysis to comparetraditional and precautionary approaches to conservation <strong>of</strong>coastal cetaceans. Conservation Biology 14:1253–1263.White, G. 2000. <strong>Population</strong> viability analysis: data requirements and essentialanalyses. Pages 288–331 in L. Boitani and T. K. Fuller, editors.Research techniques in animal ecology: controversies andconsequences. Columbia University Press, New York.Conservation BiologyVolume 16, No. 1, February 2002