San Antonio Region Freight Study - Welcome to the Texas ...
San Antonio Region Freight Study - Welcome to the Texas ...
San Antonio Region Freight Study - Welcome to the Texas ...

You also want an ePaper? Increase the reach of your titles
YUMPU automatically turns print PDFs into web optimized ePapers that Google loves.
ACKNOWLEDGMENTSThe <strong>San</strong> <strong>An<strong>to</strong>nio</strong> <strong>Region</strong> <strong>Freight</strong> <strong>Study</strong> could not be undertaken without <strong>the</strong>cooperative participation of public, private, and governmental representatives from<strong>the</strong> <strong>San</strong> <strong>An<strong>to</strong>nio</strong> region, <strong>the</strong> State of <strong>Texas</strong>, <strong>the</strong> Union Pacific Railroad, and <strong>the</strong>BNSF Railway Company.Members of <strong>the</strong> Stakeholder and Technical Advisory committees who haveparticipated and contributed <strong>to</strong> this study are listed as follows:‣ Judge Nelson Wolff---Countyof Bexar‣ David Casteel---TxDOT, <strong>San</strong><strong>An<strong>to</strong>nio</strong> District‣ Scott Moore---Union Pacific‣ Rollin Bredenberg---BNSFRailway‣ Bruce Flohr ---TechCommittee‣ Julie Brown---TxDOT <strong>San</strong><strong>An<strong>to</strong>nio</strong> District‣ Gwen Young---UTSA-ESEDepartment‣ Ted West---FHWA‣ Joanne Walsh---SA-BC MPO‣ Jim Brannan---Bexar County‣ Leilah Powell---Bexar County‣ Vic Boyer---SAMCO‣ Nick Page---SA-BC MPO‣ Harrison Grindle---Kelly USA‣ Leroy Alloway---COSA-CityCouncil District 8‣ Jeanne Geiger---SA-BC MPO‣ Christina DeLaCruz---COSA-Public Works‣ Anthony Stuart---Sena<strong>to</strong>rLeticia Van de Putte‣ Emil R. Monciavias---City of<strong>San</strong> <strong>An<strong>to</strong>nio</strong>‣ Todd Hemingson---Via MetroTransit‣ Xamara Caballero---StateRepresentative Robert Puente‣ O’Lene S<strong>to</strong>ne---USRepresentative Lamar Smith‣ Jennifer Moczygemba---TxDOT TPP MultimodalSection‣ Sid Martinez---SA-BC MPO‣ Seth Mitchell---Bexar County
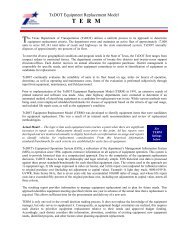
<strong>San</strong> <strong>An<strong>to</strong>nio</strong> <strong>Region</strong> <strong>Freight</strong> <strong>Study</strong>Executive SummaryEXECUTIVE SUMMARYThis report is intended <strong>to</strong> provide <strong>the</strong> State, local governing agencies, privatepartners, and <strong>the</strong> metropolitan planning organization with a description of regionalfreight movements and an examination of alternatives <strong>to</strong> accommodate andcapitalize on present and future freight movements.It identifies improvements that may provide relief <strong>to</strong> residents and <strong>the</strong> traveling publicadversely affected by delays, interruptions, and noise attributed <strong>to</strong> <strong>the</strong> movement offreight within <strong>the</strong> region. It also identifies alternatives that may improve regionalfreight rail capacity by enhancing <strong>the</strong> efficiency and operations of <strong>the</strong> railroads.This report identifies improvements for <strong>the</strong> 12-county region comprising TxDOT’s<strong>San</strong> <strong>An<strong>to</strong>nio</strong> District as well as Hays, Travis, and Williamson Counties of <strong>the</strong> AustinDistrict. The potential improvements may be categorized as follows:‣ Grade Separations (bridges <strong>to</strong> separate <strong>the</strong> railroad from streets)‣ Grade Crossing Closures (closing and rerouting <strong>the</strong> street at <strong>the</strong> intersectionwith <strong>the</strong> railroad)‣ Improvements <strong>to</strong> Existing Railroad Infrastructure (improving capacity andconnectivity on existing rail lines)‣ New Railroad Corridors (possible bypass routes)It is anticipated that <strong>the</strong> <strong>San</strong> <strong>An<strong>to</strong>nio</strong> region will study this report and add, subtract,modify, and use <strong>the</strong> findings <strong>to</strong> develop a regional freight plan.<strong>Freight</strong> Movement and OperationsOver <strong>the</strong> next 20 years truck and rail freight <strong>to</strong>nnage are projected <strong>to</strong> more thandouble within <strong>the</strong> <strong>San</strong> <strong>An<strong>to</strong>nio</strong> region. Heavy trucks will continue <strong>to</strong> provide bothlocal and regional service. A number of intermodal facilities located within <strong>the</strong> regionuse trucks <strong>to</strong> ship goods <strong>to</strong> local businesses and warehouses as well as regionallocations. As a result of forecasted population and freight movement growth multiplesegments of interstate, U.S., and state highways are projected <strong>to</strong> experience highcongestion (exceeding <strong>the</strong>ir capacities) in <strong>the</strong> future. Examples of such roadwaysinclude I-35 north of I-410, I-37 north of I-410, I-410 east of US 281, and Loop 1604northwest of <strong>San</strong> <strong>An<strong>to</strong>nio</strong>.There are five major rail lines owned and operated by <strong>the</strong> Union Pacific Railroad(UP), with over 420 miles of single track mainline in <strong>the</strong> <strong>San</strong> <strong>An<strong>to</strong>nio</strong> area and threeactive rail yards in <strong>the</strong> region (Kirby Yard, East Yard, and So<strong>San</strong> Yard). A fourth, yetunnamed, yard will soon be constructed <strong>to</strong> <strong>the</strong> southwest of <strong>San</strong> <strong>An<strong>to</strong>nio</strong> <strong>to</strong> handleintermodal freight movement in<strong>to</strong> <strong>San</strong> <strong>An<strong>to</strong>nio</strong> <strong>to</strong> and from Mexico and <strong>the</strong> WestCoast ports. The rail inven<strong>to</strong>ry also includes approximately 895 at-grade highwayrailcrossings along <strong>the</strong> railroad mainlines, and over nine miles of railroad bridgestructures. The existing rail network in <strong>San</strong> <strong>An<strong>to</strong>nio</strong> is shown in Figure 1.i
<strong>San</strong> <strong>An<strong>to</strong>nio</strong> <strong>Region</strong> <strong>Freight</strong> <strong>Study</strong>Executive SummaryFigure 1: <strong>San</strong> <strong>An<strong>to</strong>nio</strong> Rail Networkii
<strong>San</strong> <strong>An<strong>to</strong>nio</strong> <strong>Region</strong> <strong>Freight</strong> <strong>Study</strong>Executive SummaryFrom January 2000 through December 2005, <strong>the</strong> 12-county region experienced 128highway-rail at-grade crossing accidents, in which <strong>the</strong>re were 14 fatalities and 78injuries. 1 As might be expected, over 80% of <strong>the</strong>se incidents and nearly 80% of allfatalities occurred at public at-grade crossings. The grade separations and crossingclosures identified in this report may significantly improve public safety at roadwayrailcrossings in <strong>the</strong> region if <strong>the</strong>y are developed.Approximately 100 trains per day travel within <strong>the</strong> <strong>San</strong> <strong>An<strong>to</strong>nio</strong> region and areasextending north <strong>to</strong> Taylor and east <strong>to</strong> Fla<strong>to</strong>nia. A significant volume of <strong>the</strong> rail freightmoving in<strong>to</strong> and/or out of <strong>San</strong> <strong>An<strong>to</strong>nio</strong> does not originate or terminate <strong>the</strong>re; but isonly in <strong>San</strong> <strong>An<strong>to</strong>nio</strong> <strong>to</strong> be switched or classified in<strong>to</strong> ano<strong>the</strong>r train destinedelsewhere, or for movement on<strong>to</strong> ano<strong>the</strong>r mainline that traverses <strong>the</strong> <strong>San</strong> <strong>An<strong>to</strong>nio</strong>area.It is estimated that approximately 70 <strong>to</strong> 75 percent of <strong>the</strong> trains moving in<strong>to</strong>/out of<strong>San</strong> <strong>An<strong>to</strong>nio</strong> perform operations such as dropping off or picking up rail cars,maintenance services, fueling, and crew changes at So<strong>San</strong> Yard, located near <strong>the</strong>Port Authority of <strong>San</strong> <strong>An<strong>to</strong>nio</strong> (formerly Kelly USA). East Yard is primarily used asan industrial service yard for local and regional cus<strong>to</strong>mers. North-south trainsterminating in <strong>San</strong> <strong>An<strong>to</strong>nio</strong> <strong>the</strong>refore typically do so at East Yard, located north of <strong>the</strong>Alamo Dome and <strong>the</strong> Amtrak Station. Kirby Yard, located east of <strong>San</strong> <strong>An<strong>to</strong>nio</strong> nearKirby, is a crew change point as well as in-line fueling facility. Kirby Yard is alsoequipped for unloading au<strong>to</strong> racks and provides some local service.Although not a direct indication of <strong>the</strong> location of each and every cus<strong>to</strong>mer within<strong>San</strong> <strong>An<strong>to</strong>nio</strong>’s IH-410 loop, Figure 2 shows <strong>the</strong> general locations of existing industryand spur tracks that connect <strong>to</strong> <strong>the</strong> main tracks that could serve rail cus<strong>to</strong>mers. Incomparison <strong>to</strong> a Terminal network such as in <strong>the</strong> Hous<strong>to</strong>n region, <strong>the</strong>re are relativelyfew cus<strong>to</strong>mers located in <strong>the</strong> down<strong>to</strong>wn area.1 Federal Railroad Administration, 2000 – 2005 highway-rail at-grade crossing safety statistics.iii
<strong>San</strong> <strong>An<strong>to</strong>nio</strong> <strong>Region</strong> <strong>Freight</strong> <strong>Study</strong>Executive SummaryFigure 2: Approximate Industry/Cus<strong>to</strong>mer and Spur Track LocationsIdentified ImprovementsAt an estimated cost of $924 million, 66 identified grade separations would separateexisting railroad lines from major streets in <strong>the</strong> <strong>San</strong> <strong>An<strong>to</strong>nio</strong> District, <strong>the</strong>reby reducingsafety hazards and delays. Additionally, 26 existing at-grade crossings wereidentified as potential grade separations within <strong>the</strong> Austin District counties for a cos<strong>to</strong>f $238 million. For <strong>the</strong> citizens in <strong>San</strong> <strong>An<strong>to</strong>nio</strong>’s inner city neighborhoods, <strong>the</strong>seprojects could provide relief from blocked intersections and backed-up vehicles on<strong>the</strong> streets. The improvements could also improve safety by allowing emergencyand law enforcement vehicles <strong>to</strong> respond without delay, while improving <strong>the</strong> qualityof life for residents in <strong>the</strong> impacted neighborhoods. The estimated public benefitvalue of <strong>the</strong> identified grade separations in <strong>the</strong> <strong>San</strong> <strong>An<strong>to</strong>nio</strong> and Austin Districts<strong>to</strong>tals more than $1.1 billion.Also identified are 65 locations where existing grade crossings may be closed withan estimated cost of $3.3 million in <strong>the</strong> <strong>San</strong> <strong>An<strong>to</strong>nio</strong> District and 4 crossings in <strong>the</strong>Austin District for an estimated cost of $200 thousand. These safety improvementsminimize conflict points between trains and cars by closing crossings andencouraging mo<strong>to</strong>rists <strong>to</strong> use grade separated roadways, or alternate streets, whichhave better safety systems in place. The estimated public benefit value for <strong>the</strong>crossing closures <strong>to</strong>tals more than $92.2 million.iv
<strong>San</strong> <strong>An<strong>to</strong>nio</strong> <strong>Region</strong> <strong>Freight</strong> <strong>Study</strong>Executive SummaryIn addition <strong>to</strong> improvements addressing safety <strong>to</strong> <strong>the</strong> traveling public, <strong>the</strong> report alsoidentifies 28 rail capacity improvements, at an estimated cost of $183 million. Threepossible bypass routes at estimated costs ranging from nearly $1.37 billion <strong>to</strong>approximately $2.42 billion were also investigated.Rail capacity enhancements augment economic growth of <strong>the</strong> region by improving<strong>the</strong> efficiency of freight rail operations as well as minimizing disturbances <strong>to</strong>residents, thus improving <strong>the</strong>ir quality of life. Improvements <strong>to</strong> <strong>the</strong> rail system relievecongestion along existing rail corridors, permitting <strong>the</strong> trains <strong>to</strong> pass through <strong>the</strong>region more quickly. The rail improvements analyzed can be categorized as follows:‣ Adding a mainline track‣ Adding track adjacent <strong>to</strong> existing mainlines at strategic locations <strong>to</strong> allowtrains <strong>to</strong> pass one ano<strong>the</strong>r or <strong>to</strong> idle without causing delays‣ Constructing connections from one rail line <strong>to</strong> ano<strong>the</strong>r <strong>to</strong> improve rail trafficmobility‣ Expanding rail yard capacity‣ Relocating rail yards and/or facilities that accommodate trailers andcontainers by ship, rail, and truck referred <strong>to</strong> as “intermodal facilities”Certain rail improvements were determined <strong>to</strong> warrant fur<strong>the</strong>r analysis and weregrouped in<strong>to</strong> separate planning cases. In general, <strong>the</strong> planning cases consisted of:‣ Planning Case A (PC A) – <strong>San</strong> <strong>An<strong>to</strong>nio</strong> rail bypass between Seguin andMacdona with new rail yards at Marion and Macdona‣ Planning Case B1 (PC B1) – Austin rail bypass between Taylor and Seguinwith a new intermodal yard at Macdona, trains routed on <strong>the</strong> Del RioSubdivision between East Yard and Tower 112‣ Planning Case B2 (PC B2) – Austin rail bypass between Taylor and Seguinwith a new intermodal yard at Macdona, trains routed on <strong>the</strong> Austin Mainline 2Subdivision between East Yard and Tower 112‣ Planning Case C (PC C) – Combined <strong>San</strong> <strong>An<strong>to</strong>nio</strong> and Austin rail bypassbetween Taylor and Macdona with new rail yards at Marion and Macdona‣ Planning Case 1 (PC 1) – tested improvements in order <strong>to</strong> addressoperational efficiency with <strong>the</strong> installation of a second mainline route in andout of So<strong>San</strong> Yard‣ Planning Case 2 (PC 2) - tested improvements in order <strong>to</strong> addressoperational efficiency with <strong>the</strong> installation and completion of a secondmainline route between East Yard and Kirby Yard‣ Planning Case 3 (PC 3) - tested improvements <strong>to</strong> address network fluidity andcapacity‣ Planning Case 4 (PC 4) - tested improvements <strong>to</strong> improve meet/passefficiency and reduce train delaysEstimated costs, as well as public and private benefits for each planning case areshown in Table 1. As shown in <strong>the</strong> table, Planning Case C has <strong>the</strong> highest <strong>to</strong>talv
<strong>San</strong> <strong>An<strong>to</strong>nio</strong> <strong>Region</strong> <strong>Freight</strong> <strong>Study</strong>Executive Summarypublic benefit <strong>to</strong> cost ratio as well as <strong>the</strong> highest <strong>to</strong>tal benefit <strong>to</strong> cost ratio. Theestimated private benefit is largely due <strong>to</strong> savings in run time and delay time over <strong>the</strong>20-year period.PlanningCaseEstimated CostEstimatedPublic BenefitRatio: PublicBenefit/CostEstimated Ratio: PrivatePrivate Benefit Benefit/ CostEstimated TotalBenefitRatio: TotalBenefit/CostA $ 1,369,610,000 $ 504,790,000 0.37 $ (162,860,000) -0.12 $ 341,930,000 0.25B1 $ 1,595,850,000 $ 587,100,000 0.37 $ 161,990,000 0.10 $ 749,090,000 0.47B2 $ 1,741,260,000 $ 843,460,000 0.48 $ 157,890,000 0.09 $ 1,001,350,000 0.58C $ 2,423,510,000 $1,424,950,000 0.59 $ 95,490,000 0.04 $ 1,520,440,000 0.631 $ 9,260,000 NA NA $ 670,000 0.07 $ 670,000 0.072 $ 21,060,000 NA NA $ 14,820,000 0.70 $ 14,820,000 0.703 $ 25,740,000 NA NA $ 16,450,000 0.64 $ 16,450,000 0.644 $ 35,130,000 NA NA $ 15,310,000 0.44 $ 15,310,000 0.44Estimated public and private benefits are based on a 20-year study period.Table 1: Planning Case Estimated Cost and Benefits SummaryThe planning cases are described in fur<strong>the</strong>r detail in <strong>the</strong> following pages.Planning Case APlanning Case A analyzed a possible <strong>San</strong> <strong>An<strong>to</strong>nio</strong> bypass and new yards at Marionand Macdona. The <strong>San</strong> <strong>An<strong>to</strong>nio</strong> bypass alternative consists of a potential newdouble track rail corridor that would bypass <strong>San</strong> <strong>An<strong>to</strong>nio</strong> between Seguin (where <strong>the</strong>bypass would connect <strong>to</strong> <strong>the</strong> existing Glidden Subdivision line) and Macdona (where<strong>the</strong> bypass would connect <strong>to</strong> <strong>the</strong> existing Del Rio Subdivision). The new yard atMarion would replace most of <strong>the</strong> activities currently completed at East Yard. Thenew yard at Macdona would serve as a fueling facility for through-trains. Theconceptual location of <strong>the</strong> possible <strong>San</strong> <strong>An<strong>to</strong>nio</strong> bypass is shown in Figure 3. Theestimated cost of Planning Case A is approximately $1.37 billion, including <strong>the</strong> cos<strong>to</strong>f grade separating select roadway-railroad crossings along <strong>the</strong> possible bypassroute.Trains that could be rerouted <strong>to</strong> <strong>the</strong> possible <strong>San</strong> <strong>An<strong>to</strong>nio</strong> bypass consist of throughtrainsprimarily from <strong>the</strong> Glidden and Del Rio Subdivisions, coal trains that serveregional power plants, and intermodal trains that are currently serviced at ei<strong>the</strong>rSo<strong>San</strong> or East Yards. However, local service trains, rock trains <strong>to</strong> and from Hunter(north of <strong>San</strong> <strong>An<strong>to</strong>nio</strong>), passenger trains (Amtrak <strong>Texas</strong> Eagle and Sunset Limitedroutes), and international freight from Laredo that is destined for So<strong>San</strong> Yard wouldremain on existing rail lines.vi
<strong>San</strong> <strong>An<strong>to</strong>nio</strong> <strong>Region</strong> <strong>Freight</strong> <strong>Study</strong>Executive SummaryFigure 3: Possible <strong>San</strong> <strong>An<strong>to</strong>nio</strong> Bypass(note: conceptual bypass route shown is for illustrative purposes only)Planning Case BPlanning Cases B1 and B2 each analyzed <strong>the</strong> base case plus an Austin bypass witha new intermodal yard at Macdona. The Austin bypass is a potential new railcorridor between Taylor (where <strong>the</strong> bypass would connect <strong>to</strong> <strong>the</strong> existing AustinSubdivision line) and Seguin (where <strong>the</strong> bypass would connect <strong>to</strong> <strong>the</strong> existingGlidden Subdivision) that would bypass Austin, <strong>San</strong> Marcos, and o<strong>the</strong>r <strong>to</strong>wns. Theconceptual location of an Austin bypass is shown in Figure 4.In Planning Case B1, trains were routed via <strong>the</strong> existing Del Rio Subdivisionbetween <strong>the</strong> possible Austin bypass connection in Seguin and railroad Tower 112,which is how trains are currently routed under existing conditions. Planning Case B1also includes upgrades <strong>to</strong> existing track between Seguin and East Yard as well asbetween Tower 112 and So<strong>San</strong> Yard. The estimated cost of Planning Case B1 is$1.6 billion, including <strong>the</strong> cost of identified grade separated roadway-railroadcrossings.In Planning Case B2, trains were routed via <strong>the</strong> existing Austin Subdivision Mainline2 between <strong>the</strong> possible Austin bypass connection in Seguin and railroad Tower 112.Planning Case B2 would require <strong>the</strong> construction of a new wye connection betweenvii
<strong>San</strong> <strong>An<strong>to</strong>nio</strong> <strong>Region</strong> <strong>Freight</strong> <strong>Study</strong>Executive Summary<strong>the</strong> Del Rio Subdivision and Austin Subdivision Mainline 2 as well as <strong>the</strong> gradeseparation or closure of <strong>the</strong> three at-grade crossings between <strong>the</strong> wye and Tower112. Planning Case B2 also includes upgrades <strong>to</strong> existing track between Seguinand <strong>the</strong> possible new wye connection along <strong>the</strong> Del Rio Subdivision, between <strong>the</strong>wye and Tower 112 on <strong>the</strong> Austin Subdivision Mainline 2, and between Tower 112and So<strong>San</strong> Yard on <strong>the</strong> Del Rio Subdivision. The estimated cost of Planning CaseB2 is $1.74 billion, including <strong>the</strong> cost of identified grade separated roadway-railroadcrossings.Figure 4: Possible Austin Bypass(note: conceptual bypass route shown is for illustrative purposes only)Planning Case CPlanning Case C analyzed <strong>the</strong> base case plus <strong>the</strong> <strong>San</strong> <strong>An<strong>to</strong>nio</strong> and Austin bypassesand new yards at Marion and Macdona. The Austin bypass in conjunction with <strong>the</strong><strong>San</strong> <strong>An<strong>to</strong>nio</strong> bypass would allow through-trains that are typically routed on <strong>the</strong> UPAustin, Glidden, Del Rio, Laredo, Corpus Christi, Rockport, and LockhartSubdivisions <strong>to</strong> be rerouted on<strong>to</strong> <strong>the</strong> bypass away from large metropolitan areas.The conceptual location of <strong>the</strong> possible Austin-<strong>San</strong> <strong>An<strong>to</strong>nio</strong> bypass is shown inFigure 5. The estimated cost of Planning Case C is more than $2.42 billion,viii
<strong>San</strong> <strong>An<strong>to</strong>nio</strong> <strong>Region</strong> <strong>Freight</strong> <strong>Study</strong>Executive Summaryincluding <strong>the</strong> cost of grade separating select roadway-railroad crossings along <strong>the</strong>possible bypass route.Although Amtrak passenger trains, rock trains, au<strong>to</strong> trains destined for Kirby Yard in<strong>San</strong> <strong>An<strong>to</strong>nio</strong>, local service trains, and a minimal number of coal trains must remainon <strong>the</strong> existing rail lines, all o<strong>the</strong>r trains on <strong>the</strong> network may be able <strong>to</strong> be rerouted <strong>to</strong><strong>the</strong> Austin-<strong>San</strong> <strong>An<strong>to</strong>nio</strong> bypass route.ix
<strong>San</strong> <strong>An<strong>to</strong>nio</strong> <strong>Region</strong> <strong>Freight</strong> <strong>Study</strong>Executive SummaryFigure 5: Possible Austin-<strong>San</strong> <strong>An<strong>to</strong>nio</strong> Bypass(note: conceptual bypass route shown is for illustrative purposes only)x
<strong>San</strong> <strong>An<strong>to</strong>nio</strong> <strong>Region</strong> <strong>Freight</strong> <strong>Study</strong>Executive SummaryPlanning Case 1Planning Case 1, as shown in Figure 6, includes rail improvements tested in order <strong>to</strong>address operational efficiency with <strong>the</strong> installation of a second mainline route in andout of So<strong>San</strong> Yard. This allows traffic a straight route between So<strong>San</strong>, Wi<strong>the</strong>rs, andAlamo Junction. Planning Case 1 is estimated <strong>to</strong> cost $9.3 million.Figure 6: Planning Case 1 Improvementsxi
<strong>San</strong> <strong>An<strong>to</strong>nio</strong> <strong>Region</strong> <strong>Freight</strong> <strong>Study</strong>Executive SummaryPlanning Case 2Planning Case 2, as shown in Figure 7, includes <strong>the</strong> improvements of Planning Case1 with <strong>the</strong> addition of rail improvements tested in order <strong>to</strong> address operationalefficiency with <strong>the</strong> installation and completion of a second mainline route betweenEast Yard and Kirby Yard. The new siding and switches at Toyota would allow for apassing siding for train meets, keeping <strong>the</strong> Corpus Christi Subdivision available forthrough-train movements. Planning Case 2 is estimated <strong>to</strong> cost $21 million.Figure 7: Planning Case 2 Improvementsxii
<strong>San</strong> <strong>An<strong>to</strong>nio</strong> <strong>Region</strong> <strong>Freight</strong> <strong>Study</strong>Executive SummaryPlanning Case 3Planning Case 3, as shown in Figure 8, includes <strong>the</strong> improvements of PlanningCases 1 and 2 in addition <strong>to</strong> rail improvements tested <strong>to</strong> address network fluidity andcapacity. Planning Case 3 is estimated <strong>to</strong> cost nearly $26 million.Figure 8: Planning Case 3 Improvementsxiii
<strong>San</strong> <strong>An<strong>to</strong>nio</strong> <strong>Region</strong> <strong>Freight</strong> <strong>Study</strong>Executive SummaryPlanning Case 4Planning Case 4, as shown in Figure 9, includes <strong>the</strong> improvements of PlanningCases 1, 2, and 3 in addition <strong>to</strong> rail improvements tested <strong>to</strong> improve meet/passefficiency and reduce train delays. Planning Case 4 is estimated <strong>to</strong> cost $35 million.Figure 9: Planning Case 4 ImprovementsNext StepsBuilding upon <strong>the</strong> information contained within this report, <strong>the</strong> potentialimprovements, realignments, or relocations of <strong>the</strong> existing railway infrastructurehave been analyzed <strong>to</strong> determine <strong>the</strong> efficiencies of through-freight rail operationsand improvements associated with roadway user mobility and safety within <strong>the</strong>region. The private benefits generated for <strong>the</strong> respective modeling cases have beenreviewed by UP. The railroad’s concurrence <strong>to</strong> <strong>the</strong> methodology used, <strong>the</strong> proposedimprovements <strong>to</strong> <strong>the</strong>ir infrastructure, and <strong>the</strong> overall public and private benefitsassociated with this study may streng<strong>the</strong>n stakeholder relationships.Rail network improvements, reconfigurations, and possible realignments have beenreviewed utilizing appropriate engineering methods <strong>to</strong> determine <strong>the</strong> operationalxiv
<strong>San</strong> <strong>An<strong>to</strong>nio</strong> <strong>Region</strong> <strong>Freight</strong> <strong>Study</strong>Executive Summaryviability of <strong>the</strong> existing and possible routes. Proposed ancillary and support facilitieshave also been identified.The next step in this analysis would be <strong>to</strong> continue <strong>to</strong> review and analyze currentand projected freight flow volumes <strong>to</strong> determine possible freight flows <strong>to</strong> and/or from<strong>the</strong> conceptual Trans-<strong>Texas</strong> Corridor routes and truck <strong>to</strong> rail freight shifts within <strong>the</strong><strong>San</strong> <strong>An<strong>to</strong>nio</strong> region. Alternate uses for <strong>the</strong> existing freight rail corridor, <strong>the</strong> result ofpossible excess capacity windows generated by <strong>the</strong> proposed rail improvements,would also support <strong>the</strong> MPO’s 2025 multimodal transportation plan.The last step would be <strong>to</strong> proceed with an environmental impact study, with anemphasis on current and proposed land use for a recommended through-freightalignment.The alternate uses for <strong>the</strong> existing freight rail corridor and current and proposedland use carries with it <strong>the</strong> increased potential for economic developments thatcould accompany new intermodal facilities, logistics parks, or mega-industrial ormanufacturing facilities intended <strong>to</strong> allow <strong>the</strong> <strong>San</strong> <strong>An<strong>to</strong>nio</strong> region <strong>to</strong> flourisheconomically during this period of growth.xv
<strong>San</strong> <strong>An<strong>to</strong>nio</strong> <strong>Region</strong> <strong>Freight</strong> <strong>Study</strong>Project BackgroundSECTION 1: PROJECT BACKGROUND<strong>San</strong> <strong>An<strong>to</strong>nio</strong> Transportation Infrastructure<strong>San</strong> <strong>An<strong>to</strong>nio</strong> was founded in 1718 by a Spanish military expedition as a meres<strong>to</strong>pping place along a trail through <strong>the</strong> <strong>Texas</strong> wilderness while en route <strong>to</strong> Frenchtrading posts in Louisiana. In <strong>the</strong> 19 th Century <strong>the</strong> region was <strong>the</strong> starting point for<strong>the</strong> Chisholm Trail and cattle drives <strong>to</strong> Kansas. Today <strong>San</strong> <strong>An<strong>to</strong>nio</strong> is at <strong>the</strong>crossroads of a transportation network that connects <strong>the</strong> West Coast <strong>to</strong> <strong>the</strong> EastCoast and Mexico <strong>to</strong> Canada.The July 2005 US Census shows <strong>San</strong> <strong>An<strong>to</strong>nio</strong> as <strong>the</strong> second largest city in <strong>Texas</strong>,behind Hous<strong>to</strong>n and just ahead of Dallas, and <strong>the</strong> eighth largest in <strong>the</strong> United States.The basic framework for <strong>San</strong> <strong>An<strong>to</strong>nio</strong>’s transportation network, for both vehicularand rail traffic, was laid out many years ago. Since that time, <strong>the</strong> region hasexperienced significant population growth. The railroad lines in <strong>the</strong> region wereconstructed between 1877 and 1912. The groundwork for <strong>the</strong> highway systemprimarily follows US and State Highways that were in existence before 1945.Although transportation initiatives have been a continuous on-going process <strong>to</strong>upgrade <strong>the</strong> network in attempts <strong>to</strong> meet capacity demands, recent projections showunprecedented increases in population growth. Also, <strong>the</strong> corresponding movemen<strong>to</strong>f goods and people may require an even more aggressive approach <strong>to</strong> improvingand expanding <strong>the</strong> existing transportation infrastructure so that it will have <strong>the</strong>needed capacity <strong>to</strong> support <strong>the</strong> desired economic growth of <strong>the</strong> <strong>San</strong> <strong>An<strong>to</strong>nio</strong> regionfor generations <strong>to</strong> come.The <strong>Texas</strong> Department of Transportation (TxDOT) in partnership with <strong>the</strong> City of <strong>San</strong><strong>An<strong>to</strong>nio</strong>, <strong>the</strong> 12-county region comprising TxDOT’s <strong>San</strong> <strong>An<strong>to</strong>nio</strong> District, and o<strong>the</strong>rlocal transportation agencies, is undertaking a multimodal freight movementanalysis. The results of this study are documented in this report, entitled The <strong>San</strong><strong>An<strong>to</strong>nio</strong> <strong>Region</strong> <strong>Freight</strong> <strong>Study</strong>. The primary objective of <strong>the</strong> study is <strong>to</strong> exploreopportunities and alternatives <strong>to</strong> prevent <strong>the</strong> restriction of movement of goods andpeople, as well as continued economic development in <strong>the</strong> region.Today’s <strong>San</strong> <strong>An<strong>to</strong>nio</strong> roadway infrastructure is experiencing a considerable numberof locations where roadway congestion is common, especially during periods of peaktravel. This is partly due <strong>to</strong> <strong>the</strong> tremendous growth in <strong>the</strong> movement of freight in<strong>to</strong>and through <strong>the</strong> <strong>San</strong> <strong>An<strong>to</strong>nio</strong> area.Railroad <strong>Freight</strong> TransportIn 1929 <strong>the</strong>re were over 229,000 railroad route miles nationally that carried over447,000 million revenue <strong>to</strong>n miles of freight, for an average of 2 million revenue <strong>to</strong>nmiles per mile of route. There are now less than 100,000 railroad route milesnationally carrying over 1.5 billion revenue <strong>to</strong>n miles of freight for an average of over15 million revenue <strong>to</strong>n miles per route mile.1-1
<strong>San</strong> <strong>An<strong>to</strong>nio</strong> <strong>Region</strong> <strong>Freight</strong> <strong>Study</strong>Project BackgroundSince Congress deregulated <strong>the</strong> railroad industry in 1980 with <strong>the</strong> Staggers Act, <strong>the</strong>railroads have had <strong>to</strong> endure increasing competitive pressures from o<strong>the</strong>r modes oftransportation, especially <strong>the</strong> trucking industry. This competition has reduced <strong>the</strong>railroad profit margin <strong>to</strong> <strong>the</strong> point that infrastructure improvements and expansionsare done very selectively; hence many rail lines/corridors are nearing (or havereached) <strong>the</strong>ir capacity <strong>to</strong> efficiently and cost effectively move trains. As <strong>the</strong> supplyand demand equation for rail transportation has evolved, rail rates have increased inorder for railroads <strong>to</strong> reinvest in <strong>the</strong>ir franchise (infrastructure).In 2003, <strong>the</strong> United States House of Representatives Subcommittee on Railroadsreported that over 40% of freight traffic in <strong>the</strong> U.S. is transported by rail. Moreimportantly, approximately 70% of newly manufactured au<strong>to</strong>mobiles and 65% of coalshipments are transported via rail. 1 This movement of goods is being transported onan overall rail infrastructure that is less than half <strong>the</strong> size it once was.In April 2007, John D. Boyd, Associate Edi<strong>to</strong>r for Traffic World wrote:This spring, when <strong>the</strong> Surface Transportation Board called in <strong>the</strong> chiefs of <strong>to</strong>pU.S. railroads and <strong>the</strong>ir cus<strong>to</strong>mers <strong>to</strong> review a rail network straining <strong>to</strong> keepup with near-record traffic, Vice Chairman W. Douglas Buttrey found ano<strong>the</strong>rsymbol.Holding up a rusted, cast-off spike he had taken from an active track, Buttrey<strong>to</strong>ld a packed hearing room April 11 that <strong>to</strong>day's transport system needs "direrepair and maintenance and replacement." The country must find ways <strong>to</strong>better fund and improve its freight infrastructure, he said, with "maybe evenrevolutionary approaches <strong>to</strong> this issue, or we're going <strong>to</strong> end up with a wholesystem looking like this rail spike."U.S. Transportation Undersecretary for Policy Jeffrey Shane said "we face <strong>the</strong>challenges of success" from deregulation.To become more efficient in <strong>the</strong> wake of deregulation in 1980, railroads haveshed inefficient track, shrinking networks even in times of traffic growth. Onlyin <strong>the</strong> last few years, rail officials say, are <strong>the</strong>y making respectable profitsagain."The physical rail network since 1990 has not expanded," said Shane."Indeed, it has decreased by almost 20 percent while revenue <strong>to</strong>n milesincreased by 64 percent." Average train speeds - a key efficiency measure -dropped in 2005 <strong>to</strong> <strong>the</strong> lowest in 16 years, and despite some gains last yearShane said it was clear freight demand was using up <strong>the</strong> rail system'scapacity.1 US House of Representatives Subcommittee on Railroads, June 26, 2003 Hearing on national railinfrastructure financing proposals.1-2
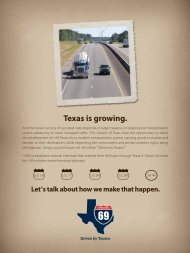
<strong>San</strong> <strong>An<strong>to</strong>nio</strong> <strong>Region</strong> <strong>Freight</strong> <strong>Study</strong>Project BackgroundAlthough most of <strong>the</strong> nation's freight is handled by trucks, rail executives saywithout a major highway building boom, which is not on Congress's agenda,railroads are better positioned <strong>to</strong> handle projected growth in freight traffic."I don't think <strong>the</strong> highway system will keep up, in terms of commerce," saidBNSF Railway's Matt Rose.Charles Moorman, CEO for Norfolk Sou<strong>the</strong>rn, warned "a loomingtransportation crisis" could lead <strong>to</strong> gridlock in 2020 if railroads cannot findways <strong>to</strong> take on more capacity.The rail executives said <strong>the</strong>y already are investing heavily both <strong>to</strong> catch upwith what Rose called a "volume surprise" in traffic in recent years and <strong>to</strong>prepare for future growth.Within <strong>the</strong> next 15 <strong>to</strong> 20 years, tremendous demands may be placed on <strong>the</strong> railnetwork due <strong>to</strong> international trade growth, rising fuel costs, longer and heavier trains,without including <strong>the</strong> impact of <strong>the</strong> possible national resurgence for developedcommuter and intercity passenger rail service.The opening of <strong>the</strong> Toyota facility south of <strong>San</strong> <strong>An<strong>to</strong>nio</strong> in December 2006 willincrease <strong>the</strong> volume of freight rail movements throughout <strong>the</strong> area once <strong>the</strong> facility isfully operational. Adding <strong>to</strong> <strong>the</strong> anticipated growth in rail traffic from <strong>the</strong> Toyotafacility, UP announced plans <strong>to</strong> construct an intermodal facility in southwest BexarCounty that may process over 100,000 trailers and containers annually.Figure 1-1 represents <strong>the</strong> current major intermodal routes for UP. With <strong>the</strong> new <strong>San</strong><strong>An<strong>to</strong>nio</strong> intermodal facility, <strong>the</strong> routes shown in light red may also become significantcarriers of intermodal freight rail traffic.Figure 1-1: UP Intermodal Routes1-3
<strong>San</strong> <strong>An<strong>to</strong>nio</strong> <strong>Region</strong> <strong>Freight</strong> <strong>Study</strong>Project BackgroundAno<strong>the</strong>r important element <strong>to</strong> consider is <strong>San</strong> <strong>An<strong>to</strong>nio</strong>’s proximity <strong>to</strong> <strong>the</strong> nation’svehicle manufacturing and au<strong>to</strong>mobile parts supply network. While suppliers seem<strong>to</strong> be locating facilities for access <strong>to</strong> several US au<strong>to</strong> manufacturers, many suppliers(and some au<strong>to</strong> production plants) are already operating in Mexico within a day’sdrive of <strong>San</strong> <strong>An<strong>to</strong>nio</strong>. As shown in Figure 1-2, <strong>San</strong> <strong>An<strong>to</strong>nio</strong> sits near <strong>the</strong> center of arecently developed au<strong>to</strong> corridor that extends from Mexico City <strong>to</strong> Atlanta. Of <strong>the</strong> 18assembly plants planned for or built in <strong>the</strong> US and Mexico since 1990, 12 plants(including Toyota in <strong>San</strong> <strong>An<strong>to</strong>nio</strong>) are located in this corridor, five of <strong>the</strong>m in Mexicoand six in <strong>the</strong> Sou<strong>the</strong>astern US 2 .SOURCES: Au<strong>to</strong>motive News Data Center; au<strong>to</strong> companies; TIP Strategies Inc.Figure 1-2: Au<strong>to</strong>motive Industry CorridorMuch of Mexico’s au<strong>to</strong> parts manufacturing occurs in <strong>the</strong> maquiladora industrylocated in <strong>the</strong> four Mexican states that border <strong>Texas</strong>: Tamaulipas, Nuevo León,Coahuila, and Chihuahua. In 2002, <strong>the</strong>re were 232,700 maquiladora jobs intransportation equipment manufacturing. Suppliers in Tamaulipas, Nuevo León andCoahuila are well positioned <strong>to</strong> serve <strong>the</strong> Daimler/Chrysler plant in Saltillo thatmakes Dodge Ram trucks, as well as <strong>the</strong> Toyota plant in <strong>San</strong> <strong>An<strong>to</strong>nio</strong>.Toyota is building its first Mexican manufacturing plant in Baja California Sur nearTijuana, where <strong>the</strong>y will make trucks and truck beds for its Tacoma pickup. Toyotapurchased $600 million in au<strong>to</strong> parts from 20 Mexican suppliers in 2002. According<strong>to</strong> spokesman Dan Sieger, <strong>the</strong> company plans <strong>to</strong> expand its supplier network inMexico <strong>to</strong> support <strong>San</strong> <strong>An<strong>to</strong>nio</strong> and Baja. Ciudad Juárez, which is between Tijuanaand <strong>San</strong> <strong>An<strong>to</strong>nio</strong>, has a large au<strong>to</strong> parts industry and could be an important location2 “<strong>Texas</strong> Au<strong>to</strong>motive Industry Profile,” TIP Strategies Inc.1-4
<strong>San</strong> <strong>An<strong>to</strong>nio</strong> <strong>Region</strong> <strong>Freight</strong> <strong>Study</strong>Project Backgroundfor suppliers seeking <strong>to</strong> produce for both plants. While Juárez is about 550 milesfrom <strong>San</strong> <strong>An<strong>to</strong>nio</strong> and 725 miles from Tijuana, travel <strong>to</strong> both locations is expeditedby <strong>the</strong> light highway traffic between <strong>the</strong>m and <strong>the</strong> good condition of I-10. Bothmarkets are also accessible by rail.Nationally, <strong>the</strong> transportation network relies heavily on <strong>the</strong> efficiency of freightmovement via rail, not just for “<strong>to</strong> market commodities” but also <strong>to</strong> provide <strong>the</strong>necessary <strong>to</strong>ols for a manufacturing base. Without reliable, affordable, and efficientrail service, <strong>the</strong> nation’s economy would be negatively affected.<strong>San</strong> <strong>An<strong>to</strong>nio</strong>, and many o<strong>the</strong>r cities abutting <strong>the</strong> railroad that have turned in<strong>to</strong>municipalities over time, are now faced with <strong>the</strong> dilemma of having railroadoperations pass directly through <strong>the</strong>ir Central Business Districts. This is also true for<strong>the</strong> major truck routes. With many of <strong>the</strong> <strong>to</strong>p employers of <strong>the</strong> region concentricallylocated, <strong>the</strong> exposure of truck and rail freight movement <strong>to</strong> <strong>the</strong> traveling public bringswith it a potential increased exposure <strong>to</strong> hazardous materials transportation and anincreased accident exposure rate in general.1-5
<strong>San</strong> <strong>An<strong>to</strong>nio</strong> <strong>Region</strong> <strong>Freight</strong> <strong>Study</strong>Purpose of <strong>Study</strong>SECTION 2: PURPOSE OF STUDYThis report is intended <strong>to</strong> provide <strong>the</strong> State, local governing agencies, privatepartners, and <strong>the</strong> metropolitan planning organization with a description of regionalfreight movements and an examination of alternatives <strong>to</strong> accommodate andcapitalize on present and future freight movements. Figure 2-1 shows <strong>the</strong> countieswithin <strong>the</strong> <strong>San</strong> <strong>An<strong>to</strong>nio</strong> region study area. The study provides evaluations andrecommendations for near term, mid-range, and long term improvements and/oractivities that may facilitate freight mobility within <strong>the</strong> region. The overall concept of<strong>the</strong> study is envisioned <strong>to</strong> evaluate freight movements and operations within <strong>the</strong>region, <strong>to</strong> identify opportunities <strong>to</strong> increase freight movement efficiency, determine<strong>the</strong> physical and financial viability of potential improvements, and include an analysisof potential freight corridor connections <strong>to</strong> <strong>the</strong> Trans <strong>Texas</strong> Corridor.Figure 2-1: – <strong>San</strong> <strong>An<strong>to</strong>nio</strong> <strong>Region</strong> <strong>Study</strong> AreaThe study was conducted in two phases. Phase I, which is covered within this reportdocument in sections 1 through 6, encompasses establishing an inven<strong>to</strong>ry of <strong>the</strong>existing freight rail system, conducting a region wide freight rail operational study,identifying freight rail constraints, and identifying freight rail and rail/roadway interfacesafety issues. Phase II, <strong>the</strong> results of which are included in this report as sections 7through 11, addresses alternatives and associated feasibility for rail system/roadwayimprovements within <strong>the</strong> region and models rail system improvements <strong>to</strong> develop arealistic cost/benefit analysis.The next step in this analysis would be <strong>to</strong> continue <strong>to</strong> review and analyze currentprojected freight flow volumes <strong>to</strong> determine possible freight flows <strong>to</strong> and/or from <strong>the</strong>conceptual Trans-<strong>Texas</strong> Corridor routes and truck <strong>to</strong> rail freight shifts within <strong>the</strong> <strong>San</strong><strong>An<strong>to</strong>nio</strong> region. Alternate uses for <strong>the</strong> existing freight rail corridor, <strong>the</strong> result ofpossible excess capacity generated by <strong>the</strong> identified rail improvements, would alsosupport <strong>the</strong> MPO’s 2025 multimodal transportation plan.2-1
<strong>San</strong> <strong>An<strong>to</strong>nio</strong> <strong>Region</strong> <strong>Freight</strong> <strong>Study</strong>Purpose of <strong>Study</strong>The last step would be <strong>to</strong> proceed with an environmental impact study, with anemphasis on current and proposed land use for a recommended through-freightalignment. The alternate uses for <strong>the</strong> existing freight rail corridor and current andproposed land use carries with it <strong>the</strong> increased potential for economic developmentsthat could accompany new intermodal facilities, logistics parks, or mega-industrial ormanufacturing facilities intended <strong>to</strong> allow <strong>the</strong> <strong>San</strong> <strong>An<strong>to</strong>nio</strong> region <strong>to</strong> flourisheconomically during this period of growth.2-2
<strong>San</strong> <strong>An<strong>to</strong>nio</strong> <strong>Region</strong> <strong>Freight</strong> <strong>Study</strong><strong>Freight</strong> Operational <strong>Study</strong>SECTION 3: FREIGHT OPERATIONAL STUDYHighway NetworkPlanning for <strong>the</strong> <strong>San</strong> <strong>An<strong>to</strong>nio</strong> highway network began during <strong>the</strong> World War II eraand has been phased in over <strong>the</strong> past 60 years <strong>to</strong> make up <strong>the</strong> infrastructure thatis in place <strong>to</strong>day. The beginning of <strong>the</strong> network was based on <strong>the</strong> existing U<strong>San</strong>d state highways that traversed <strong>the</strong> area.As is typically <strong>the</strong> case throughout <strong>the</strong> country, certain roadways paralleledexisting rail corridors, which is <strong>the</strong> case for IH-10 from <strong>the</strong> down<strong>to</strong>wn areawestward and Highway 78 east of <strong>San</strong> <strong>An<strong>to</strong>nio</strong>.Table 3-1 shows <strong>the</strong> progression of <strong>the</strong> state highway system in<strong>to</strong> <strong>the</strong> existinginterstate network for <strong>the</strong> <strong>San</strong> <strong>An<strong>to</strong>nio</strong> region. As city streets and roads becameover-burdened with traffic, roadway enhancements and upgrades providedadditional capacity and were given state highway designations. Similarly, as<strong>the</strong>se roadways reached capacity, <strong>the</strong>re was a progression <strong>to</strong> construct <strong>the</strong> U.S.Highway and interstate network.TODAYU.S. PRE-U.S. HWYHWY DESIGNATIONPRE-FREEWAY ROUTINGIH10 - W US 87 SH 9/SH 27 Fredericksburg Rd., N. Flores St.IH10 - E US 90 SH 3 E. Commerce St.IH35 - N US 81 SH 2 Broadway, Austin Hwy., Randolph Blvd.IH35 - S US 81 SH 2 Nogali<strong>to</strong>s St., New Laredo Hwy.IH37 US 181 SH 16 S. Presa St.US 90W US 90 SH 3 W. Commerce St., Old Hwy 90 WUS 281N US 281 SH 66 <strong>San</strong> Pedro Ave.LP 410 N/A LP 13/LP 410 Today's I-410 east of NW Military Hwy. <strong>to</strong> Austin Hwy., <strong>the</strong>n south along<strong>to</strong>day's I-35N <strong>to</strong> WW White Rd., <strong>the</strong>n along <strong>to</strong>day's routing of WWWhite Rd. and SE/SW Military Dr.Table 3-1: <strong>San</strong> <strong>An<strong>to</strong>nio</strong> RoadwaysAs would be expected of a central business district, five of <strong>the</strong> <strong>to</strong>p ten privatecompanies (by employee count) are located in <strong>the</strong> heart of <strong>the</strong> down<strong>to</strong>wn <strong>San</strong><strong>An<strong>to</strong>nio</strong> area, adding <strong>to</strong> <strong>the</strong> volume of traffic on <strong>the</strong> highway network. Figure 3-1depicts <strong>the</strong> locations of <strong>the</strong>se companies.3-1
<strong>San</strong> <strong>An<strong>to</strong>nio</strong> <strong>Region</strong> <strong>Freight</strong> <strong>Study</strong><strong>Freight</strong> Operational <strong>Study</strong>Figure 3-1: Top 10 (by employee count) Private Employers in <strong>San</strong> <strong>An<strong>to</strong>nio</strong>(shown in yellow)<strong>Freight</strong> MovementThe exploration of <strong>the</strong> future freight outlook requires that <strong>the</strong> best available <strong>to</strong>olsbe used <strong>to</strong> examine <strong>the</strong> current/base year (1998) and future year (2025)commodity flows within <strong>the</strong> region.The following is a description of <strong>the</strong> <strong>to</strong>ols used in <strong>the</strong> analysis of freightmovements for this study. Technical information on truck freight flows, rail freightmovements, and a comparison of truck and rail movements for <strong>the</strong> <strong>San</strong> <strong>An<strong>to</strong>nio</strong>region follows <strong>the</strong> discussion of freight modeling methods. It is through anunderstanding of <strong>the</strong> movement of truck and rail freight that <strong>the</strong> region can begin<strong>to</strong> develop ways <strong>to</strong> accommodate and capitalize on future commoditymovements.<strong>Freight</strong> Model MethodsThe primary <strong>to</strong>ol used <strong>to</strong> determine future truck and rail freight activity is <strong>the</strong><strong>Texas</strong> Statewide Analysis Model, referred <strong>to</strong> as “SAM”. SAM is a travel demandsimulation modeling package developed for and used by TxDOT <strong>to</strong> study andevaluate <strong>the</strong> movement of people and freight throughout <strong>the</strong> state. The SAM isactually a large group of interrelated models that generate passenger tripestimates and freight <strong>to</strong>nnage flows for highway, aviation, and railroad networks,as well as waterway facilities along <strong>the</strong> <strong>Texas</strong> Gulf Coast. The maps and dataproduced by <strong>the</strong> SAM are useful in planning transportation system improvementsand addressing future transportation system needs and priorities.3-2
<strong>San</strong> <strong>An<strong>to</strong>nio</strong> <strong>Region</strong> <strong>Freight</strong> <strong>Study</strong><strong>Freight</strong> Operational <strong>Study</strong>SAM was developed using base year (1998) transportation planning data <strong>to</strong>validate <strong>the</strong> adequacy of <strong>the</strong> model in estimating passenger flows by travelmode. In urban areas such as <strong>San</strong> <strong>An<strong>to</strong>nio</strong>, Dallas-Fort Worth, Hous<strong>to</strong>n, Austin,etc., transportation data from existing urban models was extracted. In <strong>the</strong>remaining rural areas, national and state travel survey and demographics data(population, employment, and o<strong>the</strong>r socioeconomic fac<strong>to</strong>rs) was used <strong>to</strong> preparetravel estimates, which were <strong>the</strong>n compared <strong>to</strong> traffic counts. SAM freightmodels were used <strong>to</strong> develop estimates of freight flow (<strong>to</strong>nnage) and identifylocations of heavy truck traffic.Model CalibrationTransportation and travel survey data necessary for freight modeling is lesscomprehensive than for passenger modeling. Therefore, SAM freight modelswere developed using base year and future/forecast year (2025) data, madeavailable from three primary sources:‣ Reebie Transearch Database – This 1998 survey data includes a sampleof all <strong>Texas</strong> freight movements (within, <strong>to</strong>, from, and through <strong>the</strong> state),but does not include freight movements between <strong>Texas</strong> and Mexico.‣ Whar<strong>to</strong>n Economic Forecasting Associates (WEFA) – Similar <strong>to</strong> <strong>the</strong>Reebie data, <strong>the</strong> WEFA data included only intra-U.S. flows and did notinclude freight movements between <strong>Texas</strong> and Mexico.‣ Latin America Trade Transportation <strong>Study</strong> (LATTS) – This study collecteddata from <strong>the</strong> DRI/Mercer World Sea Trade Service (WSTS), whichintegrates world trade databases and economic/trade models <strong>to</strong> producehis<strong>to</strong>rical data and forecasts of freight movements around <strong>the</strong> world,including freight movements between <strong>Texas</strong> and Mexico.Additionally, Surface Transportation Board (STB) Waybill Data from 2002, 2003,and 2004 was obtained and used as ano<strong>the</strong>r level of calibration for freight railmovements throughout <strong>the</strong> state. The STB data, along with actual rail <strong>to</strong>nnagemaps provided by <strong>the</strong> freight railroads, were compared as a process check <strong>to</strong>validate current rail freight volumes, thus establishing a defendable prediction offorecasted rail freight movements throughout <strong>the</strong> state.The freight model produces freight flow <strong>to</strong>nnage estimates based on <strong>the</strong> followingnine commodity types:‣ Agriculture‣ Raw materials‣ Food‣ Textiles‣ Wood‣ Chemicals/petroleum‣ Building materials‣ Machinery‣ Secondary3-3
<strong>San</strong> <strong>An<strong>to</strong>nio</strong> <strong>Region</strong> <strong>Freight</strong> <strong>Study</strong><strong>Freight</strong> Operational <strong>Study</strong>Trip GenerationTrip generation is <strong>the</strong> process of converting roadway travelers (people) andemployment (jobs) in<strong>to</strong> trips. These can be au<strong>to</strong> trips, truck trips, and <strong>to</strong>ns ofcommodities within a defined geographic area. All trip generation modelestimates for <strong>the</strong> freight model were developed at <strong>the</strong> county level becauseReebie freight data was defined in terms of freight origins and destinations bycounty. The trip generation model is based on a series of equations, which are<strong>the</strong> result of <strong>the</strong> relationship between variables that include employment typesand special freight handling facilities <strong>to</strong> <strong>to</strong>nnages produced or attracted <strong>to</strong>respective counties.<strong>Freight</strong> transportation demand growth is effected by increases in bo<strong>the</strong>mployment and employee productivity. The trip generation equations estimatefreight <strong>to</strong>nnages based on increases in employment and employee productivity.These estimates were <strong>the</strong>n compared <strong>to</strong> 1998 Reebie control <strong>to</strong>tal data. Theequations were iteratively adjusted <strong>to</strong> obtain reasonably accurate freight <strong>to</strong>nnageestimates for commodity and movement type.<strong>Freight</strong> movement was calculated using scientific equations and <strong>the</strong>secalculations were compared <strong>to</strong> 1998 freight data for individual counties.Adjustments were made <strong>to</strong> develop accurate <strong>to</strong>tals for use in this <strong>Study</strong>.Lastly, average daily trip tables are <strong>the</strong> result of <strong>the</strong> ratio of <strong>the</strong> annual values <strong>to</strong><strong>the</strong> number of days in a year (365). The freight model estimated that overall<strong>to</strong>nnage movements at <strong>the</strong> county and region level are accurate and reasonablein replicating base and future freight movements. Similarly, <strong>the</strong> freight flowestimates over <strong>the</strong> various highway network routes are also accurate andreasonable.2025 Roadway NetworkThe SAM includes anticipated roadway improvements through <strong>the</strong> year 2025,which are based on future growth and mobility needs. Table 3-2 and Figure 3-2depict <strong>the</strong> network improvements updated in <strong>the</strong> SAM <strong>to</strong> reflect projects cited in<strong>the</strong> <strong>San</strong> <strong>An<strong>to</strong>nio</strong> - Bexar County MPO Metropolitan Transportation Plan (MTP)–Mobility 2030 and <strong>the</strong> TTC–35 Draft Environmental Impact Statement (DEIS).3-4
<strong>San</strong> <strong>An<strong>to</strong>nio</strong> <strong>Region</strong> <strong>Freight</strong> <strong>Study</strong><strong>Freight</strong> Operational <strong>Study</strong>Route Improvement Type DescriptionFM 1535 From 2 <strong>to</strong> 6 Lanes From SL 1604 <strong>to</strong> Wurzbach PkwyFM 2252 From 2 <strong>to</strong> 6 Lanes From FM 3009 <strong>to</strong> IH410FM 2536 From 2 <strong>to</strong> 4 Lanes From SL 13 <strong>to</strong> IH 410FM 2696 From 2 <strong>to</strong> 4 Lanes From SL1604 <strong>to</strong> Wilderness OakFM 3009 From 2 <strong>to</strong> 6 Lanes From IH 35 <strong>to</strong> FM 2252FM 3487 From 2 <strong>to</strong> 6 Lanes From FM 471 <strong>to</strong> IH 410FM 471 From 2 <strong>to</strong> 6 Lanes From FM 3487 <strong>to</strong> FM 1560IH 10 From 6 <strong>to</strong> 10 Lanes From FM 3351 <strong>to</strong> SL 1604IH 35 From 6 <strong>to</strong> 8 Lanes From SL 1604 <strong>to</strong> N New Braunfels AveIH 35 From 6 <strong>to</strong> 10 Lanes From IH 410 <strong>to</strong> Bexar County LineIH 37 From 4 <strong>to</strong> 6 Lanes From IH 410 <strong>to</strong> Hardy RdIH 410 From 6 - 10 Lanes From US 90 <strong>to</strong> IH 35SH 123 From 2 <strong>to</strong> 4 Lanes From FM 466 <strong>to</strong> IH 10SH 130 New 6 Lane Roadway From IH 10 <strong>to</strong> SH 80SH 151 From 4 <strong>to</strong> 6 Lanes From SL1604 <strong>to</strong> Wes<strong>to</strong>ver Hills BlvdSH 16 From 4 <strong>to</strong> 8 Lanes From SL1604 <strong>to</strong> IH 410SH 211 New 2 Lane Roadway From FM 1957 <strong>to</strong> FM 471SH 46 From 2 <strong>to</strong> 4 Lanes From FM 758 <strong>to</strong> Alves LnSL 1604 From 4 <strong>to</strong> 6 Lanes From FM 2696 <strong>to</strong> FM 1346US 281 From 4 <strong>to</strong> 8 Lanes From E Borgfeld Dr <strong>to</strong> SL 1604FM 1103 From 2 <strong>to</strong> 4 Lanes IH 35 N <strong>to</strong> FM 78US 90 From 4 <strong>to</strong> 6 Lanes From SL1604 <strong>to</strong> SH211Table 3-2: Future Network Improvements (1998 <strong>to</strong> 2025)Figure 3-2: Future Network Improvements (1998 <strong>to</strong> 2025)3-5
<strong>San</strong> <strong>An<strong>to</strong>nio</strong> <strong>Region</strong> <strong>Freight</strong> <strong>Study</strong><strong>Freight</strong> Operational <strong>Study</strong>Mode Choice and AssignmentThe statewide freight flow <strong>to</strong>nnage estimates produced at <strong>the</strong> county level areallocated <strong>to</strong> highway, rail, and waterway modes by a mode choice model. Whilerail and waterborne movements were assigned <strong>to</strong> <strong>the</strong>ir respective networks at <strong>the</strong>county level, information for <strong>the</strong> highway freight <strong>to</strong>nnage estimates was providedfrom smaller geographic areas (traffic analysis zones — TAZ) prior <strong>to</strong> beingassigned <strong>to</strong> <strong>the</strong> road network. In addition, heavy truck flow estimates for <strong>the</strong>highway network were derived through fac<strong>to</strong>ring of <strong>the</strong> freight <strong>to</strong>nnage estimates.Variables of vehicle load fac<strong>to</strong>r (by commodity group and related trip length) wereapplied <strong>to</strong> <strong>the</strong> freight <strong>to</strong>nnage values. Truck freight movements and percentagesand truck traffic and associated issues support <strong>the</strong> requirement for a shift intraffic <strong>to</strong> o<strong>the</strong>r possible routes.Truck <strong>Freight</strong> Movements and CommoditiesThe movement of truck freight in<strong>to</strong>, within, and out of <strong>the</strong> region is significant<strong>to</strong>day and will continue <strong>to</strong> be a key modal choice <strong>to</strong> transport goods andmaterials for <strong>Texas</strong> and <strong>the</strong> country.Truck Movements for <strong>San</strong> <strong>An<strong>to</strong>nio</strong>, <strong>the</strong> State, and <strong>the</strong> CountryTable 3-3 illustrates that while <strong>the</strong> movement of truck <strong>to</strong>ns within <strong>the</strong> region(internal <strong>to</strong> internal) is forecasted <strong>to</strong> increase by nearly 3 million <strong>to</strong>ns, a muchlarger increase occurs for <strong>to</strong>nnage movements coming in<strong>to</strong> (54.6 million) and ou<strong>to</strong>f (46 million) <strong>the</strong> region. The table describes each movement type that wouldei<strong>the</strong>r originate or end in <strong>the</strong> <strong>San</strong> <strong>An<strong>to</strong>nio</strong> <strong>Region</strong>. For instance, internal <strong>to</strong>internal movements occur within <strong>the</strong> region while all o<strong>the</strong>r movements (internal <strong>to</strong>external; external <strong>to</strong> internal) occur ei<strong>the</strong>r between <strong>the</strong> <strong>San</strong> <strong>An<strong>to</strong>nio</strong> <strong>Region</strong> ando<strong>the</strong>r <strong>Texas</strong> counties or between <strong>the</strong> <strong>San</strong> <strong>An<strong>to</strong>nio</strong> <strong>Region</strong> and <strong>the</strong> rest of US andMexico. The 54.6 million additional truck <strong>to</strong>ns projected <strong>to</strong> enter <strong>the</strong> <strong>San</strong> <strong>An<strong>to</strong>nio</strong>District was calculated by taking <strong>the</strong> <strong>to</strong>tal difference for <strong>the</strong> external <strong>to</strong> internalmovements between 1998 and 2025. The <strong>to</strong>tal additional <strong>to</strong>nnage of 46 million<strong>to</strong>ns projected <strong>to</strong> leave <strong>the</strong> <strong>San</strong> <strong>An<strong>to</strong>nio</strong> <strong>Region</strong> between 1998 and 2025 wascalculated from <strong>the</strong> <strong>to</strong>tal difference of <strong>the</strong> internal <strong>to</strong> external movements.Essentially, <strong>the</strong>se figures demonstrate <strong>the</strong> importance of truck freight activity in<strong>the</strong> region, and how this area plays an important economic role for <strong>the</strong> entirestate of <strong>Texas</strong> and <strong>the</strong> nation as a whole.3-6
<strong>San</strong> <strong>An<strong>to</strong>nio</strong> <strong>Region</strong> <strong>Freight</strong> <strong>Study</strong><strong>Freight</strong> Operational <strong>Study</strong>Annual Truck TonsOrigin Termination 1998 2025PercentChangeInternal <strong>to</strong> Internal<strong>San</strong> <strong>An<strong>to</strong>nio</strong> District <strong>San</strong> <strong>An<strong>to</strong>nio</strong> District 2,555,208 5,393,211 111%Internal <strong>to</strong> External<strong>San</strong> <strong>An<strong>to</strong>nio</strong> District O<strong>the</strong>r <strong>Texas</strong> Counties 20,423,408 50,301,502 146%<strong>San</strong> <strong>An<strong>to</strong>nio</strong> District Western US 430,247 1,198,528 179%<strong>San</strong> <strong>An<strong>to</strong>nio</strong> District Nor<strong>the</strong>rn US 2,581,484 7,191,168 179%<strong>San</strong> <strong>An<strong>to</strong>nio</strong> District Eastern US 2,151,237 5,992,640 179%<strong>San</strong> <strong>An<strong>to</strong>nio</strong> District Mexico 3,872,226 10,786,752 179%External <strong>to</strong> InternalO<strong>the</strong>r <strong>Texas</strong>Counties <strong>San</strong> <strong>An<strong>to</strong>nio</strong> District 40,802,299 81,691,964 100%Western US <strong>San</strong> <strong>An<strong>to</strong>nio</strong> District 413,902 1,067,853 158%Nor<strong>the</strong>rn US <strong>San</strong> <strong>An<strong>to</strong>nio</strong> District 2,483,411 6,407,118 158%Eastern US <strong>San</strong> <strong>An<strong>to</strong>nio</strong> District 2,069,509 5,339,265 158%Mexico <strong>San</strong> <strong>An<strong>to</strong>nio</strong> District 3,725,116 9,610,677 158%Total 81,508,046 184,980,677 127%*Source: Statewide Analysis Model based on 1998 Reebie Transearch Data, Whar<strong>to</strong>n EconomicForecasting Associates and Latin American Trade Transportation <strong>Study</strong>Table 3-3: Truck <strong>Freight</strong> MovementsTruck Movements within <strong>the</strong> StateThe two potential movement types include those <strong>to</strong>/from o<strong>the</strong>r <strong>Texas</strong> countiesand <strong>to</strong>/from locations outside of <strong>Texas</strong>. Figure 3-3 illustrates that in 1998 largenumbers of trucks were moving between <strong>San</strong> <strong>An<strong>to</strong>nio</strong> and Hous<strong>to</strong>n, Laredo, <strong>the</strong>Lower Rio Grande Valley, El Paso, and <strong>the</strong> Dallas/Fort Worth Metroplex.Although trucks were moving <strong>to</strong> o<strong>the</strong>r parts of <strong>the</strong> state, <strong>the</strong>ir final destinationremains in those major growth markets. Figure 3-4 shows <strong>the</strong> trend of <strong>the</strong>majority of truck freight movement occurring between <strong>the</strong> major urban areas. Inaddition <strong>to</strong> <strong>the</strong> major cities previously mentioned, o<strong>the</strong>r areas along <strong>the</strong> IH-35corridor, as well as <strong>the</strong> cities of Odessa, Lubbock, and a larger portion of <strong>the</strong>Hous<strong>to</strong>n area, show an increase in <strong>the</strong> relationship of freight movement with <strong>the</strong><strong>San</strong> <strong>An<strong>to</strong>nio</strong> region in <strong>the</strong> future.These trends heighten <strong>the</strong> need <strong>to</strong> plan and accommodate for trucks along <strong>the</strong>major highway corridors both inside and outside of <strong>the</strong> major urban centers. Withmost highway facilities nearing capacity, new corridors such as <strong>the</strong> Trans <strong>Texas</strong>Corridor may play an integral role in keeping au<strong>to</strong> and truck traffic moving,potentially benefiting <strong>the</strong> economy.3-7
<strong>San</strong> <strong>An<strong>to</strong>nio</strong> <strong>Region</strong> <strong>Freight</strong> <strong>Study</strong><strong>Freight</strong> Operational <strong>Study</strong>38,81412,883 16,80819,27112,738Truck Tons (1998) - From and To <strong>San</strong> <strong>An<strong>to</strong>nio</strong> District13,193155,300117,14411,65314,20314,751630,83213,29635,20114,07179,51790,64911,01012,56412,361125,84041,65916,49111,75113,68014,6801,059,726Truck Tonnage0 - 44,1738,87544,174 - 132,615132,616 - 295,288295,289 - 516,943516,944 - 1,059,72611,22810,20812,34220,400LEGEND1,059,727 - 1,878,5411,878,542 - 3,712,6273,712,628 - 20,517,965xx9,29617,85712,25917,39016,44522,61825,85323,90225,31830,42214,048 453,01648,936221,01612,26620,25627,34915,177122,24612,68912,900191,62214,8069,95613,80416,246 12,35318,69013,67454,739173,23716,53321,76520,51723,857155,59027,29015,88628,48330,52127,54515,52122,31916,158 13,34911,83313,843 33,50415,41412,44483,551<strong>San</strong> <strong>An<strong>to</strong>nio</strong> DistrictPort10,61313,80433,31517,40513,45912,51512,49015,69953,96013,48011,49616,53629,127271,11317,61323,32211,77613,28518,16028,67921,43027,7951,434,30920,54884,74026,68297,545350,33911,30138,03020,93728,62934,33320,08735,55836,72218,15023,06112,31011,54255,03092,68630,18444,17320,56388,103173,09017,630767,845295,28856,31117,57570,69873,63338,35517,40821,14461,455365,7433,712,62755,39311,877516,94355,58738,25685,95591,30047,056162,48347,753707,89782,93350,51725,350122,7081,535,36319,090493,112353,7691,878,54125,81553,21949,56359,341230,077197,21421,756465,87713,292,87932,080266,07936,91336,9131,535,36334120,23337,57532,67822,56556,06563,291102,01238,723164,50843,90623,651113,63428,830145,41846,378164,508164,50828,79754,93823,74671,88316,13623,74025,46882,674170,3238,7689,24043,20665,69865,493158,67922,29669,605143,48920,517,965348,64217,97610,495246,54788,03714,88811,19467,08629,63548,762137,452195,79130,709236,74132,314272,1702117,112179,77846,40322,63892,03660,44619,38451,71330,779236,741132,61513,75027,569 46,201647,454160,758145,5525Truck Tonnage To/From Ports1. Port of Hous<strong>to</strong>n - 2,419,1452. Port of Freeport - 6,7713. Port of Corpus Christi - 10,0864. Port of Brownsville - 3405. Port of Beaumont - 21,591Source: Statewide Analysis Model based on 1998 Reebie Transearch Data, Whar<strong>to</strong>n EconomicForecasting Associates and Latin American Trade Transportation <strong>Study</strong>Figure 3-3: 1998 Truck Movements within <strong>Texas</strong> To and From <strong>San</strong> <strong>An<strong>to</strong>nio</strong>3-8
<strong>San</strong> <strong>An<strong>to</strong>nio</strong> <strong>Region</strong> <strong>Freight</strong> <strong>Study</strong><strong>Freight</strong> Operational <strong>Study</strong>2271731626062070482Rail Tons (2025) - From and To <strong>San</strong> <strong>An<strong>to</strong>nio</strong> District25352438113502740497701152494044327010250027378258850187066671LEGENDRail Tonnage0 - 19,5381919,539 - 83,04383,044 - 197,900197,901 - 353,751353,752 - 615,718615,719 - 1,995,7251,995,726 - 11,283,14111,283,142 - 24,515,8232003386xx00055317846334800684011259046234656990058815123541220993020017327283020670582<strong>San</strong> <strong>An<strong>to</strong>nio</strong> DistrictPort0000 0 0082020100000000001052372923444330239800180493620000000400027153560000109682300187942705739122800010219224704520000290082207466697046031536012910395111360087501074001450266002742532731575 19519652225931188810295253933247723526288968165850598133217517514172561468622762359976623197900155323831953833234726435375102889685092719957250342793313602182536331337361337368479105412162074385712907716158361337369704661030643518485421546020722244083043024515823037660221798 127050557959410249112831411291561807334300106821504313797212258930633221919370902206051290061571827994411657803063322463531855131911018661131201649725Rail Tonnage To/From Ports1. Port of Hous<strong>to</strong>n - 3,563,9342. Port of Freeport - 1,5693. Port of Corpus Christi - 18,4514. Port of Brownsville - 1,9565. Port of Beaumont - 62,318Source: Statewide Analysis Model based on 1998 Reebie Transearch Data, Whar<strong>to</strong>n EconomicForecasting Associates and Latin American Trade Transportation <strong>Study</strong>Figure 3-4: 2025 Truck Movements within <strong>Texas</strong> To and From <strong>San</strong> <strong>An<strong>to</strong>nio</strong>Truck Movements Outside of <strong>the</strong> StateReferring again <strong>to</strong> Table 3-3, it is noted <strong>the</strong>re are large increases in truck freightactivity <strong>to</strong> and from o<strong>the</strong>r parts of <strong>the</strong> country <strong>to</strong> <strong>the</strong> region from 1998 <strong>to</strong> 2025.These movements represent trucks that are relegated <strong>to</strong> long haul trips. Majormovements in 1998 can be seen from Louisiana, Oklahoma, New Mexico, andMexico. Similar patterns were found from <strong>San</strong> <strong>An<strong>to</strong>nio</strong> <strong>to</strong> destinations outside of<strong>the</strong> state. Forecasting truck movements in<strong>to</strong> and out of <strong>the</strong> state from <strong>the</strong> regionidentifies a trend that depicts dramatic increases in truck activity. This activity, asshown in Figure 3-5 for <strong>the</strong> 1998 base year and Figure 3-6 for projections <strong>to</strong>2025, clearly demonstrates increased movement from Mexico, New Mexico,Louisiana, and Oklahoma <strong>to</strong> <strong>the</strong> <strong>San</strong> <strong>An<strong>to</strong>nio</strong> region.These movements outside of <strong>the</strong> state of <strong>Texas</strong> fur<strong>the</strong>r illustrate <strong>the</strong> need foradditional truck allowance on <strong>the</strong> interstate system. Additionally, with truck freigh<strong>to</strong>ccupancy on <strong>the</strong> roadway network increasing, resulting in additional areaswhere demand is exceeding roadway capacity, long haul truck movement maybe better served by shifting <strong>the</strong> freight cargo <strong>to</strong> rail.3-9
<strong>San</strong> <strong>An<strong>to</strong>nio</strong> <strong>Region</strong> <strong>Freight</strong> <strong>Study</strong><strong>Freight</strong> Operational <strong>Study</strong>Figure 3-5: 1998 Truck Movements From Outside of <strong>Texas</strong> <strong>to</strong> <strong>San</strong> <strong>An<strong>to</strong>nio</strong>Figure 3-6: 2025 Movements From Outside of <strong>Texas</strong> <strong>to</strong> <strong>San</strong> <strong>An<strong>to</strong>nio</strong>3-10
<strong>San</strong> <strong>An<strong>to</strong>nio</strong> <strong>Region</strong> <strong>Freight</strong> <strong>Study</strong><strong>Freight</strong> Operational <strong>Study</strong>The overall truck <strong>to</strong>nnage movement from and <strong>to</strong> <strong>the</strong> <strong>San</strong> <strong>An<strong>to</strong>nio</strong> District wassummarized by dividing <strong>the</strong> area within <strong>the</strong> state in<strong>to</strong> specific areas of differentdistances from <strong>San</strong> <strong>An<strong>to</strong>nio</strong> as well as separate regions of <strong>Texas</strong>. The areainside of <strong>Texas</strong> was broken in<strong>to</strong> radii’s of 50, 100, 300, and over 300 miles from<strong>the</strong> <strong>San</strong> <strong>An<strong>to</strong>nio</strong> region. The regions outside of <strong>the</strong> state were identified asWestern US, Nor<strong>the</strong>rn US, Eastern US, and Mexico. The modeling effortsdetermined truck <strong>to</strong>nnage distribution for each area. Figure 3-7 shows <strong>the</strong>distribution of truck <strong>to</strong>nnage for each region projected in 2025.Figure 3-7: 2025 Truck Tonnage Distribution for <strong>San</strong> <strong>An<strong>to</strong>nio</strong> <strong>Region</strong>The analysis showed that six percent of truck <strong>to</strong>nnage would stay within <strong>the</strong> <strong>San</strong><strong>An<strong>to</strong>nio</strong> region while 60 percent is projected <strong>to</strong> travel within <strong>Texas</strong> between 100miles and 300 miles from <strong>the</strong> area. The projections showed that 70 percent oftruck freight traffic would travel within 300 miles of <strong>the</strong> <strong>San</strong> <strong>An<strong>to</strong>nio</strong> region. Ninepercent of <strong>the</strong> truck freight is distributed <strong>to</strong> an area within <strong>Texas</strong> outside of <strong>the</strong>300 mile radius. The remaining percentages are split between Mexico (9percent), Western US (1 percent), Nor<strong>the</strong>rn US (6 percent), and Eastern US (5percent).3-11
<strong>San</strong> <strong>An<strong>to</strong>nio</strong> <strong>Region</strong> <strong>Freight</strong> <strong>Study</strong><strong>Freight</strong> Operational <strong>Study</strong>Truck Commodity TrendsCommodity trends provide insight in<strong>to</strong> <strong>the</strong> truck movement internal and external<strong>to</strong> <strong>Texas</strong>. With all movements combined, <strong>the</strong> overall truck <strong>to</strong>nnage is projected<strong>to</strong> more than double within <strong>the</strong> region by 2025. As Table 3-4 indicates, textileswill be <strong>the</strong> fastest growing commodity with more than 290 percent growth. O<strong>the</strong>rcommodities of similar growth are building materials (220 percent) andmachinery (180 percent). All of <strong>the</strong> nine commodity groups show significantincreases and represent a very positive economic outlook for <strong>the</strong> entire region.This substantial growth will necessitate additional infrastructure <strong>to</strong> maintain levelsof freight movement service.CommodityTruck Tons1998 2025 Percent IncreaseBuildingMaterials12,492,532 40,009,693 220%Food 15,665,961 38,856,593 148%Raw Materials 16,188,450 25,336,756 57%Secondary 9,969,503 24,204,712 143%Chemical/Petroleum14,662,661 22,409,429 53%Wood 6,598,873 16,696,064 153%Machinery 4,589,124 12,840,658 180%Textiles 758,979 2,974,744 292%Agriculture 581,969 1,652,040 184%Total 81,508,052 184,980,689 127%Table 3-4: Truck Commodity GrowthAnalyzing <strong>the</strong>se commodities assists in fur<strong>the</strong>r understanding <strong>the</strong> makeup offreight <strong>to</strong>nnage. The greatest commodity volumes moving by truck are generallylow value, bulk materials — consistent with traffic moving through bulk ports.The leading products moving by truck (in terms of <strong>to</strong>nnage percentage in <strong>the</strong>region) are raw materials, food, secondary products, chemical/petroleumproducts, and building materials. Secondary products are an exception <strong>to</strong> <strong>the</strong>low-value tendency among <strong>the</strong> <strong>to</strong>p commodities (by weight). Secondaryproducts consist of re-handled freight from warehouse or distribution centers, and<strong>the</strong> truck drayage portions of truck/rail or truck/air intermodal trips. Figures 3-8,3-9 and 3-10 fur<strong>the</strong>r illustrate <strong>the</strong> commodity <strong>to</strong>nnage within <strong>the</strong> region for 1998and 2025.Based on information from <strong>the</strong> U.S. Department of Transportation, <strong>the</strong> <strong>to</strong>p 10commodities transported by trucks in U.S.-North America Free Trade Agreement(NAFTA) trade accounted for 71 percent of <strong>the</strong> <strong>to</strong>tal U.S.-NAFTA truck trade.Figure 3-10a illustrates <strong>the</strong> breakdown of commodities hauled by trucks in 2005.3-12
<strong>San</strong> <strong>An<strong>to</strong>nio</strong> <strong>Region</strong> <strong>Freight</strong> <strong>Study</strong><strong>Freight</strong> Operational <strong>Study</strong>45,000,00040,000,00040,009,69338,856,5931998202535,000,00030,000,00025,000,00020,000,00015,000,00010,000,0005,000,000012,492,532BuildingMaterials15,665,961Food16,188,45025,336,756RawMaterials9,969,50324,204,71214,662,66122,409,429Secondary Chemical/PetroleumFigure 3-8: Total Truck Tons by Commodity6,598,87316,696,0644,589,12412,840,658758,9792,974,744581,9691,652,040Wood Machinery Textiles AgricultureWood8.1%Machinery5.6%Textiles0.9% Agriculture0.7%Building Materials15.3%Chemical/Petroleum18.0%Food19.2%Secondary12.2%Raw Materials19.9%Figure 3-9: Percentage of Truck Tons by Commodity (1998)3-13
<strong>San</strong> <strong>An<strong>to</strong>nio</strong> <strong>Region</strong> <strong>Freight</strong> <strong>Study</strong><strong>Freight</strong> Operational <strong>Study</strong>Wood9.0%Machinery6.9%Textiles1.6%Agriculture0.9%Building Materials21.6%Chemical/Petroleum12.1%Food21.0%Secondary13.1%Raw Materials13.7%Figure 3-10: Percentage of Truck Tons by Commodity (2025)All o<strong>the</strong>r29%Electrical machinery andequipment and parts17%Wood and articles2%*Nuclear reac<strong>to</strong>rs, boilers,machinery and parts17%Articles of iron or steel2%Paper and paperboard3%Furniture, Lamps andPrefabricated buildings3%**Special classificationprovisions3%Measuring and testinginstruments3%Plastics5%Mo<strong>to</strong>r vehicles and parts16%Source:U.S. Department of Transportation, Research and Innovative Technology Administration, Bureau ofTransportation Statistics, Transborder <strong>Freight</strong> Data as of April 2005.*"Nuclear reac<strong>to</strong>rs and parts" is a very small portion of trade under this commodity grouping. The majority of trade for thiscommodity is computer-related machinery and parts.**Special classification provisions" is primarily made up of U.S. goods exported and returned without having beenimproved in value or condition for imports and an estimate of low value shipments for exports.Figure 3-10a: Truck <strong>Freight</strong> Tonnage by Commodity – National (2005)3-14
<strong>San</strong> <strong>An<strong>to</strong>nio</strong> <strong>Region</strong> <strong>Freight</strong> <strong>Study</strong><strong>Freight</strong> Operational <strong>Study</strong>The truck <strong>to</strong>nnage movement of hazardous materials was not specificallyaccounted for in <strong>the</strong> 1998 Reebie data. Therefore, a methodology wasdeveloped <strong>to</strong> calculate existing and projected truck <strong>to</strong>nnages carrying hazardousmaterials. The methodology included determining <strong>the</strong> number of trucks fromexisting vehicle classification counts performed by TxDOT. Year 2003 trafficvolumes were available for <strong>the</strong> analysis, while future growth was determinedbased on projections as calculated in <strong>the</strong> SAM.While no specific information was available <strong>to</strong> account for <strong>the</strong> percentage ofhazardous materials transported on <strong>the</strong> <strong>San</strong> <strong>An<strong>to</strong>nio</strong> <strong>Region</strong> roadways, previousstudies were reviewed in order <strong>to</strong> develop a reasonable percentage of trucktraffic along <strong>the</strong>se corridors that would carry hazardous materials. A range ofpercentages of trucks carrying hazardous cargo were found on various corridorswithin <strong>the</strong> country, while a report of national statistics prepared for <strong>the</strong> FederalHighway Administration showed a national average of 7 percent.Once <strong>the</strong> number of trucks carrying hazardous cargo was calculated, aconversion <strong>to</strong> <strong>the</strong> amount of <strong>to</strong>nnage was performed. The conversion <strong>to</strong> annualtruck <strong>to</strong>ns was performed using a range of occupancy. The range assumed that<strong>the</strong> cargo occupied between 50 and 100 percent of <strong>the</strong> trailers. The results of<strong>the</strong> analysis for each corridor are shown in <strong>the</strong> Table 3-5 for <strong>the</strong> IH 10 and IH 35corridors.CorridorIH 10 East ofIH 35IH 10 Wes<strong>to</strong>f IH 35IH 35 Northof IH 10Average DailyTruck VolumeCarrying Annual Truck Tonnage Carrying Hazardous MaterialsHazardousMaterials2003 2025 2003 2025792 1,400 3,548,000 - 6,653,000 6,272,000 - 11,760,000576 1,018 2,580,000 - 4,838,000 4,562,000 - 8,553,0001,440 2,546 6,451,000 - 12,096,000 11,404,000 - 21,383,000IH 35 South504 891 2,258,000 - 4,234,000 3,991,000 - 7,484,000of IH 10Table 3-5: Estimated Hazardous Cargo Movement within <strong>the</strong> <strong>San</strong> <strong>An<strong>to</strong>nio</strong> <strong>Region</strong>on IH 10 and IH 353-15
<strong>San</strong> <strong>An<strong>to</strong>nio</strong> <strong>Region</strong> <strong>Freight</strong> <strong>Study</strong><strong>Freight</strong> Operational <strong>Study</strong>Truck Traffic VolumesOnce truck freight movements were developed and <strong>the</strong> commodity typesidentified, <strong>the</strong> model assigned all <strong>the</strong> <strong>to</strong>nnage <strong>to</strong> trucks and placed <strong>the</strong>m on <strong>the</strong>highway system. In order <strong>to</strong> identify constraints within <strong>the</strong> region that wouldhinder truck traffic movement, it was vital <strong>to</strong> determine roadway segments thathave <strong>the</strong> highest percentage of trucks both currently and in <strong>the</strong> future.Table 3-6 represents 2003 data at highway locations within <strong>the</strong> region wherepermanent count stations were located. The SAM was used <strong>to</strong> predict futureyear (2025) truck volumes, which are shown in Table 3-7. Figure 3-11 shows <strong>the</strong>locations of <strong>the</strong> permanent count stations referenced in Tables 3-6 and 3-7. It isimportant <strong>to</strong> note that <strong>the</strong> 2025 model includes planned improvements for <strong>the</strong><strong>San</strong> <strong>An<strong>to</strong>nio</strong> roadways as listed in Table 3-2.Figure 3-11: Permanent Count Station Locations3-16
<strong>San</strong> <strong>An<strong>to</strong>nio</strong> <strong>Region</strong> <strong>Freight</strong> <strong>Study</strong><strong>Freight</strong> Operational <strong>Study</strong>LocationNumberTotal VolumePercentTrucksTruckVolumeofLanes1 I35, N of I410 164,620 0.11 18,785 820032 I35, S of I410 30,145 0.21 6,396 43 I10,E of I410 38,965 0.27 10,400 44 I10, S of FM3351 55,248 0.14 7,908 45 I37, N of I10 107,080 0.06 6,120 66 I410,W of I35 113,948 0.05 6,075 67 I410, E of US 281 126,855 0.04 4,932 68 US87, N of SH46 10,027 0.07 672 49 US90, NE of US83 near Uvalde 5,592 0.26 1,480 210 US181, SE of LP1604 15,416 0.10 1,480 411 US87, W of S<strong>to</strong>ckdale 7,637 0.24 1,853 412 US281, N of <strong>San</strong> <strong>An<strong>to</strong>nio</strong> 14,432 0.14 1,956 413 US90, E of Hondo 9,007 0.20 1,814 414 SH46, E of Bandera 4,556 0.12 557 415 LP1604, NW of <strong>San</strong> <strong>An<strong>to</strong>nio</strong> 51,863 0.11 5,745 416 SH16, E of Bandera 11,241 0.14 1,518 2Table 3-6: 2003 Truck Traffic VolumesLocationTotal VolumePercentTrucksTruckVolumeNumberof Lanes1 I35, N of I410 287,500 0.11 32,807 1020252 I35, S of I410 57,761 0.21 12,255 43 I10,E of I410 74,661 0.27 19,927 44 I10, S of FM3351 105,861 0.14 15,153 85 I37, N of I10 162,500 0.06 9,287 66 I410,W of I35 218,336 0.05 11,640 107 I410, E of US 281 162,500 0.04 6,318 68 US87, N of SH46 19,213 0.07 1,288 49 US90, NE of US83 near Uvalde 10,715 0.26 2,836 210 US181, SE of LP1604 29,539 0.10 2,836 411 US87, W of S<strong>to</strong>ckdale 14,633 0.24 3,551 412 US281, N of <strong>San</strong> <strong>An<strong>to</strong>nio</strong> 27,653 0.14 3,748 613 US90, E of Hondo 17,258 0.20 3,476 414 SH46, E of Bandera 8,730 0.12 1,067 415 LP1604, NW of <strong>San</strong> <strong>An<strong>to</strong>nio</strong> 65,000 0.11 7,200 416 SH16, E of Bandera 21,539 0.14 2,909 2Table 3-7: 2025 Truck Traffic Volumes3-17
<strong>San</strong> <strong>An<strong>to</strong>nio</strong> <strong>Region</strong> <strong>Freight</strong> <strong>Study</strong><strong>Freight</strong> Operational <strong>Study</strong>Traffic Capacity AnalysisOnce <strong>the</strong> truck volumes were established, vehicular traffic was added andcongestion levels were calculated using a volume <strong>to</strong> capacity ratio (V/C). TheV/C ratio is a measure of <strong>the</strong> volume of vehicles divided by <strong>the</strong> capacity of <strong>the</strong>roadway. The V/C defines whe<strong>the</strong>r or not a roadway can accommodate <strong>the</strong>assigned demand. V/C ratios are used <strong>to</strong> broadly define problem areas on majorarterials and highways while allowing decision makers <strong>to</strong> make operationaldecisions at intersections and on-ramps. The higher a V/C, <strong>the</strong> more congested<strong>the</strong> roadway. The following descriptions are typically used for <strong>the</strong> various levelsof V/C:‣ V/C greater than 0.75 = Heavy Congestion‣ V/C of .50 <strong>to</strong> .75 = Moderate Congestion‣ V/C of less than .50 = Low or No CongestionUsing <strong>the</strong> model, roadway segments that resulted in a V/C of over 0.75 wereconsidered congested. As <strong>the</strong> level of detail for <strong>the</strong> SAM analysis does notprovide an accurate determination of <strong>the</strong> V/C for specific roadways, it wasnecessary <strong>to</strong> divide <strong>the</strong> District in<strong>to</strong> smaller traffic analysis zones that could beused <strong>to</strong> determine an average V/C. While it would be desirable <strong>to</strong> improve allareas that have congestion, it is not always feasible due <strong>to</strong> economicconsiderations. Therefore, identifying areas with a V/C over 0.75 is a reasonableapproach, especially if <strong>the</strong>re is also <strong>the</strong> presence of a high percentage of trucktraffic.Figures 3-12 and 3-14 shows <strong>the</strong> areas of congestion region-wide while Figures3-13 and 3-15 highlight <strong>the</strong> areas of congestion in <strong>the</strong> city of <strong>San</strong> <strong>An<strong>to</strong>nio</strong> foryears 1998 and 2025.3-18
<strong>San</strong> <strong>An<strong>to</strong>nio</strong> <strong>Region</strong> <strong>Freight</strong> <strong>Study</strong><strong>Freight</strong> Operational <strong>Study</strong>Figure 3-12: 1998 Congestion for <strong>San</strong> <strong>An<strong>to</strong>nio</strong> DistrictFigure 3-13: 1998 Congestion for City of <strong>San</strong> <strong>An<strong>to</strong>nio</strong>3-19
<strong>San</strong> <strong>An<strong>to</strong>nio</strong> <strong>Region</strong> <strong>Freight</strong> <strong>Study</strong><strong>Freight</strong> Operational <strong>Study</strong>Figure 3-14: 2025 Congestion for <strong>San</strong> <strong>An<strong>to</strong>nio</strong> DistrictFigure 3-15: 2025 Congestion for City of <strong>San</strong> <strong>An<strong>to</strong>nio</strong>3-20
<strong>San</strong> <strong>An<strong>to</strong>nio</strong> <strong>Region</strong> <strong>Freight</strong> <strong>Study</strong><strong>Freight</strong> Operational <strong>Study</strong>As <strong>the</strong> previous figures show areas of congestion for <strong>the</strong> <strong>San</strong> <strong>An<strong>to</strong>nio</strong> region,information from <strong>the</strong> existing count station locations were used <strong>to</strong> estimate V/Cratios. The resulting V/C calculations for <strong>the</strong> areas near <strong>the</strong> existing countlocations are shown in Table 3-8. Figures 3-16 and 3-17 graphically display <strong>the</strong>information presented in Table 3-8. The following areas were determined <strong>to</strong> beseverely congested by 2025:‣ I-10, E of I-410 (27 percent trucks)‣ SH-16, E. of Bandera (14 percent trucks)‣ I-35 North of I-410 (11 percent trucks)‣ LP 1604, NW of <strong>San</strong> <strong>An<strong>to</strong>nio</strong> (11 percent trucks)‣ I-37, N of I-10 (6 percent trucks)‣ I-410, W of I-35 (5 percent trucks)‣ I-410, E of US 281 (4 percent trucks)Location2003 2025Capacity V/C Ratio Capacity V/C Ratio1 I35, N of I410 184,000 0.89 230,000 1.252 I35, S of I410 80,000 0.38 80,000 0.723 I10,E of I410 80,000 0.49 80,000 0.934 I10, S of FM3351 80,000 0.69 184,000 0.585 I37, N of I10 130,000 0.82 130,000 1.256 I410,W of I35 130,000 0.88 230,000 0.957 I410, E of US 281 130,000 0.98 130,000 1.258 US87, N of SH46 40,000 0.25 40,000 0.489 US90, NE of US83 near Uvalde 20,000 0.28 20,000 0.5410 US181, SE of LP1604 40,000 0.39 40,000 0.7411 US87, W of S<strong>to</strong>ckdale 40,000 0.19 40,000 0.3712 US281, N of <strong>San</strong> <strong>An<strong>to</strong>nio</strong> 64,000 0.23 96,000 0.2913 US90, E of Hondo 40,000 0.23 40,000 0.4314 SH46, E of Bandera 40,000 0.11 40,000 0.2215 LP1604, NW of <strong>San</strong> <strong>An<strong>to</strong>nio</strong> 52,000 1.00 52,000 1.2516 SH16, E of Bandera 20,000 0.56 20,000 1.08Table 3-8: Capacity Summary3-21
<strong>San</strong> <strong>An<strong>to</strong>nio</strong> <strong>Region</strong> <strong>Freight</strong> <strong>Study</strong><strong>Freight</strong> Operational <strong>Study</strong>8161441215761531321011Legend (V/C Ratio)< 0.50.5 – 0.75> 0.75Figure 3-16: 1998 Congestion Near Existing Count Locations8161441215761531321011Legend (V/C Ratio)< 0.50.5 – 0.75> 0.75Figure 3-17: 2025 Congestion Near Existing Count Locations3-22
<strong>San</strong> <strong>An<strong>to</strong>nio</strong> <strong>Region</strong> <strong>Freight</strong> <strong>Study</strong><strong>Freight</strong> Operational <strong>Study</strong>The efficiency of truck and vehicle movement was evaluated by determining <strong>the</strong>travel distance within specific time periods from <strong>the</strong> <strong>San</strong> <strong>An<strong>to</strong>nio</strong> region. Figure3-18 shows <strong>the</strong> projected vehicle travel times as <strong>the</strong>y vary by travel distance from<strong>the</strong> <strong>San</strong> <strong>An<strong>to</strong>nio</strong> region if no capacity improvements were implemented, whileFigure 3-19 illustrates <strong>the</strong> projected travel times that would be experienced if <strong>the</strong>planned 2025 improvements were constructed.The results show that <strong>the</strong> travel times per specified distance that a truck couldtravel would be reduced once <strong>the</strong> planned improvements are constructed. Theplanned improvements for <strong>the</strong> <strong>San</strong> <strong>An<strong>to</strong>nio</strong> region as well as those improvementsplanned in o<strong>the</strong>r regions were incorporated for this analysis. For instance, withplanned improvements it is projected that trucks could travel from <strong>San</strong> <strong>An<strong>to</strong>nio</strong>through <strong>the</strong> Dallas/Fort Worth Metroplex, Hous<strong>to</strong>n region, and Austin within <strong>the</strong>studied time frames. Without <strong>the</strong> planned improvements incorporated throughout<strong>the</strong> state, truck traffic would not be able <strong>to</strong> travel through <strong>the</strong> Dallas/Fort WorthMetroplex, Hous<strong>to</strong>n region, or Austin within <strong>the</strong> eight hour travel time. Modelresults showed that traveling through <strong>the</strong> major urban areas from <strong>San</strong> <strong>An<strong>to</strong>nio</strong>would take trucks between 10 and 14 hours without <strong>the</strong> planned improvements.3-23
<strong>San</strong> <strong>An<strong>to</strong>nio</strong> <strong>Region</strong> <strong>Freight</strong> <strong>Study</strong><strong>Freight</strong> Operational <strong>Study</strong>AMARILLOkLUBBOCKkEL PASOkODESSAkFORT WORTHDALLASk kTYLERkAUSTINkSAN ANTONIOkHOUSTONkLEGENDTravel Time (Hours)12345678kMajor CitiesRoadsLAREDOkCORPUS CHRISTIkBROWNSVILLEkFigure 3-18: <strong>San</strong> <strong>An<strong>to</strong>nio</strong> <strong>Region</strong> Travel Time with No-Build Network - 2025AMARILLOkLUBBOCKkEL PASOkODESSAkFORT WORTHDALLASk kk TYLERAUSTINkSAN ANTONIOkHOUSTONkLEGENDTravel Time (Hours) k Major Cities1CORPUS CHRISTICounty BoundaryLAREDO k2kRoads345BROWNSVILLE6k78Figure 3-19: <strong>San</strong> <strong>An<strong>to</strong>nio</strong> <strong>Region</strong> Travel Time with Planned Improvements - 20253-24
<strong>San</strong> <strong>An<strong>to</strong>nio</strong> <strong>Region</strong> <strong>Freight</strong> <strong>Study</strong><strong>Freight</strong> Operational <strong>Study</strong>Roadway Infrastructure Alternatives Analysis and EvaluationThe analysis shows that a large portion of <strong>the</strong> major roadways within <strong>the</strong> city of<strong>San</strong> <strong>An<strong>to</strong>nio</strong> would experience severe congestion by <strong>the</strong> year 2025. With thislevel of expected congestion, improvements <strong>to</strong> <strong>the</strong> city’s transportation systemare needed <strong>to</strong> continue efficient movement of goods throughout <strong>the</strong> state. Thissection provides an analysis of alternatives <strong>to</strong> improve <strong>the</strong> movement of truckswithin <strong>the</strong> region. The alternatives that were analyzed included <strong>the</strong> following:‣ Roadway capacity improvements including relocating roadways anddedicated truck lanes;‣ Highway-railroad grade separations and closures; and,‣ Shifting freight cargo from trucks <strong>to</strong> rail.Roadway Capacity ImprovementsHeavy trucks will continue <strong>to</strong> serve a much needed purpose for both local andregional service. A number of facilities located within <strong>the</strong> city use trucks <strong>to</strong> shipgoods <strong>to</strong> local businesses and warehouses as well as regional locations.Therefore, it is necessary <strong>to</strong> make local roadway capacity improvements if <strong>the</strong>desire is <strong>to</strong> maintain efficient movement of truck freight. Roadway capacityimprovements can come through operational or geometric means. Operationalimprovements include more efficient signal timing, signing, striping or <strong>the</strong> use ofintelligent transportation systems. Operational improvements are consideredlower cost and do not require additional right-of-way.Geometric improvements can include additional lanes for through or turningtraffic as well as using channelization methods that would encourage increasedtraffic flow. The planned roadway capacity improvements and new locationroadways for <strong>the</strong> <strong>San</strong> <strong>An<strong>to</strong>nio</strong> region were provided in <strong>the</strong> MetropolitanTransportation Plan developed by <strong>the</strong> <strong>San</strong> <strong>An<strong>to</strong>nio</strong> – Bexar County MetropolitanPlanning Organization. Reasonably foreseeable future highway projects shownin <strong>the</strong> TTC-35 Draft Environmental Impact Statement were also included. Theroadway capacity upgrades described in Table 3-2 and Figure 3-2 were applied<strong>to</strong> <strong>the</strong> 2025 roadway network.Dedicated truck lanes may provide timely and efficient truck flows if provided in<strong>the</strong> proper locations. The interaction of trucks and passenger cars decreases <strong>the</strong>capacity of a roadway. The separation of truck traffic and passenger cars mayprovide a more efficient use of <strong>the</strong> roadway and result in safer driving conditions.Specifically, <strong>the</strong> Trans <strong>Texas</strong> Corridor plan is for an all-<strong>Texas</strong> transportationnetwork of corridors up <strong>to</strong> 1,200 feet wide. The corridors would include separate<strong>to</strong>ll-ways for passenger vehicles and trucks as well as for high-speed passengerrail, high-speed freight, commuter rail and a dedicated utility zone. Roadwaysthat provide separate truck lanes may benefit both truck and passenger mobility.A planning study is currently underway for <strong>the</strong> Trans-<strong>Texas</strong> Corridor alongIH 35 (TTC-35) from Laredo <strong>to</strong> <strong>the</strong> Red River. TTC-35 is <strong>the</strong> proposed multi-use,3-25
<strong>San</strong> <strong>An<strong>to</strong>nio</strong> <strong>Region</strong> <strong>Freight</strong> <strong>Study</strong><strong>Freight</strong> Operational <strong>Study</strong>statewide network of transportation routes in <strong>Texas</strong> that would incorporateexisting and new highways, railways, and utility rights-of-way. Ultimately <strong>the</strong>corridor would connect Mexico <strong>to</strong> Canada.Preferred corridor alternatives for TTC-35 projects in <strong>the</strong> <strong>San</strong> <strong>An<strong>to</strong>nio</strong> regionhave been determined and are presented in <strong>the</strong> Tier 1 Draft EnvironmentalImpact Statement (DEIS). According <strong>to</strong> <strong>the</strong> DEIS, <strong>the</strong> strategy for TTC-35 near<strong>San</strong> <strong>An<strong>to</strong>nio</strong> is <strong>to</strong> utilize <strong>the</strong> existing IH 35 corridor from Laredo <strong>to</strong> <strong>the</strong> BexarCounty line. The corridor would <strong>the</strong>n travel east-west on <strong>the</strong> sou<strong>the</strong>rn portion of<strong>the</strong> county and avoid <strong>the</strong> urban area on <strong>the</strong> east side of <strong>the</strong> city. The corridorwould <strong>the</strong>n parallel <strong>the</strong> existing IH 35 corridor north of <strong>San</strong> <strong>An<strong>to</strong>nio</strong>. For trucksdesiring <strong>to</strong> travel north or south of <strong>San</strong> <strong>An<strong>to</strong>nio</strong>, TTC-35 would serve as a bypassroute for <strong>the</strong> city. This type of route would benefit a number of <strong>the</strong> alreadyoverloaded and projected congested roadways. For instance, providing a northsouthbypass route around <strong>San</strong> <strong>An<strong>to</strong>nio</strong> would decrease <strong>the</strong> number of trucksthat might o<strong>the</strong>rwise utilize IH-410.Table 3-7 depicts <strong>the</strong> high truck volumes that are projected <strong>to</strong> move through <strong>the</strong>city in 2025. Figure 3-15, shows that <strong>the</strong> core of <strong>the</strong> city is highly congested. Aregional route that allows a portion of truck traffic <strong>to</strong> bypass <strong>the</strong> city core maypotentially reduce <strong>the</strong> congestion levels along <strong>San</strong> <strong>An<strong>to</strong>nio</strong>’s transportationsystem.Grade Separation/ClosuresGrade separations and crossing closures at roadway-railroad crossings areidentified in this report (Section 7) as potential improvements and were modeled<strong>to</strong> determine <strong>the</strong>ir impacts on delay time, fuel consumption, and emissions within<strong>the</strong> study area. Grade separations consist of bridges (overpass or underpass) <strong>to</strong>separate <strong>the</strong> railroad from <strong>the</strong> streets. A grade separation allows increasedcapacity on a roadway since <strong>the</strong> delay due <strong>to</strong> passing trains is eliminated.Crossing closures consist of closing <strong>the</strong> street and rerouting traffic at <strong>the</strong>intersection with <strong>the</strong> railroad.Shift Cargo from Trucks <strong>to</strong> RailThe final strategy that could be implemented <strong>to</strong> improve truck flow on <strong>San</strong><strong>An<strong>to</strong>nio</strong> area roadways is <strong>to</strong> reduce <strong>the</strong> number of trucks needed on <strong>the</strong> roadwayby relying more on freight rail <strong>to</strong> move cargo. By using freight rail more <strong>to</strong> shipregional cargo, <strong>the</strong> number of trucks that need <strong>to</strong> be on local roadways will bereduced. As shown in Figure 3-7, approximately 70 percent of truck trafficoriginates within a 300 mile radius from <strong>the</strong> <strong>San</strong> <strong>An<strong>to</strong>nio</strong> region. A scenario wasdeveloped that shifted 15 percent of cargo that was normally shipped by truck adistance greater than 300 miles <strong>to</strong> rail cars.Alternatives AnalysisThe analysis of alternatives was determined through an evaluation that includeda comparison of mobility measures of effectiveness (MOE). The MOE’s that3-26
<strong>San</strong> <strong>An<strong>to</strong>nio</strong> <strong>Region</strong> <strong>Freight</strong> <strong>Study</strong><strong>Freight</strong> Operational <strong>Study</strong>were used in this evaluation were delay, emissions and fuel consumption due <strong>to</strong>delay. A daily cost was associated with each of <strong>the</strong> MOE’s. The followingalternatives were analyzed and compared:‣ No-build;‣ Planned roadway capacity improvements;‣ Planned roadway capacity improvements with a 15 percent cargo shiftfrom truck <strong>to</strong> rail;‣ Grade separations/closures;‣ Grade separations/closures with 15 percent shift from truck <strong>to</strong> rail.The no-build case for <strong>the</strong> analysis was developed using <strong>the</strong> existing roadwaynetwork with <strong>the</strong> projected 2025 traffic volumes. The planned improvementsproposed in <strong>the</strong> 2030 MTP and TTC-35 DEIS include a combination of roadwaycapacity upgrades and new location roadways. Figures 3-20, 3-22 and 3-24show <strong>the</strong> comparison of results for <strong>the</strong> no-build, planned roadway capacityimprovements, and planned roadway capacity improvements with a 15 percentcargo shift from truck <strong>to</strong> rail. Figures 3-21, 3-23 and 3-25 provide an associatedestimated daily cost for each of <strong>the</strong> MOE’s. These results show a comparison for<strong>the</strong> entire <strong>San</strong> <strong>An<strong>to</strong>nio</strong> region. As shown in <strong>the</strong> following figures, a shift of 15percent of truck cargo <strong>to</strong> rail cars has little impacts on delay, fuel consumption,and emissions on <strong>the</strong> roadways.800,000728,662700,000600,000Daily Delay (Hours)500,000400,000300,000345,534 342,079200,000100,0000No Build Planned Roadway Capacity Improvements Planned Roadway Capacity Improvementswith 15% Cargo Shift from Truck <strong>to</strong> RailFigure 3-20: Comparison of Total Daily Delay for <strong>San</strong> <strong>An<strong>to</strong>nio</strong> <strong>Region</strong>3-27
<strong>San</strong> <strong>An<strong>to</strong>nio</strong> <strong>Region</strong> <strong>Freight</strong> <strong>Study</strong><strong>Freight</strong> Operational <strong>Study</strong>$14,000,000$12,387,254$12,000,000$10,000,000Daily Delay Cost$8,000,000$6,000,000$5,874,078 $5,815,337$4,000,000$2,000,000$0No BuildPlanned Roadway Capacity Improvements Planned Roadway Capacity Improvementswith 15% Cargo Shift from Truck <strong>to</strong> RailFigure 3-21: Comparison of Total Daily Delay Cost for <strong>San</strong> <strong>An<strong>to</strong>nio</strong> <strong>Region</strong>80,00070,00069,223Daily Fuel Consumption Due <strong>to</strong> Delay (gallons)60,00050,00040,00030,00020,00032,826 32,49710,0000No Build Planned Roadway Capacity Improvements Planned Roadway Capacity Improvementswith 15% Cargo Shift from Truck <strong>to</strong> RailFigure 3-22: Comparison of Total Daily Fuel Consumption Due <strong>to</strong> Delay for <strong>San</strong><strong>An<strong>to</strong>nio</strong> <strong>Region</strong>3-28
<strong>San</strong> <strong>An<strong>to</strong>nio</strong> <strong>Region</strong> <strong>Freight</strong> <strong>Study</strong><strong>Freight</strong> Operational <strong>Study</strong>$180,000$166,135$160,000Daily Fuel Consumption Cost Due <strong>to</strong> Delay$140,000$120,000$100,000$80,000$60,000$40,000$78,782 $77,994$20,000$0No Build Planned Roadway Capacity Improvements Planned Roadway Capacity Improvementswith 15% Cargo Shift from Truck <strong>to</strong> RailFigure 3-23: Comparison of Total Daily Fuel Consumption Cost Due <strong>to</strong> Delay for<strong>San</strong> <strong>An<strong>to</strong>nio</strong> <strong>Region</strong>600,000564,831500,000471,216 466,504Daily Emissions (lbs.)400,000300,000200,000VOC (lbs)CO (lbs)NOx (lbs)VOC – volatile organic compoundsCO – carbon monoxideNOx – nitrous oxides100,000100,559 101,600 100,58426,79017,596 17,4200No BuildPlanned Roadway CapacityImprovementsPlanned Roadway CapacityImprovements with 15% Cargo Shiftfrom Truck <strong>to</strong> RailFigure 3-24: Comparison of Total Daily Emissions for <strong>San</strong> <strong>An<strong>to</strong>nio</strong> <strong>Region</strong>3-29
<strong>San</strong> <strong>An<strong>to</strong>nio</strong> <strong>Region</strong> <strong>Freight</strong> <strong>Study</strong><strong>Freight</strong> Operational <strong>Study</strong>$190,000$180,000$180,469Daily Emissions Cost$170,000$170,190$168,488$160,000$150,000No Build Planned Roadway Capacity Improvements Planned Roadway Capacity Improvementswith 15% Cargo Shift from Truck <strong>to</strong> RailFigure 3-25: Comparison of Total Daily Emissions Cost for <strong>San</strong> <strong>An<strong>to</strong>nio</strong> <strong>Region</strong>Implementing <strong>the</strong> planned roadways improvements identified in <strong>the</strong> 2025 MTPand TTC-35 DEIS resulted in <strong>the</strong> largest improvement in terms of reduced delay,fuel consumption, and emissions. The planned improvements are projected <strong>to</strong>decrease daily delay by approximately 53 percent which would result in a costsavings of nearly $6.6 million per day. Therefore, <strong>the</strong> implementation of <strong>the</strong>planned improvements is projected <strong>to</strong> save <strong>the</strong> traveling public approximately$1.9 billion for <strong>the</strong> entire year 2025. Shifting 15 percent of truck cargo <strong>to</strong> rail isprojected <strong>to</strong> result in an additional 1 percent savings in delay or approximately$60,000 per day. The cargo shift was performed for trucks with routes greaterthan 300 miles from <strong>the</strong> <strong>San</strong> <strong>An<strong>to</strong>nio</strong> region. The reduction of trucks onroadways within <strong>the</strong> <strong>San</strong> <strong>An<strong>to</strong>nio</strong> region resulting from <strong>the</strong> cargo shift was lessthan 2 percent.It was estimated that approximately 36,000 gallons of fuel or $88,000 per daywould be saved as a result of constructing <strong>the</strong> planned capacity improvements.The cargo shift is projected <strong>to</strong> save approximately 326 gallons or $800 per day.Emissions calculations are based on projected vehicle-miles of travel andprojected vehicle speeds. The vehicle-miles of travel typically increase forscenarios that include adding lanes <strong>to</strong> <strong>the</strong> roadway system. However, newroadways will help <strong>to</strong> reduce travel distances between origins and destinationswhich will reduce <strong>the</strong> <strong>to</strong>tal number of miles traveled. A comparison between <strong>the</strong>vehicle-miles of travel for <strong>the</strong> no-build and planned improvements resulted in areduction of approximately 800,000 vehicle miles or 1 percent. The average3-30
<strong>San</strong> <strong>An<strong>to</strong>nio</strong> <strong>Region</strong> <strong>Freight</strong> <strong>Study</strong><strong>Freight</strong> Operational <strong>Study</strong>vehicle speed within <strong>the</strong> <strong>San</strong> <strong>An<strong>to</strong>nio</strong> region due <strong>to</strong> <strong>the</strong> implementation of <strong>the</strong>planned improvements increased approximately 5 percent. The emissions costsavings per day for <strong>the</strong> planned improvements was estimated as approximately$10,000, while <strong>the</strong> savings for <strong>the</strong> cargo shift was projected as an additional$2,000 per day.An analysis was also performed <strong>to</strong> determine <strong>the</strong> benefit for implementing <strong>the</strong>grade separations and crossing closures as well as <strong>the</strong> cumulative benefit of <strong>the</strong>grade separations and closures with <strong>the</strong> 15 percent cargo shift from truck <strong>to</strong> rail.The no-build scenario was considered <strong>the</strong> base case. Total delay, fuelconsumption and emissions comparisons are shown in Figures 3-26, 3-28 and 3-30 while cost comparisons for each of <strong>the</strong> MOE’s are shown in Figures 3-27, 3-29 and 3-31.740,000730,000728,662720,000Daily Delay (Hours)710,000708,247701,165700,000690,000680,000No Build Grade Separations/Closures Grade Separations/Closures with 15%Cargo Shift from Truck <strong>to</strong> RailFigure 3-26: Comparison of Total Delay for <strong>San</strong> <strong>An<strong>to</strong>nio</strong> <strong>Region</strong>3-31
<strong>San</strong> <strong>An<strong>to</strong>nio</strong> <strong>Region</strong> <strong>Freight</strong> <strong>Study</strong><strong>Freight</strong> Operational <strong>Study</strong>$12,500,000$12,400,000$12,387,254$12,300,000$12,200,000Daily Delay Cost$12,100,000$12,000,000$12,040,205$11,919,803$11,900,000$11,800,000$11,700,000$11,600,000No Build Grade Separations/Closures Grade Separations/Closures with 15%Cargo Shift from Truck <strong>to</strong> RailFigure 3-27: Comparison of Total Delay Cost for <strong>San</strong> <strong>An<strong>to</strong>nio</strong> <strong>Region</strong>70,00069,22369,000Daily Fuel Consumption Due <strong>to</strong> Delay (gallons)68,00067,00067,28366,61166,00065,000No Build Grade Separations/Closures Grade Separations/Closures with 15%Cargo Shift from Truck <strong>to</strong> RailFigure 3-28: Comparison of Total Daily Fuel Consumption due <strong>to</strong> Delayfor <strong>San</strong> <strong>An<strong>to</strong>nio</strong> <strong>Region</strong>3-32
<strong>San</strong> <strong>An<strong>to</strong>nio</strong> <strong>Region</strong> <strong>Freight</strong> <strong>Study</strong><strong>Freight</strong> Operational <strong>Study</strong>$168,000$166,000$166,135Daily Fuel Consumption Cost Due <strong>to</strong> Delay$164,000$162,000$160,000$161,480$159,866$158,000$156,000No Build Grade Separations/Closures Grade Separations/Closures with 15%Cargo Shift from Truck <strong>to</strong> RailFigure 3-29: Comparison of Total Daily Fuel Consumption Cost due <strong>to</strong> Delay for<strong>San</strong> <strong>An<strong>to</strong>nio</strong> <strong>Region</strong>600,000564,831 561,260 555,647500,000400,000Daily Emissions (lbs.)300,000200,000VOC (lbs)CO (lbs)NOx (lbs)VOC – volatile organic compoundsCO – carbon monoxideNOx – nitrous oxides100,000100,559 99,952 98,95226,790 26,618 26,3520No Build Grade Separations/Closures Grade Separations/Closures with 15%Cargo Shift from Truck <strong>to</strong> RailFigure 3-30: Comparison of Total Daily Emissions for <strong>San</strong> <strong>An<strong>to</strong>nio</strong> <strong>Region</strong>3-33
<strong>San</strong> <strong>An<strong>to</strong>nio</strong> <strong>Region</strong> <strong>Freight</strong> <strong>Study</strong><strong>Freight</strong> Operational <strong>Study</strong>$190,000$180,000$180,469$179,365$177,572Daily Emissions Cost$170,000$160,000$150,000No Build Grade Separations/Closures Grade Separations/Closures with 15%Cargo Shift from Truck <strong>to</strong> RailFigure 3-31: Comparison of Total Daily Emissions Cost for <strong>San</strong> <strong>An<strong>to</strong>nio</strong> <strong>Region</strong>The modeled grade separations and closures as well as <strong>the</strong> cumulative scenarioincluding <strong>the</strong> grade separations and closures with <strong>the</strong> cargo shift resulted inreduced delay and fuel consumption, although showed little benefit in terms ofreduced emissions. The daily delay savings for implementing <strong>the</strong> recommendedgrade crossings and closures was projected as 20,400 hours with an estimatedcost savings of $347,000 per day. The cumulative effect of <strong>the</strong> gradeseparations and closures with <strong>the</strong> cargo shift is projected <strong>to</strong> result in a savings ofapproximately 27,000 hours and $470,000 per day between <strong>the</strong> no-build scenarioand <strong>the</strong> grade separations/closures. This cost would translate in<strong>to</strong> an annual costsavings of approximately $132 million.The savings in fuel consumption due <strong>to</strong> <strong>the</strong> grade separations and closures wasestimated as nearly 2000 gallons and approximately $4,700 per day. The fuelconsumption savings due <strong>to</strong> <strong>the</strong> cumulative effect of <strong>the</strong> grade separations andclosures with <strong>the</strong> cargo shift was projected as 2,600 gallons and approximately$6,300 per day. Therefore, <strong>the</strong> cargo shift resulted in less than a 1 percentimprovement for fuel consumption savings.The emissions analysis projected that grade separations and closures wouldsave <strong>the</strong> <strong>San</strong> <strong>An<strong>to</strong>nio</strong> region approximately $1,200 per day. The cumulativeeffect of <strong>the</strong> grade separations and closures were projected <strong>to</strong> improve <strong>the</strong> regionby approximately $2,900 per day which would translate in<strong>to</strong> approximately$870,000 per year.3-34
<strong>San</strong> <strong>An<strong>to</strong>nio</strong> <strong>Region</strong> <strong>Freight</strong> <strong>Study</strong><strong>Freight</strong> Operational <strong>Study</strong>The analysis projected that implementing <strong>the</strong> planned roadway capacityimprovements resulted in a <strong>to</strong>tal cost savings of over $6.6 million per day. Theplanned improvements with <strong>the</strong> cargo shift resulted in a projected <strong>to</strong>tal dailysavings of nearly $6.7 million. Implementing <strong>the</strong> grade separations and closuresresulted in a projected daily savings of over $350,000 while <strong>the</strong> cumulativesavings of <strong>the</strong> grade separations and closures with <strong>the</strong> cargo shift resulted innearly $477,000 savings per day. A <strong>to</strong>tal cost savings of nearly $7.1 million perday was projected when <strong>the</strong> planned roadway capacity improvements, gradeseparations and closures and <strong>the</strong> 15 percent cargo shift from truck <strong>to</strong> rail werecombined. Figure 3-32 illustrates <strong>the</strong> <strong>to</strong>tal projected cost savings for each of <strong>the</strong>alternatives as compared <strong>to</strong> <strong>the</strong> no-build scenario.$8,000,000$7,000,000$6,610,808 $6,672,039$7,087,425$6,000,000Total Daily Cost Savings$5,000,000$4,000,000$3,000,000$2,000,000$1,000,000$352,807$476,617$0Planned RoadwayCapacity ImprovementsPlanned RoadwayCapacity Improvementswith 15% Cargo Shiftfrom Truck <strong>to</strong> RailGradeSeparations/ClosuresGradeSeparations/Closureswith 15% Cargo Shiftfrom Truck <strong>to</strong> RailPlanned RoadwayCapacity Improvementswith GradeSeparations/Closuresand 15% Cargo Shiftfrom Truck <strong>to</strong> RailFigure 3-32: Comparison of Total Cost Savings as Compared <strong>to</strong> <strong>the</strong> No-buildImprovement <strong>to</strong> Truck Facility AccessThe MTP - Mobility 2030 developed by <strong>the</strong> <strong>San</strong> <strong>An<strong>to</strong>nio</strong>-Bexar County MPOidentifies a number of planned projects for implementation. These projects wereincorporated in<strong>to</strong> <strong>the</strong> SAM roadway network for <strong>the</strong> congestion analysis.Increased mobility of freight was one of <strong>the</strong> goals identified by <strong>the</strong> MPO indeveloping <strong>the</strong> project list. Although not analyzed individually, <strong>the</strong> plannedprojects when analyzed all <strong>to</strong>ge<strong>the</strong>r were shown <strong>to</strong> improve both general trafficand truck freight movement.The primary location of heavy truck movement occurs on <strong>the</strong> state highwaysystem, especially <strong>the</strong> interstate highways. Maintenance, capacity upgrades,3-35
<strong>San</strong> <strong>An<strong>to</strong>nio</strong> <strong>Region</strong> <strong>Freight</strong> <strong>Study</strong><strong>Freight</strong> Operational <strong>Study</strong>and new roadways are planned for <strong>the</strong> state system within <strong>the</strong> District. As mos<strong>to</strong>f <strong>the</strong> congestion occurs within <strong>the</strong> city of <strong>San</strong> <strong>An<strong>to</strong>nio</strong>, <strong>the</strong> majority of <strong>the</strong>projects are located within <strong>the</strong> city. The state highway system carries a heavytruck percentage, so it is important <strong>to</strong> provide adequate connections <strong>to</strong> <strong>the</strong> statesystem from areas of heavy truck movement. These areas of heavy truckmovement could include airports, industrial yards and intermodal facilities. Mos<strong>to</strong>f <strong>the</strong> connections <strong>to</strong> <strong>the</strong> state highway and interstate system from <strong>the</strong>se facilitiesoccur on arterial and collec<strong>to</strong>r streets. Therefore, it is important <strong>to</strong> also focus onfreight movement along arterial and collec<strong>to</strong>r streets within areas of heavy truckmovements. Some of <strong>the</strong> specific areas of major truck movement have beenidentified in <strong>the</strong> form of ports, intermodal facilities, airport and industrial parks, asshown in Figure 3-33 and listed as follows:‣ Port <strong>San</strong> <strong>An<strong>to</strong>nio</strong> (formerly Kelly Air Force Base);‣ UP Intermodal Facilities• <strong>San</strong> <strong>An<strong>to</strong>nio</strong> Terminal• <strong>San</strong> <strong>An<strong>to</strong>nio</strong> TOFC (Trailer on Flat car)• <strong>San</strong> <strong>An<strong>to</strong>nio</strong> Intermodal Terminal (under construction)‣ <strong>San</strong> <strong>An<strong>to</strong>nio</strong> International Airport‣ Industrial Parks near IH 410/IH 35 and IH 410/IH 10 Interchanges• Eastwood Industrial Park• Rittman Industrial Park• Friedrich Industrial ParkFigure 3-33: Major Truck Facilities in <strong>San</strong> <strong>An<strong>to</strong>nio</strong>3-36
<strong>San</strong> <strong>An<strong>to</strong>nio</strong> <strong>Region</strong> <strong>Freight</strong> <strong>Study</strong><strong>Freight</strong> Operational <strong>Study</strong>It is important <strong>to</strong> provide sufficient connection <strong>to</strong> <strong>the</strong> state system for all of <strong>the</strong>selocations so as <strong>to</strong> promote efficient truck movement. Each of <strong>the</strong>se facilitiesmentioned above are located in close proximity <strong>to</strong> <strong>the</strong> state highway system.Port <strong>San</strong> <strong>An<strong>to</strong>nio</strong> (formerly Kelly Air Force Base) covers approximately 2000acres and is being master planned and incorporated in<strong>to</strong> <strong>the</strong> city’s system ofdevelopment. Roadway projects are being planned that provide improvedaccess <strong>to</strong> <strong>the</strong> Port’s airfield and rail-served facilities from <strong>the</strong> city and stateroadway systems. These roadway projects are included along Cupples Road,General Hudnell/Spur 371, and Billy Mitchell Boulevard. These roadwaysprovide access <strong>to</strong> US 90. Additionally, new north-south thoroughfares will beprovided in<strong>to</strong> <strong>the</strong> Port for access <strong>to</strong> facilities.UP currently operates two intermodal facilities and is planning a third facility. The<strong>San</strong> <strong>An<strong>to</strong>nio</strong> Terminal serves Port <strong>San</strong> <strong>An<strong>to</strong>nio</strong> while <strong>the</strong> <strong>San</strong> <strong>An<strong>to</strong>nio</strong> TOFC islocated near New Braunfels Avenue and IH 35, east of US 281. UP is planning anew 300-acre facility approximately 13 miles southwest of down<strong>to</strong>wn <strong>San</strong><strong>An<strong>to</strong>nio</strong> which will replace <strong>the</strong> <strong>San</strong> <strong>An<strong>to</strong>nio</strong> Terminal. Located southwest of <strong>the</strong>IH 35/IH 410 interchange, this new facility will provide direct access <strong>to</strong> <strong>the</strong> statehighway system. The new <strong>San</strong> <strong>An<strong>to</strong>nio</strong> Intermodal Terminal (SAIT) will handlegeneral merchandise containers and trailers for retailers and distribution centers,as well as au<strong>to</strong> parts for Toyota’s new <strong>San</strong> <strong>An<strong>to</strong>nio</strong> plant. The Toyota plant islocated south of <strong>the</strong> city, north of Loop 1604 between SH 16 and US 281.The <strong>San</strong> <strong>An<strong>to</strong>nio</strong> International Airport is located on <strong>the</strong> north side of <strong>San</strong> <strong>An<strong>to</strong>nio</strong>at <strong>the</strong> intersection of Loop 410 and US 281. It is approximately 10 miles from <strong>the</strong>central business district as well as having IH 35 <strong>to</strong> <strong>the</strong> east and IH 10 <strong>to</strong> <strong>the</strong> west.Truck movement occurs at <strong>the</strong> two cargo facilities on airport property as well aswarehouses in <strong>the</strong> vicinity of <strong>the</strong> airport.Three industrial parks are located in <strong>the</strong> vicinity of <strong>the</strong> interchanges of IH 410/IH35 and IH 410/IH 10. Rail line access is provided for <strong>the</strong>se industrial parks andheavy truck movement is projected in <strong>the</strong> vicinity.Focused studies <strong>to</strong> evaluate access and mobility needs for <strong>the</strong>se facilities ando<strong>the</strong>rs will be needed as <strong>the</strong> truck movement increases for <strong>the</strong> <strong>San</strong> <strong>An<strong>to</strong>nio</strong>District. Operational and geometric improvements could be implemented as aresult of <strong>the</strong>se focused studies.Rail <strong>Freight</strong> Movements and CommoditiesThe SAM was not specifically designed <strong>to</strong> analyze freight rail movement, and asa result, <strong>the</strong> 1998 base year freight rail volumes (based on 1998 Reebie data andincorporated in<strong>to</strong> SAM) were well below 1998 actual freight <strong>to</strong>nnages. SAM,however, incorporates methodology and analytical techniques within <strong>the</strong> modelthat are appropriate <strong>to</strong> forecast percentages of commodity growth. <strong>Freight</strong>railroads, because <strong>the</strong>y are a private industry, do not typically publicize <strong>the</strong>ir3-37
<strong>San</strong> <strong>An<strong>to</strong>nio</strong> <strong>Region</strong> <strong>Freight</strong> <strong>Study</strong><strong>Freight</strong> Operational <strong>Study</strong>internal forecasts for commodity growth, which complicated <strong>the</strong> availability ofaccurate information <strong>to</strong> be used for <strong>the</strong> base year within SAM. To get a moreaccurate and updated picture of <strong>the</strong> 2004 and subsequent 2025 rail freightmovements, data was collected from <strong>the</strong> STB Waybill Data. The STB data alongwith rail <strong>to</strong>nnage maps, shown in Figure 3-34, were compared for accuracy andprovide a clear picture of <strong>the</strong> current and future outlook for freight movementsthroughout <strong>the</strong> state. For example, data provided by UP for <strong>the</strong> purpose of thisstudy depicted in Figure 3-34, shows that in 2004 <strong>the</strong>re are 98 Million GrossTons (MGT) of freight rail coming in<strong>to</strong> <strong>the</strong> area, and 95 MGT leaving <strong>the</strong> area.This correlates <strong>to</strong> approximately 56 million revenue <strong>to</strong>ns of freight coming in and54 million revenue <strong>to</strong>ns of freight going out, or over approximately 50 trains dailyin <strong>the</strong> area. 1Rock and coal trains in <strong>the</strong> area account for over 10 MGT, or nearly 600 rail carsdaily. On average, <strong>the</strong>re are nearly 6,500 rail car movements within <strong>the</strong> <strong>San</strong><strong>An<strong>to</strong>nio</strong> area on a daily basis. As will be seen later in this section, <strong>the</strong>approximate 110 million revenue <strong>to</strong>ns of rail freight moved within <strong>the</strong> area in2004 is comparable <strong>to</strong> that determined via SAM after <strong>the</strong> input of typicalincremental growth from 1998 <strong>to</strong> 2004.<strong>Freight</strong> rail commodity movements were analyzed within <strong>Texas</strong>, and also thosecommodities destined for o<strong>the</strong>r locations within <strong>the</strong> country and/or Mexico, asdetermined by SAM. The growth patterns resulting from SAM forecasting were<strong>the</strong>n applied <strong>to</strong> <strong>the</strong>se patterns, providing forecasts based on 2004 actualinformation. It is also important <strong>to</strong> note that products coming in<strong>to</strong> <strong>Texas</strong> alsocome from air cargo and water vessels.1 Percentage of million revenue <strong>to</strong>ns <strong>to</strong> million gross <strong>to</strong>ns based on data compiled from 2003Surface Transportation Board waybill data statistics.3-38
<strong>San</strong> <strong>An<strong>to</strong>nio</strong> <strong>Region</strong> <strong>Freight</strong> <strong>Study</strong><strong>Freight</strong> Operational <strong>Study</strong>Figure 3-34: 2004 <strong>San</strong> <strong>An<strong>to</strong>nio</strong> Area Railroad Million Gross Tons 2Rail <strong>Freight</strong> Movements for <strong>San</strong> <strong>An<strong>to</strong>nio</strong>, <strong>the</strong> State, and <strong>the</strong> CountryMuch like <strong>the</strong> truck movements described in Table 3-3, rail freight movementsare also growing. Table 3-9 illustrates that <strong>the</strong> region will continue <strong>to</strong> export agreat deal of commodities through <strong>the</strong> year 2025. The table describes eachmovement type that would ei<strong>the</strong>r originate or end in <strong>the</strong> <strong>San</strong> <strong>An<strong>to</strong>nio</strong> District. Forinstance, internal <strong>to</strong> internal movements occur within <strong>the</strong> District while all o<strong>the</strong>rmovements (internal <strong>to</strong> external; external <strong>to</strong> internal) occur ei<strong>the</strong>r between <strong>the</strong><strong>San</strong> <strong>An<strong>to</strong>nio</strong> District and o<strong>the</strong>r <strong>Texas</strong> counties or between <strong>the</strong> <strong>San</strong> <strong>An<strong>to</strong>nio</strong>District and <strong>the</strong> rest of <strong>the</strong> US and Mexico. Modest increases are projected <strong>to</strong>occur via rail freight internal <strong>to</strong> <strong>the</strong> region, but overall, <strong>the</strong> most significantincreases are between <strong>San</strong> <strong>An<strong>to</strong>nio</strong> and <strong>the</strong> US and Mexico. More than 29million additional <strong>to</strong>ns will be exported <strong>to</strong> o<strong>the</strong>r <strong>Texas</strong> counties and more than800,000 additional <strong>to</strong>ns will be exported <strong>to</strong> o<strong>the</strong>r states and Mexico by 2025.Approximately 17 million additional <strong>to</strong>ns will be imported from o<strong>the</strong>r US statesand Mexico <strong>to</strong> <strong>the</strong> <strong>San</strong> <strong>An<strong>to</strong>nio</strong> region. The challenge will be <strong>to</strong> efficiently2 Tonnage Chart for Year 2004, <strong>San</strong> <strong>An<strong>to</strong>nio</strong> – Union Pacific Railroad, March 1, 20053-39
<strong>San</strong> <strong>An<strong>to</strong>nio</strong> <strong>Region</strong> <strong>Freight</strong> <strong>Study</strong><strong>Freight</strong> Operational <strong>Study</strong>transport this additional <strong>to</strong>nnage and determine how <strong>the</strong> State may plan for <strong>the</strong>additional infrastructure <strong>to</strong> accommodate such needs.Annual Rail TonsOrigin Termination 2004 2025PercentChangeInternal <strong>to</strong> Internal<strong>San</strong> <strong>An<strong>to</strong>nio</strong>District <strong>San</strong> <strong>An<strong>to</strong>nio</strong> District 399,413 773,309 94%Internal <strong>to</strong> External<strong>San</strong> <strong>An<strong>to</strong>nio</strong>District O<strong>the</strong>r <strong>Texas</strong> Counties 21,610,002 50,164,131 132%<strong>San</strong> <strong>An<strong>to</strong>nio</strong>District Western US 156,724 360,184 130%<strong>San</strong> <strong>An<strong>to</strong>nio</strong>District Nor<strong>the</strong>rn US 156,724 360,184 130%<strong>San</strong> <strong>An<strong>to</strong>nio</strong>District Eastern US 208,966 480,245 130%<strong>San</strong> <strong>An<strong>to</strong>nio</strong>District Mexico 87,069 200,102 130%External <strong>to</strong> InternalO<strong>the</strong>r <strong>Texas</strong>Counties <strong>San</strong> <strong>An<strong>to</strong>nio</strong> District 1,445,618 3,322,322 130%Western US <strong>San</strong> <strong>An<strong>to</strong>nio</strong> District 3,310,935 7,609,195 130%Nor<strong>the</strong>rn US <strong>San</strong> <strong>An<strong>to</strong>nio</strong> District 3,310,935 7,609,195 130%Eastern US <strong>San</strong> <strong>An<strong>to</strong>nio</strong> District 4,414,581 10,145,594 130%Mexico <strong>San</strong> <strong>An<strong>to</strong>nio</strong> District 1,839,409 4,227,331 130%Total 36,940,376 85,251,791 131%*Source: Statewide Analysis Model based on 2004 Surface Transportation Board Waybill DataTable 3-9: Rail <strong>Freight</strong> MovementsRail <strong>Freight</strong> Movements within <strong>the</strong> StateUnlike truck freight, rail movements are somewhat limited in <strong>the</strong>ir ability <strong>to</strong> deliverdoor <strong>to</strong> door service. Intermodal centers, rail yards, and ports of entry (both landand water) are <strong>the</strong> primary locations in which rail freight can be ei<strong>the</strong>r sent orreceived. Figure 3-35 illustrates <strong>the</strong> origin and destinations for freight railmovements occurring in 2004. Hous<strong>to</strong>n, Dallas/Forth Worth, Laredo, andBrownsville handled <strong>the</strong> largest movements. Figure 3-36 shows o<strong>the</strong>r locationssuch as El Paso, <strong>the</strong> <strong>Texas</strong> Gulf Port cities, and parts of East <strong>Texas</strong> beginning <strong>to</strong>emerge as major origins or destinations in future years. Accommodating <strong>the</strong>seand o<strong>the</strong>r locations with freight rail service will be critical <strong>to</strong> <strong>the</strong> future of <strong>Texas</strong> interms of economic growth and also providing options <strong>to</strong> shift truck cargo <strong>to</strong> railcars.3-40
<strong>San</strong> <strong>An<strong>to</strong>nio</strong> <strong>Region</strong> <strong>Freight</strong> <strong>Study</strong><strong>Freight</strong> Operational <strong>Study</strong>98841371134901209Rail Tons (2004) - From and To <strong>San</strong> <strong>An<strong>to</strong>nio</strong> District1103106149301190216565010850192880446001191359385081029010LEGENDRail Tonnage0 - 8,5018,502 - 36,13336,134 - 86,1118 186,112 - 153,925153,926 - 267,913267,914 - 868,386868,387 - 4,909,5534,909,554 - 10,667,395001473xx00024077651457002970489902011502479002535461024396140470075118710899<strong>San</strong> <strong>An<strong>to</strong>nio</strong> DistrictPort02530000 0 0 0350870000000004579101272019289017300785407300000001700118115500004772538178011773017099830004410701960000120357003246682914020030564522206850494380171107216546700107786301534125736260261115750852039946762099010268333400983861118501676103786838614462056515392500125736342215901193121513645579415815819158191368945869490223118 6721678561647030875819113570942020280133189804343090196509976422611224278149095531785093613356101066739501638655282142444550464865456003553341835187 16138959904479695613267913121819272130107193133292133292 1280785744794475700717835Rail Tonnage To/From Ports1. Port of Hous<strong>to</strong>n - 1,583,6032. Port of Freeport - 6973. Port of Corpus Christi - 8,1994. Port of Brownsville - 8695. Port of Beaumont - 26,684Figure 3-35: 2004 Rail <strong>Freight</strong> Movements3-41
<strong>San</strong> <strong>An<strong>to</strong>nio</strong> <strong>Region</strong> <strong>Freight</strong> <strong>Study</strong><strong>Freight</strong> Operational <strong>Study</strong>2271731626062070482Rail Tons (2025) - From and To <strong>San</strong> <strong>An<strong>to</strong>nio</strong> District25352438113502740497701152494044327010250027378258850187066671LEGENDRail Tonnage0 - 19,5381919,539 - 83,04383,044 - 197,900197,901 - 353,751353,752 - 615,718615,719 - 1,995,7251,995,726 - 11,283,14111,283,142 - 24,515,8232003386xx00055317846334800684011259046234656990058815123541220993020017327283020670582<strong>San</strong> <strong>An<strong>to</strong>nio</strong> DistrictPort0000 0 0 082020100000000001052372923444330239800180493620000000400027153560000109682318794027057039122800010219224704520000290822007466697046031536012910395111360087501074001450266002742532731575 19519652225931188810295253933247723526288968165850598133217517514172561468622762359976623197900155323831953833234726435375105092719957250288968342793313602182536331337361337368479105412162074385712907716158361337369704661030643518485421546020722244083043024515823037660221798 1270505579594102491128314112915618073343001068215043137972122589191937090220605129006157182799441165780246353306332306332 12185513191101866131201649725Rail Tonnage To/From Ports1. Port of Hous<strong>to</strong>n - 3,563,9342. Port of Freeport - 1,5693. Port of Corpus Christi - 18,4514. Port of Brownsville - 1,9565. Port of Beaumont - 62,318Figure 3-36: 2025 Rail <strong>Freight</strong> MovementsRail <strong>Freight</strong> Movements Outside of <strong>the</strong> StateRail freight is most effective when carrying long haul cargo. The costeffectiveness of utilizing rail <strong>to</strong> transport cargo over long distances has led <strong>to</strong> <strong>the</strong>continued growth of <strong>to</strong>nnage movement between <strong>the</strong> <strong>San</strong> <strong>An<strong>to</strong>nio</strong> District andlocations outside of <strong>the</strong> state. Figure 3-37 illustrates that major rail freightmovements are currently occurring from Louisiana, Oklahoma, and moremoderately <strong>to</strong> Mexico, New Mexico, and <strong>the</strong> <strong>Texas</strong> Gulf Ports. Figure 3-38demonstrates that by <strong>the</strong> year 2025 major movements <strong>to</strong> New Mexico, Mexicoand Oklahoma are predicted <strong>to</strong> occur. These new growth opportunities mayrequire strategic planning and infrastructure improvements in order <strong>to</strong> capitalizeon <strong>the</strong>se emerging markets.3-42
<strong>San</strong> <strong>An<strong>to</strong>nio</strong> <strong>Region</strong> <strong>Freight</strong> <strong>Study</strong><strong>Freight</strong> Operational <strong>Study</strong>The overall rail <strong>to</strong>nnage movement from and <strong>to</strong> <strong>the</strong> <strong>San</strong> <strong>An<strong>to</strong>nio</strong> region wassummarized by dividing <strong>the</strong> area within <strong>the</strong> state in<strong>to</strong> specific areas of differentdistances from <strong>San</strong> <strong>An<strong>to</strong>nio</strong> as well as separate regions of <strong>Texas</strong>. The areainside of <strong>Texas</strong> was broken in<strong>to</strong> radii’s of 50, 100, 300, and over 300 miles from<strong>the</strong> <strong>San</strong> <strong>An<strong>to</strong>nio</strong> region. The regions outside of <strong>the</strong> state were identified asWestern US, Nor<strong>the</strong>rn US, Eastern US, and Mexico. The model determined rail<strong>to</strong>nnage distribution for each area. Figure 3-39 shows <strong>the</strong> distribution of rail<strong>to</strong>nnage for each region.Figure 3-39: 2025 Rail Tonnage Distribution for <strong>San</strong> <strong>An<strong>to</strong>nio</strong> <strong>Region</strong>The analysis showed that three percent of rail <strong>to</strong>nnage is projected <strong>to</strong> stay within<strong>the</strong> <strong>San</strong> <strong>An<strong>to</strong>nio</strong> region while 58 percent is projected <strong>to</strong> travel between 100 and300 miles from <strong>the</strong> area. Based on projections, approximately 63 percent of railfreight traffic travels within 300 miles of <strong>the</strong> <strong>San</strong> <strong>An<strong>to</strong>nio</strong> region. A projected twopercent of <strong>the</strong> rail freight is distributed <strong>to</strong> an area within <strong>Texas</strong> outside of <strong>the</strong> 300mile radius. The remaining percentages are split between Mexico (five percent),Western US (nine percent), Nor<strong>the</strong>rn US (nine percent), and Eastern US (12percent).3-44
<strong>San</strong> <strong>An<strong>to</strong>nio</strong> <strong>Region</strong> <strong>Freight</strong> <strong>Study</strong><strong>Freight</strong> Operational <strong>Study</strong><strong>Freight</strong> Rail Commodity TrendsUnlike truck freight growth trends, rail freight growth depends largely on <strong>the</strong> typeof commodity being shipped. Table 3-10 shows a comparison between 2004 and2025 rail commodities. The raw materials growth of over 20 million <strong>to</strong>ns clearlydominates all o<strong>the</strong>r commodity <strong>to</strong>nnage increases. The commodity with <strong>the</strong>largest percent increase was building materials. Secondary products areprojected <strong>to</strong> result in <strong>the</strong> second highest increase by <strong>to</strong>nnage. Secondary railcommodities include hazardous materials and products that are transferred atintermodal facilities which include containerized or packaged products. Based on<strong>the</strong> STB data, <strong>the</strong> amount of hazardous material transported by rail in 2004 wasapproximately 1.4 million <strong>to</strong>ns, while <strong>the</strong> projected 2025 <strong>to</strong>nnage was 3.2 million<strong>to</strong>ns. Chemical/petroleum was projected <strong>to</strong> result in <strong>the</strong> lowest percentage ofgrowth.CommodityRail Tonnage2004 2025 Percent IncreaseRaw Materials 14,416,557 34,975,874 143%Secondary 10,343,305 22,506,473 118%BuildingMaterials2,835,741 8,249,419 191%Chemical/Petroleum2,947,232 5,096,650 73%Wood 1,512,326 3,660,682 142%Machinery 1,288,863 3,059,718 137%Food 1,331,043 2,816,055 112%Agriculture 1,363,421 2,720,273 100%Textiles 901,888 2,166,649 140%Total 36,940,376 85,251,791 131%Table 3-10: Rail <strong>Freight</strong> Commodity GrowthFigures 3-40, 3-41 and 3-42 display <strong>the</strong> commodities being moved by rail within<strong>the</strong> <strong>San</strong> <strong>An<strong>to</strong>nio</strong> region for 2004 and 2025. Figure 3-43 provides a correlation ofsimilar information on a national level for <strong>the</strong> year 2000.3-45
<strong>San</strong> <strong>An<strong>to</strong>nio</strong> <strong>Region</strong> <strong>Freight</strong> <strong>Study</strong><strong>Freight</strong> Operational <strong>Study</strong>40,000,00035,000,00034,975,8742004202530,000,00025,000,00022,506,47320,000,00015,000,00010,000,0005,000,00014,416,55710,343,3052,835,7418,249,4192,947,2325,096,6501,512,3263,660,6821,288,8633,059,7181,331,0432,816,0551,363,4212,720,273901,8882,166,6490RawMaterialsSecondaryBuildingMaterialsChemical/PetroleumWood Machinery Food Agriculture TextilesFigure 3-40: <strong>Freight</strong> <strong>to</strong>nnage by commodity – <strong>San</strong> <strong>An<strong>to</strong>nio</strong> AreaMachinery3.5%Wood4.1%Food3.6%Agriculture3.7% Textiles2.4%Chemical/Petroleum8.0%Raw Materials39.0%Building Materials7.7%Secondary28.0%Figure 3-41: Percentage of freight rail by commodity (2004)3-46
<strong>San</strong> <strong>An<strong>to</strong>nio</strong> <strong>Region</strong> <strong>Freight</strong> <strong>Study</strong><strong>Freight</strong> Operational <strong>Study</strong>Machinery3.6%Food3.3%Agriculture3.2%Textiles2.5%Wood4.3%Chemical/Petroleum6.0%Raw Materials41.0%Building Materials9.7%Secondary26.4%Figure 3-42: Percentage of freight rail by commodity (2025)Clay, Concrete, Glass orS<strong>to</strong>ne, 3%Lumber or Wood Products,3%All O<strong>the</strong>r, 11%Metallic Ores, 3%Primary Metal Products, 4%Food or Kindred Products,5%Misc. Mixed Shipments, 6%Non-metallic minerals, 8%Coal, 41%Farm Products, 8%Source: Reebie Associates’TRANSEARCH and U.S. DOT<strong>Freight</strong> Analysis Framework ProjectChemicals or Allied Products,8%Figure 3-43: <strong>Freight</strong> <strong>to</strong>nnage by commodity – National (2000)3-47
<strong>San</strong> <strong>An<strong>to</strong>nio</strong> <strong>Region</strong> <strong>Freight</strong> <strong>Study</strong><strong>Freight</strong> Operational <strong>Study</strong>The challenge <strong>to</strong> accommodate <strong>the</strong> forecasted growth in freight rail will includeplanning for new or expanded rail facilities that can capitalize on <strong>the</strong> growthmarkets. If planned properly, <strong>the</strong> facilities may provide <strong>the</strong> ability <strong>to</strong> shift <strong>the</strong>truck cargo burden <strong>to</strong> rail cars. The percentage of growth is one way <strong>to</strong> analyzedata; however, examining <strong>the</strong> percentage that each commodity has on <strong>the</strong>market is equally important.Analyzing <strong>the</strong> trends in commodity movements can aid in fur<strong>the</strong>r understanding<strong>the</strong> trip generation and distribution of rail freight movements. In general, railwaysare best suited <strong>to</strong> hauling large, heavy, low-value loads that are not overly timesensitiveover distances greater than 300 <strong>to</strong> 400 miles. The largest productsbeing moved by rail in <strong>the</strong> region (in terms of <strong>to</strong>nnage) are raw materials,secondary materials, and building materials.While growth occurs for all <strong>the</strong> commodity types analyzed, <strong>the</strong> transportation ofraw material and secondary products are predominate for <strong>the</strong> region.Rail <strong>Freight</strong> Findings Summary‣ <strong>Freight</strong> <strong>to</strong>nnage moved by rail is forecasted <strong>to</strong> more than double by 2025;‣ Raw materials constitute a majority of <strong>the</strong> freight rail <strong>to</strong>nnage beingshipped within <strong>Texas</strong>, in 2004 and as forecasted in 2025; and,‣ Proportionally, more rail shipments are forecasted <strong>to</strong> originate from within<strong>the</strong> region in <strong>the</strong> future.Rail and Truck <strong>Freight</strong> ComparisonTable 3-11 provides a comparison of truck and rail <strong>to</strong>nnages within <strong>the</strong> region.The increase between 1998 and 2025 for truck <strong>to</strong>ns represents a 127 percentincrease compared <strong>to</strong> a rail <strong>to</strong>nnage increase of 131 percent between 2004 and2025. The predicted increases of rail and truck <strong>to</strong>nnages are substantial andmay need <strong>to</strong> be addressed through additional infrastructure improvements and/orenhancements. Figure 3-44 charts <strong>the</strong> overall <strong>to</strong>nnage and growth.Year Truck Rail1998 (Truck), 2004(Rail) 81,508,046 36,940,3762025 184,980,677 85,251,791Percent Increase 127% 131%Table 3-11: Rail and Truck Tons Comparison3-48
<strong>San</strong> <strong>An<strong>to</strong>nio</strong> <strong>Region</strong> <strong>Freight</strong> <strong>Study</strong><strong>Freight</strong> Operational <strong>Study</strong>200,000,000180,000,000160,000,000184,980,6771998 (Truck), 2004 (Rail)2025140,000,000120,000,000100,000,00080,000,00081,508,04685,251,79160,000,00040,000,00036,940,37620,000,0000Truck RailFigure 3-44: Total Rail / Truck TonsCombined Truck and Rail TonsOrigin Termination 1998/2004 2025PercentChangeInternal <strong>to</strong> Internal<strong>San</strong> <strong>An<strong>to</strong>nio</strong> District <strong>San</strong> <strong>An<strong>to</strong>nio</strong> District 2,954,621 6,166,520 109%Internal <strong>to</strong> External<strong>San</strong> <strong>An<strong>to</strong>nio</strong> District O<strong>the</strong>r <strong>Texas</strong> Counties 42,033,410 100,465,633 139%<strong>San</strong> <strong>An<strong>to</strong>nio</strong> District Western US 586,972 1,558,712 166%<strong>San</strong> <strong>An<strong>to</strong>nio</strong> District Nor<strong>the</strong>rn US 2,738,208 7,551,352 176%<strong>San</strong> <strong>An<strong>to</strong>nio</strong> District Eastern US 2,360,202 6,472,885 174%<strong>San</strong> <strong>An<strong>to</strong>nio</strong> District Mexico 3,959,295 10,986,854 177%External <strong>to</strong> InternalO<strong>the</strong>r <strong>Texas</strong> Counties <strong>San</strong> <strong>An<strong>to</strong>nio</strong> District 42,247,917 85,014,286 101%Western US <strong>San</strong> <strong>An<strong>to</strong>nio</strong> District 3,724,837 8,677,048 133%Nor<strong>the</strong>rn US <strong>San</strong> <strong>An<strong>to</strong>nio</strong> District 5,794,346 14,016,313 142%Eastern US <strong>San</strong> <strong>An<strong>to</strong>nio</strong> District 6,484,089 15,484,858 139%Mexico <strong>San</strong> <strong>An<strong>to</strong>nio</strong> District 5,564,524 13,838,007 149%Total 118,448,422 270,232,468 128%*Source: Statewide Analysis Model based on 1998 Reebie Transearch Data, Whar<strong>to</strong>n EconomicForecasting Associates, Latin American Trade Transportation <strong>Study</strong> and 2004 SurfaceTransportation Board Waybill DataTable 3-12: Combined Rail and Truck Tons3-49
<strong>San</strong> <strong>An<strong>to</strong>nio</strong> <strong>Region</strong> <strong>Freight</strong> <strong>Study</strong><strong>Freight</strong> Operational <strong>Study</strong>While <strong>the</strong> <strong>to</strong>tal combined <strong>to</strong>ns shipped by both truck and rail are projected <strong>to</strong>increase by 128 percent by 2025, <strong>the</strong>re could be a bigger increase of freightshipped out of <strong>the</strong> <strong>San</strong> <strong>An<strong>to</strong>nio</strong> District (146 percent increase) than freightshipped in<strong>to</strong> <strong>the</strong> District (115 percent increase) and shipments internal <strong>to</strong> <strong>the</strong>District (109 percent increase). Table 3-12 illustrates that <strong>the</strong> largest projectedincrease of freight <strong>to</strong>ns is represented by shipments from <strong>the</strong> <strong>San</strong> <strong>An<strong>to</strong>nio</strong> District<strong>to</strong> o<strong>the</strong>r <strong>Texas</strong> counties (139 percent). It becomes clear that most of <strong>the</strong> freightshipping requirements within <strong>the</strong> <strong>San</strong> <strong>An<strong>to</strong>nio</strong> District are supported by trucks.This is basically due <strong>to</strong> <strong>the</strong> various industries, industrial centers and intermodalfacilities within <strong>the</strong> District, specifically in <strong>the</strong> city of <strong>San</strong> <strong>An<strong>to</strong>nio</strong>. The projectedinternal <strong>to</strong>ns shipped by truck within <strong>the</strong> District for 2025 is 5,393,211 <strong>to</strong>ns (Table3-3) while <strong>the</strong> projected internal rail shipments will be 773,309 <strong>to</strong>ns (Table 3-9).This shows that trucks will be shipping approximately seven times more <strong>to</strong>nnagewithin <strong>the</strong> <strong>San</strong> <strong>An<strong>to</strong>nio</strong> District than trains. For <strong>the</strong> projected freight shipmentsout of <strong>the</strong> <strong>San</strong> <strong>An<strong>to</strong>nio</strong> District by 2025, trucks will be hauling 46 percent more<strong>to</strong>ns than rail; however, for shipments in<strong>to</strong> <strong>the</strong> District, truck shipments will beapproximately three times more than rail.<strong>San</strong> <strong>An<strong>to</strong>nio</strong> <strong>Region</strong> SummaryWith congestion levels in <strong>San</strong> <strong>An<strong>to</strong>nio</strong> on <strong>the</strong> rise and <strong>the</strong> expected growth ofcommodity movements throughout <strong>the</strong> state, a comprehensive plan <strong>to</strong>accommodate such growth is needed. To our benefit a regional vision is alreadytaking place. TTC-35 could provide some much needed relief for <strong>the</strong> region.Through <strong>the</strong> creation of truck only lanes and a higher speed freight rail corridor,not only would existing freight movement corridors experience a reduction incongestion, but economic benefits may result from increased freight movementefficiencies.A diverse approach is needed <strong>to</strong> address infrastructure needs ra<strong>the</strong>r than onesingle improvement, such as TTC-35. The regional vision of planned roadwayimprovements has been developed through <strong>the</strong> 2030 Metropolitan ThoroughfarePlan by <strong>the</strong> <strong>San</strong> <strong>An<strong>to</strong>nio</strong>-Bexar County MPO. Additional improvements that wereanalyzed included <strong>the</strong> regional benefit of roadway-railroad gradeseparations/closures and <strong>the</strong> shift of commodities from truck transport <strong>to</strong> rail.The shift of truck cargo <strong>to</strong> rail cars could be expedited with additional rail routesthat follow a preferred alignment, as determined through a public involvementprocess, which includes <strong>the</strong> major freight carriers.The potential roadway capacity improvements, as identified in <strong>the</strong> 2030 MTP,and <strong>the</strong> resulting benefit both regionally and locally were determined. Each of<strong>the</strong> roadway capacity improvements were compared <strong>to</strong> <strong>the</strong> no-build scenario.The improvements that were analyzed included <strong>the</strong> following scenarios:‣ No-build;‣ Planned roadway capacity improvements;3-50
<strong>San</strong> <strong>An<strong>to</strong>nio</strong> <strong>Region</strong> <strong>Freight</strong> <strong>Study</strong><strong>Freight</strong> Operational <strong>Study</strong>‣ Planned roadway capacity improvements with a 15 percent cargo shiftfrom truck <strong>to</strong> rail;‣ Grade separations/closures;‣ Grade separations/closures with 15 percent shift from truck <strong>to</strong> rail.The <strong>to</strong>tal daily delay and gas savings when all of <strong>the</strong> alternatives areincorporated is projected <strong>to</strong> be approximately 367,000 hours and 35,000 gallonsof gas per day for <strong>the</strong> <strong>San</strong> <strong>An<strong>to</strong>nio</strong> region when compared <strong>to</strong> a no-build scenario.These savings translate <strong>to</strong> approximately $7,000,000 per day. It was shown that<strong>the</strong> greatest benefits resulted from <strong>the</strong> 2030 MTP planned improvements.However, grade separations/closures and shifting 15 percent of cargo fromtrucks <strong>to</strong> rail resulted in minimal changes that showed <strong>the</strong> majority of <strong>the</strong> benefitin Bexar County.The movement of trucks in<strong>to</strong> and out of <strong>the</strong> Port Authority of <strong>San</strong> <strong>An<strong>to</strong>nio</strong>, UPintermodal facilities, airports and industrial districts should be evaluated asfocused study areas. As <strong>the</strong> majority of truck movement occurs on <strong>the</strong> statehighway system, an adequate arterial and collec<strong>to</strong>r system would be required <strong>to</strong>accommodate sufficient access <strong>to</strong> <strong>the</strong> state system. Operational and geometricimprovements <strong>to</strong> <strong>the</strong>se areas would improve truck movement for <strong>the</strong> region byproviding more efficient access <strong>to</strong> <strong>the</strong> state highway system. Infrastructureimprovements and alternatives <strong>to</strong> address <strong>the</strong> future freight movement projectedfor <strong>the</strong> region are discussed in section 7 of this report.3-51
<strong>San</strong> <strong>An<strong>to</strong>nio</strong> <strong>Region</strong> <strong>Freight</strong> <strong>Study</strong>Existing Rail NetworkSECTION 4: EXISTING RAIL NETWORKThere are five major rail lines in <strong>the</strong> <strong>San</strong> <strong>An<strong>to</strong>nio</strong> region: <strong>the</strong> Del Rio/GliddenSubdivision, <strong>the</strong> Austin Subdivision ML 1, <strong>the</strong> Austin Subdivision ML 2, <strong>the</strong> CorpusChristi Subdivision, and <strong>the</strong> Laredo Subdivision. With <strong>the</strong> exception of <strong>the</strong> AustinSubdivision ML 1 and <strong>the</strong> Laredo Subdivision, <strong>the</strong> rail lines were constructed byindependent railroad companies. The relationships and interchange experienced<strong>to</strong>day between railroad companies were virtually non-existent between competingrailroads in <strong>the</strong> early 1900’s, meaning each railroad company had independent railyards, maintenance facilities, and passenger stations.With <strong>the</strong> merger of <strong>the</strong> UP and <strong>the</strong> Missouri Pacific Railroad, and subsequently <strong>the</strong>integration of <strong>the</strong> Missouri – Kansas & <strong>Texas</strong> Railroad Company in 1986, railroadoperations between previously independent opera<strong>to</strong>rs started <strong>to</strong> take on a newperspective. UP’s acquisition of <strong>the</strong> Sou<strong>the</strong>rn Pacific Railroad in 1996 combined <strong>the</strong>last of <strong>the</strong> independent operations within <strong>the</strong> region.Figure 4-1 shows <strong>the</strong> overall layout of <strong>the</strong> <strong>San</strong> <strong>An<strong>to</strong>nio</strong> rail network.4 - 1
<strong>San</strong> <strong>An<strong>to</strong>nio</strong> <strong>Region</strong> <strong>Freight</strong> <strong>Study</strong> Existing Rail NetworkFigure 4-1: <strong>San</strong> <strong>An<strong>to</strong>nio</strong> Rail Network4 - 2
<strong>San</strong> <strong>An<strong>to</strong>nio</strong> <strong>Region</strong> <strong>Freight</strong> <strong>Study</strong>Existing Rail NetworkToday, <strong>the</strong>re are over 420 miles of mainline railroad tracks in <strong>the</strong> <strong>San</strong> <strong>An<strong>to</strong>nio</strong>region, including approximately 895 at-grade highway-rail crossings along <strong>the</strong>railroad mainlines. There are also three active rail yards in <strong>the</strong> region. Kirby Yard(located near Randolph Air Force Base) serves as a crew change point for east-westtrains. Also located at Kirby Yard is an in-line fueling facility and an au<strong>to</strong> unloadingfacility. This au<strong>to</strong> unloading facility handles <strong>the</strong> majority of domestic au<strong>to</strong>mobilesdestined for <strong>the</strong> <strong>San</strong> <strong>An<strong>to</strong>nio</strong> and Rio Grande River Valley regions of <strong>Texas</strong>. Figures4-2 and 4-3 show <strong>the</strong> track charts for Kirby Yard and <strong>the</strong> au<strong>to</strong> unloading facilityrespectively, while Pho<strong>to</strong> 4-1 shows <strong>the</strong> in-line fueling facility.Pho<strong>to</strong> 4-1: Kirby Yard in-line fueling facilityEast Yard is located east of IH-35 just north of Pine Street. New Braunfels Avenuecrosses over <strong>the</strong> <strong>to</strong>p of East Yard about mid-yard. Although now abandoned, <strong>the</strong>rewas a rail spur that went from East Yard <strong>to</strong> Fort Sam Hous<strong>to</strong>n, crossing IH-35 in <strong>the</strong>process. The rail bridge spanning IH-35 still exists <strong>to</strong>day, however its removal isplanned. East Yard is used primarily as a staging area <strong>to</strong> serve UP’s approximately350 <strong>San</strong> <strong>An<strong>to</strong>nio</strong> region cus<strong>to</strong>mer base. East Yard also serves as an intermodalfacility, with approximately 15,000 lifts annually. Figure 4-4 shows <strong>the</strong> track chartsfor East Yard, while pho<strong>to</strong>s 4-2 and 4-3 show views of <strong>the</strong> yard itself.4 - 3
<strong>San</strong> <strong>An<strong>to</strong>nio</strong> <strong>Region</strong> <strong>Freight</strong> <strong>Study</strong>Existing Rail NetworkPho<strong>to</strong> 4-2: View East, East YardPho<strong>to</strong> 4-3: View West, East Yard4 - 4
<strong>San</strong> <strong>An<strong>to</strong>nio</strong> <strong>Region</strong> <strong>Freight</strong> <strong>Study</strong> Existing Rail NetworkFigure 4-2: Kirby Yard4 - 5
<strong>San</strong> <strong>An<strong>to</strong>nio</strong> <strong>Region</strong> <strong>Freight</strong> <strong>Study</strong> Existing Rail NetworkFigure 4-3: Kirby Au<strong>to</strong> Facility4 - 6
<strong>San</strong> <strong>An<strong>to</strong>nio</strong> <strong>Region</strong> <strong>Freight</strong> <strong>Study</strong> Existing Rail NetworkFigure 4-4: East Yard4 - 7
<strong>San</strong> <strong>An<strong>to</strong>nio</strong> <strong>Region</strong> <strong>Freight</strong> <strong>Study</strong>Existing Rail NetworkThe largest of <strong>the</strong> <strong>San</strong> <strong>An<strong>to</strong>nio</strong> rail yards is located in <strong>the</strong> southwestern region of<strong>San</strong> <strong>An<strong>to</strong>nio</strong>, near <strong>the</strong> Port Authority of <strong>San</strong> <strong>An<strong>to</strong>nio</strong> (formerly known as Kelly USA,and Kelly Air Force Base). So<strong>San</strong> Yard serves as <strong>the</strong> hub for all International traffic,both coming from <strong>the</strong> Ports of Los Angeles and Long Beach as well as Mexico.Nearly 70% of <strong>the</strong> trains coming in<strong>to</strong> or leaving <strong>the</strong> <strong>San</strong> <strong>An<strong>to</strong>nio</strong> area are “worked” atSo<strong>San</strong> Yard. So<strong>San</strong> Yard also serves as <strong>the</strong> focal point for train make-up <strong>to</strong> support<strong>the</strong> Toyota plant’s train operations. As a result, UP has recently undertaken yardexpansion activities <strong>to</strong> increase capacity for Toyota as well as International traffic.Figure 4-5 shows <strong>the</strong> track chart for So<strong>San</strong> Yard, while Pho<strong>to</strong> 4-4 is a view of <strong>the</strong>east end of So<strong>San</strong> Yard.Pho<strong>to</strong> 4-4: East End of So<strong>San</strong> Yard (view looking West)4 - 8
<strong>San</strong> <strong>An<strong>to</strong>nio</strong> <strong>Region</strong> <strong>Freight</strong> <strong>Study</strong> Existing Rail NetworkFigure 4-5: So<strong>San</strong> Yard4 - 9
<strong>San</strong> <strong>An<strong>to</strong>nio</strong> <strong>Region</strong> <strong>Freight</strong> <strong>Study</strong>Existing Rail NetworkThe following text, figures, and tables depict and summarize <strong>the</strong> physicalcharacteristics of <strong>the</strong> regions rail lines.UP Austin Subdivision Mainline (ML) 1The Austin Subdivision ML 1 originates in Hearne, <strong>Texas</strong>, and passes throughTaylor, George<strong>to</strong>wn, Round Rock, and Austin before it crosses <strong>the</strong> Hayes County –Comal County line just north of <strong>San</strong> Marcos at railroad milepost (MP) 216.86. From<strong>San</strong> <strong>An<strong>to</strong>nio</strong> <strong>to</strong> Austin it generally parallels Interstate 35 and also parallels <strong>the</strong> AustinSubdivision ML 2 between <strong>San</strong> Marcos and <strong>San</strong> <strong>An<strong>to</strong>nio</strong>. The main tracks cross <strong>the</strong>Comal County – Bexar County line at railroad MP 241.79. The subdivision ends atMP 260.40 with <strong>the</strong> tracks continuing southward as <strong>the</strong> Laredo Subdivision. Thetracks were originally constructed in 1881 by <strong>the</strong> International & Great Nor<strong>the</strong>rnRailroad.Austin Subdivision ML 1 (See Table 4-1)Total Subdivision Tracks 43.54 milesTotal track in Comal County 24.93 milesTotal track in Bexar County 18.61 milesAustin No. 1 SubdivisionTrack Type Milepost Start Milepost End Length (Miles) Yard or Siding NameMain 216.86 260.40 43.54Yard 227.06 227.27 0.21 New BraunfelsYard 230.49 231.82 1.33 Western RR Co.Yard 233.44 235.13 1.69 CorbynYard 235.89 236.98 1.09 OgdenYard 259.00 260.40 1.40 Apache Jct.Double 216.86 250.00 33.14Siding 220.91 223.14 2.23 GoodwinSiding 227.90 228.61 0.71 Landas ParkSiding 239.32 241.11 1.79 BrackenSiding 250.55 252.12 1.57 North LoopSiding 253.38 254.26 0.88 AdamsTable 4-1: Austin ML 1 Track Type Summary TableA universal crossover connects both <strong>the</strong> Austin ML 1 and Austin ML 2 at MP 219.0and MP 220.7 respectively. The Austin ML 1 crosses <strong>the</strong> Austin ML 2 at MP 227.5in <strong>the</strong> middle of New Braunfels, <strong>Texas</strong>. The main tracks serve several rock quarriesin <strong>the</strong> <strong>San</strong> Marcos/New Braunfels area. At MP 236.0 and MP 237.5, a pair ofcrossovers again connects ML 1 and <strong>the</strong> ML 2 Subdivisions.Single main tracks pass through New Braunfels, Garden Ridge, Schertz, Selma,Bracken, and <strong>San</strong> <strong>An<strong>to</strong>nio</strong>, <strong>Texas</strong>. At MP 251, <strong>the</strong> main tracks are directlysou<strong>the</strong>ast and adjacent <strong>to</strong> <strong>the</strong> <strong>San</strong> <strong>An<strong>to</strong>nio</strong> International Airport. The main tracksused <strong>to</strong> cross <strong>the</strong> Kerrville Subdivision at Apache Junction, railroad MP 259.87.There now exists a current main-<strong>to</strong>-main connection north of Apache Junction. The4 - 11
<strong>San</strong> <strong>An<strong>to</strong>nio</strong> <strong>Region</strong> <strong>Freight</strong> <strong>Study</strong>Existing Rail NetworkUP has completed <strong>the</strong> Comal Street Bypass, a connection off of <strong>the</strong> Kerrville <strong>to</strong> <strong>the</strong>Austin Subdivision ML1 at <strong>the</strong> north end of <strong>San</strong> Fernando Yard. This capitalimprovement re-routed train traffic that used <strong>to</strong> travel down Comal Street and cross<strong>the</strong> mainline at-grade. Formerly, <strong>the</strong> connection was achieved via forward andreverse moves through <strong>the</strong> area, with switching on<strong>to</strong> one track or <strong>the</strong> o<strong>the</strong>r viaoperations through <strong>San</strong> Fernando Yard (Figure 4-6, Pho<strong>to</strong> 4-5, and Pho<strong>to</strong> 4-6).Completion of this connection allows for rock trains coming off <strong>the</strong> KerrvilleSubdivision <strong>to</strong> occupy <strong>the</strong> main without having <strong>to</strong> first cross <strong>the</strong> Austin ML 1 track,make a reverse move in<strong>to</strong> <strong>San</strong> Fernando Yard, <strong>the</strong>n switch on<strong>to</strong> <strong>the</strong> main. Theformer operation restricted <strong>the</strong> number of rock cars in <strong>the</strong> train consist <strong>to</strong> 50 or fewercars while blocking at-grade crossings near <strong>the</strong> Bexar County Jail throughout <strong>the</strong>train movement process.The installation of this direct connection takes <strong>the</strong> rock train traffic off <strong>the</strong> rail line thatruns down <strong>the</strong> middle of Comal Street, reduces at-grade crossing delays <strong>to</strong> vehiculartraffic in <strong>the</strong> area, reduces <strong>the</strong> need for additional switching in<strong>to</strong> and out of <strong>San</strong>Fernando Yard, and allows <strong>the</strong> railroad <strong>to</strong> increase <strong>the</strong>ir operating efficiency byincreasing <strong>the</strong> number of rock cars that can be moved at one time.Major bridge crossings on <strong>the</strong> Austin Subdivision ML 1 include a 496 foot longstructure over <strong>the</strong> Guadalupe River, a 357 foot long structure over Cibolo Creek(Bexar County Line), a 272 foot long structure over Salado Creek, a 253 foot longstructure over Olmos Creek, a 241 foot long structure over <strong>San</strong> Pedro Creek, and a244 foot long structure over Apache Creek. A complete listing of Austin SubdivisionML 1 structures can be found in Appendix B. Figure 4-7 depicts <strong>the</strong> layout andgrade crossing protection locations for <strong>the</strong> Austin Subdivision ML 1 and ML 2.4 - 12
<strong>San</strong> <strong>An<strong>to</strong>nio</strong> <strong>Region</strong> <strong>Freight</strong> <strong>Study</strong>Existing Rail NetworkPho<strong>to</strong> 4-5: View south at north end <strong>San</strong> Fernando yard limitPho<strong>to</strong> 4-6: View South, <strong>San</strong> Fernando Yard4 - 13
<strong>San</strong> <strong>An<strong>to</strong>nio</strong> <strong>Region</strong> <strong>Freight</strong> <strong>Study</strong> Existing Rail NetworkFigure 4-6: <strong>San</strong> Fernando Yard area4 - 14
<strong>San</strong> <strong>An<strong>to</strong>nio</strong> <strong>Region</strong> <strong>Freight</strong> <strong>Study</strong> Existing Rail NetworkFigure 4-7: Austin Subdivision ML 1 and ML 24 - 15
<strong>San</strong> <strong>An<strong>to</strong>nio</strong> <strong>Region</strong> <strong>Freight</strong> <strong>Study</strong>Existing Rail NetworkUP Austin Subdivision ML 2The Austin Subdivision ML 2 begins in <strong>San</strong> Marcos at <strong>the</strong> termination of <strong>the</strong> LockhartSubdivision. It crosses <strong>the</strong> Hays County – Comal County line at railroad MP 216.55and generally parallels Austin Subdivision ML 1 and IH 35 between <strong>San</strong> <strong>An<strong>to</strong>nio</strong> andAustin. The main tracks cross <strong>the</strong> Comal County – Bexar County line at railroad MP240.12. The subdivision ends where it joins <strong>the</strong> Del Rio Subdivision at a locationknown as Tower 112, or railroad MP 260.40. The tracks were originally constructedby <strong>the</strong> Missouri, Kansas & <strong>Texas</strong> Railway Company of <strong>Texas</strong> in 1900.Austin Subdivision ML 2 (See Table 4-2)Total Subdivision Tracks 43.85 milesTotal track in Comal County 23.57 milesTotal track in Bexar County 20.28 milesAustin No. 2 SubdivisionTrack Type Milepost Start Milepost End Length (Miles) Yard or Siding NameMain 216.55 260.40 43.85Yard 217.35 217.62 0.27 HunterYard 251.06 251.71 0.65 Remount Au<strong>to</strong> FacilityYard 253.53 254.24 0.71 TravisYard 255.74 256.15 0.41Double 216.55 250.00 33.45Siding 218.81 220.83 2.02 JudeSiding 226.56 226.74 0.18 New BraunfelsSiding 248.22 248.98 0.76 FrattSiding 250.32 250.85 0.53 RemountSiding 259.47 259.97 0.50 TowerTable 4-2: Austin ML 2 Track Type Summary TableA universal crossover connects both <strong>the</strong> Austin ML 2 and Austin ML 1 at railroadMPs 219.03 and 220.62. The Austin ML 2 crosses Austin ML 1 at MP 226.89 inNew Braunfels, <strong>Texas</strong>. The main tracks serve rock quarries between <strong>San</strong> Marcosand New Braunfels. At MPs 235.90 and 237.08, a pair of crossovers again connectsML 2 and ML 1. Single main tracks pass through New Braunfels, Garden Ridge,Schertz, Selma, Bracken, and <strong>San</strong> <strong>An<strong>to</strong>nio</strong>, <strong>Texas</strong>.Major bridge crossings include a 241 foot structure over York Creek, a 600 footstructure over <strong>the</strong> Guadalupe River, a 205 foot structure over <strong>the</strong> Comal River, a 265foot structure over Cibolo Creek, and a 242 foot structure over Salado Creek. Acomplete listing of Austin Subdivision ML 2 structures can be found in Appendix B.Figure 4-7 depicts <strong>the</strong> layout and grade crossing protection locations for <strong>the</strong> AustinSubdivision ML 1 and ML 2.4 - 16
<strong>San</strong> <strong>An<strong>to</strong>nio</strong> <strong>Region</strong> <strong>Freight</strong> <strong>Study</strong>Existing Rail NetworkUP Kerrville SubdivisionThe Kerrville Subdivision begins at Tower 112. MP 0.00 of <strong>the</strong> Kerrville Subdivisioncorresponds <strong>to</strong> approximately MP 211.10 of <strong>the</strong> Del Rio Subdivision. The KerrvilleSubdivision ends at railroad MP 15.00, which corresponds <strong>to</strong> <strong>the</strong> beginning of <strong>the</strong>Camp Stanley Industrial Lead. It is located entirely in Bexar County. The trackswere originally constructed by <strong>the</strong> <strong>San</strong> <strong>An<strong>to</strong>nio</strong> and Aransas Railway Company in1890.Kerrville Subdivision (See Table 4-3)Total Subdivision Tracks 15.00 milesTotal track in Bexar County 15.00 milesKerrville SubdivisionTrack Type Milepost Start Milepost End Length (Miles) Yard or Siding NameMain 0.00 15.00 15.00Yard 0.00 1.60 1.60 Yoakum BendYard 12.89 13.33 0.44Table 4-3: Kerrville Subdivision Track Type Summary TableThe single main track becomes <strong>the</strong> Kerrville Subdivision as it passes through Tower112 and ends at Loop 1604 (MP 15.00), where it continues as <strong>the</strong> Camp StanleyIndustrial Lead Subdivision. As shown in Pho<strong>to</strong> 4-7, <strong>the</strong> single main tracks hadcrossed <strong>the</strong> Austin Subdivision at Apache Junction, Kerrville Subdivision MP 1.61.This crossing had been removed in August, 2006, during which time UP officiallybegan re-routing traffic across a newly constructed connection between <strong>the</strong> KerrvilleSubdivision and <strong>the</strong> Austin Subdivision ML 1 track located just north of MoralesStreet. This connection removes tracks that previously traversed down <strong>the</strong> middle ofComal Street near <strong>the</strong> Bexar County jail.Previously, <strong>the</strong> connection was achieved via forward and reverse moves through <strong>the</strong>area, with switching on<strong>to</strong> one track or <strong>the</strong> o<strong>the</strong>r via operations through <strong>San</strong>Fernando Yard.The single main track passes through <strong>San</strong> <strong>An<strong>to</strong>nio</strong>, <strong>Texas</strong>. Major bridge crossingsinclude a 104 foot structure over <strong>San</strong> Pedro Creek and a 116 foot structure overOlmos Creek. A complete listing of <strong>the</strong> Kerrville Subdivision structures can be foundin Appendix B. Figure 4-8 depicts <strong>the</strong> layout and grade crossing protection locationsfor <strong>the</strong> Kerrville Subdivision.4 - 17
<strong>San</strong> <strong>An<strong>to</strong>nio</strong> <strong>Region</strong> <strong>Freight</strong> <strong>Study</strong>Existing Rail NetworkPho<strong>to</strong> 4-7: Apache Junction4 - 18
<strong>San</strong> <strong>An<strong>to</strong>nio</strong> <strong>Region</strong> <strong>Freight</strong> <strong>Study</strong> Existing Rail NetworkFigure 4-8: Kerrville Subdivision4 - 19
<strong>San</strong> <strong>An<strong>to</strong>nio</strong> <strong>Region</strong> <strong>Freight</strong> <strong>Study</strong>Existing Rail NetworkUP Camp Stanley Industrial LeadThe Camp Stanley Industrial Lead Subdivision is located in Bexar County andbegins at railroad MP 15.00 (Loop 1604), ending at railroad MP 22.54; howeverbetween MP 20.05 and 22.54 <strong>the</strong> tracks are washed out, so <strong>the</strong> effective “end oftrack” is located at railroad MP 19.05. The tracks were originally constructed in 1890by <strong>the</strong> <strong>San</strong> <strong>An<strong>to</strong>nio</strong> and Aransas Pass Railway Company, and currently <strong>the</strong> AlamoGulf Coast Railroad has a lease agreement with UP for this track.Camp Stanley Industrial Lead (See Table 4-4)Total Subdivision Tracks 7.54 milesTotal track in Bexar County 7.54 milesCamp Stanley Industrial LeadTrack Type Milepost Start Milepost End Length (Miles) Yard or Siding NameMain 15.00 19.05 4.15Yard 17.15 17.90 0.75Table 3-4: Camp Stanley Industrial Lead Track Type Summary TableLoop 1604 (at railroad MP 15.00) is <strong>the</strong> dividing line between <strong>the</strong> Camp StanleyIndustrial Lead and <strong>the</strong> Kerrville Subdivision. The single main track of <strong>the</strong> CampStanley Industrial Lead runs north of Loop 1604 and generally parallels US 87. Thetrack passes through Mission North Burial Park and terminates just southwest of <strong>the</strong>Camp Stanley Military Reservation.There is one major bridge crossing which is a 180 foot structure spanning LeonaCreek. A complete listing of <strong>the</strong> Camp Stanley Industrial Lead structures can befound in Appendix B.Figure 4-9 depicts <strong>the</strong> layout and grade crossing protection locations for <strong>the</strong> CampStanley Industrial Lead.The Alamo Gulf Coast and <strong>the</strong> UP submitted abandonment proceedings with <strong>the</strong>Surface Transportation Board in January, 2007, which would effectively abandon <strong>the</strong>track from Beckman, approximately MP 15.00, <strong>to</strong> <strong>the</strong> end of <strong>the</strong> track at MP 19.05.4 - 20
<strong>San</strong> <strong>An<strong>to</strong>nio</strong> <strong>Region</strong> <strong>Freight</strong> <strong>Study</strong> Existing Rail NetworkFigure 4-9: Camp Stanley Industrial Lead4 - 21
<strong>San</strong> <strong>An<strong>to</strong>nio</strong> <strong>Region</strong> <strong>Freight</strong> <strong>Study</strong>Existing Rail NetworkUP Corpus Christi SubdivisionThe beginning of <strong>the</strong> Corpus Christi Subdivision is in South <strong>San</strong> <strong>An<strong>to</strong>nio</strong> (So<strong>San</strong>)Yard at railroad MP 3.10. It crosses <strong>the</strong> Bexar County – Atascosa County line atrailroad MP 21.55 and <strong>the</strong> Atascosa County – Live Oak County line at railroad MP62.03, eventually terminating in Corpus Christi. The tracks were originallyconstructed by <strong>the</strong> <strong>San</strong> <strong>An<strong>to</strong>nio</strong>, Uvalde & Gulf Railroad in 1914.Corpus Christi Subdivision (See Table 4-5)Total Subdivision Tracks 58.89 milesTotal track in Bexar County 18.41 milesTotal track in Atascosa County 40.48 milesCorpus Christi SubdivisionTrack Type Milepost Start Milepost End Length (Miles) Yard or Siding NameMain 3.10 62.03 58.93Yard 3.10 4.70 1.60 SosanYard 52.87 53.61 0.74 <strong>San</strong> MiguelSiding 19.95 20.66 0.71 LehrSiding 31.76 33.54 1.78 Pleasan<strong>to</strong>nSiding 33.75 34.02 0.27Siding 55.16 56.83 1.67 Campbell<strong>to</strong>nTable 4-5: Corpus Christi Subdivision Track Type Summary TableThe single main track starts just east of <strong>the</strong> former Kelly Air Force Base in So<strong>San</strong>Yard. It is generally parallel <strong>to</strong> US 281 and IH 37. The single main track passesthrough <strong>San</strong> <strong>An<strong>to</strong>nio</strong> and Pleasan<strong>to</strong>n, <strong>Texas</strong>.Major bridge crossings include a 392 foot structure over <strong>the</strong> Medina River, a 104 footstructure over Palo Blanco Creek, a 108 foot structure over Glavan Creek, a 476 footstructure over <strong>the</strong> Atascosa River, a 165 foot structure over Live Oak Creek, a 706foot structure over <strong>the</strong> Atascosa River, and a 140 foot structure over Lipan Creek. Acomplete listing of <strong>the</strong> Corpus Christi Subdivision structures can be found inAppendix B.Figure 4-10 depicts <strong>the</strong> layout and grade crossing protection locations for <strong>the</strong> CorpusChristi Subdivision.4 - 22
<strong>San</strong> <strong>An<strong>to</strong>nio</strong> <strong>Region</strong> <strong>Freight</strong> <strong>Study</strong> Existing Rail NetworkFigure 4-10: Corpus Christi Subdivision4 - 23
<strong>San</strong> <strong>An<strong>to</strong>nio</strong> <strong>Region</strong> <strong>Freight</strong> <strong>Study</strong>Existing Rail NetworkUP Del Rio SubdivisionThe Del Rio Subdivision is one leg of UP’s Trans-Continental route which runs fromLos Angeles, California <strong>to</strong> Hous<strong>to</strong>n, <strong>Texas</strong>. The beginning of <strong>the</strong> Del RioSubdivision is in Bexar County at <strong>the</strong> east end of Kirby Yard, railroad MP 201.40,which also corresponds <strong>to</strong> <strong>the</strong> terminus of <strong>the</strong> Glidden Subdivision. It crosses <strong>the</strong>Bexar County – Medina County line at railroad MP 233.34, <strong>the</strong> Medina County –Uvalde County line at MP 276.03, and <strong>the</strong> Uvalde County – Kinney County line atMP 321.17, eventually terminating as <strong>the</strong> Del Rio Subdivision in Del Rio, <strong>Texas</strong>;where it becomes <strong>the</strong> <strong>San</strong>derson Subdivision. The tracks were originally constructedby <strong>the</strong> Galves<strong>to</strong>n, Harrisburg & <strong>San</strong> <strong>An<strong>to</strong>nio</strong> Railway.Del Rio Subdivision (See Table 4-6)Total Subdivision Tracks 119.77 milesTotal track in Bexar County 31.94 milesTotal track in Medina County 42.69 milesTotal track in Uvalde County 45.14 milesDel Rio SubdivisionTrack Type Milepost Start Milepost End Length (Miles) Yard or Siding NameMain 201.40 321.17 119.77Yard 201.40 203.40 2.00 Un-named (Kirby)Yard 204.47 HTTO SaladoYard 206.40 207.90 1.50 East YardYard 212.54 220.82 8.28 <strong>San</strong> <strong>An<strong>to</strong>nio</strong>Double 206.26 218.84 12.58 No. 2Siding 223.60 225.32 1.72 MacdonaSiding 234.19 235.88 1.69 LacosteSiding 247.39 249.10 1.71 DunlaySiding 259.56 261.36 1.80 HondoSiding 269.87 271.58 1.71 SecoSiding 277.69 279.42 1.73 SabinalSiding 288.92 290.64 1.72 KnippaSiding 300.71 300.96 0.25Siding 301.42 303.12 1.70 UvaldeSiding 303.19 303.36 0.17Siding 314.10 315.99 1.89 ObiSiding 319.42 319.82 0.40 ClineTable 4-6: Del Rio Subdivision Track Type Summary TableThe single main track begins at <strong>the</strong> east end of Kirby Yard where <strong>the</strong> GliddenSubdivision ends. A second main track begins at railroad MP 206.64 and ends atrailroad MP 218.84. A universal crossover connects track No. 1 <strong>to</strong> track No. 2 atMPs 207.93, 208.07, 211.02, and 211.19. There is a connection track atapproximately MP 211.14 that connects <strong>the</strong> Camp Stanley Lead Subdivision <strong>to</strong> <strong>the</strong>Del Rio Subdivision. At MP 211.02, <strong>the</strong>re is a connection track that connects <strong>the</strong> DelRio Subdivision <strong>to</strong> <strong>the</strong> Austin Subdivision ML 2 track. The Austin Subdivision ML 14 - 24
<strong>San</strong> <strong>An<strong>to</strong>nio</strong> <strong>Region</strong> <strong>Freight</strong> <strong>Study</strong>Existing Rail Networktrack crosses <strong>the</strong> Del Rio Subdivision at MP 212.67. At MP 218.74, <strong>the</strong>re is aconnection track that connects <strong>the</strong> ML 2 track <strong>to</strong> <strong>the</strong> Laredo Subdivision just prior <strong>to</strong><strong>the</strong> end of <strong>the</strong> 2 nd mainline at MP 218.84. At MP 220.14, <strong>the</strong> single main trackconnects <strong>to</strong> <strong>the</strong> Laredo Subdivision.The Del Rio Subdivision passes through Converse, Kirby, <strong>San</strong> <strong>An<strong>to</strong>nio</strong>, Lacoste,Hondo, Sabinal, and Uvalde, <strong>Texas</strong>. As it leaves <strong>San</strong> <strong>An<strong>to</strong>nio</strong>, <strong>the</strong> Del RioSubdivision runs between <strong>the</strong> former Kelly Air Force Base and Lackland Air ForceBase.Major bridge crossings include:• 278 foot structure over Alazon Creek,• 254 foot structure over Leon Creek,• 630 foot structure over <strong>the</strong> Medina River,• 285 foot structure over Pole Cat Creek,• 189 foot structure over Chicon Creek,• 140 foot structure over Francisco Creek,• 424 foot structure over <strong>the</strong> Hondo River,• 136 foot structure over Parker Creek,• 507 foot structure over <strong>the</strong> Seco River,• 180 foot structure over Live Oak Creek• 269 foot structure over <strong>the</strong> Blanco River,• 150 foot structure over Dinner Creek,• 730 foot structure over <strong>the</strong> East Frio River,• 598 foot structure over <strong>the</strong> West Frio River,• 463 foot structure over <strong>the</strong> Leona River,• 1533 foot structure over <strong>the</strong> Nueces River,• 510 foot structure (Koenig Bridge) over <strong>the</strong> Nueces River, and a• 126 foot and a 188 foot structure over Turkey Creek.A complete listing of <strong>the</strong> Del Rio Subdivision structures can be found in Appendix B.Figure 4-11 depicts <strong>the</strong> layout and grade crossing protection locations for <strong>the</strong> DelRio Subdivision.4 - 25
<strong>San</strong> <strong>An<strong>to</strong>nio</strong> <strong>Region</strong> <strong>Freight</strong> <strong>Study</strong> Existing Rail NetworkFigure 4-11: Del Rio Subdivision4 - 26
<strong>San</strong> <strong>An<strong>to</strong>nio</strong> <strong>Region</strong> <strong>Freight</strong> <strong>Study</strong>Existing Rail NetworkUP Glidden SubdivisionThe Glidden Subdivision is one leg of UP’s Trans-Continental route which runs fromLos Angeles, California <strong>to</strong> Hous<strong>to</strong>n, <strong>Texas</strong>. Beginning at Harrisburg Junction inHous<strong>to</strong>n, <strong>the</strong> Glidden Subdivision enters in<strong>to</strong> <strong>the</strong> study area at <strong>the</strong> Caldwell County –Guadalupe County line at railroad MP 156.54. It crosses <strong>the</strong> Guadalupe County –Bexar County line at railroad MP 193.12, and ends at <strong>the</strong> east end of Kirby Yard atMP 201.40 where it becomes <strong>the</strong> Del Rio Subdivision. The tracks were originallyconstructed by <strong>the</strong> Galves<strong>to</strong>n, Harrisburg, & <strong>San</strong> <strong>An<strong>to</strong>nio</strong> Railway in 1877.Glidden Subdivision (See Table 4-7)Total Subdivision Tracks 44.86 milesTotal track in Guadalupe County 36.58 milesTotal track in Bexar County 8.28 milesGlidden SubdivisionTrack Type Milepost Start Milepost End Length (Miles) Yard or Siding NameMain 156.54 201.40 44.86Siding 162.96 164.68 1.72 KingsburySiding 173.92 174.32 0.40 SeguinSiding 175.58 177.34 1.76 NolteSiding 187.11 189.14 2.03 CiboloSiding 194.33 196.06 1.73 RandolphSiding 196.40 196.94 0.54 ConverseTable 4-7: Del Rio Subdivision Track Type Summary TableWithin <strong>the</strong> study area, <strong>the</strong> Glidden Subdivision single main track beginsapproximately half way between Luling and Seguin, and ends at <strong>the</strong> east end ofKirby Yard (near Randolph Air Force Base) where it continues as <strong>the</strong> Del RioSubdivision. The single main track generally runs parallel <strong>to</strong> US 90 between Lulingand Seguin. Between Seguin and Schertz, <strong>the</strong> single main tracks are generallyparallel with <strong>Texas</strong> Highway 78.Major bridge crossings include:• 892 foot structure over <strong>the</strong> <strong>San</strong> Marcos River,• 268 foot structure over E. Mill Creek,• 194 foot structure over W. Mills Creek,• 217 foot structure over Geronimo Creek,• 1100 foot structure over <strong>the</strong> Guadalupe River,• 100 foot and a 135 foot structure over Young’s Creek,• 240 foot structure over E. <strong>San</strong>ta Clara Creek,• 135 foot and a 240 foot structure over <strong>San</strong>ta Clara Creek,• 210 foot structure over Town Creek, and a• 434 foot structure over Cibolo Creek.4 - 27
<strong>San</strong> <strong>An<strong>to</strong>nio</strong> <strong>Region</strong> <strong>Freight</strong> <strong>Study</strong>Existing Rail NetworkA complete listing of <strong>the</strong> Glidden Subdivision structures can be found in Appendix B.Figure 4-12 depicts <strong>the</strong> layout and grade crossing protection locations for <strong>the</strong>Glidden Subdivision.4 - 28
<strong>San</strong> <strong>An<strong>to</strong>nio</strong> <strong>Region</strong> <strong>Freight</strong> <strong>Study</strong> Existing Rail NetworkFigure 4-12: Glidden Subdivision4 - 29
<strong>San</strong> <strong>An<strong>to</strong>nio</strong> <strong>Region</strong> <strong>Freight</strong> <strong>Study</strong>Existing Rail NetworkUP Laredo SubdivisionThe Laredo Subdivision begins at railroad MP 260.40, which is <strong>the</strong> terminus of <strong>the</strong>Austin Subdivision ML 2. It crosses <strong>the</strong> Bexar County – Atascosa County line at MP281.30, <strong>the</strong> Atascosa County – Medina County line at MP 282.69, <strong>the</strong> MedinaCounty – Frio County line at MP 296.46, and <strong>the</strong> Frio County – La Salle County lineat MP 331.08, terminating at <strong>the</strong> US/Mexico border in Laredo, <strong>Texas</strong>. The trackswere originally constructed by <strong>the</strong> International & Great Nor<strong>the</strong>rn Railroad in 1882.Laredo Subdivision (See Table 4-8)Total Subdivision Tracks 70.68 milesTotal track in Bexar County 20.90 milesTotal track in Atascosa County 1.39 milesTotal track in Medina County 13.77 milesTotal track in Frio County 34.62 milesLaredo SubdivisionTrack Type Milepost Start Milepost End Length (Miles) Yard or Siding NameMain 260.40 331.08 70.68Yard 260.40 265.70 5.30 SosanYard 312.48 313.10 0.62 PearsallSiding 277.80 279.31 1.51 AtascosaSiding 295.08 296.89 1.81 YarbroughSiding 317.14 318.60 1.46 MelonSiding 320.97 321.54 0.57 DerbyTable 4-8: Laredo Subdivision Track Type Summary TableA connection track connects <strong>the</strong> Laredo Subdivision <strong>to</strong> <strong>the</strong> Del Rio Subdivision atMP 265.78, Heafer Junction, and again at MP 267.72. The Del Rio Subdivisioncrosses <strong>the</strong> Laredo Subdivision at MP 260.50. MP 262.06 marks <strong>the</strong> beginning of<strong>the</strong> main tracks of <strong>the</strong> Corpus Christi Subdivision.The single main tracks begin in <strong>San</strong> <strong>An<strong>to</strong>nio</strong> at Tower 105, at <strong>the</strong> terminus of <strong>the</strong>Austin Subdivision (Pho<strong>to</strong> 4-8). It runs south of <strong>the</strong> former Kelly Air Force Base andpasses through Lytle, Natalia, Devine, Pearsall, and Dilley, <strong>Texas</strong> en route <strong>to</strong>Laredo.4 - 30
<strong>San</strong> <strong>An<strong>to</strong>nio</strong> <strong>Region</strong> <strong>Freight</strong> <strong>Study</strong>Existing Rail NetworkPho<strong>to</strong> 4-8: Tower 105. View West, Del Rio/Austin ML 1/Laredo Sub crossingMajor bridge crossings include:• 308 foot structure over Leon Creek,• 190 foot structure over Medio Creek,• 400 foot structure over <strong>the</strong> Medina River,• 157 foot structure over Elm Creek,• 117 foot structure over North Prong Creek,• 144 foot structure over <strong>the</strong> West Prong Atascosa River,• 200 foot structure over Ft. Ewell Creek,• 323 foot structure over Chacon Creek,• 219 foot structure over Burnt Boot Creek,• 233 foot structure over <strong>San</strong> Francisco Perez Creek,• 109 foot structure over Moore Hallow Creek,• 2077 foot structure over <strong>the</strong> Frio River, and a• 112 foot structure over Martin Branch Creek.A complete listing of <strong>the</strong> Laredo Subdivision structures can be found in Appendix B.Figure 4-13 depicts <strong>the</strong> layout and grade crossing protection locations for <strong>the</strong> LaredoSubdivision.4 - 31
<strong>San</strong> <strong>An<strong>to</strong>nio</strong> <strong>Region</strong> <strong>Freight</strong> <strong>Study</strong> Existing Rail NetworkFigure 4-13 : Laredo Subdivision4 - 32
<strong>San</strong> <strong>An<strong>to</strong>nio</strong> <strong>Region</strong> <strong>Freight</strong> <strong>Study</strong>Existing Rail NetworkUP Rockport SubdivisionThe Rockport Subdivision begins at MP 0.19 and ends at MP 11.00. It is located inBexar County, between <strong>San</strong> <strong>An<strong>to</strong>nio</strong> and Elmendorf. The tracks were originallyconstructed by <strong>the</strong> <strong>San</strong> <strong>An<strong>to</strong>nio</strong> & Aransas Pass Railway in 1885.Rockport Subdivision (See Table 4-9)Total Subdivision Tracks 11.19 milesTotal track in Bexar County 11.19 milesRockport SubdivisionTrack Type Milepost Start Milepost End Length (Miles) Yard or Siding NameMain 0.00 11.00 11.00Table 4-9: Rockport Subdivision Track Type Summary TableThe single main tracks become <strong>the</strong> Rockport Subdivision as it passes through Tower112—where <strong>the</strong> Kerrville Subdivision ends—and it ends as it approaches Coal PlantJunction, where it continues as <strong>the</strong> Rockport Industrial Lead.The single main tracks pass through <strong>San</strong> <strong>An<strong>to</strong>nio</strong>, <strong>Texas</strong>. Major bridge crossingsinclude a 193 foot structure over <strong>the</strong> <strong>San</strong> <strong>An<strong>to</strong>nio</strong> River and a 202 foot structure overSalado Creek. A complete listing of <strong>the</strong> Rockport Subdivision structures can befound in Appendix B. Figure 4-14 depicts <strong>the</strong> layout and grade crossing protectionlocations for <strong>the</strong> Rockport Subdivision.4 - 33
<strong>San</strong> <strong>An<strong>to</strong>nio</strong> <strong>Region</strong> <strong>Freight</strong> <strong>Study</strong> Existing Rail NetworkFigure 4-14 : Rockport Subdivision4 - 34
<strong>San</strong> <strong>An<strong>to</strong>nio</strong> <strong>Region</strong> <strong>Freight</strong> <strong>Study</strong>Existing Rail NetworkUP Rockport Industrial LeadThe Rockport Industrial Lead Subdivision begins at MP 11.00 of <strong>the</strong> RockportSubdivision and ends at MP 16.10. It is located in Bexar County, in Elmendorf,<strong>Texas</strong>. The tracks were originally constructed by <strong>the</strong> <strong>San</strong> <strong>An<strong>to</strong>nio</strong> & Aransas PassRailway in 1885.Rockport Industrial Lead (See Table 4-10)Total Subdivision Tracks 5.10 milesTotal track in Bexar County 5.10 milesRockport Industrial Lead SubdivisionTrack Type Milepost Start Milepost End Length (Miles) Yard or Siding NameMain 11.00 16.10 5.10Siding 15.64 15.94 0.30Table 4-10: Rockport Industrial Lead Track Type Summary TableThe single main tracks become <strong>the</strong> Rockport Industrial Lead as it passes throughCoal Plant Junction, where <strong>the</strong> Rockport Subdivision ends.There are no major bridge crossings in <strong>the</strong> Rockport Industrial Lead.Figure 4-15 depicts <strong>the</strong> layout and grade crossing protection locations for <strong>the</strong>Rockport Industrial Lead.4 - 35
<strong>San</strong> <strong>An<strong>to</strong>nio</strong> <strong>Region</strong> <strong>Freight</strong> <strong>Study</strong> Existing Rail NetworkFigure 4-15: Rockport Industrial Lead4 - 36
<strong>San</strong> <strong>An<strong>to</strong>nio</strong> <strong>Region</strong> <strong>Freight</strong> <strong>Study</strong><strong>Freight</strong> Rail Base Case Operations ModelSECTION 5: ESTABLISHMENT OF A FREIGHT RAIL BASE CASEOPERATIONS MODELTo fully encompass <strong>the</strong> movement of freight by rail within <strong>the</strong> <strong>San</strong> <strong>An<strong>to</strong>nio</strong> region,<strong>the</strong> breadth of <strong>the</strong> study area needs <strong>to</strong> be expanded considerably, incorporatinglocations where freight movement enters or exits <strong>the</strong> general rail network fromdifferent rail lines. For <strong>San</strong> <strong>An<strong>to</strong>nio</strong>, this network has been expanded <strong>to</strong> encompassUP’s <strong>San</strong> <strong>An<strong>to</strong>nio</strong> Service Unit, as shown in Figure 5-1, and portions of UP’s FortWorth Service Unit comprising <strong>the</strong> overall study area rail network. Information fortrain movements for this region, shown in Figure 5-2, was provided by UP for <strong>the</strong>purpose of conducting an operational analyses utilizing Rail Traffic Controller(RTC) software.UP <strong>San</strong> <strong>An<strong>to</strong>nio</strong> Service UnitAlpineTEXASSANANTONIOAustinTaylorFla<strong>to</strong>niaKatyMEXICOSpoffordEaglePassVic<strong>to</strong>riaFast Facts• Miles of Track 1,544• Employees 1,296LaredoCorpusChristiBrownsvilleGULF OFMEXICOFigure 5-1: UP <strong>San</strong> <strong>An<strong>to</strong>nio</strong> Service UnitThis section summarizes <strong>the</strong> results of <strong>the</strong> base case RTC simulation.5 - 1
<strong>San</strong> <strong>An<strong>to</strong>nio</strong> <strong>Region</strong> <strong>Freight</strong> <strong>Study</strong><strong>Freight</strong> Rail Base Case Operations ModelThe base case simulates current UP train operations through <strong>the</strong> study area, andincludes BNSF trackage rights trains on UP rail lines between Hearne and <strong>San</strong><strong>An<strong>to</strong>nio</strong>. This network includes four alternative routes that trains currently utilizebetween Waco/Hearne and <strong>San</strong> <strong>An<strong>to</strong>nio</strong>:‣ Via Taylor, Austin, and <strong>San</strong> Marcos (Austin Subdivision);‣ Via Taylor, Smithville, and <strong>San</strong> Marcos (Waco, Lockhart and AustinSubdivisions);‣ Via West Point, Smithville, and <strong>San</strong> Marcos (Giddings, Smithville, Lockhartand Austin Subdivisions); and,‣ Via West Point, Fla<strong>to</strong>nia, and Luling (Giddings, Cuero, and GliddenSubdivisions).At <strong>the</strong> suggestion of UP, <strong>the</strong> RTC network (Figure 5-2) was extended south andwest of <strong>San</strong> <strong>An<strong>to</strong>nio</strong> <strong>to</strong> capture train movements approaching <strong>the</strong> <strong>San</strong> <strong>An<strong>to</strong>nio</strong> area.The Waco Subdivision was extended north <strong>to</strong> Temple and Waco so that BNSF trainswould be included for <strong>the</strong> entire length of <strong>the</strong> line segment. These additionsincorporate train movements on each line that might subsequently impactmovements in <strong>the</strong> primary <strong>San</strong> <strong>An<strong>to</strong>nio</strong> analysis area.Sou<strong>the</strong>rn <strong>Region</strong>WacoSimulation BoundariesProposed freight shift - same alignmentProposed freight shift - new alighmentFeeder lines for simulationWaco SubMP 841.9 - 918.8TaylorValley Jct.HearneFt. Worthand<strong>San</strong> <strong>An<strong>to</strong>nio</strong>Service UnitsKerrville SubMP 0.0 - 19.05<strong>San</strong> <strong>An<strong>to</strong>nio</strong>Austin SubMP 89.6 - 260.4MP 208.3 - 259.8<strong>San</strong> MarcosWaco/Lockhart SubNew AlignmentBastropRed RockLockhartSmithvilleSealyDel Rio SubLacoste SidingMP 234.19SeguinGlidden SubLulingMP 153.54Fla<strong>to</strong>niaSpoffordLaredo SubYarbrough SidingMP 295.16Rockport SubMP 0.0 - 16.10Vic<strong>to</strong>riaEaglePassCorpus Christi SubMP 13.0Blooming<strong>to</strong>nMainlineSecondary LinesTrackage RightsLaredoFigure 5-2: Courtesy UP – July 11, 2004G:\All\CPA South\12 <strong>San</strong> <strong>An<strong>to</strong>nio</strong> SU\TxDoT Simulation Boundaries with text.ppt5 - 2
<strong>San</strong> <strong>An<strong>to</strong>nio</strong> <strong>Region</strong> <strong>Freight</strong> <strong>Study</strong><strong>Freight</strong> Rail Base Case Operations ModelFigure 5-3 shows <strong>the</strong> base case rail lines as <strong>the</strong>y appear on <strong>the</strong> RTC computerscreen, labeled with associated railroad MPs. The RTC diagram “folds” <strong>the</strong> linesinternally <strong>to</strong> make best use of <strong>the</strong> computer screen space, and as such may not bedisplayed geographically correct. Mainline, siding, yard, and selected industrialtracks were coded in<strong>to</strong> RTC with attributes that impact train operations, includingallowable operating speed, distance, grade, switch type, signal system, and o<strong>the</strong>rfeatures.Figure 5-3: RTC Base Case Network(RTC Case SA 11)The entire network is predominately single track with sidings. Double track existsonly in two relatively short areas:‣ From Heafer Junction <strong>to</strong> East Yard, on <strong>the</strong> original Sou<strong>the</strong>rn Pacific linethrough <strong>San</strong> <strong>An<strong>to</strong>nio</strong>, for a distance of approximately 13 miles; and,‣ From <strong>San</strong> Marcos <strong>to</strong> Craig Junction, where <strong>the</strong> parallel former MissouriPacific and Missouri-Kansas-<strong>Texas</strong> lines have been configured as doubletrack for a distance of approximately 27 miles.Existing rail traffic movement on <strong>the</strong> Austin Subdivision between <strong>San</strong> Marcos andValley Junction (near Hearne) is heaviest in <strong>the</strong> north and eastbound directions.Many of <strong>the</strong> counterpart trains headed south and westbound use <strong>the</strong> Giddings,Smithville, and Lockhart Subdivisions between Valley Junction and <strong>San</strong> Marcos.5 - 3
<strong>San</strong> <strong>An<strong>to</strong>nio</strong> <strong>Region</strong> <strong>Freight</strong> <strong>Study</strong><strong>Freight</strong> Rail Base Case Operations ModelThese directional flows help <strong>to</strong> minimize occurrences of trains meeting whentraveling in opposite directions on each route.Two subsequent enhancements were made <strong>to</strong> <strong>the</strong> base case <strong>to</strong> incorporate trackimprovements planned by UP within <strong>the</strong> next few years and track and yard additions<strong>to</strong> accommodate Toyota train operations. Figure 5-4 shows a screen capture of <strong>the</strong>enhanced base case for <strong>the</strong> combined track improvements and Toyota scenario.Figure 5-4: Base Case Network with Toyota Facility and UP Track Improvements(RTC Case SA 12X)Base Case MethodologyUP provided two independent sets of train movement records representing 30-dayperiods of operations. The initial data was dated Oc<strong>to</strong>ber/November 2003, while <strong>the</strong>updated information was dated February 2005. The records included train symbol oridentification, scheduled and actual operating times at key reporting locations, anddata on <strong>the</strong> consist, or make-up, of each train (such as <strong>the</strong> number of engines,horsepower, train <strong>to</strong>nnage, and train length).Records were provided for both UP and BNSF trains. Upon review of <strong>the</strong> UP data, aseries of schedules for <strong>the</strong> trains was created that syn<strong>the</strong>sized <strong>the</strong> actual operationsin<strong>to</strong> typical patterns for <strong>the</strong> simulation. The train schedules developed for <strong>the</strong>simulation include train identification and type, priority, number and type of engines,<strong>to</strong>nnage and length, initial departure location and times, dwell times at subsequentlocations, and ultimate destination.5 - 4
<strong>San</strong> <strong>An<strong>to</strong>nio</strong> <strong>Region</strong> <strong>Freight</strong> <strong>Study</strong><strong>Freight</strong> Rail Base Case Operations ModelFor trains that did not run daily, <strong>the</strong> number of trains observed during <strong>the</strong> 30-dayperiod was translated <strong>to</strong> <strong>the</strong> average number of trains per week for <strong>the</strong> purpose ofconstructing <strong>the</strong> RTC train files. Trains that ran only a few days per week weregiven different operating days for each week in order <strong>to</strong> simulate <strong>the</strong> randomness of<strong>the</strong> actual operations.When <strong>the</strong> simulation is run, RTC “dispatches” each train over <strong>the</strong> network using alogic that simulates <strong>the</strong> decision making process of railroad dispatchers. Theprogram resolves train “conflicts”, or meeting and passing situations, for a prescribednumber of days and weeks selected by <strong>the</strong> RTC analyst. The simulated operationsreflect <strong>the</strong> consist (train makeup) of each train and its relative priority regardingmovement. RTC output includes statistical results of train operations and <strong>the</strong> ability<strong>to</strong> follow trains visually on <strong>the</strong> computer screen as <strong>the</strong>y move over <strong>the</strong> track network.It also provides various measures <strong>to</strong> analyze track occupancy and <strong>the</strong> location ofconflicting moves <strong>to</strong> be resolved.Each RTC simulation is performed over a period representative of four weeks oftrain traffic. RTC’s randomization feature was used <strong>to</strong> reflect <strong>the</strong> operatingvariations for each train that were observed from <strong>the</strong> data provided by UP. With <strong>the</strong>random feature enabled, each train is dispatched at a random time within a “timewindow” specified in <strong>the</strong> train schedule that reflects <strong>the</strong> actual variations in operatingtimes, ra<strong>the</strong>r than starting each train at a single scheduled time each day. Thisfeature creates differing operating results each day 1 , emulating <strong>the</strong> actualexperience observed in <strong>the</strong> UP train data.This analysis was conducted with <strong>the</strong> objective of measuring through-trainoperations. The train schedules developed did not include every nuance of trainmovement, such as light engine moves between engine terminals and freight yards,or detailed switching operations at on-line industrial locations. The analysis also didnot introduce unplanned or occasional events, such as track closures due <strong>to</strong>operating emergencies or necessary maintenance activities. RTC is capable ofincluding <strong>the</strong>se events in <strong>the</strong> simulation process, and a representative series of suchevents may be included in any future more detailed simulation efforts.Base Case FindingsRTC produces summary reports for each simulation exercise, in addition <strong>to</strong> detailedreports on <strong>the</strong> movement of each train. For this preliminary analysis, <strong>the</strong> summaryreports fairly represent <strong>the</strong> results of <strong>the</strong> simulation. The summary data include <strong>the</strong>1 The RTC randomization feature changes <strong>the</strong> initial departure times, but does not change <strong>the</strong> trainconsist (train make-up consisting of engines and rail cars) <strong>to</strong> reflect shorter or longer trains. Adjustingtrain consists would require creating a separate schedule for each day that <strong>the</strong> each train is operated.The train schedules were entered using <strong>the</strong> most typical consists reported in <strong>the</strong> UP train data sheets.5 - 5
<strong>San</strong> <strong>An<strong>to</strong>nio</strong> <strong>Region</strong> <strong>Freight</strong> <strong>Study</strong><strong>Freight</strong> Rail Base Case Operations Modelfollowing performance measures for each of three groups of trains (passenger,expedited freight, and o<strong>the</strong>r freight):‣ Average Speed - This measure includes dwell time at stations, yards, and enroute work locations;‣ Meet-Pass Delay Percentage - The percentage of delay time incurred bytrains that was required for trains <strong>to</strong> meet and pass on single track; and,‣ Delay Minutes per 100 Train Miles - Total delay <strong>to</strong> all trains for all reasons.In subsequent RTC simulations of alternative networks, <strong>the</strong> same measures will bereported for <strong>the</strong> same trains, with some trains operating over <strong>the</strong> alternativetrackage. This will enable comparison of <strong>the</strong> simulated “current” results with <strong>the</strong>simulated results of improved rail networks in which some trains will be shifted <strong>to</strong>new or improved alignments.The base case was simulated for a four week period of train operations and wasmodeled two additional times with a unique “random seed number” that produces adifferent set of starting times for each train. Results were comparable for eachsimulation, and an average of 83 trains operated daily in <strong>the</strong> base case network.The greatest number of dispatching conflicts occurs between <strong>San</strong> <strong>An<strong>to</strong>nio</strong> andControl Point (CP) Adams on <strong>the</strong> Austin Subdivision ML 1, and on <strong>the</strong> KerrvilleSubdivision between Tower 112 and Apache Junction. However, as discussed inSections 3 and 7, <strong>the</strong> Kerrville Subdivision <strong>to</strong> Austin Subdivision connection wasupgraded by UP in August, 2006. The highest measurements of delay were foundon <strong>the</strong> Austin Subdivision north of Round Rock, and at locations along <strong>the</strong> Smithvilleand Lockhart Subdivisions. Significant delay was identified east of Kirby Yard and atTower 112.A future addition <strong>to</strong> <strong>the</strong> base case may include proposed traffic from a new limes<strong>to</strong>nequarry that Vulcan Construction Materials has proposed <strong>to</strong> open in Quihi, <strong>Texas</strong>.Quihi is about 39 miles west of <strong>San</strong> <strong>An<strong>to</strong>nio</strong> and is approximately seven miles northof Dunlay in Medina County.The Southwest Gulf Railroad Company (SGR) would operate <strong>the</strong> seven mile linefrom <strong>the</strong> quarry <strong>to</strong> Dunlay. The new line is intended <strong>to</strong> be accessed from <strong>the</strong> Del RioSubdivision near MP 250. UP would <strong>the</strong>n transport <strong>the</strong> cars <strong>to</strong> markets in <strong>the</strong>Hous<strong>to</strong>n area, as well as o<strong>the</strong>r markets in <strong>the</strong> Sou<strong>the</strong>ast, Gulf Coast, and <strong>the</strong> RioGrande Valley regions of <strong>Texas</strong>. This project is awaiting approval of <strong>the</strong> SurfaceTransportation Board and it is unknown when an approval may be granted.Impact of Near Term ImprovementsUP is upgrading portions of <strong>the</strong>ir rail network in <strong>the</strong> region. These upgrades, asshown in Figures 5-5 through 5-7, are planned and in some cases completedimprovements that will be implemented by UP. The UP improvements <strong>to</strong> <strong>the</strong> currentnetwork were incorporated in<strong>to</strong> <strong>the</strong> original network <strong>to</strong> adequately test <strong>the</strong> validity of5 - 6
<strong>San</strong> <strong>An<strong>to</strong>nio</strong> <strong>Region</strong> <strong>Freight</strong> <strong>Study</strong><strong>Freight</strong> Rail Base Case Operations Modelidentified improvements. Improvements currently underway <strong>to</strong> accommodate trainservice <strong>to</strong> <strong>the</strong> new Toyota facility were also incorporated in<strong>to</strong> <strong>the</strong> base case network.5 - 7
<strong>San</strong> <strong>An<strong>to</strong>nio</strong> <strong>Region</strong> <strong>Freight</strong> <strong>Study</strong> <strong>Freight</strong> Rail Base Case Operations ModelFigure 5-5: UP Planned Infrastructure Improvements1. Construct a second mainline from Alamo Junction <strong>to</strong> Wi<strong>the</strong>rs Junction on <strong>the</strong> Del Rio Subdivision (south/west of So<strong>San</strong> yard)2. Increase <strong>the</strong> capacity of So<strong>San</strong> yard <strong>to</strong> accommodate anticipated au<strong>to</strong> carrier traffic from <strong>the</strong> Toyota plant, including constructing a switching lead on <strong>the</strong> Corpus Christi Subdivision3. Constructing a second mainline on <strong>the</strong> Del Rio Subdivision between East and Kirby yards, do be done in two phases4. Constructing a 9000’ siding <strong>to</strong> <strong>the</strong> Corpus Christi Subdivision near <strong>the</strong> switch/lead track that will lead in<strong>to</strong> Toyota.5. Install a connec<strong>to</strong>r from <strong>the</strong> Austin Subdivision <strong>to</strong> <strong>the</strong> Kerrville Subdivision5 - 8
<strong>San</strong> <strong>An<strong>to</strong>nio</strong> <strong>Region</strong> <strong>Freight</strong> <strong>Study</strong><strong>Freight</strong> Rail Base Case Operations ModelMaintenance ProgramsAdditionally, UP intends <strong>to</strong> renew portions of <strong>the</strong>ir infrastructure which maycontribute significantly <strong>to</strong>ward improved train operations throughout <strong>the</strong> area.Figures 5-6 and 5-7 graphically depict <strong>the</strong> approximate locations, type ofimprovement, and estimated collective costs for <strong>the</strong>se improvements.The “New Rail” referenced in <strong>the</strong> figures consists of new tracks (rail) along anexisting corridor, while <strong>the</strong> “SH Rail” consists of replacing existing tracks withsecond-hand (used) rail. The “Curve Rail” improvements consist of replacing rail incurved sections of an existing alignment and “Wood Ties” references replacing woodtrack ties in an existing alignment.Figure 5-6: 2005 Infrastructure Renewal Projects(Source: UP)5 - 9
<strong>San</strong> <strong>An<strong>to</strong>nio</strong> <strong>Region</strong> <strong>Freight</strong> <strong>Study</strong><strong>Freight</strong> Rail Base Case Operations ModelFigure 5-7: 2006 Infrastructure Renewal Projects(Source: UP)Base Case Simulation ResultsThe simulations discussed in <strong>the</strong> following pages were run with RTC softwareversion 2.70 L2C, which was <strong>the</strong> current version as of September, 2005. Thefollowing cases were simulated in <strong>the</strong> RTC model <strong>to</strong> establish <strong>the</strong> final base case <strong>to</strong>be used in all fur<strong>the</strong>r analysis:SA11 - This case represents current track and operations. The network extendsfrom Hearne and Fla<strong>to</strong>nia on <strong>the</strong> north and east, <strong>to</strong> Hondo and Melon on <strong>the</strong> southand west.SA12X - This case incorporates various track improvements in <strong>the</strong> <strong>San</strong> <strong>An<strong>to</strong>nio</strong> areathat will be implemented by UP as previously discussed, likely <strong>to</strong> be completedwithin <strong>the</strong> next two years. These improvements, necessitated primarily by <strong>the</strong> newToyota assembly plant, include:‣ Extension of double track approximately one mile east of East Yard;‣ Construction of a new connection between <strong>the</strong> Kerrville Sub and <strong>the</strong> AustinSubdivision at Apache Junction;5 - 10
<strong>San</strong> <strong>An<strong>to</strong>nio</strong> <strong>Region</strong> <strong>Freight</strong> <strong>Study</strong><strong>Freight</strong> Rail Base Case Operations Model‣ Provision of additional yard tracks adjacent <strong>to</strong> So<strong>San</strong> Yard, and improvedconnections between <strong>the</strong> Del Rio and Laredo Subdivisions at So<strong>San</strong>; and,‣ Double track from So<strong>San</strong> <strong>to</strong> <strong>the</strong> new Toyota plant on <strong>the</strong> Corpus ChristiSubdivision.Train files in this case are <strong>the</strong> same as Case SA11 (i.e. no additional train traffic wasadded for <strong>the</strong> Toyota assembly plant).SA12 - The track network for this case is identical <strong>to</strong> SA12X, and represents <strong>the</strong>planned UP improvements assumed <strong>to</strong> be in place in <strong>the</strong> immediate future <strong>to</strong>accommodate anticipated Toyota traffic.Train files for this case were modified <strong>to</strong> include eight daily au<strong>to</strong> trains <strong>to</strong> and from<strong>the</strong> Toyota plant. One daily round trip would operate from <strong>the</strong> Del Rio Subdivision,two round trips from <strong>the</strong> Austin Subdivision, and one round trip from <strong>the</strong> GliddenSubdivision. Trains were assumed <strong>to</strong> operate directly <strong>to</strong> and from <strong>the</strong> Toyota facility.Table 5-1 shows <strong>the</strong> comparisons of results from <strong>the</strong> RTC cases for <strong>the</strong> three basecases established.SA 11(Original BaseCase)SA 12X(Case SA 11 +UP Improvements)SA 12(Case SA 12X+ Toyota Trains)Number of Trains 2,665 2,665 2,890Train Miles 326,186 326,158 358,817Average Speed26.351 26.454 26.058(All Trains)Au<strong>to</strong> 32.709 32.743 30.129Intermodal 34.072 32.671 31.468Manifest 24.341 24.774 24.117Z Premium 31.343 31.939 31.366Delay Minutes Per31.94 32.0 36.7100 TMDelay Ratio 14.0% 13.9% 15.9%Fuel Consumption 2,800,095 2,806,352 3,055,146(gal)Table 5-1: RTC modeling results comparisonAverage velocity of all trains remains similar through all three cases, but <strong>the</strong> additionof <strong>the</strong> Toyota trains results in lowering of speeds for <strong>the</strong> faster au<strong>to</strong> and intermodalservices. While <strong>the</strong> number of trains and train miles increases in SA12 and <strong>the</strong> nearterm improvements provide for flow of trains <strong>to</strong> and from <strong>the</strong> Toyota plant, <strong>the</strong>addition of <strong>the</strong> eight daily trains <strong>to</strong> or from Toyota causes increased congestion on<strong>the</strong> portions of <strong>the</strong> network outside <strong>the</strong> <strong>San</strong> <strong>An<strong>to</strong>nio</strong> area, and contributes <strong>to</strong> anincrease in both delay minutes per 100 train miles, and an increase in <strong>the</strong> delay ratio5 - 11
<strong>San</strong> <strong>An<strong>to</strong>nio</strong> <strong>Region</strong> <strong>Freight</strong> <strong>Study</strong><strong>Freight</strong> Rail Base Case Operations Model(<strong>to</strong>tal hours of delay compared <strong>to</strong> <strong>to</strong>tal operating hours including delay andscheduled dwell). These results show <strong>the</strong> need for <strong>the</strong> UP planned improvements,which are necessitated by <strong>the</strong> Toyota assembly plant construction. Without <strong>the</strong>seimprovements, <strong>the</strong> existing network would be constrained by <strong>the</strong> added traffic fromToyota.The construction of <strong>the</strong> Toyota plant was conditional upon <strong>the</strong> railroad making <strong>the</strong>improvements which are included in <strong>the</strong> above modeling cases (SA12X and SA12).Since <strong>the</strong> addition of <strong>the</strong> Toyota plant and <strong>the</strong> provision of track improvements in <strong>the</strong>vicinity are fairly certain, subsequent comparisons of infrastructure improvementsand alternatives will use base case SA12 as <strong>the</strong> basis for measuring <strong>the</strong> impacts of<strong>the</strong> additional improvements.In summary, within <strong>the</strong> greater <strong>San</strong> <strong>An<strong>to</strong>nio</strong> area, train delays are generallyencountered throughout <strong>the</strong> region; mostly caused by congestion resulting from <strong>to</strong>omany trains. Particular areas noted are:‣ Delays <strong>to</strong> trains entering, leaving, or passing by East Yard and Kirby Yard areoften caused by o<strong>the</strong>r trains slowing <strong>to</strong> enter <strong>the</strong> yard tracks directly from <strong>the</strong>main lines. Nei<strong>the</strong>r East nor Kirby Yards have long approach tracks off <strong>the</strong>main line, so trains tend <strong>to</strong> stack up when <strong>the</strong>re are multiple trains in <strong>the</strong> area;‣ Delays <strong>to</strong> trains on single track segments. These occur on all routes in<strong>to</strong>/ou<strong>to</strong>f <strong>San</strong> <strong>An<strong>to</strong>nio</strong>: Del Rio, Laredo, Austin Subdivision ML 1 south of Craig Jct,and Glidden east of Kirby. While <strong>the</strong>re are long periods of time with few trainson any one of <strong>the</strong>se routes, <strong>the</strong>re are o<strong>the</strong>r times when trains becomebunched up and <strong>the</strong> delays occur;‣ There are delays in <strong>the</strong> <strong>San</strong> Marcos-Hunter area with <strong>the</strong> number of rocktrains <strong>to</strong>/from Hunter; and,‣ Occasional delays at rail grade crossings at Tower 105 and <strong>the</strong> ML 1/ML 2crossing at New Braunfels.In terms of which trains get delays, <strong>the</strong> delays <strong>to</strong> rock trains appear <strong>to</strong> bepredominate. This is <strong>to</strong> be expected because <strong>the</strong>y are programmed with a lowerpriority. However, delays occur <strong>to</strong> all classes of trains, including those with <strong>the</strong>highest priority, on <strong>the</strong> single track segments. Even premium intermodal trains have<strong>to</strong> meet on single track, attributing <strong>to</strong> <strong>the</strong> delay.The following improvements <strong>to</strong> <strong>the</strong> <strong>San</strong> <strong>An<strong>to</strong>nio</strong> rail network have been completedby UP:‣ Improved connections between <strong>the</strong> Laredo and Del Rio Subdivisions andSo<strong>San</strong> Yard improvements <strong>to</strong> accommodate rail traffic <strong>to</strong> and from <strong>the</strong> newToyota facility‣ The addition of a second track on <strong>the</strong> Del Rio Subdivision from MP 206.4(East Yard) <strong>to</strong> MP 205.0 and MP 205.0 <strong>to</strong> 203.4 <strong>to</strong>wards Kirby Yard5 - 12
<strong>San</strong> <strong>An<strong>to</strong>nio</strong> <strong>Region</strong> <strong>Freight</strong> <strong>Study</strong><strong>Freight</strong> Rail Base Case Operations ModelImprovements intended <strong>to</strong> accommodate train service in<strong>to</strong> and out of <strong>the</strong> newToyota facility were incorporated in<strong>to</strong> <strong>the</strong> base case network creating a networkmodel which will ultimately be used as <strong>the</strong> basis of comparison when testing <strong>the</strong>validity of identified improvements.The SA12X case, shown in Table 5-2, includes <strong>the</strong> existing rail network plus <strong>the</strong>projects UP has completed or will soon complete. The case was modeled wi<strong>the</strong>xisting trains and did not include <strong>the</strong> anticipated eight daily Toyota trains.Passenger Expedited <strong>Freight</strong> All TrainsTrains Operated 80 646 1941 2667Train Miles 10,240 126,105 190,240 326,584Total Run Time 16:16:39 160:17:42 339:12:03 516:22:26Delay Time 3:53 18:08:51 53:14:16 72:03:01Delay Percent 1.0% 11.4% 15.8% 14.0%Delay/100 TM 2.28 20.98 40.57 31.80Average Speed 25.557 32.689 23.348 26.324Table 5-2: SA12X CaseThe SA12 base case, which includes <strong>the</strong> anticipated daily Toyota train traffic, andwill serve as <strong>the</strong> new basis of comparison for <strong>the</strong> planning cases discussed inSection 7, is shown in Table 5-3 below.Passenger Expedited <strong>Freight</strong> All TrainsTrains Operated 80 841 1,940 2,861Train Miles 10,240 156,456 190,138 356,833Total Run Time 16:16:59 208:03:43 350:21:47 575:18:30Delay Time 4:13 27:21:34 65:02:59 93:04:46Delay Percent 1.1% 13.4% 18.6% 16.2%Delay/100 TM 2.47 25.68 49.32 37.61Average Speed 25.536 31.318 22.577 25.823Table 5-3: SA12 Base CaseFour planning cases, representing a <strong>to</strong>tal of eight improvements and/or relocations<strong>to</strong> <strong>the</strong> existing infrastructure, were investigated with <strong>the</strong> ultimate goal of improvingtrain mobility and efficiency, and addressing <strong>the</strong> areas of greatest congestion within<strong>the</strong> network. Three additional planning cases, representing a potential <strong>San</strong> <strong>An<strong>to</strong>nio</strong>bypass, an Austin bypass from Seguin <strong>to</strong> Taylor, and a combined <strong>San</strong> <strong>An<strong>to</strong>nio</strong> andAustin bypass, were also evaluated.As a result, <strong>the</strong> planning case improvements primarily address large terminals, suchas So<strong>San</strong>, East and Kirby Yards, and bottlenecked locations such as double track <strong>to</strong>single mainline tracks. In general, <strong>the</strong> seven planning cases (discussed in Section 7)consisted of:‣ Upgrades <strong>to</strong> <strong>the</strong> UP’s Waco and Lockhart Subdivisions,5 - 13
<strong>San</strong> <strong>An<strong>to</strong>nio</strong> <strong>Region</strong> <strong>Freight</strong> <strong>Study</strong><strong>Freight</strong> Rail Base Case Operations Model‣ A possible Austin bypass route from Taylor <strong>to</strong> Seguin,‣ Upgrades <strong>to</strong> <strong>the</strong> UP’s Glidden and Del Rio and Laredo Subdivisions,‣ Upgrades <strong>to</strong> <strong>the</strong> UP’s Austin ML 2 Subdivision in <strong>the</strong> area of East Yard <strong>to</strong>Tower 112,‣ A possible <strong>San</strong> <strong>An<strong>to</strong>nio</strong> bypass‣ Upgrades <strong>to</strong> <strong>the</strong> Corpus Christi Subdivision‣ A possible combined <strong>San</strong> <strong>An<strong>to</strong>nio</strong> and Austin bypass from Macdona <strong>to</strong>Taylor5 - 14
<strong>San</strong> <strong>An<strong>to</strong>nio</strong> <strong>Region</strong> <strong>Freight</strong> <strong>Study</strong>Rail/Roadway Safety IssuesSECTION 6: FREIGHT RAIL AND RAIL/ROADWAY INTERFACESAFETY ISSUESThe State of <strong>Texas</strong> has traditionally taken <strong>the</strong> lead regarding safety issuesassociated with <strong>the</strong> freight rail/roadway interface. The first <strong>to</strong>ll-free call in programfor <strong>the</strong> public <strong>to</strong> notify of highway-rail crossing incidents was establish by <strong>Texas</strong> in1983 with <strong>the</strong> calls directed <strong>to</strong> <strong>the</strong> State’s Emergency Management Center (EMC).Enacted by <strong>the</strong> <strong>Texas</strong> State Legislature in 1983, <strong>the</strong> Railroad Crossing SafetyInformation Act became part of <strong>the</strong> <strong>Texas</strong> Transportation Code in 1995, andestablished a State-wide <strong>to</strong>ll-free telephone network intended <strong>to</strong> report malfunctionsof <strong>the</strong> safety devices at highway-rail grade crossings. Telephone numbers weremounted on<strong>to</strong> <strong>the</strong> sides of <strong>the</strong> railroads grade crossing equipment cabinets near <strong>the</strong>at-grade crossing that contained <strong>the</strong> name of <strong>the</strong> roadway, <strong>the</strong> railroad subdivisionname, and <strong>the</strong> approximate milepost of <strong>the</strong> crossing. Upon receipt of a call, <strong>the</strong>EMC opera<strong>to</strong>r would relay <strong>the</strong> information provided by <strong>the</strong> caller <strong>to</strong> <strong>the</strong> respectiverailroad. Even though only at-grade crossings with active warning devices contain<strong>the</strong> contact information, <strong>the</strong> <strong>Texas</strong> system handles over 1200 calls monthly withinformation provided at public and private at-grade crossings. 1In 2001, after many system upgrades, <strong>the</strong> <strong>Texas</strong> call center operations weretransferred <strong>to</strong> <strong>the</strong> <strong>Texas</strong> Department of Public Safety. This program, based on <strong>the</strong>success experienced in <strong>Texas</strong>, has been adopted by most Class I freight railroadcompanies and o<strong>the</strong>r states throughout <strong>the</strong> United States. The number of fatalitiesin <strong>the</strong> U.S. has steadily declined since from 615 fatalities in 1994 <strong>to</strong> 368 in 2004,with <strong>the</strong> incident rate per million train miles decreasing from 7.6 <strong>to</strong> 3.9 during <strong>the</strong>same time period. 2During <strong>the</strong> timeframe from January 2000 through December 2005, <strong>the</strong> 12-countystudy area experienced 128 highway-rail at-grade crossing accidents, in which <strong>the</strong>rewere 14 fatalities and 78 injuries. In comparison, during this same period of time,<strong>the</strong> entire State of <strong>Texas</strong> experienced 1,974 highway-rail incidents in which <strong>the</strong>rewere 213 fatalities and 775 reported injuries. 3 Statistically, <strong>the</strong> 12-county <strong>San</strong><strong>An<strong>to</strong>nio</strong> region accounts for approximately 6.5 percent of all <strong>the</strong> highway-railaccidents and 6.6 percent of all <strong>the</strong> fatalities and 10.1 percent of all <strong>the</strong> injuries tha<strong>to</strong>ccurred at highway-rail accidents within <strong>the</strong> State. As would be expected, over 80percent of <strong>the</strong> reported grade crossing incidents and nearly 80 percent of <strong>the</strong>fatalities occurred at public at-grade crossings. Incidentally, within <strong>the</strong> study areaover 95 percent of <strong>the</strong> grade crossings contained a train approach warning system.Table 6-1 depicts <strong>the</strong> number of public at-grade crossings, sorted by type of warningdevice, for <strong>the</strong> United States, <strong>Texas</strong>, and <strong>the</strong> <strong>San</strong> <strong>An<strong>to</strong>nio</strong> region.1 Federal Railroad Administration – Pilot Program for Emergency Notification Systems at Highway-Rail Grade Crossings, May, 20062 ibid3 Federal Railroad Administration, 2000 – 2005 highway-rail at-grade crossing safety statistics.6 - 1
<strong>San</strong> <strong>An<strong>to</strong>nio</strong> <strong>Region</strong> <strong>Freight</strong> <strong>Study</strong>Rail/Roadway Safety IssuesNumber of Public At-GradeCrossings by Warning DeviceUnited States <strong>Texas</strong> <strong>San</strong> <strong>An<strong>to</strong>nio</strong> <strong>Region</strong> (1)2003 2003 2005Crossbucks(passive) 68,834Crossbucks(passive) 5,244Crossbucks(passive) 107Lights only (active) 25,656Lights only(active) 1,362Lights only(active) 326Gates (active) 36,410 Gates (active) 3,728 Gates (active) 320S<strong>to</strong>p Signs 9,905 S<strong>to</strong>p Signs 270 S<strong>to</strong>p Signs 131Special Warning 3,209 Special Warning 93 Special Warning 9Hwy. Traffic Signal 1,269Hwy. TrafficSignal 74Hwy. TrafficSignal 2O<strong>the</strong>r (passive &active) 618O<strong>the</strong>r (passive &active) 7O<strong>the</strong>r (passive &active) 0Unknown 4,843 Unknown 458 Unknown 0Source: Federal Railroad AdministrationSource: TxDOT(1) Mainline tracks onlyTable 6-1: Number of Public At-Grade CrossingsHighway-Rail IncidentsFigure 6-1 illustrates <strong>the</strong> number of highway-rail incidents, including injuries andfatalities, in <strong>the</strong> state of <strong>Texas</strong>, by county, from 2000 <strong>to</strong> 2005. Highway-rail incidentsinclude accidents associated with traffic at highway-rail interfaces, and do notinclude accidents due <strong>to</strong> trespassing on railroad property.Figure 6-1: Highway-rail incidents in <strong>Texas</strong>, 2000-20056 - 2
<strong>San</strong> <strong>An<strong>to</strong>nio</strong> <strong>Region</strong> <strong>Freight</strong> <strong>Study</strong>Rail/Roadway Safety IssuesIn reviewing <strong>the</strong> investigation logs reported <strong>to</strong> <strong>the</strong> Federal Railroad Administration(FRA) for highway-rail incidents within <strong>the</strong> <strong>San</strong> <strong>An<strong>to</strong>nio</strong> region, <strong>the</strong> average trainspeeds were approximately 35 mph while <strong>the</strong> average vehicle speeds wereapproximately 20 mph. The average vehicle damage per incident is approximately$12,000.Tables 6-2 and 6-3 depict, by county within <strong>the</strong> region, <strong>the</strong> number of highway-railincidents annually from 2000 <strong>to</strong> 2005. The ‘Cnt’ value displays <strong>the</strong> number ofaccidents, while <strong>the</strong> ‘Kld’ and ‘Inj’ values display <strong>the</strong> number of people killed andinjured in those accidents, respectively.At Public CrossingAt Private Crossing2000 – 2005Totals Mo<strong>to</strong>r Vehicle O<strong>the</strong>r Mo<strong>to</strong>r Vehicle O<strong>the</strong>rTotalsCnt Kld Inj Cnt Kld Inj Cnt Kld Inj Cnt Kld Inj Cnt Kld InjATASCOSA 5 - 8 4 - 8 - - - 1 - - - - -BEXAR 73 7 35 68 4 34 2 1 1 3 2 - - - -COMAL 9 - 14 7 - 11 - - - 2 - 3 - - -FRIO 8 3 6 7 3 6 - - - 1 - - - - -GUADALUPE 16 - 8 14 - 5 - - - 2 - 3 - - -MEDINA 16 4 6 14 2 3 - - - 2 2 3 - - -UVALDE 1 - 1 - - - - - - 1 - 1 - - -Totals 128 14 78 114 9 67 2 1 1 12 4 10 0 0 -Table 6-2: Highway-Rail Accidents in <strong>the</strong> <strong>San</strong> <strong>An<strong>to</strong>nio</strong> <strong>Region</strong>, 2000-2005(Source: FRA)County 2000 Totals 2001 Totals 2002 Totals 2003 Totals 2004 Totals 2005 TotalsCnt Kld Inj Cnt Kld Inj Cnt Kld Inj Cnt Kld Inj Cnt Kld Inj Cnt Kld InjATASCOSA 2 - 4 1 - - 1 - 3 1 - - - - - - -BEXAR 13 2 7 13 - 4 14 1 5 12 1 14 7 1 2 14 2 3COMAL 3 - 6 1 - - - - - - - - 1 - 1 4 - 7FRIO - - - 2 1 3 1 2 - 2 - 1 1 - 1 2 - 1GUADALUPE 3 - 2 2 - 2 3 - 1 3 - 1 4 - 1 1 - 1MEDINA 1 - 1 2 - - 1 - - 3 3 - 4 - 1 5 1 4UVALDE 1 - 1 - - - - - - - - - - - - - - -Totals 23 2 21 21 1 9 20 3 9 21 4 16 17 1 6 26 3 16Table 6-3: Highway-Rail Accidents in <strong>the</strong> <strong>San</strong> <strong>An<strong>to</strong>nio</strong> <strong>Region</strong>, 2000-2005(Source: FRA)DerailmentsThere were also over 220 derailments within <strong>the</strong> region from 2000 through 2005 4 .Data provided by <strong>the</strong> railroads <strong>to</strong> <strong>the</strong> FRA shows <strong>the</strong> accumulative cost of equipmentand infrastructure damage was over $21 million dollars. Table 6-4 provides a yearlysummary of <strong>the</strong> derailment damage statistics for <strong>the</strong> region.4 Federal Railroad Administration safety statistics6 - 3
<strong>San</strong> <strong>An<strong>to</strong>nio</strong> <strong>Region</strong> <strong>Freight</strong> <strong>Study</strong>Rail/Roadway Safety IssuesYear InstancesTotal Equipment& Track DamageAverage perOccurrenceAve TrainSpeed(mph)TotalLocomotivesDerailedTotal CarsDerailedTotalKilledTotalInjured2005 43 $2,296,536 $53,408 10 3 90 1 72004 43 $10,680,954 $248,394 11 9 169 5 122003 36 $1,639,340 $45,537 8 5 69 0 42002 42 $2,186,384 $52,057 8 8 102 1 22001 46 $3,290,311 $71,529 11 7 135 1 72000 19 $1,153,070 $60,688 16 0 49 0 6Total 229 $21,246,595 $531,612 10.67 32 614 8 38Table 6-4 – Derailment Incidents in <strong>the</strong> <strong>San</strong> <strong>An<strong>to</strong>nio</strong> <strong>Region</strong> (source: FRA)Trespasser IncidentsLastly, according <strong>to</strong> records obtained from <strong>the</strong> FRA, trespasser incidents withinBexar County between 2000 and 2005, which incidentally experienced <strong>the</strong> highestnumber of incidents within <strong>the</strong> region boundaries, are listed in Tables 6-5 through 6-8. Trespasser incidents consist of deaths and injuries caused by pedestrianstrespassing on <strong>to</strong> railroad property, and do not include accidents associated withtraffic at highway-rail interfaces.RailroadTOTALIncidents% ofTotalIncidents per Year2000 2001 2002 2003 2004 20052000<strong>to</strong>20012001<strong>to</strong>2002% Change Over Time2002 2003<strong>to</strong> <strong>to</strong>2003 2004UPRR 61 98.4% 8 14 12 9 8 10 75% -14% -25% -11% 25% 25%Amtrack 1 1.6% 0 1 0 0 0 0 100% -100% 0% 0% 0% 0%Total 62 100% 8 15 12 9 8 10 88% -20% -25% -11% 25% 25%2004<strong>to</strong>2005Table 6-5: Trespasser Incidents in Bexar County by Railroad, 2000-2005(Source: FRA)2000<strong>to</strong>2005Age ofTrespasserTOTALIncidents% ofTotalIncidents per Year2000 2001 2002 2003 2004 20052000 <strong>to</strong>20012001 <strong>to</strong>2002% Change Over Time2002 <strong>to</strong>20032003 <strong>to</strong>20042004 <strong>to</strong>20052000 <strong>to</strong>200516-20 12 19.4% 2 3 2 4 1 0 50.0% -33.3% 100% -75.0% -100% -100%21-25 5 8.1% 2 1 1 0 1 0 -50.0% 0% -100% 100% -100% -100%26-30 12 19.4% 1 3 3 2 1 2 200% 0% -33% -50.0% 100% 100%31-35 6 9.7% 0 1 3 0 0 2 100% 200% -100% 0% 200% 200%36-40 11 17.7% 1 3 1 2 3 1 200% -66.7% 100% 50.0% -67% 0%41-45 4 6.5% 1 0 1 1 1 0 -100% 100% 0% 0.0% -100% -100%46-50 5 8.1% 0 2 0 0 1 2 200% -100% 0% 100% 100% 200%51-55 2 3.2% 1 1 0 0 0 0 0% -100% 0% 0% 0% -100%56-60 2 3.2% 0 0 0 0 0 2 0% 0% 0% 0% 200% 200%61-65 1 1.6% 0 0 0 0 0 1 0% 0% 0% 0% 100% 100%66-70 0 0.0% 0 0 0 0 0 0 0% 0% 0% 0% 0% 0%71-75 1 1.6% 0 0 1 0 0 0 0% 100% -100% 0% 0% 0%Not Given 1 1.6% 0 1 0 0 0 0 100% -100% 0% 0% 0% 0%Total 62 100% 8 15 12 9 8 10 87.5% -20.0% -25.0% -11.1% 25.0% 25.0%Table 6-6: Trespasser Incidents in Bexar County by Age of Trespasser, 2000-2005(source: FRA)6 - 4
<strong>San</strong> <strong>An<strong>to</strong>nio</strong> <strong>Region</strong> <strong>Freight</strong> <strong>Study</strong>Rail/Roadway Safety IssuesEventTOTALIncidents% ofTotalIncidents per Year2000 2001 2002 2003 2004 2005Struck by on-track equipment 44 71.0% 5 10 9 5 7 8 100% -10.0% -44.4% 40.0% 14.3% 60.0%Lost balance 12 19.4% 3 4 3 1 0 1 33.3% -25.0% -66.7% -100% 100% -67%Pushed/shoved from 2 3.2% 0 0 0 2 0 0 0% 0% 200% -100% 0% 0%Climatic condition, exposure <strong>to</strong>env. heat 1 1.6% 0 0 0 0 0 1 0% 0% 0% 0% 100% 100%Struck against object 1 1.6% 0 0 0 1 0 0 0% 0% 100% -100% 0% 0%Caught, crushed, pinched, o<strong>the</strong>r 1 1.6% 0 0 0 0 1 0 0% 0% 0% 100% -100% 0%Slipped, fell, stumbled, o<strong>the</strong>r 1 1.6% 0 1 0 0 0 0 100% -100% 0% 0% 0% 0%TOTAL 62 100% 8 15 12 9 8 10 87.5% -20.0% -25.0% -11.1% 25.0% 25.0%2000 <strong>to</strong>20012001 <strong>to</strong>2002% Change Over Time2002 <strong>to</strong>20032003 <strong>to</strong>2004Table 6-7: Trespasser Incidents in Bexar County by Event, 2000-2005(Source: FRA)2004 <strong>to</strong>20052000 <strong>to</strong>2005TOTALIncidents per YearActivity% ofIncidentsTotal2000 2001 2002 2003 2004 2005Struck by on-track equipment 44 71.0% 5 10 9 5 7 8Crossing over 1 1.6% 1Driving (Mo<strong>to</strong>r vehicle, forklift, etc.) 1 1.6% 1Getting on 1 1.6% 1Laying 12 19.4% 3 2 1 1 3 2Lying down 2 3.2% 1 1Reaching 1 1.6% 1Riding 1 1.6% 1Sitting 5 8.1% 2 1 2Standing 1 1.6% 1Walking 19 30.6% 2 3 5 1 3 5Lost balance 12 19.4% 3 4 3 1 1Climbing over/on 1 1.6% 1Getting off 2 3.2% 1 1Getting on 1 1.6% 1Jumping from 3 4.8% 3Laying 1 1.6% 1Riding 2 3.2% 1 1Sitting 1 1.6% 1Walking 1 1.6% 1O<strong>the</strong>r fac<strong>to</strong>rs 6 9.7% 1 3 1 1Jumping on<strong>to</strong> - slipped, fell, stumbled, o<strong>the</strong>r 1 1.6% 1Riding - caught, crushed, pinched, o<strong>the</strong>r 1 1.6% 1Sitting - climatic condition, exposure <strong>to</strong> env. heat 1 1.6% 1Standing - Struck against object 1 1.6% 1Walking- Pushed/shoved from 2 3.2% 2GRAND TOTAL 62 100% 8 15 12 9 8 10Table 6-8: Trespasser Incidents in Bexar County by Activity, 2000-2005(Source: FRA)According <strong>to</strong> <strong>the</strong> FRA data, Bexar County experienced 62 trespasser incidents and42 highway-rail incidents (from Table 6-2) from 2000 <strong>to</strong> 2005, meaning that <strong>the</strong>county experienced over 100 deaths or injuries over a six year time period.6 - 5
<strong>San</strong> <strong>An<strong>to</strong>nio</strong> <strong>Region</strong> <strong>Freight</strong> <strong>Study</strong>Rail/Roadway Safety IssuesIncidents SummaryThe statistics shown in <strong>the</strong> previous tables, however, only show a moderatereduction in most categories between 2000 through 2005. A combination ofpopulation increases, <strong>the</strong> number of people traveling on <strong>the</strong> roadway network, andan increase in <strong>the</strong> number of freight trains traveling through densely populatedlocales, increases <strong>the</strong> exposure rate of <strong>the</strong> highway/rail interface, stressing <strong>the</strong>importance of a more proactive approach <strong>to</strong> minimizing hazards associated with <strong>the</strong>movement of freight.The partnerships developed between <strong>the</strong> State of <strong>Texas</strong>, TxDOT, Bexar County and<strong>the</strong> remaining 11 counties comprising <strong>the</strong> <strong>San</strong> <strong>An<strong>to</strong>nio</strong> region, along with <strong>the</strong> City of<strong>San</strong> <strong>An<strong>to</strong>nio</strong> and <strong>the</strong> two Class I freight railroads are working for <strong>the</strong> collective goodof <strong>the</strong> freight industry and <strong>the</strong> traveling public <strong>to</strong> continue striving for no incidents, noderailments, no accidents, and ultimately no fatalities.Hazardous Materials MovementThe amount (<strong>to</strong>nnage) of hazardous materials moved via rail and truck alongselected corridors within <strong>the</strong> <strong>San</strong> <strong>An<strong>to</strong>nio</strong> region was identified for <strong>the</strong> followingcorridors :‣ IH 10 East of IH 35‣ IH 10 West of IH 35‣ IH 35 North of IH 10‣ IH 35 South of IH 10The rail <strong>to</strong>nnage movement was determined based on existing SurfaceTransportation Board (STB) data for hazardous materials. The future rail <strong>to</strong>nnageswere determined based on projected growth as calculated in <strong>the</strong> SAM.The truck <strong>to</strong>nnage movement of hazardous materials was not specifically accountedfor in <strong>the</strong> 1998 Reebie data. Therefore, it was necessary <strong>to</strong> develop a methodology<strong>to</strong> calculate existing and projected truck <strong>to</strong>nnages carrying hazardous materials for<strong>the</strong>se corridors. The methodology began by determining <strong>the</strong> number of trucks on<strong>the</strong> specific corridors from existing vehicle classification counts performed by TxDOTwith <strong>the</strong> <strong>San</strong> <strong>An<strong>to</strong>nio</strong> District. Future growth was determined on projections ascalculated in <strong>the</strong> SAM.A literature review was performed in order <strong>to</strong> develop a reasonable percentage oftruck traffic along <strong>the</strong>se corridors that would carry hazardous materials. While arange of trucks carrying hazardous cargo were found on various corridors within <strong>the</strong>country, a report of national statistics prepared for <strong>the</strong> Federal HighwayAdministration showed a national average of 7 percent. Data was not found thatspecifically mentioned <strong>the</strong> corridors for this analysis. However, <strong>the</strong> national averageof 7 percent reported was in <strong>the</strong> range of percentages found through <strong>the</strong> literaturereview. Therefore, it was assumed that an average of 7 percent of trucks along<strong>the</strong>se corridors would carry hazardous cargo.6 - 6
<strong>San</strong> <strong>An<strong>to</strong>nio</strong> <strong>Region</strong> <strong>Freight</strong> <strong>Study</strong>Rail/Roadway Safety IssuesOnce <strong>the</strong> number of trucks carrying hazardous cargo was calculated, a conversion<strong>to</strong> <strong>the</strong> amount of <strong>to</strong>nnage was performed. The conversion <strong>to</strong> annual truck <strong>to</strong>ns wasperformed using a range of occupancy. The range assumed that <strong>the</strong> cargo occupiedbetween 50 and 100 percent of <strong>the</strong> trailers. The results of <strong>the</strong> analysis for eachcorridor are shown in Table 6-9.CorridorIH 10 Eas<strong>to</strong>f IH 35IH 10 Wes<strong>to</strong>f IH 35IH 35 Northof IH 10Annual Rail TonnageCarrying HazardousMaterialsAverage DailyTruck VolumeCarryingHazardousMaterialsAnnual Truck Tonnage Carrying HazardousMaterials2004 2025 2004 2025 2004 2025330,000 752,000 792 1,400 3,548,000 - 6,653,000 6,272,000 - 11,760,000N/A N/A 576 1,018 2,580,000 - 4,838,000 4,562,000 - 8,553,000877,000 1,998,000 1,440 2,546 6,451,000 - 12,096,000 11,404,000 - 21,383,000IH 35 Southof IH 10161,000 367,000 504 891 2,258,000 - 4,234,000 3,991,000 - 7,484,000Table 6-9: Hazardous Cargo Movement within <strong>the</strong> <strong>San</strong> <strong>An<strong>to</strong>nio</strong> <strong>Region</strong>6 - 7
<strong>San</strong> <strong>An<strong>to</strong>nio</strong> <strong>Region</strong> <strong>Freight</strong> <strong>Study</strong>Alternatives AnalysisSECTION 7: ALTERNATIVES ANALYSISThis report is intended <strong>to</strong> provide <strong>the</strong> <strong>San</strong> <strong>An<strong>to</strong>nio</strong> region with an examination of <strong>the</strong>constraints within <strong>the</strong> region, and a list of potential solutions from which <strong>the</strong> localgoverning agencies may choose <strong>to</strong> analyze in greater detail or move forward<strong>to</strong>wards implementation. Possible improvements include a new railroad corridor(bypass), roadway-rail grade separations and crossing closures, and improvements<strong>to</strong> <strong>the</strong> existing railroad infrastructure. Improvements <strong>to</strong> <strong>the</strong> existing rail network mayprovide operational benefits <strong>to</strong> <strong>the</strong> railroads and could also benefit future commuterrail operations if <strong>the</strong>y were implemented in conjunction with a bypass. However,some issues of public concern (such as <strong>the</strong> movement of hazardous materialsthrough urban areas via rail or environmental justice issues) would not be fullymediated by improvements <strong>to</strong> <strong>the</strong> existing system.Improvements identified for analysis were based on <strong>the</strong> results of both freight railoperations modeling (RTC) and truck freight movement modeling (SAM) intended <strong>to</strong>improve freight movement efficiency. Additional improvements and/orrecommendations were received from various discussions with stakeholder groups,such as <strong>the</strong> UP, <strong>the</strong> BNSF Railway Company, <strong>the</strong> Austin-<strong>San</strong> <strong>An<strong>to</strong>nio</strong> IntermunicipalCommuter Rail District, <strong>the</strong> Port Authority of <strong>San</strong> <strong>An<strong>to</strong>nio</strong>, <strong>the</strong> <strong>San</strong> <strong>An<strong>to</strong>nio</strong>Transportation Association, <strong>the</strong> <strong>San</strong> <strong>An<strong>to</strong>nio</strong> Mobility Coalition, <strong>the</strong> <strong>San</strong> <strong>An<strong>to</strong>nio</strong>Chamber of Commerce, and discussions with Mayor Hardberger and Bexar CountyJudge Nelson Wolff.A variety of possible improvements from <strong>the</strong> sources previously mentioned wereanalyzed <strong>to</strong> determine <strong>the</strong> effects on efficiency, mobility, and safety for railoperations, as well as vehicular and pedestrian traffic in <strong>the</strong> region. This analysisincluded identifying <strong>the</strong> existing conditions, estimating <strong>the</strong> implementation cost andtimeframe, and estimating <strong>the</strong> public and private benefits associated with <strong>the</strong> specificimprovements.The existing conditions identified for <strong>the</strong> locations of possible improvements includedescriptions of property land use and estimated value, environmental constraints,traffic flow volumes for both vehicular and rail traffic, and traffic accident statistics.The estimated implementation costs for each improvement are order of magnitudecosts based on preliminary planning. The costs included in this study represent anestimate of probable costs prepared in good faith and with reasonable care. Thestudy team has no control over <strong>the</strong> costs of construction labor, materials, orequipment, nor over competitive bidding or negotiating methods and does not makeany commitment or assume any duty <strong>to</strong> assure that bids or negotiated prices will notvary from <strong>the</strong>se estimates. The costs are subject <strong>to</strong> inflation, and in some cases willbe calculated using current county appraisal district values for right-of-wayacquisition, which may vary significantly from <strong>the</strong> eventual cost of acquiring property.7 - 1
<strong>San</strong> <strong>An<strong>to</strong>nio</strong> <strong>Region</strong> <strong>Freight</strong> <strong>Study</strong>Alternatives AnalysisClassification levels based on estimated implementation timeframes weredetermined for <strong>the</strong> potential improvements and have been grouped in <strong>the</strong> followingcategories:1. Level 1 Improvement - Identified near-term railroad improvements2. Level 2 Improvement - Identified mid-range railroad improvements3. Level 3 Improvement - All grade crossing closures and separations4. Level 4 improvement – Identified long-range improvements such as doubletracking of line segments or adding infrastructure capacity <strong>to</strong> existing linesegments5. Level 5 improvement – Identified long-range improvements such asconsolidations, possible alternative routes or corridors, and major yardrelocationsAnticipated public benefits include reductions in vehicular delay times at existing atgradecrossings, reductions in vehicle and locomotive fuel consumption,improvements in air quality, improvements in public safety, improvements in mobilityfor vehicular and freight traffic due <strong>to</strong> changes in train operations fromimprovements, reductions in noise and vibration from rerouting of trains, andimproved freight mobility from more efficient routes.The estimated public benefits were determined by using a grade crossing“impedance” or delay model which takes in<strong>to</strong> account <strong>the</strong> volume and frequency ofvehicular and train traffic at roadway-rail grade crossings, estimating <strong>the</strong> amount oftime mo<strong>to</strong>rists are delayed by rail traffic. The model measures <strong>the</strong> anticipated publiccosts (burden) associated with traffic delays and calculates <strong>the</strong> extra emissions andfuel usage experienced while delayed by a train at each of <strong>the</strong> rail crossingsanalyzed. The cost of collisions is added <strong>to</strong> time costs, emissions, and fuel used <strong>to</strong>provide an annualized estimate of <strong>to</strong>tal public burden per grade crossing. Forecastsfor growth in both rail and vehicular traffic will be used <strong>to</strong> provide an annualizedestimate of public costs projected for a 20-year study period. Public benefit valuesfor improvements <strong>to</strong> roadway-rail crossings (grade separating or closing) based oncurrent traffic volumes are organized by railroad subdivision and included inAppendix G.Potential benefits that may be realized by <strong>the</strong> railroads as a result of <strong>the</strong> identifiedimprovements may include improved train operating efficiency (including reductionsin train delays) and improved train run-times, as well as reductions in accidentexposure at roadway-rail crossings.Analysis of private benefits in addition <strong>to</strong> those shown with each planning case isbeyond <strong>the</strong> scope of this study and should be examined in an independentbenefit/cost analysis. The identified potential grade separations and crossingclosures primarily provide benefit <strong>to</strong> <strong>the</strong> public in <strong>the</strong> form of reduced delays andimproved safety, but also may provide a smaller benefit <strong>to</strong> <strong>the</strong> railroads.7 - 2
<strong>San</strong> <strong>An<strong>to</strong>nio</strong> <strong>Region</strong> <strong>Freight</strong> <strong>Study</strong>Alternatives AnalysisAlternatives analyzed in this study consist of rail capacity improvements (possiblebypass routes and improvements <strong>to</strong> existing rail corridors) as well as roadwayrailroadcrossing improvements (grade separations and crossing closures).Additionally, possible bypass routes were studied as part of an independent study,<strong>the</strong> results of which are discussed as follows.Central <strong>Texas</strong> Rail RelocationOn Oc<strong>to</strong>ber 16, 2006, Bexar County Judge Nelson Wolff, in his “State of <strong>the</strong> County”address given <strong>to</strong> <strong>the</strong> <strong>San</strong> <strong>An<strong>to</strong>nio</strong> Chamber of Commerce, stated:“We are presently working on a <strong>San</strong> <strong>An<strong>to</strong>nio</strong> Rail Master Plan that willdivert rail freight traffic out of <strong>the</strong> city center and along Highway 35leading <strong>to</strong> Austin. This is essential for <strong>the</strong> long term safety of ourcitizens and continued economic development of our region.”In support of Judge Wolff’s commentary, <strong>the</strong> study team completed an independentstudy titled <strong>the</strong> “Central <strong>Texas</strong> Rail Relocation <strong>Study</strong>” (CTRN) of a possiblealignment for relocating through-freight rail services from UP’s existing AustinSubdivision. The concept provides for <strong>the</strong> relocation of through-freight rail services<strong>to</strong> a new route from Taylor <strong>to</strong> Seguin, where it would connect <strong>to</strong> a <strong>San</strong> <strong>An<strong>to</strong>nio</strong>bypass from Seguin <strong>to</strong> <strong>the</strong> southwest portion of <strong>San</strong> <strong>An<strong>to</strong>nio</strong> as shown in Figure 7-1.The basic premise of <strong>the</strong> <strong>San</strong> <strong>An<strong>to</strong>nio</strong> bypass is <strong>to</strong> determine <strong>the</strong> feasibility ofrelocating through-freight trains from <strong>the</strong> <strong>San</strong> <strong>An<strong>to</strong>nio</strong> metropolitan area. Asignificant volume of <strong>the</strong> rail freight moving in<strong>to</strong> and/or out of <strong>San</strong> <strong>An<strong>to</strong>nio</strong> does no<strong>to</strong>riginate or terminate <strong>the</strong>re; but is only in <strong>San</strong> <strong>An<strong>to</strong>nio</strong> <strong>to</strong> be switched or classifiedin<strong>to</strong> ano<strong>the</strong>r train destined elsewhere, or for movement on<strong>to</strong> ano<strong>the</strong>r mainline thattraverses <strong>the</strong> <strong>San</strong> <strong>An<strong>to</strong>nio</strong> area.The alignment of a <strong>San</strong> <strong>An<strong>to</strong>nio</strong> bypass would fall within <strong>the</strong> general footprint of <strong>the</strong>proposed TTC alignment. Figure 7-1 shows <strong>the</strong> new rail connection in <strong>the</strong> Taylorarea, while <strong>the</strong> proposed TTC alignment is fur<strong>the</strong>r west near Hut<strong>to</strong>. The connectionof <strong>the</strong> possible bypass with <strong>the</strong> Corpus Christi Subdivision is also represented within<strong>the</strong> TTC alignment. This potential routing south of <strong>San</strong> <strong>An<strong>to</strong>nio</strong> is intended <strong>to</strong>complete a connection with <strong>the</strong> UP intermodal facility south and west of <strong>the</strong> city and<strong>the</strong> Laredo and Del Rio Subdivisions near Macdona.This possible bypass would connect UP’s Glidden Subdivision (east of <strong>San</strong> <strong>An<strong>to</strong>nio</strong>)with <strong>the</strong>ir Rockport, Corpus Christi, Laredo, and Del Rio Subdivisions (southwest of<strong>San</strong> <strong>An<strong>to</strong>nio</strong>) via a possible bypass around <strong>the</strong> sou<strong>the</strong>rn portion of <strong>the</strong> metropolitanarea. The connection with <strong>the</strong> Rockport Subdivision would require an extension of<strong>the</strong> existing line from Elmendorf <strong>to</strong>wards Kenedy on <strong>the</strong> abandoned Sou<strong>the</strong>rn Pacificright-of-way.The maps included with this report depict possible alignments and/or facilities forillustrative purposes only <strong>to</strong> assist in general comprehension of <strong>the</strong> possible7 - 3
<strong>San</strong> <strong>An<strong>to</strong>nio</strong> <strong>Region</strong> <strong>Freight</strong> <strong>Study</strong>Alternatives Analysisalternatives and issues discussed. These alternatives do not represent anyproposed location or planned alignment for <strong>the</strong> relocation of freight rail services.These possible alternatives were necessary in order <strong>to</strong> obtain “ballpark” estimates ofmileage, necessary bridge structures, highway-rail grade separations, earthwork,etc. so that order of magnitude costs could be developed for comparison purposes.Precise planned or proposed alternative alignments can only be identified during <strong>the</strong>NEPA environmental process, which is not a part of this study or report.Figure 7-1: <strong>San</strong> <strong>An<strong>to</strong>nio</strong> <strong>Region</strong> Railroad Subdivisions and Possible BypassLocations7 - 4
<strong>San</strong> <strong>An<strong>to</strong>nio</strong> <strong>Region</strong> <strong>Freight</strong> <strong>Study</strong>Alternatives AnalysisThis bypass would provide east-west and north-south connectivity through a looparound <strong>San</strong> <strong>An<strong>to</strong>nio</strong> that relocates and links all of UP’s mainlines outside <strong>the</strong>metropolitan area. The east-west and north-south connectivity currently occurswithin <strong>the</strong> city of <strong>San</strong> <strong>An<strong>to</strong>nio</strong> and must be alternately provided in order <strong>to</strong> relocatethrough-freight services <strong>to</strong> an alternate alignment. Trains <strong>to</strong> and from <strong>the</strong> northcould be relocated from <strong>the</strong> Austin Subdivision <strong>to</strong> a new Taylor/Seguin direct routealignment, connecting with a <strong>San</strong> <strong>An<strong>to</strong>nio</strong> bypass near Seguin or an upgrade AustinSubdivision ML 2.The study team also identified <strong>the</strong> need for new facilities if a bypass wereconstructed <strong>to</strong> provide for <strong>the</strong> diversion of freight car classification operations,fueling, servicing, repairs, re-crews, intermodal transfers, etc. These operations arecurrently performed at So<strong>San</strong>, East, and Kirby Yards, which are within <strong>the</strong> <strong>San</strong><strong>An<strong>to</strong>nio</strong> metropolitan area. Implementing replacement facilities along <strong>the</strong> possiblebypass route would potentially relocate all through-freight services from <strong>the</strong> east,west, and south (as well as train classification movements) from within <strong>the</strong> <strong>San</strong><strong>An<strong>to</strong>nio</strong> urban area.The relocation of <strong>San</strong> <strong>An<strong>to</strong>nio</strong>’s yard operations <strong>to</strong> a new location(s) presentssignificant challenges from an engineering and operational perspective, as well aspossible environmental impacts. It is estimated that approximately 70 <strong>to</strong> 75 percen<strong>to</strong>f <strong>the</strong> trains moving in<strong>to</strong>/out of <strong>San</strong> <strong>An<strong>to</strong>nio</strong> are “worked” at So<strong>San</strong> Yard, locatednear Kelly USA. East Yard is primarily used as an industrial service yard for localand regional cus<strong>to</strong>mers. North-south trains terminating in <strong>San</strong> <strong>An<strong>to</strong>nio</strong> <strong>the</strong>reforetypically do so at East Yard, located north of <strong>the</strong> Alamo Dome and <strong>the</strong> AmtrakStation. Kirby Yard, located east of <strong>San</strong> <strong>An<strong>to</strong>nio</strong> near Kirby, is a crew change pointas well as in-line fueling facility. Kirby Yard is also equipped for unloading au<strong>to</strong>racks and provides some local service.In order <strong>to</strong> optimize <strong>the</strong> efficiencies of new yard facilities, <strong>the</strong> study team determinedthat it would be preferable <strong>to</strong> construct one such facility <strong>to</strong>ward <strong>the</strong> western end of<strong>the</strong> possible <strong>San</strong> <strong>An<strong>to</strong>nio</strong> bypass; potentially at or near UP’s new intermodal facilitylocated between <strong>the</strong> Del Rio and Laredo Subdivisions near I-35. 1 This locationcould serve as a main line fueling facility and crew exchange point for through-freigh<strong>to</strong>perations and handle typical mechanical department operations for that area.Ano<strong>the</strong>r yard facility may be necessary on <strong>the</strong> eastern end of <strong>the</strong> alignmentpotentially near Marion and could be used for train make-up for <strong>the</strong> <strong>San</strong> <strong>An<strong>to</strong>nio</strong>area, <strong>the</strong>reby potentially reducing traffic entering East Yard for that same purpose. Afacility at Marion could provide <strong>the</strong> operational logistics as a staging area for localtrains, a crew exchange point, and a locomotive fueling facility. Located nor<strong>the</strong>ast of1 <strong>San</strong> <strong>An<strong>to</strong>nio</strong>, <strong>Texas</strong>, November 29, 2006 – UP <strong>to</strong>day announced a preliminary layout design of itsnew $90 million state-of-<strong>the</strong>-art intermodal terminal in Southwest Bexar County. The design willprovide truck and au<strong>to</strong> access and egress points at Interstate 35.7 - 5
<strong>San</strong> <strong>An<strong>to</strong>nio</strong> <strong>Region</strong> <strong>Freight</strong> <strong>Study</strong>Alternatives Analysis<strong>San</strong> <strong>An<strong>to</strong>nio</strong>, mixed freight trains could be routed <strong>to</strong> this location, reducing trafficthrough <strong>the</strong> city, with freight cars separated for local delivery.The study team also investigated <strong>the</strong> feasibility of connecting a <strong>San</strong> <strong>An<strong>to</strong>nio</strong> bypass<strong>to</strong> <strong>the</strong> existing Austin Subdivision, in <strong>the</strong> event that <strong>the</strong> Taylor <strong>to</strong> Seguin direct routeis not implemented. This information was provided in <strong>the</strong> prior CTRN report, in whichtwo possible alignments were identified that would connect <strong>the</strong> Austin Subdivision <strong>to</strong><strong>the</strong> Glidden Subdivision. One possible alignment would connect with <strong>the</strong> GliddenSubdivision just west of Marion and traverse northward <strong>to</strong> connect with <strong>the</strong> AustinSubdivision ML 2 south of New Braunfels. The second possible alignment wouldconnect with <strong>the</strong> Glidden Subdivision on <strong>the</strong> Seguin north possible bypass andtraverse northward <strong>to</strong> a connection with <strong>the</strong> Austin Subdivision north of NewBraunfels.The study team has determined that a <strong>San</strong> <strong>An<strong>to</strong>nio</strong> bypass may be feasible with <strong>the</strong>incorporation of ancillary railroad items such as, but not limited <strong>to</strong>, yard facilities,train crew accommodations, in-line fueling facilities, and maintenance facilities thatare intended <strong>to</strong> replace those currently located on <strong>the</strong> existing rail lines. Althoughsuch a bypass has shown <strong>to</strong> have an increase in <strong>the</strong> overall mileage trains musttravel, and <strong>the</strong> associated operating expenses, <strong>the</strong>re also appears <strong>to</strong> be an increasein <strong>the</strong> operating benefits <strong>to</strong> <strong>the</strong> railroad in terms of increased efficiencies, reducedmeet/pass interference, increased train speeds, and more importantly, <strong>the</strong> potentialfor an increase in rail line capacity permitting future growth. However, <strong>the</strong> <strong>San</strong><strong>An<strong>to</strong>nio</strong> bypass on it's own merit does not present an ideal benefit/cost ratio in termsof both <strong>the</strong> public and private benefits associated with this possible alternative.Connectivity <strong>to</strong> a possible bypass of <strong>the</strong> Austin area (via a direct Seguin <strong>to</strong> Taylorroute) has demonstrated a substantial increase in private benefits, and with <strong>the</strong>additional reduction of through-freight trains passing through <strong>the</strong> heart of <strong>San</strong><strong>An<strong>to</strong>nio</strong>, a significant public benefit <strong>to</strong> <strong>the</strong> <strong>San</strong> <strong>An<strong>to</strong>nio</strong> metropolitan area.The task of relocating through-freight operations along <strong>the</strong> Austin Subdivision wouldbe a significant undertaking; however, it could be completed incrementally byupgrading certain sections while constructing new alignments, although suchphasing may not be supported by UP. The added benefits that may be provided <strong>to</strong><strong>the</strong> traveling public in terms of increased safety and providing avenues oftransportation alternatives may warrant <strong>the</strong> expense.The potential public benefits associated with <strong>the</strong> relocation of through-freight railservices in <strong>the</strong> corridor could include:‣ Reductions in public exposure at roadway-rail crossings (vehicular delay,accidents, horn noise) by moving <strong>the</strong> route outside of <strong>the</strong> Austin and <strong>San</strong><strong>An<strong>to</strong>nio</strong> metro areas and o<strong>the</strong>r communities including Taylor, Elgin, Bastrop,Lockhart, and <strong>San</strong> Marcos,‣ Reductions in hazardous materials movements within urban areas,7 - 6
<strong>San</strong> <strong>An<strong>to</strong>nio</strong> <strong>Region</strong> <strong>Freight</strong> <strong>Study</strong>Alternatives Analysis‣ Improvements <strong>to</strong> air quality from reductions in vehicular idling and reducedlocomotive operations,‣ Reductions in fuel usage for vehicular traffic,‣ Improvements in economic development opportunities, and‣ Possible implementation of commuter rail services in <strong>the</strong> existing corridor.Potential benefits <strong>to</strong> UP could include:‣ Reductions in train accident exposure at highway-rail grade crossings,‣ Possible increases in freight rail capacity,‣ Improvements in train operating efficiency along <strong>the</strong> new route,‣ Possibility of <strong>the</strong> railroad <strong>to</strong> “grow business” due <strong>to</strong> possible increases incapacity,‣ Short term reductions in maintenance expenses on <strong>the</strong> newly constructedalignments, and‣ Reductions in Total Central Curve Angle which may correlate <strong>to</strong> reductions inwear and tear on locomotives, rolling s<strong>to</strong>ck, roadbed, track and structures.Identified Infrastructure ImprovementsImprovements identified in this study for <strong>the</strong> 12-county <strong>San</strong> <strong>An<strong>to</strong>nio</strong> regioncomprised of Atascosa, Bandera, Bexar, Comal, Frio, Guadalupe, Kendall, Kerr,McMullen, Medina, Uvalde, and Wilson Counties are categorized as:‣ Grade crossing improvements consisting of grade separations (bridges <strong>to</strong>separate <strong>the</strong> streets from <strong>the</strong> railroad) and grade crossing closings (closingand rerouting <strong>the</strong> street at <strong>the</strong> intersection with <strong>the</strong> railroad)‣ Railroad infrastructure improvements <strong>to</strong> existing railroad infrastructure <strong>to</strong>improve capacity and connectivity on existing rail lines‣ Possible railroad bypass alternatives (<strong>the</strong> relocation of through-freight trains<strong>to</strong> new rail corridors)Grade Crossing ImprovementsThe study team analyzed at-grade crossings in <strong>the</strong> region and evaluated <strong>the</strong>crossings based on roadway and rail alignments, vehicular and train traffic counts,and crossing accident information.Every crossing in <strong>the</strong> region has not been evaluated; ra<strong>the</strong>r <strong>the</strong> analysis of gradecrossings was limited <strong>to</strong> those locations which <strong>the</strong> traffic data analysis (averagetraffic volumes of vehicles and trains) and RTC modeling results warranted fur<strong>the</strong>rreview. There are multiple crossings initially identified as candidates for gradeseparations or closures that may remain at-grade due <strong>to</strong> lower vehicular trafficvolumes and/or an excessive additional travel distance required <strong>to</strong> reroute traffic.The identification of grade separations or closures should not be misconstrued as afinal listing, but ra<strong>the</strong>r as a list of improvements that may ultimately require additionalanalysis and additions as well.7 - 7
<strong>San</strong> <strong>An<strong>to</strong>nio</strong> <strong>Region</strong> <strong>Freight</strong> <strong>Study</strong>Alternatives AnalysisGrade separations consist of roadway overpasses and underpasses that separatevehicular traffic from rail traffic, minimizing <strong>the</strong> safety exposure associated with <strong>the</strong>roadway/rail interface. The number of roadways, estimated costs and associatedpublic benefits identified as potential grade separations is provided in Table 7-1.The potential grade separations are listed individually with supporting detail such aslocation, AADT, number of crossing accidents within <strong>the</strong> past five years, estimatedcost, public benefit, and benefit/cost ratios in Appendix G. All potential gradeseparations are classified as level 3 improvements and may be ranked by <strong>the</strong> ratioof estimated public benefit <strong>to</strong> <strong>the</strong> estimated cost of implementation.RailroadSubdivisionNumber ofIdentified GradeSeparationsEstimated CostEstimatedPublic Benefit(20-year)Ratio:Benefit/Cost(20-year)Austin ML-1 21 $ 267,900,000 $ 290,020,000 1.08Austin ML-2 10 $ 177,800,000 $ 74,910,000 0.42Corpus Christi 9 $ 84,200,000 $ 39,980,000 0.47Del Rio 11 $ 126,300,000 $ 218,800,000 1.73Glidden 8 $ 165,900,000 $ 103,080,000 0.62Laredo 7 $ 101,700,000 $ 60,560,000 0.60Total: 66 $ 923,800,000 $ 787,350,000 0.85Table 7-1: Summary of Potential Grade SeparationsA breakdown of <strong>the</strong> order of magnitude cost estimates and <strong>the</strong> estimated associatedpublic benefits are included in Appendix C and Appendix G, respectively.Crossing closures consist of closing a roadway at <strong>the</strong> point where <strong>the</strong> roadwaytraverses <strong>the</strong> railroad. A crossing closure may require an alternate route forvehicular through-traffic. Crossing closures minimize <strong>the</strong> safety hazards associatedwith <strong>the</strong> vehicle/train interface; however, only crossing closures that would redirecttraffic <strong>to</strong> a grade separated structure include <strong>the</strong> calculated associated publicbenefits. A list of crossings identified for potential closure is provided in Table 7-2,with supporting detail such as location, AADT, number of crossing accidents within<strong>the</strong> past five years, estimated cost, public benefit, and benefit/cost ratios listed inAppendix G. All potential crossing closures are classified as level 3 improvementsand may be ranked by <strong>the</strong> ratio of estimated public benefit <strong>to</strong> <strong>the</strong> estimated cost ofimplementation.7 - 8
<strong>San</strong> <strong>An<strong>to</strong>nio</strong> <strong>Region</strong> <strong>Freight</strong> <strong>Study</strong>Alternatives AnalysisRailroad SubdivisionNumber of IdentifiedCrossing ClosuresTotal EstimatedCostEstimatedPublic Benefit(20-year)Ratio:Benefit/Cost(20-year)Austin ML-1 26 $ 1,300,000 $ 18,480,000 14.22Austin ML-2 4 $ 200,000 $ 5,550,000 27.75Corpus Christi 3 $ 150,000 $ 1,000,000 6.67Del Rio 21 $ 1,050,000 $ 53,980,000 51.41Glidden 2 $ 100,000 $ 440,000 4.40Laredo 9 $ 450,000 $ 9,400,000 20.89Total: 65 $ 3,250,000 $ 88,850,000 27.34Table 7-2: Potential Crossing ClosuresA breakdown of <strong>the</strong> order of magnitude cost estimates and <strong>the</strong> estimated associatedpublic benefits are included in Appendix C and Appendix G, respectively.Railroad ImprovementsRail capacity enhancements foster <strong>the</strong> economic growth of <strong>the</strong> region by improving<strong>the</strong> efficiency of freight rail operations as well as minimizing disturbance <strong>to</strong> residentsof <strong>the</strong> region. Providing additional rail capacity relieves congestion along <strong>the</strong> railcorridors and allows trains <strong>to</strong> pass through <strong>the</strong> region more quickly. Examples of railcapacity enhancements are listed as follows:‣ Adding a mainline track‣ Adding switches and passing sidings at strategic locations <strong>to</strong> allow trains <strong>to</strong>pass one ano<strong>the</strong>r or <strong>to</strong> idle without causing delays‣ Expanding rail yard capacity‣ Constructing connections from one rail line <strong>to</strong> ano<strong>the</strong>r <strong>to</strong> improve rail trafficmobility‣ Relocating rail yard and/or intermodal facilities‣ Relocating through-freight rail traffic on<strong>to</strong> new alignments (bypass routes)Any improvements <strong>to</strong> rail capacity or network efficiency within <strong>the</strong> <strong>San</strong> <strong>An<strong>to</strong>nio</strong> areacould impact <strong>the</strong> regional rail network as well. To fully understand and quantify <strong>the</strong>impact of proposed improvements, <strong>the</strong> identified improvements (which may bedeemed local <strong>to</strong> <strong>the</strong> <strong>San</strong> <strong>An<strong>to</strong>nio</strong> area) must also be viewed in perspective <strong>to</strong> <strong>the</strong>overall rail network as modeled. The improvements in and around <strong>the</strong> study areamay have a direct impact on inbound and outbound rail freight movements within <strong>the</strong>study area and beyond. Consequently, <strong>the</strong> analysis of rail infrastructureimprovements must be regional in nature, with detail given <strong>to</strong> <strong>the</strong> immediate <strong>San</strong><strong>An<strong>to</strong>nio</strong> area.RTC modeling results indicated that significant delays occur in <strong>the</strong> <strong>San</strong> <strong>An<strong>to</strong>nio</strong> areaeast of Kirby Yard on <strong>the</strong> Glidden Subdivision and at Tower 112 on <strong>the</strong> Del RioSubdivision, located southwest of Kirby Yard. The greatest number of dispatchingconflicts was shown <strong>to</strong> occur on <strong>the</strong> Austin Subdivision ML 1 between <strong>San</strong> <strong>An<strong>to</strong>nio</strong>and Adams and on <strong>the</strong> Kerrville Subdivision between Tower 112 and ApacheJunction.7 - 9
<strong>San</strong> <strong>An<strong>to</strong>nio</strong> <strong>Region</strong> <strong>Freight</strong> <strong>Study</strong>Alternatives AnalysisThere has been some improvement <strong>to</strong> <strong>the</strong> delays experienced at Apache Junctionwith <strong>the</strong> implementation of <strong>the</strong> new Comal Street bypass. Until August 2006, <strong>the</strong>Kerrville Subdivision ran in a sou<strong>the</strong>rly direction down <strong>the</strong> middle of S. Comal Streetnear <strong>the</strong> Bexar County Jail, crossing Commerce, Buena Vista, Matamoros, El Paso,and Guadalupe Streets as well as several smaller streets prior <strong>to</strong> crossing <strong>the</strong> AustinSubdivision ML 1 at-grade with a crossing diamond at Apache Junction. There wasno direct route in<strong>to</strong> <strong>San</strong> Fernando Yard, located one block east of <strong>the</strong> KerrvilleSubdivision, and southbound trains were required <strong>to</strong> cross at Apache Junction and<strong>the</strong>n reverse in<strong>to</strong> <strong>the</strong> yard. The Comal Street bypass alignment removed this portionof <strong>the</strong> Kerrville Subdivision track starting in <strong>the</strong> vicinity of Comal and Morales Streetsat <strong>the</strong> north end. This created a direct connection on<strong>to</strong> <strong>the</strong> Austin Subdivision ML 1and <strong>the</strong> north end of <strong>San</strong> Fernando Yard, eliminating <strong>the</strong> crossing diamond atApache Junction and <strong>the</strong> reverse moves at Tower 112.Additionally, rail infrastructure enhancements, geared <strong>to</strong>ward accommodating <strong>the</strong>increase in train volumes, are currently being undertaken by <strong>the</strong> railroads<strong>the</strong>mselves, and will be discussed later in this section.However, improvements within <strong>the</strong> <strong>San</strong> <strong>An<strong>to</strong>nio</strong> area alone may not provide <strong>the</strong>regional relief necessary <strong>to</strong> consistently maintain fluid train movements through <strong>the</strong>entire region, hence <strong>the</strong> need <strong>to</strong> consider improvements that extend beyond <strong>San</strong><strong>An<strong>to</strong>nio</strong> <strong>to</strong> Macdona, <strong>San</strong> Marcos, Lockhart, Austin, Taylor, and Hearne.A list of potential improvements <strong>to</strong> <strong>the</strong> existing rail network is provided in Table 7-3,along with estimated costs and identified improvement classifications (near-, mid-, orlong-range). The improvements are targeted at improving <strong>the</strong> operation of traintraffic, with forecasted growth, and may have long lasting effects on <strong>the</strong> movemen<strong>to</strong>f freight through <strong>the</strong> region. None of <strong>the</strong>se improvements have been constructednor are currently under construction. Order of magnitude estimates for <strong>the</strong> identifiedrail improvements are included in Appendix D.7 - 10
<strong>San</strong> <strong>An<strong>to</strong>nio</strong> <strong>Region</strong> <strong>Freight</strong> <strong>Study</strong>Alternatives AnalysisImprovement28RailroadSubdivisionWaco <strong>to</strong>Austin ML-1EstimatedCostClassificationLevel$ 1,340,000 1Total: $183,420,000Description of Work1 Del Rio $6,520,000 4Construct second mainline Alamo Jct. <strong>to</strong> Wi<strong>the</strong>rsJct.Construct a second mainline and switches on <strong>the</strong>2 Del Rio $ 6,460,000 4 Del Rio Subdivision between East Yard and KirbyYard milepost 203.5 <strong>to</strong> 201.43 Corpus Christi $ 5,340,000 4Construct a 9000’ siding track and switchesadjacent <strong>to</strong> <strong>the</strong> Corpus Christi Subdivision near<strong>the</strong> lead track <strong>to</strong> <strong>the</strong> Toyota Facility4Lockhart <strong>to</strong>Construct new connection track between Austin$ 880,000 1Austin ML-1ML1 and Lockhart Subdivisions in <strong>San</strong> Marcos.5Extend <strong>the</strong> new second mainline of <strong>the</strong> Del RioDel Rio <strong>to</strong>$ 3,370,000 1 Subdivision at milepost 201.40 one mile north <strong>to</strong>Glidden“Seven States Corporate Park”Construct new switches on <strong>the</strong> Del Rio6 Del Rio $ 1,310,000 1 Subdivision near Quintana Road for a proposedconnection in<strong>to</strong> <strong>the</strong> north end of So<strong>San</strong> Yard7 Corpus Christi $ 25,190,000 4Extend <strong>the</strong> new Mauermann Siding north andsouth as a second mainline <strong>to</strong> So<strong>San</strong> YardConstruct new Laredo Subdivision mainline track8 Laredo $ 2,740,000 4 approximately 1.0 miles from So<strong>San</strong> Yard west <strong>to</strong>Heafer JunctionConstruct new connections in <strong>the</strong> nor<strong>the</strong>ast and9Austin ML-1 <strong>to</strong>northwest quadrants of <strong>the</strong> Austin ML-1 and Del$ 3,000,000 1Del RioRio Subdivision diamond south of <strong>San</strong> FernandoYard and Apache Jct.10 Austin ML-2 $ 6,190,000 4Extend and connect Fratt and Remount Au<strong>to</strong>Facility sidings <strong>to</strong> join Austin ML-211 Austin ML-1 $ 5,020,000 4Extend Hestes and Hut<strong>to</strong> sidings (Austin ML 1,south of Taylor) <strong>to</strong> just over 2 miles in length12 Austin ML-1 $ 6,080,000 4Extend Landas Park siding (Austin ML-1) <strong>to</strong> alength of 2.9 miles13 Austin ML-1 $ 4,480,000 4Extend and connect both North Loop and Adamssidings (Austin ML-1) <strong>to</strong> create a 3.74 mile longpassing siding14 Laredo $ 6,010,000 4Upgrade/extend Pearsall s<strong>to</strong>rage track (LaredoSub.) <strong>to</strong> a 2.9 mile siding15 Glidden $ 4,910,000 4Upgrade/extend Converse s<strong>to</strong>rage track (GliddenSub. East of Kirby Yard) <strong>to</strong> a 2 mile long siding16Lockhart <strong>to</strong>Install full CTC between Taylor, Smithville, and$ 21,670,000 4Waco<strong>San</strong> Marcos17 Austin ML-1 $ 8,620,000 4Siding upgrades between Round Rock and <strong>San</strong><strong>An<strong>to</strong>nio</strong> <strong>to</strong> provide sufficient locations for trainmeets (7 locations)18 Austin ML-1 $ 900,000 1Upgrade Austin ML-1 sidings <strong>to</strong> CTC at Adams,Landas Park, <strong>Texas</strong> Lehigh, Buda, Austin, McNeiland White Lime19 Del Rio $ 6,040,000 4Construct an additional Del Rio Sub-division maintrack west and adjacent <strong>to</strong> <strong>the</strong> Del Rio Subdivision<strong>to</strong> Macdona20 Lockhart $ 5,040,000 4 Construct one new siding west of Lockhart21 Lockhart $ 10,080,000 2Upgrades <strong>to</strong> Lockhart (curve modifications andline swings)22 Lockhart $ 15,060,000 4Construct 3 new sidings between Lockhart andSmithville23 Waco $ 9,620,000 4Construct 2 new sidings between Smithville andPhelan24 Waco $ 5,880,000 2Upgrades <strong>to</strong> Phelan (curve modifications and lineswings)25 Waco $ 5,040,000 2 Construct new siding between Phelan and Elgin26 Waco $ 1,590,000 4Upgrades <strong>to</strong> Elgin by Extending Siding (consider12.3 mile line change)27 Waco $ 5,040,000 4 Construct new siding between Elgin and TaylorConstruct a new connection at Taylor between <strong>the</strong>between <strong>the</strong> Waco and Austin Subdivisions(consider bypass route)Table 7-3: Identified Potential Rail Improvements7 - 11
<strong>San</strong> <strong>An<strong>to</strong>nio</strong> <strong>Region</strong> <strong>Freight</strong> <strong>Study</strong>Alternatives AnalysisThe improvements in Table 7-3 are not based on evaluations of engineeringfeasibility but ra<strong>the</strong>r required upgrades in order <strong>to</strong> improve train operations assuggested by <strong>the</strong> simulation exercises. Alternative capacity increases in <strong>the</strong> samegeneral areas would provide basically <strong>the</strong> same level of improvement <strong>to</strong> trainoperations.Observations of train movements over <strong>the</strong> rail network show that <strong>the</strong> current onewayoperating pattern on <strong>the</strong> Austin Subdivision between <strong>San</strong> Marcos, Taylor, andHearne can accommodate additional growth with track improvements. This couldallow for additional capacity <strong>to</strong> accommodate rock trains between Taylor and McNeiland operationally assist <strong>the</strong> nor<strong>the</strong>rly flow of one-way freight traffic. South of <strong>San</strong>Marcos, where <strong>the</strong>re is significant bi-directional traffic, improvements would beneeded <strong>to</strong> increase capacity even with two existing tracks available. The addedimprovements would be necessary <strong>to</strong> improve <strong>the</strong> flow of traffic in <strong>the</strong> greater <strong>San</strong><strong>An<strong>to</strong>nio</strong> area, including traffic growth on <strong>the</strong> Laredo and Glidden Subdivisions thatdoes not directly impact service on <strong>the</strong> Austin Subdivision.It is difficult without a detailed economic analysis and benefit/cost study <strong>to</strong> establish<strong>the</strong> financial benefits resulting from infrastructure improvements, although <strong>the</strong>majority of improvements discussed in this section are anticipated <strong>to</strong> contain anassociated, although not necessarily quantified, benefit for <strong>the</strong> railroads.Potential benefits that may be realized by <strong>the</strong> railroads as a result of <strong>the</strong> modeledimprovements may include:‣ Reduced exposure <strong>to</strong> roadway-rail crossings‣ Improved train operating efficiency‣ Reduced train delays‣ Improved train run-times‣ Reduced public exposure in generalBenefits <strong>to</strong> <strong>the</strong> private sec<strong>to</strong>r are based on <strong>the</strong> degree <strong>to</strong> which operationalperformance measures such as train mileage, run time, and delay time for eachplanning case change relative <strong>to</strong> those of <strong>the</strong> base case. Each performancemeasure has been translated <strong>to</strong> an economic value using <strong>the</strong> following unit costs:‣ Train mileage = $51.23/mile‣ Run time or delay time = $407.19/hour‣ Fuel = $3.33/gallon 2The train mileage cost of $51.23/mile is a representative industry cost that reflectsrail operating expense per train mile. The run and delay time cost of $407.19/hourassumes a 60:40 ratio of yard-<strong>to</strong>-line haul operating times within <strong>San</strong> <strong>An<strong>to</strong>nio</strong>, whereexpected yard operating expenses are $285.82 per hour and line haul operatingexpenses are $589.24 per hour.2 Hous<strong>to</strong>n Spot Diesel Prices, Argus Rail Business, Vol. 14,16, April 21, 2008.7 - 12
<strong>San</strong> <strong>An<strong>to</strong>nio</strong> <strong>Region</strong> <strong>Freight</strong> <strong>Study</strong>Alternatives AnalysisRail Infrastructure Improvement Planning CasesThe identified potential rail improvements (listed in Table 7-3) were used <strong>to</strong> developplanning cases, as discussed in <strong>the</strong> following section, and modeled in RTC.Planning cases, representing improvements and/or relocations, were investigatedwith <strong>the</strong> ultimate goal of improving train mobility and efficiency as well as addressing<strong>the</strong> areas of greatest congestion within <strong>the</strong> network. As <strong>the</strong> tables following eachRTC planning case will show, a comparison of <strong>the</strong> performance measures listedbelow is made between <strong>the</strong> base case and <strong>the</strong> potential improvements included in<strong>the</strong> planning cases.Operating performance of trains is measured by <strong>the</strong> following:‣ Total Run Time‣ S<strong>to</strong>p/Delay Time‣ Delay Percentage‣ Delay per 100 Train Miles‣ Average Train SpeedThe <strong>to</strong>tal run time is <strong>the</strong> average daily hours of train operation in each part of <strong>the</strong>network. This time includes dwell time for train make-up, en route switching, crewchanges, fueling, or o<strong>the</strong>r activities. S<strong>to</strong>p or delay time also is shown as averagedaily hours. A delay percentage is calculated as <strong>the</strong> s<strong>to</strong>p time as a share of <strong>to</strong>tal runtime. For <strong>the</strong> respective segments, <strong>the</strong> s<strong>to</strong>p time represents <strong>the</strong> <strong>to</strong>tal time that trainsare s<strong>to</strong>pped awaiting meets with o<strong>the</strong>r trains, or because of track congestion ahead.It does not include acceleration and deceleration times associated with train s<strong>to</strong>ptime, because that time may be split between segments. However, s<strong>to</strong>p time for <strong>the</strong><strong>to</strong>tal network does include acceleration and deceleration times as part of <strong>the</strong> overallmeasure of delay, so <strong>the</strong> resulting delay percentage calculations for <strong>the</strong> individualsegments are not directly comparable with <strong>the</strong> delay percent for <strong>the</strong> <strong>to</strong>tal network.The tabulated RTC results for each planning case include <strong>the</strong> minutes of delay per100 train miles, <strong>the</strong> average speed of all trains operated in each segment as well ason <strong>the</strong> full network, fuel in gallons, and gallons consumed per mile.Base CaseExisting railroad infrastructure and operations were analyzed <strong>to</strong> develop an RTCbase case model for comparison <strong>to</strong> potential alternatives and improvements. TheRTC model was run for each case (base case and planning cases) for a four weeksimulation period, which accounts for day <strong>to</strong> day variances in operations. The caseswere run for <strong>the</strong> full network, including <strong>the</strong> lines <strong>to</strong> Hearne via Austin, Smithville, andGiddings. The base case for measurement of <strong>the</strong> impact or benefit of proposedcapacity improvements is <strong>the</strong> performance of <strong>the</strong> current network.Eight additional daily trains were added <strong>to</strong> <strong>the</strong> simulation <strong>to</strong> represent anticipatedtraffic growth with <strong>the</strong> opening of <strong>the</strong> Toyota Assembly Plant, so that this set ofsimulations reflects expected train operations during <strong>the</strong> coming year. Similarly,7 - 13
<strong>San</strong> <strong>An<strong>to</strong>nio</strong> <strong>Region</strong> <strong>Freight</strong> <strong>Study</strong>Alternatives Analysisseveral track improvement projects recently completed or now underway <strong>to</strong> support<strong>the</strong> Toyota operation were incorporated in<strong>to</strong> <strong>the</strong> network <strong>to</strong> reflect anticipatedoperations when <strong>the</strong> plant opens. These improvements make up <strong>the</strong> base casesimulation. Simulation results for this case are shown in Table 7-4.RTC Performance MeasureBase CaseResultsTrains Operated (28 days) 2,891Train Miles (28 Days) 359,028Total Run Time Hours (Avg. Daily Hours) 496.2Delay Time Hours (Avg. Daily Hours) 86.6Delay Percentage 17.50%Delay Minutes/100 Train Miles 40.52Average Speed 25.8Fuel (gallons) 2,956,784Gallons/Train Mile 8.2Table 7-4: RTC Base Case SummaryPlanning Cases A, B1, B2, and C test possible bypass routes that may route trainsaround metropolitan areas such as <strong>San</strong> <strong>An<strong>to</strong>nio</strong>, <strong>San</strong> Marcos, New Braunfels, andAustin. Tables 7-5 and 7-6 show estimated costs and route mileages for <strong>the</strong> fourplanning cases, and are followed by detailed discussions of each planning case.Following <strong>the</strong> discussion of Planning Cases A, B1, B2, and C are four additionalPlanning Cases 1 through 4, which test improvements intended <strong>to</strong> improve railroadoperating efficiency and performance in <strong>the</strong> region.7 - 14
<strong>San</strong> <strong>An<strong>to</strong>nio</strong> <strong>Region</strong> <strong>Freight</strong> <strong>Study</strong>Alternatives AnalysisLimits Miles CostSeguin (Glidden MP 170) <strong>to</strong> Macdona (Del Rio MP 223) viaPC A - SA Bypass <strong>San</strong> <strong>An<strong>to</strong>nio</strong> Bypass$1,369,610,000Upgrades <strong>to</strong> Existing Track Marion (Glidden MP 187) <strong>to</strong> Glidden MP 170 17 $166,290,000North Seguin Bypass Glidden MP 170 <strong>to</strong> Glidden MP 175 9 $99,590,000<strong>San</strong> <strong>An<strong>to</strong>nio</strong> Bypass Glidden MP 175 <strong>to</strong> Macdona (Del Rio MP 223) 59 $725,730,000Grade Separations (14Roadway and 2 Rail) onBypass RouteSeguin (Glidden MP 170) <strong>to</strong> Macdona (Del RioMP 223) n/a $163,000,000Macdona Yard w/ FuelingFacility Macdona n/a $200,000,000Marion Yard Glidden MP 187 n/a $15,000,000Taylor (ASML MP 144) <strong>to</strong> Seguin (Glidden MP 170) viaPC B (1) - AUS Bypass Austin Bypass, Seguin <strong>to</strong> Macdona via Glidden/ Del Rio Sub $1,595,850,000Seguin (Glidden MP 170) <strong>to</strong> East Yard (Del RioUpgrades <strong>to</strong> Existing Track MP 207) 37 $400,720,000Upgrades <strong>to</strong> Existing TrackTower 112 (Del Rio MP 211) <strong>to</strong> Tower 105 (DelRio MP 213) 2 $47,780,000Upgrades <strong>to</strong> Existing TrackTower 105 (Laredo MP 260) <strong>to</strong> So<strong>San</strong> Yard(Laredo MP 264) 4 $93,450,000Taylor <strong>to</strong> Lockhart Bypass Taylor (ASML MP 144) <strong>to</strong> Lockhart 52 $656,930,000Lockhart <strong>to</strong> Seguin Bypass via Lockhart <strong>to</strong> Seguin (North end of North SeguinSH 130 Seg. 6Bypass at Glidden MP 170) 25 $328,970,0008 Roadway Grade Separationson Bypass Route Taylor <strong>to</strong> Seguin (Glidden MP 170) n/a $68,000,000PC B (2) - AUS Bypass Taylor (ASML MP 144) <strong>to</strong> Seguin (Glidden MP 170) via $1,741,260,000Upgrades <strong>to</strong> Existing TrackSeguin (Glidden MP 170) <strong>to</strong> Wye (Del Rio MP206) 36 $400,720,000Upgrades <strong>to</strong> Existing Track Wye <strong>to</strong> Tower 112 via ASML 2 5 $127,160,000Upgrades <strong>to</strong> Existing TrackTower 112 (Del Rio MP 211) <strong>to</strong> Tower 105 (DelRio MP 213) 2 $47,780,000Upgrades <strong>to</strong> Existing TrackTower 105 (Laredo MP 260) <strong>to</strong> So<strong>San</strong> Yard(Laredo MP 264) 4 $93,450,000Taylor <strong>to</strong> Lockhart Bypass Taylor (ASML MP 144) <strong>to</strong> Lockhart 52 $656,930,000Lockhart <strong>to</strong> Seguin Bypass via Lockhart <strong>to</strong> Seguin (North end of North SeguinSH 130 Seg. 6Bypass at Glidden MP 170) 25 $328,970,0008 Roadway Grade Separationson Bypass Route Taylor <strong>to</strong> Seguin (Glidden MP 170) n/a $68,000,0002 Grade Separations and 1Crossing Closure on ASML 2 Wye <strong>to</strong> Tower 112 via ASML 2 n/a $18,250,000Taylor <strong>to</strong> Macdona (Del Rio MP 223) via Austin and <strong>San</strong>PC C - SA & AUS Bypass <strong>An<strong>to</strong>nio</strong> Bypasses$2,423,510,000Marion (Glidden MP 187) <strong>to</strong> Seguin (Glidden MPUpgrades <strong>to</strong> Existing Track 170) 17 $166,290,000Taylor <strong>to</strong> Lockhart Bypass Taylor (ASML MP 144) <strong>to</strong> Lockhart 52 $656,930,000Lockhart <strong>to</strong> Seguin Bypass via Lockhart <strong>to</strong> Seguin (North end of North SeguinSH 130 Seg. 6Bypass at Glidden MP 170) 25 $328,970,000North Seguin Bypass Glidden MP 170 <strong>to</strong> Glidden MP 175 9 $99,590,000<strong>San</strong> <strong>An<strong>to</strong>nio</strong> Bypass Glidden MP 175 <strong>to</strong> Macdona (Del Rio MP 223) 59 $725,730,000Grade Separations (22Roadway and 2 Rail) onBypass Route Taylor <strong>to</strong> Macdona (Del Rio MP 223) n/a $231,000,000Macdona Yard w/ FuelingFacility Macdona n/a $200,000,000Marion Yard Glidden MP 187 n/a $15,000,000Table 7-5: Estimated Planning Case Costs7 - 15
<strong>San</strong> <strong>An<strong>to</strong>nio</strong> <strong>Region</strong> <strong>Freight</strong> <strong>Study</strong>Alternatives AnalysisMileage Comparison Limits Miles<strong>San</strong> <strong>An<strong>to</strong>nio</strong> Bypass (includingNorth Seguin Bypass) Macdona <strong>to</strong> Seguin 68Existing Route Macdona <strong>to</strong> Seguin via Del Rio Sub 54Austin Bypass (PC B1)Austin Bypass (PC B2)Taylor <strong>to</strong> Seguin via Bypass, Seguin <strong>to</strong> Macdonavia Del Rio Sub 131Taylor <strong>to</strong> Seguin via Bypass, Seguin <strong>to</strong> WyeConnection at ASML 2, Wye <strong>to</strong> Tower 112 viaASML 2, Tower 112 <strong>to</strong> Macdona via Del Rio Sub 131Existing Route Taylor <strong>to</strong> Macdona via ASML 1 and Del Rio Sub 127Combined <strong>San</strong> <strong>An<strong>to</strong>nio</strong> andAustin Bypass Macdona <strong>to</strong> Taylor via Bypass 145Existing Route Taylor <strong>to</strong> Macdona via ASML 1 and Del Rio Sub 127Table 7-6: Estimated Planning Case Route MileagesPlanning Case A – <strong>San</strong> <strong>An<strong>to</strong>nio</strong> BypassPlanning Case A analyzed <strong>the</strong> base case plus a possible <strong>San</strong> <strong>An<strong>to</strong>nio</strong> bypass withnew yards at Marion and Macdona. The <strong>San</strong> <strong>An<strong>to</strong>nio</strong> bypass alternative consists ofa potential new double track rail corridor for an approximate length of 68 miles thatwould bypass <strong>San</strong> <strong>An<strong>to</strong>nio</strong> between Seguin (where <strong>the</strong> bypass would connect <strong>to</strong> <strong>the</strong>existing Glidden Subdivision line) and Macdona (where <strong>the</strong> bypass would connect <strong>to</strong><strong>the</strong> existing Del Rio Subdivision). Planning Case A also includes upgrades <strong>to</strong>existing track between Marion and <strong>the</strong> connection with <strong>the</strong> possible Austin bypass inSeguin. The new yard at Marion would replace most of <strong>the</strong> activities currentlycompleted at East Yard. The new yard at Macdona would serve as a fueling facilityfor through-trains. The conceptual location of <strong>the</strong> possible <strong>San</strong> <strong>An<strong>to</strong>nio</strong> bypass isshown in Figure 7-2. The estimated cost of Planning Case A is approximately $1.37billion, including <strong>the</strong> cost of identified grade separated roadway and rail crossings.Trains that could be rerouted <strong>to</strong> a <strong>San</strong> <strong>An<strong>to</strong>nio</strong> bypass consist of through-trainsprimarily from <strong>the</strong> Glidden and Del Rio Subdivisions, coal trains that serve regionalpower plants, and intermodal trains that are currently serviced at ei<strong>the</strong>r So<strong>San</strong> orEast Yards. However, local service trains, rock trains <strong>to</strong> and from Hunter (north of<strong>San</strong> <strong>An<strong>to</strong>nio</strong>), passenger trains (Amtrak <strong>Texas</strong> Eagle and Sunset Limited routes),and international freight from Laredo that is destined for So<strong>San</strong> Yard would remainon existing rail lines.7 - 16
<strong>San</strong> <strong>An<strong>to</strong>nio</strong> <strong>Region</strong> <strong>Freight</strong> <strong>Study</strong>Alternatives AnalysisFigure 7-2: Possible <strong>San</strong> <strong>An<strong>to</strong>nio</strong> Bypass(note: conceptual bypass route shown is for illustrative purposes only)Table 7-7 and Figure 7-4 show daily train counts on existing subdivisions for <strong>the</strong>base case (no-build) scenario and <strong>the</strong> bypass scenario, as well as <strong>the</strong> projectedpercent reduction in daily trains on existing lines resulting from <strong>the</strong> possible bypassroute. As shown in Table 7-7, <strong>the</strong> possible <strong>San</strong> <strong>An<strong>to</strong>nio</strong> bypass route is projected <strong>to</strong>provide reductions in daily train volumes ranging from 3 <strong>to</strong> 20 daily trains (25 <strong>to</strong> 70percent) on existing lines running through <strong>San</strong> <strong>An<strong>to</strong>nio</strong>, depending on location.Although, <strong>the</strong> daily train volume would be increased by 13 trains on <strong>the</strong> GliddenSubdivision between Fla<strong>to</strong>nia and Seguin.7 - 17
<strong>San</strong> <strong>An<strong>to</strong>nio</strong> <strong>Region</strong> <strong>Freight</strong> <strong>Study</strong>Alternatives AnalysisRailroad SubdivisionDaily TrainsBase Case Bypass CasePercentChangePossible <strong>San</strong> <strong>An<strong>to</strong>nio</strong> Bypass, Seguin <strong>to</strong>Macdona N/A 31 100%Austin Subdivision ML 1, East of Taylor 22 13 -41%Austin Subdivision ML 1, Taylor <strong>to</strong>Round Rock 30 21 -30%Austin Subdivision ML 1, Round Rock <strong>to</strong><strong>San</strong> Marcos 25 16 -36%Austin Subdivision ML 1 and 2, <strong>San</strong>Marcos <strong>to</strong> Garden Ridge 36 23 -36%Austin Subdivision ML 1, Garden Ridge<strong>to</strong> <strong>San</strong> <strong>An<strong>to</strong>nio</strong> (Twr 105) 22 16 -27%Austin Subdivision ML 2, Garden Ridge<strong>to</strong> Del Rio Sub 10 3 -70%Austin Subdivision ML 2, Del Rio Sub <strong>to</strong>Down<strong>to</strong>wn <strong>San</strong> <strong>An<strong>to</strong>nio</strong> (Twr 112) 10 3 -70%Corpus Christi Subdivision, So<strong>San</strong> Yard<strong>to</strong> Toyota Plant 13 5 -62%Del Rio Subdivision, Kirby <strong>to</strong> Down<strong>to</strong>wn<strong>San</strong> <strong>An<strong>to</strong>nio</strong> (Twr 105) 35 15 -57%Del Rio Subdivision, Down<strong>to</strong>wn <strong>San</strong><strong>An<strong>to</strong>nio</strong> (Twr 105) <strong>to</strong> Macdona 24 5 -79%Del Rio Subdivision, Macdona <strong>to</strong> Hondo 27 27 0%Glidden Subdivision, Fla<strong>to</strong>nia <strong>to</strong> Seguin 27 40 48%Glidden Subdivision, Seguin <strong>to</strong> Kirby 27 13 -52%Laredo Subdivision, <strong>San</strong> <strong>An<strong>to</strong>nio</strong> <strong>to</strong>Gessner 18 11 -39%Laredo Subdivision, Gessner <strong>to</strong> Melon 18 18 0%Lockhart Subdivision, <strong>San</strong> Marcos <strong>to</strong>West Point 12 9 -25%Table 7-7: Daily Train Counts and Percent Change Resulting from Possible <strong>San</strong><strong>An<strong>to</strong>nio</strong> Bypass7 - 18
<strong>San</strong> <strong>An<strong>to</strong>nio</strong> <strong>Region</strong> <strong>Freight</strong> <strong>Study</strong>Alternatives AnalysisFigure 7-3: Avg. Daily Trains for Base Case Scenario (No-Build)7 - 19
<strong>San</strong> <strong>An<strong>to</strong>nio</strong> <strong>Region</strong> <strong>Freight</strong> <strong>Study</strong>Alternatives AnalysisFigure 7-4: Avg. Daily Trains for Planning Case A (Possible <strong>San</strong> <strong>An<strong>to</strong>nio</strong> Bypass)(note: conceptual bypass route shown is for illustrative purposes only)7 - 20
<strong>San</strong> <strong>An<strong>to</strong>nio</strong> <strong>Region</strong> <strong>Freight</strong> <strong>Study</strong>Alternatives AnalysisPublic Benefit AnalysisCurrently, railroad operations and major truck routes pass directly through <strong>San</strong><strong>An<strong>to</strong>nio</strong> central business districts. With many of <strong>the</strong> <strong>to</strong>p employers of <strong>the</strong> regioncentrally located, <strong>the</strong> exposure of truck and rail freight movement <strong>to</strong> <strong>the</strong> travelingpublic brings with it a potential increase in exposure <strong>to</strong> hazardous materialstransportation and increased safety hazards and delays in general.The potential public benefits associated with <strong>the</strong> relocation of through-freight railservices from existing rail lines in <strong>the</strong> region <strong>to</strong> a <strong>San</strong> <strong>An<strong>to</strong>nio</strong> bypass (from Seguin<strong>to</strong> Macdona) could include:‣ Reductions in vehicular delays and improved safety at highway-rail gradecrossings,‣ Improvements <strong>to</strong> air quality resulting from reductions in vehicular idling andreduced locomotive operations,‣ Reductions in fuel usage for vehicular traffic, improvements in economicdevelopment opportunities, and‣ Reductions in hazardous materials movement within urban areas.The <strong>San</strong> <strong>An<strong>to</strong>nio</strong> bypass was shown <strong>to</strong> benefit <strong>the</strong> public by reducing train trafficthrough <strong>the</strong> urban and residential areas of <strong>San</strong> <strong>An<strong>to</strong>nio</strong>. Additionally, <strong>the</strong> possiblebypass provides public benefit by reducing train traffic through cities located along<strong>the</strong> rail lines throughout <strong>the</strong> entire modeled network between <strong>San</strong> <strong>An<strong>to</strong>nio</strong> andTaylor, such as New Braunfels, <strong>San</strong> Marcos, and Austin. The reduction in traintraffic, in turn reduces <strong>the</strong> safety hazards and delays mo<strong>to</strong>rists experience atroadway-railroad crossings in <strong>the</strong> region. The possible bypass imposes a publiccost burden due <strong>to</strong> <strong>the</strong> introduction of train traffic between Seguin and Macdona;however, this burden is offset by a reduction in <strong>the</strong> public burden associated withroadway-railroad crossings along <strong>the</strong> existing subdivisions.Grade Crossing Impedance ReductionThe estimated public benefit of <strong>the</strong> possible <strong>San</strong> <strong>An<strong>to</strong>nio</strong> bypass (from Seguin <strong>to</strong>Macdona) resulting from <strong>the</strong> reduction in public burden associated with <strong>the</strong> at-graderoadway-railroad crossings was calculated <strong>to</strong> be more than $348 million, as shownin Table 7-8. The public benefits shown in Table 7-8 extend beyond <strong>the</strong> <strong>San</strong> <strong>An<strong>to</strong>nio</strong>study area <strong>to</strong> include benefits in Hays, Travis, and Williamson Counties, since <strong>the</strong>impact of <strong>the</strong> bypass extends throughout <strong>the</strong> entire region.7 - 21
<strong>San</strong> <strong>An<strong>to</strong>nio</strong> <strong>Region</strong> <strong>Freight</strong> <strong>Study</strong>Alternatives AnalysisRailroad SubdivisionNo-BuildScenarioBypassScenario (A)Bypass Benefit(difference)Austin Subdivision (<strong>San</strong> Marcos <strong>to</strong>Williamson County Line) $297,030,000 $185,580,000 $111,450,000Austin No 1 (<strong>San</strong> Marcos <strong>to</strong>Downotwn <strong>San</strong> <strong>An<strong>to</strong>nio</strong>) $454,610,000 $271,850,000 $182,760,000Austin No 2 (<strong>San</strong> Marcos <strong>to</strong>Downotwn <strong>San</strong> <strong>An<strong>to</strong>nio</strong>) $91,390,000 $32,640,000 $58,750,000Corpus Christi (Down<strong>to</strong>wn <strong>San</strong><strong>An<strong>to</strong>nio</strong> <strong>to</strong> Toyota Plant) $78,170,000 $114,510,000 -$36,340,000Del Rio (Kirby <strong>to</strong> Macdona) $324,240,000 $175,570,000 $148,670,000Giddings (Fla<strong>to</strong>nia <strong>to</strong> Mumford) $18,990,000 $25,520,000 -$6,530,000Glidden (Fla<strong>to</strong>nia <strong>to</strong> Kirby) $92,530,000 $51,800,000 $40,730,000Kerrville $143,190,000 $108,320,000 $34,870,000Laredo (Down<strong>to</strong>wn <strong>San</strong> <strong>An<strong>to</strong>nio</strong> <strong>to</strong>Gessner) $123,390,000 $175,600,000 -$52,210,000Lockhart (<strong>San</strong> Marcos <strong>to</strong> Smithville) $44,130,000 $24,540,000 $19,590,000Rockport $34,290,000 $4,720,000 $29,570,000Waco (Smithville <strong>to</strong> Taylor) $8,720,000 $9,550,000 -$830,000Sub<strong>to</strong>tal: $1,710,680,000 $1,180,200,000 $530,480,000Possible Bypass without GradeSeparations $0 $182,360,000 -$182,360,000Total (without grade separations on bypass)$348,120,000Possible Bypass with GradeSeparations $0 $29,060,000 -$29,060,000Total (with grade separations on bypass)$501,420,000Table 7-8: Public Costs at Roadway-Railroad Crossings (for a 20-year period)The public cost burden due <strong>to</strong> <strong>the</strong> introduction of train traffic on a Seguin-Macdonaroute, shown in Table 7-8 as approximately $182 million, would be significantlyreduced by grade separating or closing some of <strong>the</strong> roadway-railroad crossingsalong <strong>the</strong> corridor. Interstate crossings along <strong>the</strong> route such as I-35, I-37, and I-10would be required <strong>to</strong> be grade separated in order <strong>to</strong> comply with Federal HighwayAdministration (FHWA) regulations, and, <strong>the</strong>refore are included as part of <strong>the</strong> basecost.Additional crossings along <strong>the</strong> route were analyzed and determined <strong>to</strong> be candidatesfor potential grade separation based on traffic flow volumes for both vehicular andtrain traffic. The potential grade separations are listed in Table 7-9 with <strong>the</strong>irassociated average daily traffic volumes for vehicles (AADT) and trains, as well as<strong>the</strong>ir estimated costs, and estimated public benefits. In all, <strong>the</strong> grade separationsidentified would reduce <strong>the</strong> public cost burden of <strong>the</strong> bypass by approximately $153million, <strong>the</strong>reby increasing <strong>the</strong> public benefit of <strong>the</strong> bypass <strong>to</strong> approximately $501.4million as shown in Table 7-8.7 - 22
<strong>San</strong> <strong>An<strong>to</strong>nio</strong> <strong>Region</strong> <strong>Freight</strong> <strong>Study</strong>Alternatives AnalysisIH 35 (Mainlanes and frontageroads) <strong>San</strong> <strong>An<strong>to</strong>nio</strong> 44,500 $16,000,000 $37,390,000 2.34FM 2790 (Somerset Road) <strong>San</strong> <strong>An<strong>to</strong>nio</strong> 5,200 $8,000,000 $2,890,000 0.36SH 16 <strong>San</strong> <strong>An<strong>to</strong>nio</strong> 19,400 $8,000,000 $10,980,000 1.37US HWY 281 Cassin 14,000 $12,000,000 $6,790,000 0.57IH 37 (Mainlanes and frontageroads) Buena Vista 49,000 $16,000,000 $38,440,000 2.40Loop 1604 Buena Vista 5,000 $8,000,000 $2,860,000 0.36US HWY 181 Saspamco 18,400 $12,000,000 $8,720,000 0.73FM 3432 (Sulphur SpringsRoad) La Vernia 3,300 $8,000,000 $1,650,000 0.21US HWY 87 Adkins 10,500 $12,000,000 $4,600,000 0.38FM 1346 St. Hedwig 1,900 $5,000,000 $990,000 0.20IH 10 (Mainlanes and frontageroads) <strong>San</strong>ta Clara 36,500 $16,000,000 $22,730,000 1.42FM 78 McQueeney 5,500 $8,000,000 $2,650,000 0.33SH 46 McQueeney 13,900 $10,000,000 $6,270,000 0.63SH 123 Geronimo 14,000 $8,000,000 $6,340,000 0.79Total:Street Name City Name AADTEstimatedCost20-YearBenefit (2007dollars)Benfit/ CostRatio$147,000,000 $153,300,000 1.04Table 7-9: Potential Grade Separations on <strong>the</strong> Possible <strong>San</strong> <strong>An<strong>to</strong>nio</strong> Bypass Route(Seguin <strong>to</strong> Macdona)Reduced Locomotive EmissionsAdditionally, <strong>the</strong> <strong>San</strong> <strong>An<strong>to</strong>nio</strong> bypass provides public benefit in <strong>the</strong> form of reducedlocomotive emissions (pollutants) in <strong>the</strong> region. The locomotive emissions reductionfor <strong>the</strong> bypass is a function of <strong>the</strong> reduced run time hours and delay time hours from<strong>the</strong> base case, as listed in Table 7-11. Planning Case A provides a public benefitfrom reduced locomotive emissions over <strong>the</strong> 20-year study period of $3.4 million asshown in Table 7-10.The <strong>to</strong>tal public benefits over a 20-year duration, assuming <strong>the</strong> crossings listed inTable 7-9 would be grade separated, are shown in Table 7-10 for Planning Case A.Public Sec<strong>to</strong>r Benefits ($ million)Grade Crossing Impedance (<strong>Freight</strong>) 501.40Locomotive Emssions Reduction 3.39Total ($ million) 504.79Table 7-10: Public Benefits for Planning Case AThe public benefit of <strong>the</strong> <strong>San</strong> <strong>An<strong>to</strong>nio</strong> bypass is <strong>the</strong> result of <strong>the</strong> relocation of freighttrains out of urban and residential areas on<strong>to</strong> a bypass that runs predominatelythrough rural areas. However, <strong>the</strong> <strong>San</strong> <strong>An<strong>to</strong>nio</strong> bypass scenario (without <strong>the</strong> Austinbypass) may not carry <strong>the</strong> potential for commuter rail implementation that wouldsignificantly increase <strong>the</strong> value of public benefit for <strong>the</strong> bypass. Commuter rail maynot be feasible on existing rail lines in conjunction with a possible <strong>San</strong> <strong>An<strong>to</strong>nio</strong>bypass because <strong>the</strong> rail lines north of <strong>San</strong> <strong>An<strong>to</strong>nio</strong> (which would not be impactedsignificantly by <strong>the</strong> <strong>San</strong> <strong>An<strong>to</strong>nio</strong> bypass) may not sustain commuter rail operationsdue <strong>to</strong> <strong>the</strong> lack of available capacity from freight operations. The Austin bypass7 - 23
<strong>San</strong> <strong>An<strong>to</strong>nio</strong> <strong>Region</strong> <strong>Freight</strong> <strong>Study</strong>Alternatives Analysiswould reduce freight train volumes on existing lines north of <strong>San</strong> <strong>An<strong>to</strong>nio</strong>, <strong>the</strong>rebyproviding capacity that could potentially support commuter rail operations.Private Benefit AnalysisPlanning Case A provides significant performance benefits compared with <strong>the</strong> basecase. Run time and s<strong>to</strong>p time are reduced, and <strong>the</strong> delay ratio improves. Minutes ofdelay per 100 train miles drops, and average train speeds over <strong>the</strong> entire networkincrease. The addition of <strong>the</strong> bypass <strong>to</strong> <strong>the</strong> network removes more trains from <strong>the</strong>existing trackage, with a consequent reduction in conflicts and delays <strong>to</strong> <strong>the</strong> trainsthat remain on existing trackage.Table 7-11 compares <strong>the</strong> simulation results of <strong>the</strong> base case <strong>to</strong> Planning Case A,and lists <strong>the</strong> net change in each RTC simulation parameter that is expected <strong>to</strong> occurupon implementation of this planning case. For example, construction of <strong>the</strong> <strong>San</strong><strong>An<strong>to</strong>nio</strong> bypass from Macdona <strong>to</strong> Seguin would likely increase operating distancesby 15,477 train miles over a 28-day period, resulting in <strong>the</strong> consumption ofapproximately 173,296 additional gallons of diesel fuel over <strong>the</strong> same time period.On <strong>the</strong> o<strong>the</strong>r hand, this planning case should reduce <strong>to</strong>tal run time by 11 hours perday.RTC Performance MeasureBase CaseResultsPlanning CaseA ResultsNetChangeTrains Operated (28 days) 2,891 2,663 -228Train Miles (28 Days) 359,028 374,505 15,477Total Run Time Hours (Avg. Daily Hours) 496.2 485.3 -10.9Delay Time Hours (Avg. Daily Hours) 86.6 86.4 -0.2Delay Percentage 17.50% 17.8% 0.3%Delay Minutes/100 Train Miles 40.52 38.76 -1.8Average Speed 25.8 27.6 1.8Fuel (gallons) 2,956,784 3,130,080 173,296Gallons/Train Mile 8.2 8.3 0.1Table 7-11: RTC Planning Case A SummaryTable 7-12 shows <strong>the</strong> economic benefit <strong>to</strong> <strong>the</strong> private sec<strong>to</strong>r over a 20-year studyperiod, based on changes in performance measures attributable <strong>to</strong> Planning Case Aas shown in Table 7-11. The methodology used in <strong>the</strong> analysis of private benefits isdiscussed in greater detail in section 10.Relocation of train traffic <strong>to</strong> an outer <strong>San</strong> <strong>An<strong>to</strong>nio</strong> bypass increases 20-year trainmileage costs by $111.97 million and increases fuel costs by $81.49 million over thissame period when discounted at a nominal cost of capital of 6.68 percent (seeAppendix G for cost of capital calculations). This planning case also reduces 20-year run time and delay time costs by $17.60 million and $0.27 million respectively,resulting in a burden (i.e., costs minus savings) of approximately $176 million over<strong>the</strong> project life. However, <strong>the</strong> <strong>San</strong> <strong>An<strong>to</strong>nio</strong> bypass also provides a benefit in <strong>the</strong> form7 - 24
<strong>San</strong> <strong>An<strong>to</strong>nio</strong> <strong>Region</strong> <strong>Freight</strong> <strong>Study</strong>Alternatives Analysisof reduced track maintenance and grade crossing accident costs of $8.92 millionand $3.80 million, respectively. Total private sec<strong>to</strong>r costs and savings associatedwith Planning Case A amount <strong>to</strong> a net private sec<strong>to</strong>r cost of $163 million.Private Sec<strong>to</strong>r Benefits ($ million)<strong>Freight</strong> Rail Operations:Train Miles -111.97Run Time 17.60Delay Time 0.27Fuel -81.49Track Maintenance Savings 8.92Grade Crossing Accident Avoidance 3.80Total ($ million) -162.86Table 7-12: Private Benefits for Planning Case APlanning Cases B1 and B2– Austin BypassPlanning Cases B1 and B2 each analyzed <strong>the</strong> base case plus an Austin bypass witha new intermodal yard at Macdona. The Austin bypass is a potential new railcorridor for an approximate length of 77 miles between Taylor (where <strong>the</strong> bypasswould connect <strong>to</strong> <strong>the</strong> existing Austin Subdivision line) and Seguin (where <strong>the</strong> bypasswould connect <strong>to</strong> <strong>the</strong> existing Glidden Subdivision) that would bypass Austin, <strong>San</strong>Marcos, and o<strong>the</strong>r <strong>to</strong>wns. The conceptual location of an Austin bypass is shown inFigure 7-5.In Planning Case B1, trains were routed via <strong>the</strong> existing Del Rio Subdivisionbetween <strong>the</strong> possible Austin bypass connection in Seguin and railroad Tower 112,which is how trains are currently routed under existing conditions. Planning Case B1also includes upgrades <strong>to</strong> existing track between Seguin and East Yard as well asbetween Tower 112 and So<strong>San</strong> Yard. The estimated cost of Planning Case B1 is$1.6 billion, including <strong>the</strong> cost of identified grade separated roadway-railroadcrossings.In Planning Case B2, trains were routed via <strong>the</strong> existing Austin Subdivision ML 2between <strong>the</strong> possible Austin bypass connection in Seguin and railroad Tower 112.Planning Case B2 would require <strong>the</strong> construction of a new wye connection between<strong>the</strong> Del Rio Subdivision and Austin Subdivision ML 2. Planning Case B2 alsoincludes upgrades <strong>to</strong> existing track between Seguin and <strong>the</strong> possible new wyeconnection along <strong>the</strong> Del Rio Subdivision, between <strong>the</strong> wye and Tower 112 on <strong>the</strong>Austin Subdivision ML 2, and between Tower 112 and So<strong>San</strong> Yard on <strong>the</strong> Del RioSubdivision. The estimated cost of Planning Case B2 is $1.74 billion, including <strong>the</strong>cost of identified grade separated roadway-railroad crossings.7 - 25
<strong>San</strong> <strong>An<strong>to</strong>nio</strong> <strong>Region</strong> <strong>Freight</strong> <strong>Study</strong>Alternatives AnalysisFigure 7-5: Possible Austin Bypass(note: conceptual bypass route shown is for illustrative purposes only)Figure 7-6 shows <strong>the</strong> location of <strong>the</strong> existing <strong>San</strong> <strong>An<strong>to</strong>nio</strong> rail network, includingrailroad Tower 112 and <strong>the</strong> connection between <strong>the</strong> Del Rio and Austin ML 2Subdivisions.7 - 26
<strong>San</strong> <strong>An<strong>to</strong>nio</strong> <strong>Region</strong> <strong>Freight</strong> <strong>Study</strong>Alternatives AnalysisFigure 7-6: <strong>San</strong> <strong>An<strong>to</strong>nio</strong> Rail Network7 - 27
<strong>San</strong> <strong>An<strong>to</strong>nio</strong> <strong>Region</strong> <strong>Freight</strong> <strong>Study</strong>Alternatives AnalysisTrains that may be rerouted <strong>to</strong> <strong>the</strong> Austin bypass include through-trains and manifest(mixed-freight) trains running north-south and destined for Hearne, Dallas-FortWorth, and o<strong>the</strong>r destinations north of Austin. Trains that would remain on <strong>the</strong>existing rail lines consist of passenger trains (Amtrak <strong>Texas</strong> Eagle route), rock trains<strong>to</strong> Hunter and George<strong>to</strong>wn, local trains providing service between Taylor and <strong>San</strong>Marcos, and coal trains (minimal). Additionally, connectivity would be maintained <strong>to</strong>Capital Metro owned freight lines in <strong>the</strong> region.Table 7-13 and Figures 7-7 through 7-9 show <strong>the</strong> daily train counts on existingsubdivisions for <strong>the</strong> base case (no-build) scenario and <strong>the</strong> bypass scenarios, as wellas <strong>the</strong> projected percent reduction in daily trains on existing lines resulting from <strong>the</strong>possible bypass routes. As shown in Table 7-13, an Austin bypass route wouldprovide reductions in daily train volumes of up <strong>to</strong> 23 daily trains on existing linesrunning through <strong>San</strong> Marcos, Austin, and various o<strong>the</strong>r cities, depending on location.Although, <strong>the</strong> daily train volumes would be increased on segments of <strong>the</strong> AustinSubdivision ML 1, Del Rio Subdivision, and <strong>the</strong> Glidden Subdivision.7 - 28
<strong>San</strong> <strong>An<strong>to</strong>nio</strong> <strong>Region</strong> <strong>Freight</strong> <strong>Study</strong>Alternatives AnalysisRailroad SubdivisionBase CaseDaily TrainsBypass Case(B1)Bypass Case(B2)PercentChange(B1)PercentChange(B2)Possible Austin Bypass, Seguin<strong>to</strong> Lockhart N/A 28 28 100% 100%Possible Austin Bypass,Lockhart <strong>to</strong> Taylor N/A 29 29 100% 100%Austin Subdivision ML 1, Eas<strong>to</strong>f Taylor 22 33 33 50% 50%Austin Subdivision ML 1, Taylor<strong>to</strong> Round Rock 30 13 13 -57% -57%Austin Subdivision ML 1, RoundRock <strong>to</strong> <strong>San</strong> Marcos 25 8 8 -68% -68%Austin Subdivision ML 1 and 2,<strong>San</strong> Marcos <strong>to</strong> Garden Ridge 36 12 12 -67% -67%Austin Subdivision ML 1,Garden Ridge <strong>to</strong> <strong>San</strong> <strong>An<strong>to</strong>nio</strong>(Twr 105) 22 8 8 -64% -64%Austin Subdivision ML 2,Garden Ridge <strong>to</strong> Del Rio Sub 10 1 1 -90% -90%Austin Subdivision ML 2, DelRio Sub <strong>to</strong> Down<strong>to</strong>wn <strong>San</strong><strong>An<strong>to</strong>nio</strong> (Twr 112) 10 1 48 -90% 380%Corpus Christi Subdivision,So<strong>San</strong> Yard <strong>to</strong> Toyota Plant 13 13 13 0% 0%Del Rio Subdivision, Kirby <strong>to</strong>Down<strong>to</strong>wn <strong>San</strong> <strong>An<strong>to</strong>nio</strong> (Twr105) 35 56 10 60% -71%Del Rio Subdivision, Down<strong>to</strong>wn<strong>San</strong> <strong>An<strong>to</strong>nio</strong> (Twr 105) <strong>to</strong> 24 36 36 50% 50%Glidden Subdivision, Fla<strong>to</strong>nia <strong>to</strong>Seguin 27 24 24 -11% -11%Glidden Subdivision, Seguin <strong>to</strong>Kirby 27 52 52 93% 93%Laredo Subdivision, <strong>San</strong><strong>An<strong>to</strong>nio</strong> <strong>to</strong> Gessner 18 18 18 0% 0%Lockhart Subdivision, <strong>San</strong>Marcos <strong>to</strong> West Point 12 6 6 -50% -50%Table 7-13: Daily Train Counts and Percent Change Resulting from Possible AustinBypass7 - 29
<strong>San</strong> <strong>An<strong>to</strong>nio</strong> <strong>Region</strong> <strong>Freight</strong> <strong>Study</strong>Alternatives AnalysisFigure 7-7: Avg. Daily Trains for Base Case Scenario (No-Build)7 - 30
<strong>San</strong> <strong>An<strong>to</strong>nio</strong> <strong>Region</strong> <strong>Freight</strong> <strong>Study</strong>Alternatives AnalysisFigure 7-8: Avg. Daily Trains for Planning Case B1 (Possible Austin Bypass)(note: conceptual bypass route shown is for illustrative purposes only)7 - 31
<strong>San</strong> <strong>An<strong>to</strong>nio</strong> <strong>Region</strong> <strong>Freight</strong> <strong>Study</strong>Alternatives AnalysisFigure 7-9: Avg. Daily Trains for Planning Case B2 (Possible Austin Bypass)(note: conceptual bypass route shown is for illustrative purposes only)7 - 32
<strong>San</strong> <strong>An<strong>to</strong>nio</strong> <strong>Region</strong> <strong>Freight</strong> <strong>Study</strong>Alternatives AnalysisPublic Benefit AnalysisThe potential public benefits associated with <strong>the</strong> relocation of through-freight railservices from existing rail lines in <strong>the</strong> region <strong>to</strong> an Austin bypass (Taylor-Seguin)would be similar <strong>to</strong> those of <strong>the</strong> <strong>San</strong> <strong>An<strong>to</strong>nio</strong> bypass such as reductions in vehiculardelays, safety hazards (including roadway-railroad crossings as well as reducedhazardous material exposure), vehicle and locomotive emissions, and fuel usage, inaddition <strong>to</strong> <strong>the</strong> possible implementation of commuter rail services in <strong>the</strong> existingcorridor.Commuter rail service between Austin and <strong>San</strong> <strong>An<strong>to</strong>nio</strong> has been desired for sometime, and relocation of through-trains <strong>to</strong> a bypass would allow for <strong>the</strong>se plans <strong>to</strong>materialize. The relocation of freight rail operations would lessen grade crossingimpedance, provide an alternative <strong>to</strong> vehicular travel, and capture <strong>the</strong> benefits oftransit-oriented development.Grade Crossing Impedance ReductionThe Austin bypass was shown <strong>to</strong> benefit <strong>the</strong> public by reducing train traffic and<strong>the</strong>refore delay and safety hazards through urban and residential areas including<strong>San</strong> Marcos and Austin. Like <strong>the</strong> <strong>San</strong> <strong>An<strong>to</strong>nio</strong> bypass, an Austin bypass wouldimpose a public cost burden due <strong>to</strong> <strong>the</strong> introduction of train traffic between Taylorand Seguin; however, this burden is offset by a reduction in <strong>the</strong> public burdenassociated with roadway-railroad crossings along <strong>the</strong> existing Austin Subdivisionmainlines.The estimated public benefit of an Austin bypass resulting from <strong>the</strong> reduction inpublic burden associated with <strong>the</strong> at-grade roadway-railroad crossings in <strong>the</strong> regionwas calculated <strong>to</strong> be approximately $6.5 million for Planning Case B1 and $263million for Planning Case B2, as shown in Tables 7-14 and 7-15, respectively. Thepublic benefits shown in Tables 7-14 and 7-15 extend beyond <strong>the</strong> <strong>San</strong> <strong>An<strong>to</strong>nio</strong> studyarea <strong>to</strong> include benefits in Hays, Travis, and Williamson Counties, since <strong>the</strong> impac<strong>to</strong>f <strong>the</strong> bypass is not restricted <strong>to</strong> <strong>the</strong> <strong>San</strong> <strong>An<strong>to</strong>nio</strong> area.7 - 33
<strong>San</strong> <strong>An<strong>to</strong>nio</strong> <strong>Region</strong> <strong>Freight</strong> <strong>Study</strong>Alternatives AnalysisRailroad SubdivisionNo-BuildScenarioBypassScenario (B1)Bypass Benefit(difference)Austin Subdivision (<strong>San</strong> Marcos <strong>to</strong>Williamson County Line) $297,030,000 $126,270,000 $170,760,000Austin No 1 (<strong>San</strong> Marcos <strong>to</strong>Downotwn <strong>San</strong> <strong>An<strong>to</strong>nio</strong>) $454,610,000 $165,120,000 $289,490,000Austin No 2 (<strong>San</strong> Marcos <strong>to</strong>Downotwn <strong>San</strong> <strong>An<strong>to</strong>nio</strong>) $91,390,000 $10,910,000 $80,480,000Corpus Christi (Down<strong>to</strong>wn <strong>San</strong><strong>An<strong>to</strong>nio</strong> <strong>to</strong> Toyota Plant) $78,170,000 $122,930,000 -$44,760,000Del Rio (Kirby <strong>to</strong> Macdona) $324,240,000 $618,860,000 -$294,620,000Giddings (Fla<strong>to</strong>nia <strong>to</strong> Mumford) $18,990,000 $11,630,000 $7,360,000Glidden (Fla<strong>to</strong>nia <strong>to</strong> Kirby) $92,530,000 $114,220,000 -$21,690,000Kerrville $143,190,000 $129,060,000 $14,130,000Laredo (Down<strong>to</strong>wn <strong>San</strong> <strong>An<strong>to</strong>nio</strong> <strong>to</strong>Gessner) $123,390,000 $262,650,000 -$139,260,000Lockhart (<strong>San</strong> Marcos <strong>to</strong> Smithville) $44,130,000 $18,830,000 $25,300,000Rockport $34,290,000 $33,310,000 $980,000Waco (Smithville <strong>to</strong> Taylor) $8,720,000 $7,670,000 $1,050,000Sub<strong>to</strong>tal: $1,710,680,000 $1,621,460,000 $89,220,000Possible Bypass without GradeSeparations $0 $82,750,000 -$82,750,000Total (without grade separations on bypass)$6,470,000Possible Bypass with GradeSeparations $0 $29,900,000 -$29,900,000$59,320,000Total (with grade separations on bypass)Table 7-14: Planning Case B1 Public Costs at Roadway-Railroad Crossings (for a20-year period)7 - 34
<strong>San</strong> <strong>An<strong>to</strong>nio</strong> <strong>Region</strong> <strong>Freight</strong> <strong>Study</strong>Alternatives AnalysisRailroad SubdivisionNo-BuildScenarioBypassScenario (B2)Bypass Benefit(difference)Austin Subdivision (<strong>San</strong> Marcos <strong>to</strong>Williamson County Line) $297,030,000 $126,270,000 $170,760,000Austin No 1 (<strong>San</strong> Marcos <strong>to</strong>Downotwn <strong>San</strong> <strong>An<strong>to</strong>nio</strong>) $454,610,000 $165,120,000 $289,490,000Austin No 2 (<strong>San</strong> Marcos <strong>to</strong>Downotwn <strong>San</strong> <strong>An<strong>to</strong>nio</strong>) $91,390,000 $10,410,000 $80,980,000Corpus Christi (Down<strong>to</strong>wn <strong>San</strong><strong>An<strong>to</strong>nio</strong> <strong>to</strong> Toyota Plant) $78,170,000 $122,930,000 -$44,760,000Del Rio (Kirby <strong>to</strong> Macdona) $324,240,000 $362,640,000 -$38,400,000Giddings (Fla<strong>to</strong>nia <strong>to</strong> Mumford) $18,990,000 $11,630,000 $7,360,000Glidden (Fla<strong>to</strong>nia <strong>to</strong> Kirby) $92,530,000 $114,220,000 -$21,690,000Kerrville $143,190,000 $129,060,000 $14,130,000Laredo (Down<strong>to</strong>wn <strong>San</strong> <strong>An<strong>to</strong>nio</strong> <strong>to</strong>Gessner) $123,390,000 $262,650,000 -$139,260,000Lockhart (<strong>San</strong> Marcos <strong>to</strong> Smithville) $44,130,000 $18,830,000 $25,300,000Rockport $34,290,000 $33,310,000 $980,000Waco (Smithville <strong>to</strong> Taylor) $8,720,000 $7,670,000 $1,050,000Sub<strong>to</strong>tal: $1,710,680,000 $1,364,740,000 $345,940,000Possible Bypass without GradeSeparations $0 $82,750,000 -$82,750,000Total (without grade separations on bypass)$263,190,000Possible Bypass with GradeSeparations $0 $29,900,000 -$29,900,000$316,040,000Total (with grade separations on bypass)Table 7-15: Planning Case B2 Public Costs at Roadway-Railroad Crossings (for a20-year period)As modeled, <strong>the</strong> Laredo and Corpus Christi Subdivisions showed a decrease inaverage train speeds from <strong>the</strong> base case, which increased <strong>the</strong> public burdenassociated with at-grade crossing delays. These train speed decreases may beassociated with <strong>the</strong> logic used in <strong>the</strong> RTC model when prioritizing train movementsin<strong>to</strong> and out of <strong>the</strong> So<strong>San</strong> Yard area. However, given <strong>the</strong> magnitude of <strong>the</strong> trainspeed decreases, <strong>the</strong> existing operating plan may require review and reprioritization,which may in turn increase train speeds on <strong>the</strong> Laredo and Corpus ChristiSubdivisions and reduce <strong>the</strong> associated public burden shown in Tables 7-14 and 7-15.The public cost burden due <strong>to</strong> <strong>the</strong> introduction of train traffic on a new Taylor <strong>to</strong>Seguin route, shown in Tables 7-14 and 7-15 as nearly $83 million, would bereduced by grade separating some of <strong>the</strong> roadway-railroad crossings along <strong>the</strong>corridor. Crossings along <strong>the</strong> route were analyzed and determined <strong>to</strong> be candidatesfor potential grade separation based on traffic flow volumes for both vehicular andtrain traffic. The potential grade separations are listed in Table 7-16 with <strong>the</strong>irassociated average daily traffic volumes for vehicles (AADT) and trains, as well as<strong>the</strong>ir estimated costs, and estimated public benefits. Certain crossings along <strong>the</strong>7 - 35
<strong>San</strong> <strong>An<strong>to</strong>nio</strong> <strong>Region</strong> <strong>Freight</strong> <strong>Study</strong>Alternatives Analysisroute may be required <strong>to</strong> be grade separated in order <strong>to</strong> comply with FHWAregulations.In all, <strong>the</strong> grade separations identified would reduce <strong>the</strong> public cost burden of <strong>the</strong>possible bypass route by approximately $53 million, <strong>the</strong>reby increasing <strong>the</strong> publicbenefit of <strong>the</strong> bypass <strong>to</strong> more than $59 million for Planning Case B1 as shown inTable 7-14 and $316 million for Planning Case B2 as shown in Table 7-15.The public costs and benefits shown in Table 7-15 for Planning Case B2 assume <strong>the</strong>grade separation of two crossings (Hous<strong>to</strong>n Street and Presa Street) and <strong>the</strong> closureof one crossing (Hoefgen Street) on <strong>the</strong> Austin Subdivision ML 2 between <strong>the</strong> DelRio Subdivision and Tower 112. Since Planning Case B2 would add approximately47 average daily trains <strong>to</strong> this rail segment, leaving <strong>the</strong>se three crossings at-gradewould result in a net public burden of nearly $9 million on <strong>the</strong> Austin Subdivision ML2 as opposed <strong>to</strong> <strong>the</strong> nearly $81 million benefit shown in Table 7-15.Street Name City Name AADTEstimatedCost20-YearBenefit (2007Benfit/ CostRatiodollars)SH 80 Prairie Lea 5,300 $8,000,000 $2,720,000 0.34US HWY 183 Lockhart 14,900 $6,000,000 $9,530,000 1.59FM 20 Lockhart 5,500 $6,000,000 $2,820,000 0.47FM 812 Cedar Creek 4,600 $8,000,000 $2,190,000 0.27SH 21 Cedar Creek 8,200 $8,000,000 $3,960,000 0.50SH 71 Cedar Creek 28,700 $12,000,000 $15,070,000 1.26US HWY 290 Littig 26,700 $12,000,000 $13,600,000 1.13SH 95 (Main Street) Taylor 6,300 $8,000,000 $2,960,000 0.37Total:$68,000,000 $52,850,000 0.78Table 7-16: Potential Grade Separations on <strong>the</strong> Possible Austin Bypass Route(Taylor <strong>to</strong> Seguin)Like <strong>the</strong> <strong>San</strong> <strong>An<strong>to</strong>nio</strong> bypass, <strong>the</strong> public benefit of <strong>the</strong> Austin bypass shown inTables 7-14 and 7-15 is <strong>the</strong> result of <strong>the</strong> relocation of freight trains out of urban andresidential areas on<strong>to</strong> <strong>the</strong> bypass that runs through more rural areas.Reduced Locomotive EmissionsAlso like <strong>the</strong> <strong>San</strong> <strong>An<strong>to</strong>nio</strong> bypass, <strong>the</strong> Austin bypass provides additional publicbenefit in <strong>the</strong> form of reduced locomotive emissions (pollutants) in <strong>the</strong> region.Planning Case B provides a public benefit from reduced locomotive emissions over<strong>the</strong> 20-year study period of nearly $17 million as shown in Table 7-17.Existing Rail Corridor Value (Commuter Rail)Additionally, an Austin bypass provides public benefit due <strong>to</strong> <strong>the</strong> potential for <strong>the</strong>implementation of a commuter rail system that accompanies Planning Case B. Thepublic benefits associated with <strong>the</strong> implementation of commuter rail include vehiclereduction on regional roadways, increased property values, and increased propertytax revenue. The commuter rail system would also have an associated publicburden due <strong>to</strong> <strong>the</strong> introduction of additional rail traffic (passenger trains) on existingrail lines, <strong>the</strong>reby by impacting impedance at roadway-rail crossings. However, <strong>the</strong>7 - 36
<strong>San</strong> <strong>An<strong>to</strong>nio</strong> <strong>Region</strong> <strong>Freight</strong> <strong>Study</strong>Alternatives Analysisburden would be offset by <strong>the</strong> benefits of commuter rail previously listed for acumulative public benefit of more than $510 million over <strong>the</strong> 20-year study period.The methodology used in <strong>the</strong> analysis of public benefits of commuter rail systems isdiscussed in greater detail in <strong>the</strong> analysis of public benefits of Planning Case C,which is located later in this section. The <strong>to</strong>tal public benefits are shown in Table 7-17 for Planning Case B.Public Sec<strong>to</strong>r Benefits ($ million)Commuter Rail System: B1 B2Vehicle Reduction 67.37 67.37Facility Value 284.76 284.76Property Value 106.00 106.00Additions <strong>to</strong> Property Tax Revenue 80.74 80.74Grade Crossing Impedance (Commuter) -27.95 -27.95Grade Crossing Impedance (<strong>Freight</strong>) 59.32 316.04Locomotive Emssions Reduction 16.86 16.50Total ($ million) 587.10 843.46Table 7-17: Public Benefits for Planning Cases B1 and B2Private Benefit AnalysisPlanning Case B provides significant performance benefits compared with <strong>the</strong> basecase. Run time and s<strong>to</strong>p time are reduced, and <strong>the</strong> delay ratio improves. Minutes ofdelay per 100 train miles drops, and average train speeds over <strong>the</strong> entire networkincrease. The addition of <strong>the</strong> possible bypass <strong>to</strong> <strong>the</strong> network removes more trainsfrom <strong>the</strong> existing trackage, with a consequent reduction in conflicts and delays <strong>to</strong> <strong>the</strong>trains that remain on existing trackage.Table 7-18 compares <strong>the</strong> simulation results of <strong>the</strong> base case <strong>to</strong> Planning Cases B1and B2, and lists <strong>the</strong> net change in each RTC simulation parameter that is expected<strong>to</strong> occur upon implementation of each planning case. For example, construction of<strong>the</strong> possible Austin bypass from Taylor <strong>to</strong> Seguin would likely reduce <strong>to</strong>tal run timeby up <strong>to</strong> 52 daily hours and delay time by up <strong>to</strong> 28 hours per day, depending onwhe<strong>the</strong>r trains are routed via Planning Case B1 or B2. The RTC results also showthat Planning Cases B1 and B2 would reduce <strong>the</strong> net train miles traveled as well asfuel consumption despite an increase in actual route miles from <strong>the</strong> existing network.This net reduction is due primarily <strong>to</strong> a reduction in local train miles traveled inPlanning Cases B1 and B2.7 - 37
<strong>San</strong> <strong>An<strong>to</strong>nio</strong> <strong>Region</strong> <strong>Freight</strong> <strong>Study</strong>Alternatives AnalysisRTC Performance MeasureBase CaseResultsPlanning CaseB1 ResultsPlanning CaseB2 ResultsNetChange(B1)NetChange(B2)Trains Operated (28 days) 2,891 2,888 2,888 -3 -3Train Miles (28 Days) 359,028 357,047 356,965 -1,981 -2,063Total Run Time Hours (Avg. Daily Hours) 496.2 443.9 444.9 -52.3 -51.3Delay Time Hours (Avg. Daily Hours) 86.6 58.55 60.74 -28.1 -25.9Delay Percentage 17.50% 13.2% 13.7% -4.3% -3.8%Delay Minutes/100 Train Miles 40.52 27.6 28.6 -12.9 -11.9Average Speed 25.8 28.7 28.7 2.9 2.9Fuel (gallons) 2,956,784 2,956,571 2,955,889 -213 -895Gallons/Train Mile 8.2 8.3 8.3 0.1 0.1Table 7-18: RTC Planning Cases B1 and B2 SummaryTable 7-19 shows <strong>the</strong> economic benefit <strong>to</strong> <strong>the</strong> private sec<strong>to</strong>r over a 20-year studyperiod, based on changes in performance measures attributable <strong>to</strong> Planning CasesB1 and B2 as shown in Table 7-18. The methodology used in <strong>the</strong> analysis of privatebenefits is discussed in greater detail in section 10.Relocation of train traffic <strong>to</strong> an outer Austin bypass in Planning Case B1 decreases20-year train mileage costs by $14.33 million and decreases fuel costs by $0.10million over this same period when discounted at a nominal cost of capital of 6.68percent. This planning case also reduces 20-year run time and delay time costs by$84.44 million and $44.94 million respectively, resulting in a benefit (i.e., savingsminus costs) of approximately $144 million over <strong>the</strong> project life. This Austin bypassroute also provides a benefit in <strong>the</strong> form of reduced track maintenance and gradecrossing accident costs of $13.83 million and $4.35 million, respectively. The <strong>to</strong>talof all private sec<strong>to</strong>r savings associated with Planning Case B1 are nearly $162million.Relocation of train traffic <strong>to</strong> an outer Austin bypass in Planning Case B2 decreases20-year train mileage costs by $14.92 million and decreases fuel costs by $0.42million over this same period when discounted at a nominal cost of capital of 6.68percent. This planning case also reduces 20-year run time and delay time costs by$82.82 million and $41.54 million respectively, resulting in a benefit (i.e., savingsminus costs) of approximately $140 million over <strong>the</strong> project life. This Austin bypassroute also provides a benefit in <strong>the</strong> form of reduced track maintenance and gradecrossing accident costs of $13.83 million and $4.35 million, respectively. The <strong>to</strong>talof all private sec<strong>to</strong>r savings associated with Planning Case B2 are nearly $158million.7 - 38
<strong>San</strong> <strong>An<strong>to</strong>nio</strong> <strong>Region</strong> <strong>Freight</strong> <strong>Study</strong>Alternatives AnalysisPrivate Sec<strong>to</strong>r Benefits ($ million)<strong>Freight</strong> Rail Operations: B1 B2Train Miles 14.33 14.92Run Time 84.44 82.82Delay Time 44.94 41.54Fuel 0.10 0.42Track Maintenance Savings 13.83 13.83Grade Crossing Accident Avoidance 4.35 4.35Total ($ million) 161.99 157.89Table 7-19: Private Benefits for Planning Cases B1 and B2Planning Case C – <strong>San</strong> <strong>An<strong>to</strong>nio</strong> and Austin BypassPlanning Case C analyzed <strong>the</strong> base case plus possible <strong>San</strong> <strong>An<strong>to</strong>nio</strong> and Austinbypasses from Taylor <strong>to</strong> Macdona and new yards at Marion and Macdona. TheAustin bypass in conjunction with <strong>the</strong> <strong>San</strong> <strong>An<strong>to</strong>nio</strong> bypass would allow through-trainsthat are typically routed on <strong>the</strong> UP Austin, Glidden, Del Rio, Laredo, Corpus Christi,Rockport, and Lockhart Subdivisions <strong>to</strong> be rerouted on<strong>to</strong> <strong>the</strong> bypass away from largemetropolitan areas. The conceptual location of an Austin-<strong>San</strong> <strong>An<strong>to</strong>nio</strong> bypass isshown in Figure 7-10. Planning Case C also includes upgrades <strong>to</strong> existing trackbetween Marion and <strong>the</strong> connection with <strong>the</strong> possible Austin bypass in Seguin. Theestimated cost of Planning Case C is more than $2.42 billion, including <strong>the</strong> cost ofidentified grade separated roadway and rail crossings.Although Amtrak passenger trains, rock trains, au<strong>to</strong> trains destined for Kirby Yard in<strong>San</strong> <strong>An<strong>to</strong>nio</strong>, local service trains, and a minimal number of coal trains must remainon <strong>the</strong> existing rail lines, all o<strong>the</strong>r trains on <strong>the</strong> network may be able <strong>to</strong> be rerouted <strong>to</strong><strong>the</strong> Austin-<strong>San</strong> <strong>An<strong>to</strong>nio</strong> bypass.7 - 39
<strong>San</strong> <strong>An<strong>to</strong>nio</strong> <strong>Region</strong> <strong>Freight</strong> <strong>Study</strong>Alternatives AnalysisFigure 7-10: Possible Austin-<strong>San</strong> <strong>An<strong>to</strong>nio</strong> Bypass(note: conceptual bypass route shown is for illustrative purposes only)Table 7-20 and Figure 7-12 <strong>the</strong> daily train counts on existing subdivisions for <strong>the</strong>base case (no-build) scenario and <strong>the</strong> possible Austin-<strong>San</strong> <strong>An<strong>to</strong>nio</strong> bypass scenario,as well as <strong>the</strong> projected percent reduction in daily trains on existing lines resultingfrom <strong>the</strong> possible bypass route. As shown in Table 7-20, <strong>the</strong> Austin-<strong>San</strong> <strong>An<strong>to</strong>nio</strong>7 - 40
<strong>San</strong> <strong>An<strong>to</strong>nio</strong> <strong>Region</strong> <strong>Freight</strong> <strong>Study</strong>Alternatives Analysisbypass route is projected <strong>to</strong> provide reductions in daily train volumes from 3 <strong>to</strong> 24daily trains (11 <strong>to</strong> 90 percent) on existing lines running through <strong>San</strong> <strong>An<strong>to</strong>nio</strong>, NewBraunfels, <strong>San</strong> Marcos, Austin, and various o<strong>the</strong>r cities, depending on location.Railroad SubdivisionAverage Daily TrainsBase Case Bypass CasePercentChangePossible Austin-<strong>San</strong> <strong>An<strong>to</strong>nio</strong> Bypass,Taylor <strong>to</strong> Seguin N/A 29 100%Possible Austin-<strong>San</strong> <strong>An<strong>to</strong>nio</strong> Bypass,Seguin <strong>to</strong> Macdona N/A 42 100%Austin Subdivision ML 1, East of Taylor 22 33 50%Austin Subdivision ML 1, Taylor <strong>to</strong>Round Rock 30 12 -60%Austin Subdivision ML 1, Round Rock <strong>to</strong><strong>San</strong> Marcos 25 7 -72%Austin Subdivision ML 1 and 2, <strong>San</strong>Marcos <strong>to</strong> Garden Ridge 36 12 -67%Austin Subdivision ML 1, Garden Ridge<strong>to</strong> <strong>San</strong> <strong>An<strong>to</strong>nio</strong> (Twr 105) 22 7 -68%Austin Subdivision ML 2, Garden Ridge<strong>to</strong> Del Rio Sub 10 1 -90%Austin Subdivision ML 2, Del Rio Sub <strong>to</strong>Down<strong>to</strong>wn <strong>San</strong> <strong>An<strong>to</strong>nio</strong> (Twr 112) 10 1 -90%Corpus Christi Subdivision, So<strong>San</strong> Yard<strong>to</strong> Toyota Plant 13 4 -69%Del Rio Subdivision, Kirby <strong>to</strong> Down<strong>to</strong>wn<strong>San</strong> <strong>An<strong>to</strong>nio</strong> (Twr 105) 35 14 -60%Del Rio Subdivision, Down<strong>to</strong>wn <strong>San</strong><strong>An<strong>to</strong>nio</strong> (Twr 105) <strong>to</strong> Macdona 24 4 -83%Glidden Subdivision, Fla<strong>to</strong>nia <strong>to</strong> Seguin 27 24 -11%Glidden Subdivision, Seguin <strong>to</strong> Kirby 27 14 -48%Laredo Subdivision, <strong>San</strong> <strong>An<strong>to</strong>nio</strong> <strong>to</strong>Gessner 18 2 -89%Lockhart Subdivision, <strong>San</strong> Marcos <strong>to</strong>West Point 12 5 -58%Table 7-20: Daily Train Counts and Percent Change Resulting from Possible Austin-<strong>San</strong> <strong>An<strong>to</strong>nio</strong> Bypass7 - 41
<strong>San</strong> <strong>An<strong>to</strong>nio</strong> <strong>Region</strong> <strong>Freight</strong> <strong>Study</strong>Alternatives AnalysisFigure 7-11: Average Daily Trains Counts for Base Case Scenario (No-Build)7 - 42
<strong>San</strong> <strong>An<strong>to</strong>nio</strong> <strong>Region</strong> <strong>Freight</strong> <strong>Study</strong>Alternatives AnalysisFigure 7-12: Average Daily Trains Counts for Austin-<strong>San</strong> <strong>An<strong>to</strong>nio</strong> Bypass Scenario(note: conceptual bypass route shown is for illustrative purposes only)7 - 43
<strong>San</strong> <strong>An<strong>to</strong>nio</strong> <strong>Region</strong> <strong>Freight</strong> <strong>Study</strong>Alternatives AnalysisPublic Benefit AnalysisThe benefits of a rail bypass <strong>to</strong> <strong>the</strong> public are associated with <strong>the</strong> reduced interactionof vehicles with trains and <strong>the</strong> opportunity <strong>to</strong> improve urban areas that are o<strong>the</strong>rwisenot possible due <strong>to</strong> existing freight rail operations. The potential public benefitsassociated with an Austin-<strong>San</strong> <strong>An<strong>to</strong>nio</strong> bypass include those listed previously for <strong>the</strong><strong>San</strong> <strong>An<strong>to</strong>nio</strong> bypass and <strong>the</strong> Austin bypass.Commuter rail service between Austin and <strong>San</strong> <strong>An<strong>to</strong>nio</strong> has been desired for sometime, and relocation of through-trains <strong>to</strong> a bypass would allow for <strong>the</strong>se plans <strong>to</strong>materialize. The relocation of freight rail operations would lessen grade crossingimpedance, provide an alternative <strong>to</strong> vehicular travel, and capture <strong>the</strong> benefits oftransit-oriented development.Grade Crossing Impedance ReductionThe Austin-<strong>San</strong> <strong>An<strong>to</strong>nio</strong> bypass was shown <strong>to</strong> benefit <strong>the</strong> public by reducing traintraffic and associated safety hazards and delays through urban and residential areasincluding <strong>San</strong> <strong>An<strong>to</strong>nio</strong>, <strong>San</strong> Marcos, New Braunfels, and Austin. The possiblebypass imposes a public cost burden due <strong>to</strong> <strong>the</strong> introduction of train traffic on <strong>the</strong>possible new Taylor <strong>to</strong> Macdona route; however, this burden is offset by a reductionin <strong>the</strong> public burden associated with roadway-railroad crossings along <strong>the</strong> existingsubdivisions such as <strong>the</strong> Austin and Del Rio Subdivisions.The estimated public benefit of an Austin-<strong>San</strong> <strong>An<strong>to</strong>nio</strong> bypass (from Taylor <strong>to</strong>Macdona) resulting from <strong>the</strong> reduction in public burden associated with <strong>the</strong> at-graderoadway-railroad crossings in <strong>the</strong> region was calculated <strong>to</strong> be approximately $632million, as shown in Table 7-21.7 - 44
<strong>San</strong> <strong>An<strong>to</strong>nio</strong> <strong>Region</strong> <strong>Freight</strong> <strong>Study</strong>Alternatives AnalysisRailroad SubdivisionNo-BuildScenarioBypassScenario (C)Bypass Benefit(difference)Austin Subdivision (<strong>San</strong> Marcos <strong>to</strong>Williamson County Line) $297,030,000 $128,490,000 $168,540,000Austin No 1 (<strong>San</strong> Marcos <strong>to</strong>Downotwn <strong>San</strong> <strong>An<strong>to</strong>nio</strong>) $454,610,000 $140,720,000 $313,890,000Austin No 2 (<strong>San</strong> Marcos <strong>to</strong>Downotwn <strong>San</strong> <strong>An<strong>to</strong>nio</strong>) $91,390,000 $6,490,000 $84,900,000Corpus Christi (Down<strong>to</strong>wn <strong>San</strong><strong>An<strong>to</strong>nio</strong> <strong>to</strong> Toyota Plant) $78,170,000 $86,870,000 -$8,700,000Del Rio (Kirby <strong>to</strong> Macdona) $324,240,000 $114,310,000 $209,930,000Giddings (Fla<strong>to</strong>nia <strong>to</strong> Mumford) $18,990,000 $11,570,000 $7,420,000Glidden (Fla<strong>to</strong>nia <strong>to</strong> Kirby) $92,530,000 $47,180,000 $45,350,000Kerrville $143,190,000 $107,920,000 $35,270,000Laredo (Down<strong>to</strong>wn <strong>San</strong> <strong>An<strong>to</strong>nio</strong> <strong>to</strong>Gessner) $123,390,000 $39,380,000 $84,010,000Lockhart (<strong>San</strong> Marcos <strong>to</strong> Smithville) $44,130,000 $18,470,000 $25,660,000Rockport $34,290,000 $41,190,000 -$6,900,000Waco (Smithville <strong>to</strong> Taylor) $8,720,000 $7,660,000 $1,060,000Sub<strong>to</strong>tal: $1,710,680,000 $750,250,000 $960,430,000Possible Bypass without GradeSeparations $0 $327,920,000 -$327,920,000Total (without grade separations on bypass)$632,510,000Possible Bypass with GradeSeparations $0 $65,500,000 -$65,500,000$894,930,000Total (with grade separations on bypass)Table 7-21: Public Costs at Roadway-Railroad Crossings (for a 20-year period)The construction of a rail bypass would prevent through-trains from blocking existinggrade crossings and, consequently, reduce <strong>the</strong> impedance of vehicles and <strong>the</strong>refore<strong>the</strong> public costs associated with <strong>the</strong> crossings as shown in Table 7-21. The publicbenefits associated with reduced impedance are measured as reductions in <strong>the</strong>generation of emissions, <strong>the</strong> consumption of volatile organic compounds (fuel andoil), and <strong>the</strong> loss of time by vehicles idling at grade crossings. The discounted valueof grade crossing impedance reduction for <strong>the</strong> possible Austin-<strong>San</strong> <strong>An<strong>to</strong>nio</strong> bypassis included as part of <strong>the</strong> net present value analysis provided in Appendix G.The public cost burden due <strong>to</strong> <strong>the</strong> introduction of train traffic on <strong>the</strong> possible newTaylor <strong>to</strong> Macdona route, shown in Table 7-21 as nearly $328 million, would besignificantly reduced by grade separating or closing some of <strong>the</strong> roadway-railroadcrossings along <strong>the</strong> possible bypass route. Interstate crossings along <strong>the</strong> route suchas I-35, I-37, and I-10 would be required <strong>to</strong> be grade separated in order <strong>to</strong> complywith FHWA regulations.Additional crossings along <strong>the</strong> route were determined <strong>to</strong> be candidates for potentialgrade separation based on traffic flow volumes for both vehicular and train traffic arelisted in Table 7-22. In all, <strong>the</strong> grade separations identified would reduce <strong>the</strong> publiccost burden of <strong>the</strong> bypass route by approximately $262.4 million, <strong>the</strong>reby increasing7 - 45
<strong>San</strong> <strong>An<strong>to</strong>nio</strong> <strong>Region</strong> <strong>Freight</strong> <strong>Study</strong>Alternatives Analysis<strong>the</strong> public benefit of <strong>the</strong> bypass over a 20-year period <strong>to</strong> more than $894 million asshown in Table 7-22.Street Name City Name AADTEstimatedCost20-Year Benefit(2007 dollars)Benfit/ CostRatioIH 35 (Mainlanes and frontageroads) <strong>San</strong> <strong>An<strong>to</strong>nio</strong> 44,500 $16,000,000 $47,210,000 2.95FM 2790 (Somerset Road) <strong>San</strong> <strong>An<strong>to</strong>nio</strong> 5,200 $8,000,000 $3,530,000 0.44SH 16 <strong>San</strong> <strong>An<strong>to</strong>nio</strong> 19,400 $8,000,000 $13,700,000 1.71US HWY 281 Cassin 14,000 $12,000,000 $10,410,000 0.87IH 37 (Mainlanes and frontageroads) Buena Vista 49,000 $16,000,000 $62,550,000 3.91Loop 1604 Buena Vista 5,000 $8,000,000 $4,110,000 0.51US HWY 181 Saspamco 18,400 $12,000,000 $13,850,000 1.15FM 3432 (Sulphur SpringsRoad) La Vernia 3,300 $8,000,000 $2,410,000 0.30US HWY 87 Adkins 10,500 $12,000,000 $7,150,000 0.60FM 1346 St. Hedwig 1,900 $5,000,000 $1,370,000 0.27IH 10 (Mainlanes and frontageroads) <strong>San</strong>ta Clara 36,500 $16,000,000 $36,490,000 2.28FM 78 McQueeney 5,500 $8,000,000 $4,020,000 0.50SH 46 McQueeney 13,900 $10,000,000 $970,000 0.10SH 123 (Austin Street) Geronimo 14,000 $8,000,000 $970,000 0.12SH 80 Prairie Lea 5,300 $8,000,000 $2,680,000 0.34US HWY 183 Lockhart 14,900 $6,000,000 $9,430,000 1.57FM 20 Lockhart 5,500 $6,000,000 $2,790,000 0.47FM 812 Cedar Creek 4,600 $8,000,000 $2,230,000 0.28SH 21 Cedar Creek 8,200 $8,000,000 $4,050,000 0.51SH 71 Cedar Creek 28,700 $12,000,000 $15,490,000 1.29US HWY 290 Littig 26,700 $12,000,000 $13,980,000 1.17SH 95 (Main Street) Taylor 6,300 $8,000,000 $3,030,000 0.38Total:$215,000,000 $262,420,000 1.22Table 7-22: Potential Grade Separations on <strong>the</strong> Possible Austin-<strong>San</strong> <strong>An<strong>to</strong>nio</strong> BypassRoute (Taylor <strong>to</strong> Macdona)The public benefit of <strong>the</strong> possible Austin-<strong>San</strong> <strong>An<strong>to</strong>nio</strong> bypass shown in Table 7-21 is<strong>the</strong> result of <strong>the</strong> relocation of freight trains out of urban and residential areas on<strong>to</strong> <strong>the</strong>bypass that runs through primarily rural areas.Reduced Locomotive EmissionsAlso like <strong>the</strong> <strong>San</strong> <strong>An<strong>to</strong>nio</strong> bypass, <strong>the</strong> Austin bypass provides additional publicbenefit in <strong>the</strong> form of reduced locomotive emissions (pollutants) in <strong>the</strong> region.Planning Case C provides a public benefit from reduced locomotive emissions over<strong>the</strong> 20-year study period of $19 million as shown in Table 7-23.Existing Rail Corridor Value (Commuter Rail)Additionally, an Austin-<strong>San</strong> <strong>An<strong>to</strong>nio</strong> bypass would provide public benefit due <strong>to</strong> <strong>the</strong>potential for <strong>the</strong> implementation of a commuter rail system that accompaniesPlanning Case C. The public benefits associated with <strong>the</strong> implementation ofcommuter rail include vehicle reduction on regional roadways, increased propertyvalues, and increased property tax revenue. The commuter rail system would also7 - 46
<strong>San</strong> <strong>An<strong>to</strong>nio</strong> <strong>Region</strong> <strong>Freight</strong> <strong>Study</strong>Alternatives Analysishave an associated public burden due <strong>to</strong> <strong>the</strong> introduction of additional rail traffic(passenger trains) on existing rail lines, <strong>the</strong>reby impacting impedance at roadwayrailcrossings. However, <strong>the</strong> burden would be offset by <strong>the</strong> benefits of commuter railpreviously listed for a cumulative public benefit of more than $510 million over <strong>the</strong>20-year study period. The methodology used in <strong>the</strong> analysis of public benefits ofcommuter rail systems is discussed in greater detail in section 10 of this report.Table 7-23 lists <strong>the</strong> public benefits associated with Planning Case C including <strong>the</strong>benefits of grade crossing impedance reduction, <strong>the</strong> potential for implementation of acommuter rail system, and locomotive emissions reduction, for a <strong>to</strong>tal value of morethan $1.42 billion.Public Sec<strong>to</strong>r Benefits ($ million)Commuter Rail System:Vehicle Reduction 67.37Facility Value 284.76Property Value 106.00Additions <strong>to</strong> Property Tax Revenue 80.74Grade Crossing Impedance (Commuter) -27.95Grade Crossing Impedance (<strong>Freight</strong>) 894.93Locomotive Emssions Reduction 19.10Total ($ million) 1424.95Table 7-23: Public Benefits for Planning Case CPrivate Benefit AnalysisThe benefits of a rail bypass <strong>to</strong> UP are generally associated with improved operatingand maintenance conditions, as reflected by savings in time and cost. A sufficientlydesigned facility will also reduce <strong>the</strong> railroad’s exposure <strong>to</strong> grade crossing incidentsand eliminate <strong>the</strong> related damages <strong>to</strong> property.Table 7-24 compares <strong>the</strong> simulation results of <strong>the</strong> base case <strong>to</strong> Planning Case C,and lists <strong>the</strong> net change in each RTC simulation parameter that is expected <strong>to</strong> occurupon implementation of this planning case. For example, construction of <strong>the</strong>possible Taylor-<strong>San</strong> <strong>An<strong>to</strong>nio</strong> bypass will likely increase operating distances by 6,500train miles over a 28-day period, resulting in <strong>the</strong> consumption of approximately59,613 additional gallons of diesel fuel over <strong>the</strong> same time period. On <strong>the</strong> o<strong>the</strong>rhand, this planning case should reduce <strong>to</strong>tal run time and delay time by 63 and 24hours, respectively.7 - 47
<strong>San</strong> <strong>An<strong>to</strong>nio</strong> <strong>Region</strong> <strong>Freight</strong> <strong>Study</strong>Alternatives AnalysisRTC Performance MeasureBase CaseResultsPlanning CaseC ResultsNetChangeTrains Operated (28 days) 2,891 2,663 -228Train Miles (28 Days) 359,028 365,528 6,500Total Run Time Hours (Avg. Daily Hours) 496.2 433.6 -62.6Delay Time Hours (Avg. Daily Hours) 86.6 62.6 -24.0Delay Percentage 17.50% 14.4% -3.1%Delay Minutes/100 Train Miles 40.52 28.78 -11.7Average Speed 25.8 30.1 4.3Fuel (gallons) 2,956,784 3,016,397 59,613Gallons/Train Mile 8.2 8.3 0.1Table 7-24: RTC Planning Case C SummaryTable 7-25 shows <strong>the</strong> economic benefit <strong>to</strong> <strong>the</strong> private sec<strong>to</strong>r over a 20-year studyperiod, based on changes in performance measures attributable <strong>to</strong> Planning CaseC. Relocation of train traffic <strong>to</strong> an outer Austin-<strong>San</strong> <strong>An<strong>to</strong>nio</strong> bypass in PlanningCase C increases 20-year train mileage costs by $47.02 million and increases fuelcosts by $28.03 million over this same period when discounted at a nominal cost ofcapital of 6.68 percent. This planning case also reduces 20-year run time and delaytime costs by $101.06 million and $38.57 million respectively, resulting in a benefit(i.e., savings minus costs) of approximately $65 million over <strong>the</strong> project life. ThisAustin-<strong>San</strong> <strong>An<strong>to</strong>nio</strong> bypass route also provides a benefit in <strong>the</strong> form of reduced trackmaintenance and grade crossing accident costs of $22.76 million and $8.15 million,respectively. The <strong>to</strong>tal of all private sec<strong>to</strong>r savings associated with Planning CaseC are nearly $96 million.Private Sec<strong>to</strong>r Benefits ($ million)<strong>Freight</strong> Rail Operations:Train Miles -47.02Run Time 101.06Delay Time 38.57Fuel -28.03Track Maintenance Savings 22.76Grade Crossing Accident Avoidance 8.15Total ($ million) 95.49Table 7-25: Private Benefits for Planning Case CPlanning Case 1Planning Case 1, as shown in Figure 7-13 with <strong>the</strong> RTC results tabulated in Table 7-26, includes rail improvements 1 and 8 as previously listed in Table 7-3, which weretested in order <strong>to</strong> address operational efficiency with <strong>the</strong> installation of a secondmainline route in and out of So<strong>San</strong> Yard. This allows traffic a straight route betweenSo<strong>San</strong>, Wi<strong>the</strong>rs, and Alamo Junction.Improvement 1, located in southwest <strong>San</strong> <strong>An<strong>to</strong>nio</strong>, consists of <strong>the</strong> addition of asecond mainline from Alamo Junction <strong>to</strong> Wi<strong>the</strong>rs Junction on <strong>the</strong> Del Rio Subdivision7 - 48
<strong>San</strong> <strong>An<strong>to</strong>nio</strong> <strong>Region</strong> <strong>Freight</strong> <strong>Study</strong>Alternatives Analysisand is a planned UP improvement. Improvement 8 consists of an additionalmainline on <strong>the</strong> Laredo Subdivision from So<strong>San</strong> Yard <strong>to</strong> Heafer Junction. PlanningCase 1 is estimated <strong>to</strong> cost $9.3 million.Figure 7-13: Planning Case 1 ImprovementsTable 7-26 compares <strong>the</strong> RTC simulation results of <strong>the</strong> base case <strong>to</strong> Planning Case1. In this instance, implementing Improvement 1 and 8 increases <strong>to</strong>tal operatingdistance by only 5 miles over a 28-day period, and results in <strong>the</strong> consumption of only16 additional gallons of diesel fuel. Total run time for Case 1 is expected <strong>to</strong> increaseby 0.20 hours per day and delay time should be reduced by 0.60 hours per day.7 - 49
<strong>San</strong> <strong>An<strong>to</strong>nio</strong> <strong>Region</strong> <strong>Freight</strong> <strong>Study</strong>Alternatives AnalysisRTC Performance Measure Base Case Case 1 Net IncreaseTrains Operated (28 days) 2,861 2,861 0Train Miles (28 days) 356,835 356,840 5Total Run Time Hours (1 day) 493.40 493.60 0.20Delay Time Hours (1 day) 79.80 79.20 -0.60Delay Percent (1 day) 16.20% 16.00% -0.20%Delay Minutes/ 100 T (1 day) 37.57 37.27 -0.30Average Speed 25.80 25.80 0.00Fuel (gallons) (28 days) 2,918,686 2,918,670 16Gallons/Train Mile (28 days) 8.20 8.20 0.00Table 7-23: Net Change in Simulation Results for Planning Case 1The annualized economic benefit <strong>to</strong> <strong>the</strong> private sec<strong>to</strong>r for Case 1 is shown in Table7-27, whereby train mileage costs are expected <strong>to</strong> increase by $3,074 and additionalfuel costs are negligible ($340). Also, this planning case should increase run timecosts by $27,363 while reducing delay time costs by $82,089. Overall, annualprivate benefits accruing form <strong>the</strong> implementation of Case 1 should be $51,312.Total project value (private benefit) is expected <strong>to</strong> be $670,000 over a projectduration of 20 years.Private Benefit Annual ValueTrain Miles ($3,074)Run Time Hours ($27,363)Delay Time Hours $82,089Fuel ($340)Total First Year Benefit $51,31220-Year Present Value $670,000Table 7-27: Private Benefits for Planning Case 1Planning Case 1 made no significant changes in train counts in <strong>the</strong> <strong>San</strong> <strong>An<strong>to</strong>nio</strong>metropolitan area, meaning that <strong>the</strong> improvements did not have a quantifiable publicbenefit.Planning Case 2Planning Case 2, as shown in Figure 7-14 with <strong>the</strong> RTC results tabulated in Table 7-27, includes <strong>the</strong> improvements of Planning Case 1 with <strong>the</strong> addition of railimprovements 2 and 3 (as listed previously in Table 7-3), which were tested in order<strong>to</strong> address operational efficiency with <strong>the</strong> installation and completion of a secondmainline route between East Yard and Kirby Yard. The new siding and switches atToyota would allow for a passing siding for train meets, keeping <strong>the</strong> Corpus ChristiSubdivision available for through-train movements.Improvement 2, located in east-central <strong>San</strong> <strong>An<strong>to</strong>nio</strong>, consists of <strong>the</strong> addition of asecond mainline on <strong>the</strong> Del Rio Subdivision between East Yard and Kirby Yard. This7 - 50
<strong>San</strong> <strong>An<strong>to</strong>nio</strong> <strong>Region</strong> <strong>Freight</strong> <strong>Study</strong>Alternatives Analysisimprovement is approximately located between IH 35 and State Highway 78 <strong>to</strong> <strong>the</strong>north and south and between New Braunfels Avenue on <strong>the</strong> west and Forest Roadin Kirby, <strong>to</strong> <strong>the</strong> east. Improvement 3 consists of <strong>the</strong> construction of a 9000-footsiding track adjacent <strong>to</strong> <strong>the</strong> Corpus Christi Subdivision near <strong>the</strong> Toyota facility and isa planned UP improvement. The Toyota Facility is located approximately 13 milessouth of central <strong>San</strong> <strong>An<strong>to</strong>nio</strong>. Planning Case 2 is estimated <strong>to</strong> cost $21 million.Figure 7-14: Planning Case 2 ImprovementsTable 7-28 compares <strong>the</strong> simulation results of <strong>the</strong> base case <strong>to</strong> Planning Case 2. Inthis instance, implementing Planning Case 1 plus rail improvements 2 and 3increases <strong>to</strong>tal operating distance by only 3 miles over a 28-day period, and resultsin <strong>the</strong> consumption of only 199 additional gallons of diesel fuel. Total run time anddelay time for Case 2 is expected <strong>to</strong> decrease by 3.80 and 4.50 hours per day,respectively.7 - 51
<strong>San</strong> <strong>An<strong>to</strong>nio</strong> <strong>Region</strong> <strong>Freight</strong> <strong>Study</strong>Alternatives AnalysisSimulation Parameter Base Case Case 2 Net IncreaseTrains Operated (28 days) 2,861 2,861 0Train Miles (28 days) 356,835 356,838 3Total Run Time Hours (1 day) 493.40 489.60 -3.80Delay Time Hours (1 day) 79.80 75.30 -4.50Delay Percent (1 day) 16.20% 15.40% -0.80%Delay Minutes/ 100 T (1 day) 37.57 35.47 -2.10Average Speed 25.80 26.00 0.20Fuel (gallons) (28 days) 2,918,686 2,918,885 199Gallons/Train Mile (28 days) 8.20 8.20 0.00Table 7-28: Net Change in Simulation Results for Planning Case 2The annualized economic benefit <strong>to</strong> <strong>the</strong> private sec<strong>to</strong>r for Case 2 is shown in Table7-29. This case results in an increase in train mileage costs of $1,844 and additionalfuel costs of $4,227. Run time costs are expected <strong>to</strong> decrease by $0.5 million anddelay time costs are expected <strong>to</strong> decrease by $0.6 million. Total first year privatebenefits that result from Case 2 should be approximately $1.1 million, while <strong>to</strong>talproject value is expected <strong>to</strong> be $14.8 million for a project duration of 20 years.Private Benefit Annual ValueTrain Miles ($1,844)Run Time Hours $519,898Delay Time Hours $615,668Fuel ($4,227)Total First Year Benefit $1,129,49520-Year Present Value $14,820,000Table 7-29: Private Benefits for Planning Case 2Planning Case 2 made no significant changes in train counts in <strong>the</strong> <strong>San</strong> <strong>An<strong>to</strong>nio</strong>metropolitan area, meaning that <strong>the</strong> improvements did not have a quantifiable publicbenefit.Planning Case 3Planning Case 3, as shown in Figure 7-15 with <strong>the</strong> RTC results tabulated in Table 7-30, includes <strong>the</strong> improvements of Planning Cases 1 and 2 in addition <strong>to</strong> railimprovements 5 and 6 (as previously listed in Table 7-3) which were tested <strong>to</strong>address network fluidity and capacity. Improvement 5 consists of <strong>the</strong> extension of<strong>the</strong> new second mainline on <strong>the</strong> Del Rio Subdivision at Kirby Interlocking north forapproximately one mile and includes <strong>the</strong> limits of <strong>the</strong> switch <strong>to</strong> <strong>the</strong> Seven SpringsCorporate Park. Improvement 6 is <strong>the</strong> connection of <strong>the</strong> two Del Rio Subdivisionmainlines through switches at <strong>the</strong> north end of So<strong>San</strong> Yard in <strong>the</strong> vicinity ofQuintana Road. Planning Case 3 is estimated <strong>to</strong> cost nearly $26 million.7 - 52
<strong>San</strong> <strong>An<strong>to</strong>nio</strong> <strong>Region</strong> <strong>Freight</strong> <strong>Study</strong>Alternatives AnalysisFigure 7-15: Planning Case 3 ImprovementsPlanning Case 3 involves <strong>the</strong> implementation of Case 2 in addition <strong>to</strong> Improvements5 and 6. As Table 7-30 shows, Case 3 increases <strong>to</strong>tal operating distance by only 13miles over a 28-day period, and results in <strong>the</strong> consumption of 510 additional gallonsof diesel fuel. Total run time and delay time for Case 3 is expected <strong>to</strong> decrease by4.50 and 4.80 hours per day, respectively.Simulation Parameter Base Case Case 3 Net IncreaseTrains Operated (28 days) 2,861 2,861 0Train Miles (28 days) 356,835 356,848 13Total Run Time Hours (1 day) 493.40 488.90 -4.50Delay Time Hours (1 day) 79.80 75.00 -4.80Delay Percent (1 day) 16.20% 15.30% -0.90%Delay Minutes/ 100 T (1 day) 37.57 35.29 -2.28Average Speed 25.80 26.10 0.30Fuel (gallons) (28 days) 2,918,686 2,919,196 510Gallons/Train Mile (28 days) 8.20 8.20 0.00Table 7-30: Net Change in Simulation Results for Planning Case 37 - 53
<strong>San</strong> <strong>An<strong>to</strong>nio</strong> <strong>Region</strong> <strong>Freight</strong> <strong>Study</strong>Alternatives AnalysisThe annualized economic benefit <strong>to</strong> <strong>the</strong> private sec<strong>to</strong>r for Case 3 is shown in Table7-31. This case results in an increase in train mileage costs of $7,992 and additionalfuel costs of $10,832. Run time costs are expected <strong>to</strong> decrease by approximately$0.6 million and delay time costs are expected <strong>to</strong> decrease by approximately $0.7million. Total first year private benefits that result from Case 3 should beapproximately $1.3 million, while <strong>to</strong>tal project value is expected <strong>to</strong> be $16.4 millionfor a project duration of 20 years.Private Benefit Annual ValueTrain Miles ($7,992)Run Time Hours $615,668Delay Time Hours $656,713Fuel ($10,832)Total First Year Benefit $1,253,55720-Year Present Value $16,450,000Table 7-31: Private Benefits for Planning Case 3Planning Case 3 made no significant changes in train counts in <strong>the</strong> <strong>San</strong> <strong>An<strong>to</strong>nio</strong>area, meaning that <strong>the</strong> improvements did not have a quantifiable public benefit.Planning Case 4Planning Case 4, as shown in Figure 7-16 with <strong>the</strong> RTC results tabulated in Table 7-32, includes <strong>the</strong> improvements of Planning Cases 1, 2, and 3 in addition <strong>to</strong> railimprovements 13 and 15 (as previously listed in Table 7-3), which were tested <strong>to</strong>improve meet/pass efficiency and reduce train delays. Improvement 13 is <strong>the</strong>extension and connection of North Loop and Adams sidings located north of <strong>San</strong><strong>An<strong>to</strong>nio</strong> on <strong>the</strong> Austin ML 1 Subdivision, resulting in a 3.7 mile long main trackpassing siding with a universal cross-over. Improvement 15 consists of upgradingand extending <strong>the</strong> Converse s<strong>to</strong>rage track on <strong>the</strong> Glidden Subdivision northwest ofdown<strong>to</strong>wn <strong>San</strong> <strong>An<strong>to</strong>nio</strong>. Planning Case 4 is estimated <strong>to</strong> cost $35 million.7 - 54
<strong>San</strong> <strong>An<strong>to</strong>nio</strong> <strong>Region</strong> <strong>Freight</strong> <strong>Study</strong>Alternatives AnalysisFigure 7-16: Planning Case 4 ImprovementsAs Table 7-32 shows, Case 4 decreases <strong>to</strong>tal operating distance by one mile over a28-day period, while increasing <strong>the</strong> consumption diesel fuel by 1,153 gallons. Theincrease in fuel consumption with no additional train miles is most likely due <strong>to</strong>conflicts between train movements that result in added wait times or due <strong>to</strong> changesin operating speeds. Total run time and delay time for Case 4 is expected <strong>to</strong>decrease by 3.80 and 4.90 hours per day, respectively.Simulation Parameter Base Case Case 4 Net IncreaseTrains Operated (28 days) 2,861 2,861 0Train Miles (28 days) 356,835 356,834 -1Total Run Time Hours (1 day) 493.40 489.60 -3.80Delay Time Hours (1 day) 79.80 74.90 -4.90Delay Percent (1 day) 16.20% 15.30% -0.90%Delay Minutes/ 100 T (1 day) 37.57 35.26 -2.31Average Speed 25.80 26.00 0.20Fuel (gallons) (28 days) 2,918,686 2,919,839 1,153Gallons/Train Mile (28 days) 8.20 8.20 0.00Table 7-32: Net Change in Simulation Results for Planning Case 47 - 55
<strong>San</strong> <strong>An<strong>to</strong>nio</strong> <strong>Region</strong> <strong>Freight</strong> <strong>Study</strong>Alternatives AnalysisThe annualized economic benefit <strong>to</strong> <strong>the</strong> private sec<strong>to</strong>r for Case 4 is shown in Table7-33. This case results in an increase in train mileage costs of only $615 andadditional fuel costs of $24,490. Run time costs are expected <strong>to</strong> decrease byapproximately $0.5 million and delay time costs are expected <strong>to</strong> decrease byapproximately $0.7 million, resulting in <strong>to</strong>tal first year private benefits ofapproximately $1.2 million for Case 4. The <strong>to</strong>tal project value is expected <strong>to</strong> be$15.3 million for a duration of 20 years.Private Benefit Annual ValueTrain Miles $615Run Time Hours $519,898Delay Time Hours $670,394Fuel ($24,490)Total First Year Benefit $1,166,41720-Year Present Value $15,310,000Table 7-33: Private Benefits for Planning Case 4Planning Case 4 made no significant changes in train counts in <strong>the</strong> <strong>San</strong> <strong>An<strong>to</strong>nio</strong>metropolitan area, meaning that <strong>the</strong> improvements did not have a quantifiable publicbenefit.Figure 7-17 shows <strong>the</strong> RTC network with Planning Cases 1 through 4 Improvementsas <strong>the</strong>y would appear on <strong>the</strong> RTC computer screen for <strong>the</strong> <strong>San</strong> <strong>An<strong>to</strong>nio</strong> area.Figure 7-17 RTC Network with Improvements7 - 56
<strong>San</strong> <strong>An<strong>to</strong>nio</strong> <strong>Region</strong> <strong>Freight</strong> <strong>Study</strong>Alternatives AnalysisPlanning Case ComparisonsTable 7-34 summarizes base case and planning case simulation results for <strong>the</strong>bypass alternatives, while Table 7-35 compares <strong>the</strong> base case and Planning Cases1 through 4.RTC Performance MeasureBase CasePC A - SABypassPC B1 - AUSBypassPC B2 - AUSBypassPC C - SA &AUSBypassTrains Operated (28 Days) 2,891 2,663 2,888 2,888 2,663Train Miles (28 Days) 359,028 374,505 357,047 356,965 365,528Run Time (Avg. Daily Hrs) 496.2 485.3 443.9 444.9 433.6S<strong>to</strong>p Time (Avg. Daily Hrs) 86.6 86.4 58.55 60.74 62.6Delay (%) 17.5% 17.8% 13.2% 13.7% 14.4%Delay Minutes/100TM 40.51 38.76 27.6 28.6 28.78Average Speed 25.8 27.6 28.7 28.7 30.1Fuel (gallons) 2,956,784 3,130,080 2,956,571 2,955,889 3,016,397Gallons/ Train Mile 8.2 8.3 8.3 8.3 8.3Table 7-34: RTC Summary of Planning Cases A, B, and CRTC Performance Measure Base Case PC 1 PC 2PC 3PC 4Trains Operated (28 Days) 2,861 2,861 2,861 2,861 2,861Train Miles (28 Days) 356,835 356,840 356,838 356,848 356,834Run Time (Avg. Daily Hrs) 493.4 493.6 489.6 488.9 489.6S<strong>to</strong>p Time (Avg. Daily Hrs) 79.8 79.2 75.3 75 74.9Delay (%) 16.2% 16.0% 15.4% 15.3% 15.3%Delay Minutes/100TM 37.57 37.27 35.47 35.29 35.26Average Speed 25.8 25.8 26.0 26.1 26.0Fuel (gallons) 2,918,686 2,918,670 2,918,885 2,919,196 2,919,839Gallons/ Train Mile 8.2 8.2 8.2 8.2 8.2Table 7-35: RTC Summary of Planning Cases 1, 2, 3, and 4The largest impact <strong>to</strong> train operations occurs when Planning Cases A, B, and C arecompared <strong>to</strong> <strong>the</strong> base case. The <strong>San</strong> <strong>An<strong>to</strong>nio</strong> bypass (Planning Case A) shows a4.3 percent increase in train miles, an increase of nearly 6 percent in fuelconsumption and an increase of 1.2 percent in gallons/train mile for <strong>the</strong> <strong>to</strong>talnetwork. O<strong>the</strong>r categories that reflect improvements for train movements include:reduced <strong>to</strong>tal run time hours by 2.2 percent, reduced delay minutes/100 train milesby 4.3 percent, and increased average speed by 6.9 percent.Construction of <strong>the</strong> possible Austin bypass from Taylor <strong>to</strong> Seguin would likely reduce<strong>to</strong>tal run time by approximately 10 percent and delay time by up <strong>to</strong> 32 percent,depending on whe<strong>the</strong>r trains are routed via Planning Case B1 or B2. The RTCresults also show that Planning Cases B1 and B2 would reduce <strong>the</strong> net train milestraveled as well as fuel consumption despite an increase in actual route miles from<strong>the</strong> existing network. This net reduction is due primarily <strong>to</strong> a reduction in local trainmiles traveled in Planning Cases B1 and B2.7 - 57
<strong>San</strong> <strong>An<strong>to</strong>nio</strong> <strong>Region</strong> <strong>Freight</strong> <strong>Study</strong>Alternatives AnalysisThe combined <strong>San</strong> <strong>An<strong>to</strong>nio</strong> and Austin bypass (Planning Case C) shows impacts <strong>to</strong>train performance for <strong>the</strong> following measures:• Train Miles – increased by 1.8%• Run Time – reduced by 12.6%• Hours of Delay – reduced by 27.7%• Delay Minutes/ 100 Train Miles – reduced by 29%• Average Train Speed – increased by 16.5%• Fuel Consumption – increased by 2%• Gallons of Fuel/ Train Mile – increased by 1.2%Planning Case 1 shows a general improvement in all of <strong>the</strong> measures as compared<strong>to</strong> <strong>the</strong> base case. Because improvements in one area cause trains <strong>to</strong> operate atdifferent times in adjacent segments, and thus change <strong>the</strong> interaction with o<strong>the</strong>rtrains, <strong>the</strong> simulation results may vary by location. The improvements are moresubstantial in <strong>the</strong> south segment of <strong>the</strong> network, where <strong>the</strong> two double track projectsprovide <strong>the</strong> greatest direct benefit, but minor improvement also results in <strong>the</strong> northand east segments. Total run time is reduced by 12 minutes per day, and <strong>the</strong>percent of run time consumed by trains s<strong>to</strong>pping <strong>to</strong> wait for available track space isreduced from 16.2% <strong>to</strong> 16.0%.Planning Case 2 includes improvements in <strong>the</strong> east and south segments of <strong>the</strong>network, and provides additional improvement <strong>to</strong> train operating measurements in<strong>the</strong> east and north segments of <strong>the</strong> network over Planning Case 1. Planning Case 2results in <strong>the</strong> <strong>to</strong>tal run time dropping from 493.6 hours per day (Case 1) <strong>to</strong> 489.6hours, and it provides a significant reduction in <strong>the</strong> delay minutes per 100 train miles,from 37.27 (Case 1) <strong>to</strong> 35.47 minutes.Planning Case 3 adds double track east of Kirby Yard, and shows fur<strong>the</strong>r operatingimprovements particularly in <strong>the</strong> north and south segments of <strong>the</strong> network.Compared with Case 2, Planning Case 3 results in delay time reductions of 18minutes per day. Delay time per 100 train miles dropped from 35.47 <strong>to</strong> 35.29minutes. Overall performance of Planning Case 3 in all segments of <strong>the</strong> networkshows improvements compared <strong>to</strong> <strong>the</strong> base case.Planning Case 4 makes additional capacity improvements in <strong>the</strong> north and eastsegments of <strong>the</strong> rail network by upgrading selected sidings. Planning Case 4provides fur<strong>the</strong>r improvement over Case 3, particularly in terms of reduced delayminutes per 100 train miles. Generally, efficiencies in train operations occur in allcategories.The <strong>to</strong>tal impact of all <strong>the</strong> planning cases functioning as a whole is demonstrated bycomparing Planning Case 4 <strong>to</strong> <strong>the</strong> base case. The delay percentage drops from 16.2percent <strong>to</strong> 15.3 percent, delay minutes per 100 train miles drops from 37.57 minutes<strong>to</strong> 35.26 minutes, and average speed increases from 25.8 <strong>to</strong> 26 miles per hour.7 - 58
<strong>San</strong> <strong>An<strong>to</strong>nio</strong> <strong>Region</strong> <strong>Freight</strong> <strong>Study</strong>Alternatives AnalysisTable 7-36 shows <strong>the</strong> average number of daily trains operated over each segment of<strong>the</strong> network for <strong>the</strong> bypass planning cases. Planning Cases 1 through 4 have nosignificant impact on average train volumes from <strong>the</strong> base case.Railroad SubdivisionBase CaseCase A - SABypassAverage Daily TrainsCase B1 -AUS BypassCase B2 -AUS BypassCase C -SA&AUSBypassPossible Austin-<strong>San</strong> <strong>An<strong>to</strong>nio</strong>Bypass, Taylor <strong>to</strong> Seguin N/A N/A 29 29 29Possible Austin-<strong>San</strong> <strong>An<strong>to</strong>nio</strong>Bypass, Seguin <strong>to</strong> Macdona N/A 31 N/A N/A 42Austin Subdivision ML 1, East ofTaylor 22 13 33 33 33Austin Subdivision ML 1, Taylor <strong>to</strong>Round Rock 30 21 13 13 12Austin Subdivision ML 1, RoundRock <strong>to</strong> <strong>San</strong> Marcos 25 16 8 8 7Austin Subdivision ML 1 and 2,<strong>San</strong> Marcos <strong>to</strong> Garden Ridge 36 23 12 12 12Austin Subdivision ML 1, GardenRidge <strong>to</strong> <strong>San</strong> <strong>An<strong>to</strong>nio</strong> (Twr 105) 22 16 8 8 7Austin Subdivision ML 2, GardenRidge <strong>to</strong> Del Rio Sub 10 3 1 1 1Austin Subdivision ML 2, Del RioSub <strong>to</strong> Down<strong>to</strong>wn <strong>San</strong> <strong>An<strong>to</strong>nio</strong>(Twr 112) 10 3 1 48 1Corpus Christi Subdivision, So<strong>San</strong>Yard <strong>to</strong> Toyota Plant 13 5 13 13 4Del Rio Subdivision, Kirby <strong>to</strong>Down<strong>to</strong>wn <strong>San</strong> <strong>An<strong>to</strong>nio</strong> (Twr 105) 35 15 56 10 14Del Rio Subdivision, Down<strong>to</strong>wn<strong>San</strong> <strong>An<strong>to</strong>nio</strong> (Twr 105) <strong>to</strong> Macdona 24 5 36 36 4Del Rio Subdivision, Macdona <strong>to</strong>Hondo 27 27 27 27 27Glidden Subdivision, Fla<strong>to</strong>nia <strong>to</strong>Seguin 27 40 24 24 23Glidden Subdivision, Seguin <strong>to</strong>Kirby 27 13 52 52 14Laredo Subdivision, <strong>San</strong> <strong>An<strong>to</strong>nio</strong> <strong>to</strong>Gessner 18 11 18 18 2Laredo Subdivision, Gessner <strong>to</strong>Melon 18 18 18 18 18Lockhart Subdivision, <strong>San</strong> Marcos<strong>to</strong> West Point 12 9 6 6 5Table 7-36: Average Daily Train Volumes by SegmentPlanning Case Benefit/Cost SummaryThe estimated public and private benefits for each planning case are shown in Table7-37 along with associated cost/benefit comparisons. As shown in <strong>the</strong> table,Planning Case C has <strong>the</strong> highest <strong>to</strong>tal public benefit <strong>to</strong> cost ratio as well as <strong>the</strong>highest <strong>to</strong>tal benefit <strong>to</strong> cost ratio. The estimated private benefit is largely due <strong>to</strong>savings in run time and delay time over <strong>the</strong> 20-year period.7 - 59
<strong>San</strong> <strong>An<strong>to</strong>nio</strong> <strong>Region</strong> <strong>Freight</strong> <strong>Study</strong>Alternatives AnalysisPlanningCaseEstimated CostEstimatedPublic BenefitRatio: PublicBenefit/CostEstimated Ratio: PrivatePrivate Benefit Benefit/ CostEstimated TotalBenefitRatio: TotalBenefit/CostA $ 1,369,610,000 $ 504,790,000 0.37 $ (162,860,000) -0.12 $ 341,930,000 0.25B1 $ 1,595,850,000 $ 587,100,000 0.37 $ 161,990,000 0.10 $ 749,090,000 0.47B2 $ 1,741,260,000 $ 843,460,000 0.48 $ 157,890,000 0.09 $ 1,001,350,000 0.58C $ 2,423,510,000 $1,424,950,000 0.59 $ 95,490,000 0.04 $ 1,520,440,000 0.631 $ 9,260,000 NA NA $ 670,000 0.07 $ 670,000 0.072 $ 21,060,000 NA NA $ 14,820,000 0.70 $ 14,820,000 0.703 $ 25,740,000 NA NA $ 16,450,000 0.64 $ 16,450,000 0.644 $ 35,130,000 NA NA $ 15,310,000 0.44 $ 15,310,000 0.44Estimated public and private benefits are based on a 20-year study period.Table 7-37: Planning Case Estimated Cost and Benefits SummaryThe possible <strong>San</strong> <strong>An<strong>to</strong>nio</strong> bypass analyzed in Planning Case A was shown <strong>to</strong>provide a public benefit in <strong>the</strong> form of reduced impedance (delay, accidents, andemissions) at roadway-rail crossings of more than $501.4 million over <strong>the</strong> no-buildscenario. Incorporating <strong>the</strong> Austin bypass with <strong>the</strong> <strong>San</strong> <strong>An<strong>to</strong>nio</strong> bypass, as analyzedin Planning Case C, would add a public benefit of more than $393.5 million. Themajority of <strong>the</strong> additional benefit that may be seen from incorporating a possibleAustin bypass with <strong>the</strong> <strong>San</strong> <strong>An<strong>to</strong>nio</strong> bypass option would be seen on <strong>the</strong> Laredo andAustin ML 1 Subdivisions. The public benefits of reduced impedance at gradecrossings along each rail subdivision for Planning Cases A, B, and C are shown inTable 7-38. The values shown represent <strong>the</strong> difference in impedance costs relative<strong>to</strong> <strong>the</strong> base case.Railroad SubdivisionPC A - SABypassPC B1 - AustinBypassPC B2 - AustinBypassPC C - SA &Austin BypassAustin Subdivision (<strong>San</strong> Marcos <strong>to</strong>Williamson County Line) $111,450,000 $170,760,000 $170,760,000 $168,540,000Austin No 1 (<strong>San</strong> Marcos <strong>to</strong>Downotwn <strong>San</strong> <strong>An<strong>to</strong>nio</strong>) $182,760,000 $289,490,000 $289,490,000 $313,890,000Austin No 2 (<strong>San</strong> Marcos <strong>to</strong>Downotwn <strong>San</strong> <strong>An<strong>to</strong>nio</strong>) $58,750,000 $80,480,000 $80,980,000 $84,900,000Corpus Christi (Down<strong>to</strong>wn <strong>San</strong><strong>An<strong>to</strong>nio</strong> <strong>to</strong> Toyota Plant) -$36,340,000 -$44,760,000 -$44,760,000 -$8,700,000Del Rio (Kirby <strong>to</strong> Macdona) $148,670,000 -$294,620,000 -$38,400,000 $209,930,000Giddings (Fla<strong>to</strong>nia <strong>to</strong> Mumford) -$6,530,000 $7,360,000 $7,360,000 $7,420,000Glidden (Fla<strong>to</strong>nia <strong>to</strong> Kirby) $40,730,000 -$21,690,000 -$21,690,000 $45,350,000Kerrville $34,870,000 $14,130,000 $14,130,000 $35,270,000Laredo (Down<strong>to</strong>wn <strong>San</strong> <strong>An<strong>to</strong>nio</strong> <strong>to</strong>Gessner) -$52,210,000 -$139,260,000 -$139,260,000 $84,010,000Lockhart (<strong>San</strong> Marcos <strong>to</strong> Smithville) $19,590,000 $25,300,000 $25,300,000 $25,660,000Rockport $29,570,000 $980,000 $980,000 -$6,900,000Waco (Smithville <strong>to</strong> Taylor) -$830,000 $1,050,000 $1,050,000 $1,060,000Possible Bypass with GradeSeparations -$29,060,000 -$29,900,000 -$29,900,000 -$65,500,000Total (with grade separations onbypass) $501,420,000 $59,320,000 $316,040,000 $894,930,000Table 7-38: 20-Year Grade Crossing Impedance Reduction/Public Benefit7 - 60
<strong>San</strong> <strong>An<strong>to</strong>nio</strong> <strong>Region</strong> <strong>Freight</strong> <strong>Study</strong>Identified ImprovementsSECTION 8: IDENTIFIED IMPROVEMENTSThe potential improvements included in <strong>the</strong> RTC planning cases in addition <strong>to</strong>identified grade separations and crossing closures have been organized by railroadsubdivision and are described in <strong>the</strong> following section. Maps showing <strong>the</strong> locationsof each railroad subdivision are included in Appendix E.Austin Subdivision ML 1The tracks of <strong>the</strong> Austin Subdivision ML 1 were originally constructed in 1881 by <strong>the</strong>International & Great Nor<strong>the</strong>rn Railroad. The Subdivision originates in Hearne,<strong>Texas</strong> and passes through Taylor, George<strong>to</strong>wn, Round Rock, Austin, <strong>San</strong> Marcos,and New Braunfels before it ends in down<strong>to</strong>wn <strong>San</strong> <strong>An<strong>to</strong>nio</strong> with <strong>the</strong> trackscontinuing southward as <strong>the</strong> Laredo Subdivision. From <strong>San</strong> <strong>An<strong>to</strong>nio</strong> <strong>to</strong> Austin, itgenerally parallels Interstate 35 and also parallels <strong>the</strong> Austin Subdivision ML 2between <strong>San</strong> Marcos and <strong>San</strong> <strong>An<strong>to</strong>nio</strong>. The Subdivision is approximately 171 milesin <strong>to</strong>tal length, approximately 44 of which are in <strong>the</strong> <strong>San</strong> <strong>An<strong>to</strong>nio</strong> <strong>Region</strong> study areain Comal and Bexar Counties. The Austin Subdivision ML 1 is a single trackmainline with numerous sidings utilized in a bidirectional manner, with trainsdispatched <strong>to</strong> operate in both directions, averaging between 20 and 30 trains daily,depending upon location.Potential improvements along <strong>the</strong> Austin Subdivision ML 1 include gradeseparations, crossing closures, and rail capacity enhancements, as listed in Table 8-1 and described in <strong>the</strong> following section.8 - 1
<strong>San</strong> <strong>An<strong>to</strong>nio</strong> <strong>Region</strong> <strong>Freight</strong> <strong>Study</strong>Identified ImprovementsAustin Subdivision Mainline 1Grade SeparationsImprovementClassificationLevelEstimated CostEstimatedPublic Benefit(20-year)Ratio:Benefit/Cost(20-year)Ashby 3 $ 11,000,000 $ 3,950,000 0.36Basse 3 $ 7,100,000 $ 20,970,000 2.95Broadway & Bitters 3 $ 27,300,000 $ 28,040,000 1.03Classen 3 $ 7,000,000 $ 10,120,000 1.45Culebra/Fredericksburg 3 $ 17,300,000 $ 24,090,000 1.39FM 2252 3 $ 5,800,000 $ 14,120,000 2.43FM 3009 (Austin ML-1 and ML-2) 3 $ 18,500,000 $ 1,420,000 0.08FM 306 3 $ 7,100,000 $ 17,350,000 2.44Hildebrand 3 $ 15,700,000 $ 24,260,000 1.55Jones Maltsberger 3 $ 11,800,000 $ 18,040,000 1.53Judson 3 $ 5,000,000 $ 9,950,000 1.99Laredo 3 $ 10,400,000 $ 8,650,000 0.83Martin 3 $ 20,000,000 $ 11,150,000 0.56McCullough 3 $ 8,300,000 $ 11,330,000 1.37Oconnor 3 $ 7,900,000 $ 23,070,000 2.92Poplar 3 $ 8,800,000 $ 7,190,000 0.82Ruiz 3 $ 26,300,000 $ 3,810,000 0.14<strong>San</strong> <strong>An<strong>to</strong>nio</strong> 3 $ 12,300,000 $ 7,620,000 0.62Sunset 3 $ 11,900,000 $ 12,700,000 1.07Thousand Oaks 3 $ 20,600,000 $ 25,900,000 1.26Woodlawn 3 $ 7,800,000 $ 6,290,000 0.81Crossing ClosuresImprovementClassificationLevelEstimated CostEstimatedPublic Benefit(20-year)*Ratio:Benefit/Cost(20-year)Arbor 3 $ 50,000 $ 260,000 5.20Bridge St 3 $ 50,000 NA NACastell St 3 $ 50,000 $ 360,000 7.20Coll St 3 $ 50,000 NA NAComal Ave 3 $ 50,000 $ 360,000 7.20Commerce St 3 $ 50,000 $ 9,670,000 193.40Craig 3 $ 50,000 $ 330,000 6.60Delgado St 3 $ 50,000 $ 690,000 13.80Dora St 3 $ 50,000 NA NAElm St 3 $ 50,000 $ 360,000 7.20Elsmere 3 $ 50,000 $ 300,000 6.00Hickman St 3 $ 50,000 $ 520,000 10.40Hollywood Ave 3 $ 50,000 $ 470,000 9.40Jahn St 3 $ 50,000 $ 510,000 10.20Kings Hwy 3 $ 50,000 $ 470,000 9.40Laurel St 3 $ 50,000 $ 340,000 6.80Lombrano St 3 $ 50,000 $ 320,000 6.40Magnolia 3 $ 50,000 $ 470,000 9.40Main Ave (Zilla) 3 $ 50,000 $ 600,000 12.00Mill St 3 $ 50,000 NA NAMistle<strong>to</strong>e 3 $ 50,000 $ 1,170,000 23.40Perez St 3 $ 50,000 NA NARivas St 3 $ 50,000 $ 290,000 5.80Russell 3 $ 50,000 $ 330,000 6.60Summit Ave 3 $ 50,000 $ 330,000 6.60Tampico St 3 $ 50,000 $ 330,000 6.60Table 8-1: Austin Subdivision ML 1 Improvements8 - 2
<strong>San</strong> <strong>An<strong>to</strong>nio</strong> <strong>Region</strong> <strong>Freight</strong> <strong>Study</strong>Identified ImprovementsRail ImprovementsImprovementClassificationLevelEstimated CostEstimatedPublic Benefit(20-year)Ratio:Benefit/Cost(20-year)#4 - Construct one new connection track betweenAustin ML1 and Lockhart Subdivisions in <strong>San</strong>Marcos. 1 $ 880,000 NA NA#9 - Construct new connections in <strong>the</strong> nor<strong>the</strong>astand northwest quadrants of <strong>the</strong> Austin ML-1 andDel Rio Subdivision diamond south of <strong>San</strong>Fernando Yard and Apache Jct. 1 $ 3,000,000 NA NA#11 - Extend Hestes and Hut<strong>to</strong> sidings (Austin ML1, south of Taylor) <strong>to</strong> just over 2 miles in length4 $ 5,020,000 NA NA#12 - Extend Landas Park siding (Austin ML-1) <strong>to</strong>a length of 2.9 miles 4 $ 5,020,000 NA NA#13 - Extend and connect both North Loop andAdams sidings (Austin ML-1) <strong>to</strong> create a 3.74 milelong passing siding 4 $ 4,050,000 NA NA#17 - Siding upgrades between Round Rock and<strong>San</strong> <strong>An<strong>to</strong>nio</strong> <strong>to</strong> provide sufficient locations for trainmeets (7 locations) 4 $ 8,620,000 NA NA#18 - Upgrade Austin ML-1 sidings <strong>to</strong> CTC atAdams, Landas Park, <strong>Texas</strong> Lehigh, Buda,Austin, McNeil and White Lime 1 $ 900,000 NA NA#28 - Construct a new connection at Taylorbetween <strong>the</strong> between <strong>the</strong> Waco and AustinSubdivisions (consider bypass route) 1 $ 1,340,000 NA NA*Public benefit could only be estimated for crossing closures which would be rerouted <strong>to</strong> a grade separated crossing. However, allcrossing closures produce a public benefit of improved safety.**No public benefits of individual rail improvements were identified.Class 1 Improvements (Near-term Improvements) 1 $ 6,120,000 NA NAClass 3 Improvements (Separations/Closures) 3 $ 269,200,000 $ 308,500,000 1.15Class 4 Improvements (Long-term Improvements) 4 $ 22,710,000 NA NATotal Identified Improvements $ 298,030,000 $ 308,500,000 1.04Table 8-1 (cont’d): Austin Subdivision ML 1 ImprovementsA breakdown of <strong>the</strong> order of magnitude cost estimates and <strong>the</strong> estimated associatedpublic benefits of <strong>the</strong> identified potential grade separations are included in AppendixC and Appendix G, respectively.Grade SeparationsGrade Separation of Ashby Place on <strong>the</strong> Austin Subdivision ML 1Ashby Place is currently a two-lane roadway that crosses <strong>the</strong> UP Austin SubdivisionML 1 in Bexar County in <strong>the</strong> city of <strong>San</strong> <strong>An<strong>to</strong>nio</strong>. This roadway, with approximately5,300 vehicles crossing <strong>the</strong> railroad tracks daily, has been identified as a potentialcandidate for grade separation. The potential two-lane roadway overpass wouldseparate vehicular traffic from <strong>the</strong> Austin Subdivision ML 1.A preliminary layout of <strong>the</strong> overpass is included in <strong>the</strong> figures in Appendix E, while<strong>the</strong> environmental constraints and adjacent property land uses are identified in <strong>the</strong>Austin Subdivision ML 1 Constraints Map on sheet 3 of 40 located in Appendix F.8 - 3
<strong>San</strong> <strong>An<strong>to</strong>nio</strong> <strong>Region</strong> <strong>Freight</strong> <strong>Study</strong>Identified ImprovementsThe constraints located in <strong>the</strong> vicinity of Ashby Place consist of adjacent commercialand residential property, <strong>San</strong> Pedro Springs Park, and a leaking petroleum s<strong>to</strong>ragetank site. Access <strong>to</strong> adjacent properties could be maintained via access roadsalongside Ashby Place along with at-grade u-turns located beneath <strong>the</strong> overpass oneach side of <strong>the</strong> railroad.The grade separation of Ashby Place is estimated <strong>to</strong> cost $11.0 million. Theestimated public benefit calculated for <strong>the</strong> grade separation of Ashby Place isapproximately $3.95 million, which is 36 percent of <strong>the</strong> estimated cost of <strong>the</strong> gradeseparation.Grade Separation of Basse Rd on <strong>the</strong> Austin Subdivision ML 1Basse Road is currently a four-lane roadway that crosses <strong>the</strong> UP Austin SubdivisionML 1 in Bexar County within <strong>the</strong> city of <strong>San</strong> <strong>An<strong>to</strong>nio</strong>. This roadway, withapproximately 24,700 vehicles crossing <strong>the</strong> railroad tracks daily, has been identifiedas a potential candidate for grade separation. The potential four-lane roadwayoverpass would separate vehicular traffic from <strong>the</strong> Austin Subdivision ML 1.A preliminary layout of <strong>the</strong> overpass is included in <strong>the</strong> figures in Appendix E, while<strong>the</strong> environmental constraints and adjacent property land uses are identified in <strong>the</strong>Austin Subdivision ML 1 Constraints Map on sheet 6 of 40 located in Appendix F.The constraints located in <strong>the</strong> vicinity of Basse Road consist of <strong>the</strong> adjacent golfcourse and park as well as <strong>the</strong> 100-year floodplain.Access <strong>to</strong> adjacent properties would not be available along <strong>the</strong> identified gradeseparated Basse Road structure for a length of less than one mile. However, sinceno properties have been identified <strong>to</strong> currently access <strong>the</strong> roadway along thissegment, minimal or no right-of-way acquisition should be required.The grade separation of Basse Road is estimated <strong>to</strong> cost $7.1 million, with anestimated public benefit of $20.97 million, which is nearly three times <strong>the</strong> estimatedcost of <strong>the</strong> grade separation.Grade Separation of Bitters Rd and Broadway St on Austin Subdivision ML 1Bitters Road is currently a two-lane roadway that crosses <strong>the</strong> UP Austin SubdivisionML 1 in Bexar County in <strong>the</strong> city of <strong>San</strong> <strong>An<strong>to</strong>nio</strong>. Approximately 27,300 daily vehiclescross <strong>the</strong> UP at this location. Broadway Street is currently a four-lane roadway thatcrosses <strong>the</strong> UP Austin Subdivision ML 1 in Bexar County in <strong>the</strong> city of <strong>San</strong> <strong>An<strong>to</strong>nio</strong>.Approximately 33,500 daily vehicles cross <strong>the</strong> UP at this location. These roadwayshave been identified as potential candidates for grade separation. The potentialunderpass structures along Bitters Road, Broadway Street, and Wetmore Roadwould separate vehicular traffic from <strong>the</strong> Austin Subdivision ML 1.A preliminary layout of <strong>the</strong> underpass structures is included in <strong>the</strong> figures inAppendix E, while <strong>the</strong> environmental constraints and adjacent property land usesare identified in <strong>the</strong> Austin Subdivision ML 1 Constraints Map on sheets 9 and 10 of8 - 4
<strong>San</strong> <strong>An<strong>to</strong>nio</strong> <strong>Region</strong> <strong>Freight</strong> <strong>Study</strong>Identified Improvements40 located in Appendix F. The constraints located in <strong>the</strong> vicinity of Bitters Road andBroadway Street consist of adjacent industrial and commercial property, an oil/gaspipeline, public water well, and <strong>the</strong> airport located west of <strong>the</strong> railroad.In order <strong>to</strong> maintain connectivity, <strong>the</strong> lanes of Wetmore Road must be depressed <strong>to</strong>meet <strong>the</strong> underpass mainlanes of Bitters Road and Broadway Street. Access <strong>to</strong>adjacent properties along Wetmore Road could be maintained via a frontage roadwest of <strong>the</strong> existing Wetmore Road mainlanes. Access <strong>to</strong> adjacent properties alongBitters Road and Broadway Street could be maintained via access roads alongside<strong>the</strong> underpass structures with at-grade u-turns located above <strong>the</strong> underpassmainlanes on <strong>the</strong> east side of <strong>the</strong> railroad.The grade separation of Bitters Road and Broadway Street is estimated <strong>to</strong> cost$27.3 million with an estimated public benefit of $28 million, which is three percentgreater than <strong>the</strong> estimated cost of <strong>the</strong> grade separation.Grade Separation of Classen Rd on <strong>the</strong> Austin Subdivision ML 1Classen Road is currently a two-lane roadway that crosses <strong>the</strong> UP AustinSubdivision ML 1 in Bexar County in <strong>the</strong> city of Bracken. This roadway, withapproximately 11,900 vehicles crossing <strong>the</strong> railroad tracks daily, has been identifiedas a potential candidate for grade separation. The potential two-lane roadwayoverpass would separate vehicular traffic from <strong>the</strong> Austin Subdivision ML 1.A preliminary layout of <strong>the</strong> overpass is included in <strong>the</strong> figures in Appendix E, while<strong>the</strong> environmental constraints and adjacent property land uses are identified in <strong>the</strong>Austin Subdivision ML 1 Constraints Map on sheet 13 of 40 located in Appendix F.The constraints located in <strong>the</strong> vicinity of Classen Road consist of <strong>the</strong> adjacentresidential property and a cemetery. Access <strong>to</strong> adjacent properties and connectingroadways could be maintained via access roads alongside Classen Road with atgradeu-turns located beneath <strong>the</strong> overpass on each side of <strong>the</strong> railroad.The grade separation of Classen Road is estimated <strong>to</strong> cost $7.0 million with anestimated public benefit of $10.1 million, which is nearly 1.5 times greater than <strong>the</strong>estimated cost of <strong>the</strong> grade separation.Grade Separation of Fredericksburg Road and Culebra Avenue on <strong>the</strong> AustinSubdivision ML 1Fredericksburg Road and Culebra Avenue are each currently four-lane roadwaysthat cross <strong>the</strong> UP Austin Subdivision ML 1 in Bexar County in <strong>San</strong> <strong>An<strong>to</strong>nio</strong>.Approximately 19,000 daily vehicles cross <strong>the</strong> UP at Fredericksburg Road andapproximately 13,000 daily vehicles cross <strong>the</strong> railroad at Culebra Avenue. Theseroadways have been identified as potential candidates for grade separation. Thepotential four-lane roadway underpasses would separate vehicular traffic from <strong>the</strong>Austin Subdivision ML 1.8 - 5
<strong>San</strong> <strong>An<strong>to</strong>nio</strong> <strong>Region</strong> <strong>Freight</strong> <strong>Study</strong>Identified ImprovementsA preliminary layout of <strong>the</strong> underpasses is included in <strong>the</strong> figures in Appendix E,while <strong>the</strong> environmental constraints and adjacent property land uses are identified in<strong>the</strong> Austin Subdivision ML 1 Constraints Map on sheet 3 of 40 located in AppendixF. The primary constraints located in <strong>the</strong> vicinity of Fredericksburg Road andCulebra Avenue are adjacent residential and commercial properties.Access <strong>to</strong> adjacent properties alongside <strong>the</strong> potential underpass structures would beeliminated due <strong>to</strong> <strong>the</strong> lack of available horizontal clearance for at-grade accessroads alongside <strong>the</strong> underpass. The elimination of access <strong>to</strong> <strong>the</strong> identified gradeseparated roadways from <strong>the</strong> adjacent properties requires <strong>the</strong> acquisition ofadditional right-of-way alongside <strong>the</strong> roadways.The grade separation of Fredericksburg Road and Culebra Avenue are estimated <strong>to</strong>cost $17.3 million with an estimated public benefit of $24.1 million, which is 45percent greater than <strong>the</strong> estimated cost of <strong>the</strong> grade separation.Grade Separation of FM 2252 on <strong>the</strong> Austin Subdivision ML 1FM 2252 is currently a two-lane roadway that crosses <strong>the</strong> UP Austin Subdivision ML1 in Comal County in <strong>the</strong> city of Bracken. This roadway, with approximately 15,100vehicles crossing <strong>the</strong> railroad tracks daily, has been identified as a potentialcandidate for grade separation. The potential two-lane roadway overpass wouldseparate vehicular traffic from <strong>the</strong> Austin Subdivision ML 1.A preliminary layout of <strong>the</strong> overpass is included in <strong>the</strong> figures in Appendix E, while<strong>the</strong> environmental constraints and adjacent property land uses are identified in <strong>the</strong>Austin Subdivision ML 1 Constraints Map on sheet 18 of 40 located in Appendix F.The constraints located in <strong>the</strong> vicinity of FM 2252 consist of adjacent industrialproperty and <strong>the</strong> location of <strong>the</strong> 100-year floodplain.Access <strong>to</strong> adjacent industrial properties south of <strong>the</strong> railroad along FM 2252 couldbe maintained via access roads along both <strong>the</strong> east and west sides of FM 2252 withat-grade turn-around lanes just south of <strong>the</strong> railroad. The connection betweenBracken Drive and FM 2252 immediately north of <strong>the</strong> railroad crossing would beeliminated due <strong>to</strong> <strong>the</strong> identified potential grade separation, since Bracken Drivewould run beneath <strong>the</strong> identified FM 2252 overpass bridge. However, traffic fromBracken Drive would be able <strong>to</strong> reach FM 2252 less than a mile from <strong>the</strong> existingconnection located near <strong>the</strong> railroad crossing.The grade separation of FM 2252 is estimated <strong>to</strong> cost $5.8 million, with an estimatedpublic benefit of $14.1 million, which is approximately 2.4 times <strong>the</strong> estimated cost of<strong>the</strong> grade separation.Grade Separation of FM 3009 on <strong>the</strong> Austin Subdivision ML 1 and ML 2FM 3009 is currently a two-lane roadway that crosses <strong>the</strong> UP Austin SubdivisionMLs 1 and 2 in Comal County near Selma. Approximately 2,100 daily vehicles cross<strong>the</strong> UP at this location shown in Pho<strong>to</strong> 1 and Pho<strong>to</strong> 2. This roadway has been8 - 6
<strong>San</strong> <strong>An<strong>to</strong>nio</strong> <strong>Region</strong> <strong>Freight</strong> <strong>Study</strong>Identified Improvementsidentified as a potential candidate for grade separation. The potential two-laneroadway overpass would separate vehicular traffic from a new track alignment ofAustin Subdivision MLs 1 and 2.A preliminary layout of <strong>the</strong> overpass is included in <strong>the</strong> figures in Appendix E, while<strong>the</strong> environmental constraints and adjacent property land uses are identified in <strong>the</strong>Austin Subdivision ML 1 Constraints Map on sheet 21 of 40 located in Appendix F.The constraints located in <strong>the</strong> vicinity of FM 3009 consist of adjacent commercialand industrial property and oil/gas pipelines.The new track alignment identified as part of <strong>the</strong> FM 3009 grade separation merges<strong>the</strong> Austin Subdivision MLs in<strong>to</strong> two parallel mainlines approximately halfwaybetween <strong>the</strong> existing ML 1 and ML 2 alignments. This new alignment eliminates <strong>the</strong>existing two crossings between FM 3009 and <strong>the</strong> Austin Subdivision (at ML 1 andapproximately ½ mile south at ML 2) and creates one crossing where <strong>the</strong> roadwaycan cross both mainlines at one location. The new alignment merges back in<strong>to</strong> <strong>the</strong>existing ML 1 and ML 2 alignments east of <strong>the</strong> FM 3009 crossing. Access <strong>to</strong>adjacent properties and connecting roadways west FM 3009 could be maintained viaaccess roads along FM 3009 on <strong>the</strong> north and south sides of <strong>the</strong> railroad.The grade separation of FM 3009 is estimated <strong>to</strong> cost $18.5 million with anestimated public benefit of $1.4 million, which is eight percent of <strong>the</strong> estimated cos<strong>to</strong>f <strong>the</strong> grade separation.Pho<strong>to</strong> 1: FM 3009 at Austin Subdivision ML 18 - 7
<strong>San</strong> <strong>An<strong>to</strong>nio</strong> <strong>Region</strong> <strong>Freight</strong> <strong>Study</strong>Identified ImprovementsPho<strong>to</strong> 2: FM 3009 at Austin Subdivision ML 2Grade Separation of FM 306 on <strong>the</strong> Austin Subdivision ML 1FM 306 is currently a two-lane roadway that crosses <strong>the</strong> UP Austin Subdivision ML 1in Comal County in <strong>the</strong> city of New Braunfels. This roadway, with approximately13,500 daily vehicles crossing <strong>the</strong> railroad tracks, has been identified as a potentialcandidate for grade separation. According <strong>to</strong> FRA data, one accident occurred at <strong>the</strong>FM 306 crossing from 2002 through 2006. The potential two-lane roadway overpasswould separate vehicular traffic from <strong>the</strong> Austin Subdivision ML 1.A preliminary layout of <strong>the</strong> overpass is included in <strong>the</strong> figures in Appendix E, while<strong>the</strong> environmental constraints and adjacent property land uses are identified in <strong>the</strong>Austin Subdivision ML 1 Constraints Map on sheet 13 of 40 located in Appendix F.The constraints located in <strong>the</strong> vicinity of Classen Road consist of <strong>the</strong> adjacentresidential property and a cemetery. Access <strong>to</strong> adjacent properties could bemaintained via access roads alongside FM 306 with at-grade u-turns locatedbeneath <strong>the</strong> overpass on each side of <strong>the</strong> railroad.The grade separation of FM 306 is estimated <strong>to</strong> cost $7.1 million with an estimatedpublic benefit of $17.4 million, which is 2.4 times <strong>the</strong> estimated cost of <strong>the</strong> gradeseparation.Grade Separation of Hildebrand Ave on <strong>the</strong> Austin Subdivision ML 1Hildebrand Avenue is currently a four-lane roadway that crosses <strong>the</strong> UP AustinSubdivision ML 1 in Bexar County in <strong>San</strong> <strong>An<strong>to</strong>nio</strong>. This roadway, with approximately8 - 8
<strong>San</strong> <strong>An<strong>to</strong>nio</strong> <strong>Region</strong> <strong>Freight</strong> <strong>Study</strong>Identified Improvements27,500 daily vehicles crossing <strong>the</strong> railroad tracks, has been identified as a potentialcandidate for grade separation. The potential four-lane roadway underpass wouldseparate vehicular traffic from <strong>the</strong> Austin Subdivision ML 1.A preliminary layout of <strong>the</strong> underpass is included in <strong>the</strong> figures in Appendix E, while<strong>the</strong> environmental constraints and adjacent property land uses are identified in <strong>the</strong>Austin Subdivision ML 1 Constraints Map on sheets 4 and 5 of 40 located inAppendix F. The primary constraints located in <strong>the</strong> vicinity of Hildebrand Avenueconsist of <strong>the</strong> adjacent commercial and residential property.The potential underpass for Hildebrand Avenue would require <strong>the</strong> reconstruction of<strong>San</strong> Pedro Avenue south of its existing crossing with <strong>the</strong> railroad in order <strong>to</strong> maintainconnectivity between <strong>the</strong> two streets. Access <strong>to</strong> adjacent properties alongHildebrand and <strong>San</strong> Pedro Avenue would be eliminated at <strong>the</strong> location of <strong>the</strong>identified underpass. Property access could not be maintained with access roadsalong <strong>the</strong> underpass since no additional right-of-way is available.The grade separation of Hildebrand Avenue is estimated <strong>to</strong> cost $15.7 million withan estimated public benefit of $24.3 million, which is 55 percent greater than <strong>the</strong>estimated cost of <strong>the</strong> grade separation.Grade Separation of Jones-Maltsberger on <strong>the</strong> Austin Subdivision ML 1Jones-Maltsberger Road is currently a four-lane roadway that crosses <strong>the</strong> UP AustinSubdivision ML 1 in Bexar County in <strong>San</strong> <strong>An<strong>to</strong>nio</strong>. This roadway, with approximately22,100 daily vehicles crossing <strong>the</strong> railroad tracks, has been identified as a potentialcandidate for grade separation. The potential four-lane roadway underpass wouldseparate vehicular traffic from <strong>the</strong> Austin Subdivision ML 1.A preliminary layout of <strong>the</strong> underpass is included in <strong>the</strong> figures in Appendix E, while<strong>the</strong> environmental constraints and adjacent property land uses are identified in <strong>the</strong>Austin Subdivision ML 1 Constraints Map on sheet 7 of 40 located in Appendix F.The constraints located in <strong>the</strong> vicinity of Jones-Maltsberger Road consist of nearbygolf courses, <strong>the</strong> crossing of US 281 just north of <strong>the</strong> railroad crossing, and <strong>the</strong> 100-year floodplain. The location of <strong>the</strong> 100-year floodplain may require additionaldrainage design considerations for this grade separation.Access <strong>to</strong> adjacent properties south of <strong>the</strong> railroad would be required <strong>to</strong> reroute <strong>to</strong>driveways south of <strong>the</strong> potential underpass, while ramps from <strong>the</strong> US 281 frontageroads north of <strong>the</strong> railroad would be required <strong>to</strong> connect with <strong>the</strong> potential Jones-Matlsberger underpass. Minimal right-of-way acquisition, if any, should be requiredsince <strong>the</strong> identified grade separation remains in <strong>the</strong> existing roadway right-of-way.The grade separation of Jones-Maltsberger Road is estimated <strong>to</strong> cost $11.8 millionwith an estimated public benefit of $18 million, which is 53 percent greater than <strong>the</strong>estimated cost of <strong>the</strong> grade separation.8 - 9
<strong>San</strong> <strong>An<strong>to</strong>nio</strong> <strong>Region</strong> <strong>Freight</strong> <strong>Study</strong>Identified ImprovementsGrade Separation of Judson Rd on <strong>the</strong> Austin Subdivision ML 1Judson Road is currently a two-lane roadway that crosses <strong>the</strong> UP Austin SubdivisionML 1 in Bexar County in <strong>the</strong> city of Bracken. This roadway, with approximately11,700 daily vehicles crossing <strong>the</strong> railroad tracks, has been identified as a potentialcandidate for grade separation. The potential two-lane roadway overpass wouldseparate vehicular traffic from <strong>the</strong> Austin Subdivision ML 1.A preliminary layout of <strong>the</strong> overpass is included in <strong>the</strong> figures in Appendix E, while<strong>the</strong> environmental constraints and adjacent property land uses are identified in <strong>the</strong>Austin Subdivision ML 1 Constraints Map on sheet 15 of 40 located in Appendix F.The constraints located in <strong>the</strong> vicinity of Judson Road consist of <strong>the</strong> adjacentresidential property and <strong>the</strong> 100-year floodplain.Access <strong>to</strong> adjacent properties could be maintained via <strong>the</strong> existing roadway network,although <strong>the</strong> streets of Kissing Oak and Chestnut View would need <strong>to</strong> be closed at<strong>the</strong> crossing with <strong>the</strong> potential underpass. Chestnut View Drive could be reroutedwest via <strong>the</strong> identified new connection road <strong>to</strong> Mountain Vista Drive <strong>to</strong> reach JudsonRoad. Kissing Oak Street could be rerouted east <strong>to</strong> Lost Creek Street <strong>to</strong> reachJudson Road. The addition of <strong>the</strong> connection road between Chestnut View Driveand Mountain Vista Drive would require <strong>the</strong> acquisition of additional right-of-way.The grade separation of Judson Road is estimated <strong>to</strong> cost $5 million with anestimated public benefit of $9.95 million, which is nearly two times <strong>the</strong> estimatedcost of <strong>the</strong> grade separation.Grade Separation of Laredo St on <strong>the</strong> Austin Subdivision ML 1Laredo Street is currently a four-lane roadway that crosses <strong>the</strong> UP AustinSubdivision ML 1 in Bexar County in down<strong>to</strong>wn <strong>San</strong> <strong>An<strong>to</strong>nio</strong>. This roadway, withapproximately 12,200 daily vehicles crossing <strong>the</strong> railroad tracks, has been identifiedas a potential candidate for grade separation. The potential four-lane roadwayoverpass would separate vehicular traffic from <strong>the</strong> Austin Subdivision ML 1.A preliminary layout of <strong>the</strong> overpass is included in <strong>the</strong> figures in Appendix E, while<strong>the</strong> environmental constraints and adjacent property land uses are identified in <strong>the</strong>Austin Subdivision ML 1 Constraints Map on sheet 1 of 40 located in Appendix F.The constraints located in <strong>the</strong> vicinity of <strong>the</strong> Laredo Street crossing with <strong>the</strong> railroadinclude adjacent industrial and commercial property, an oil/gas pipeline, leakingpetroleum s<strong>to</strong>rage tanks, a school, IH-35 mainlanes, and two water crossings. Theidentified grade separated roadway would bridge over <strong>the</strong> railroad as well as <strong>the</strong> twowater crossings.Access <strong>to</strong> adjacent properties could be maintained via <strong>the</strong> access roads alongsideLaredo Street with at-grade u-turns located beneath <strong>the</strong> potential overpass on eachside of <strong>the</strong> railroad.8 - 10
<strong>San</strong> <strong>An<strong>to</strong>nio</strong> <strong>Region</strong> <strong>Freight</strong> <strong>Study</strong>Identified ImprovementsThe grade separation of Laredo Street is estimated <strong>to</strong> cost $10.4 million with anestimated public benefit of nearly $8.7 million, which is 83 percent of <strong>the</strong> estimatedcost of <strong>the</strong> grade separation.Grade Separation of Martin St on <strong>the</strong> Austin Subdivision ML 1Martin Street is currently a four-lane roadway that crosses <strong>the</strong> UP Austin SubdivisionML 1 in Bexar County in down<strong>to</strong>wn <strong>San</strong> <strong>An<strong>to</strong>nio</strong>. This roadway, with approximately15,200 daily vehicles crossing <strong>the</strong> railroad tracks, has been identified as a potentialcandidate for grade separation. The potential four-lane roadway underpass wouldseparate vehicular traffic from <strong>the</strong> Austin Subdivision ML 1.A preliminary layout of <strong>the</strong> underpass is included in <strong>the</strong> figures in Appendix E, while<strong>the</strong> environmental constraints and adjacent property land uses are identified in <strong>the</strong>Austin Subdivision ML 1 Constraints Map on sheet 2 of 40 located in Appendix F.The constraints located in <strong>the</strong> vicinity of Martin Street include adjacent industrial andcommercial property and a nearby hospital. Access <strong>to</strong> <strong>the</strong> hospital could beimpacted by <strong>the</strong> identified grade separation, which would require traffic west of <strong>the</strong>railroad <strong>to</strong> use alternate adjacent roadways such as Commerce Street or MoralesStreet <strong>to</strong> cross <strong>the</strong> railroad and reach <strong>the</strong> hospital. Access <strong>to</strong> adjacent propertiesalong <strong>the</strong> identified grade separation would be eliminated due <strong>to</strong> <strong>the</strong> underpassstructure and lack of available right-of-way for frontage roads.<strong>San</strong> Marcos, Comal, Medina, and Frio Streets intersect with Martin Street along <strong>the</strong>identified grade separation and would remain at-grade and bridge over <strong>the</strong> MartinStreet underpass, eliminating connectivity of traffic between <strong>the</strong> intersecting streetsand Martin Street. The potential grade separation should be able <strong>to</strong> be constructedwithin <strong>the</strong> existing roadway right-of-way and should not require <strong>the</strong> acquisition ofadditional land.The grade separation of Martin Street is estimated <strong>to</strong> cost $20.0 million with anestimated public benefit of nearly $11.2 million, which is approximately 56 percent of<strong>the</strong> estimated cost of <strong>the</strong> grade separation.Grade Separation of McCullough on <strong>the</strong> Austin Subdivision ML 1McCullough Avenue is currently a two-lane roadway that crosses <strong>the</strong> UP AustinSubdivision ML 1 in Bexar County in down<strong>to</strong>wn <strong>San</strong> <strong>An<strong>to</strong>nio</strong>. This roadway, withapproximately 14,500 daily vehicles crossing <strong>the</strong> railroad tracks, has been identifiedas a potential candidate for grade separation. According <strong>to</strong> FRA data, one acciden<strong>to</strong>ccurred at <strong>the</strong> McCullough Avenue crossing from 2002 through 2006. The potentialtwo-lane roadway underpass would separate vehicular traffic from <strong>the</strong> AustinSubdivision ML 1.A preliminary layout of <strong>the</strong> underpass is included in <strong>the</strong> figures in Appendix E, while<strong>the</strong> environmental constraints and adjacent property land uses are identified in <strong>the</strong>Austin Subdivision ML 1 Constraints Map on sheet 5 of 40 located in Appendix F.The constraints located in <strong>the</strong> vicinity of McCullough Avenue consist primarily of8 - 11
<strong>San</strong> <strong>An<strong>to</strong>nio</strong> <strong>Region</strong> <strong>Freight</strong> <strong>Study</strong>Identified Improvementsadjacent residential and commercial property. Access <strong>to</strong> adjacent properties along<strong>the</strong> potential grade separation would be eliminated due <strong>to</strong> <strong>the</strong> underpass structureand lack of available right-of-way for frontage roads.The grade separation of McCullough Avenue is estimated <strong>to</strong> cost $8.3 million with anestimated public benefit of $11.3 million, which is 37 percent greater than <strong>the</strong>estimated cost of <strong>the</strong> grade separation.Grade Separation of O’Connor Road on <strong>the</strong> Austin Subdivision ML 1O’Connor Road is currently a four-lane roadway that crosses <strong>the</strong> UP AustinSubdivision ML 1 in Bexar County in <strong>the</strong> city of Bracken. This roadway, withapproximately 26,400 daily vehicles crossing <strong>the</strong> railroad tracks, has been identifiedas a potential candidate for grade separation. The potential four-lane roadwayoverpass would separate vehicular traffic from <strong>the</strong> Austin Subdivision ML 1.A preliminary layout of <strong>the</strong> overpass is included in <strong>the</strong> figures in Appendix E, while<strong>the</strong> environmental constraints and adjacent property land uses are identified in <strong>the</strong>Austin Subdivision ML 1 Constraints Map on sheet 14 of 40 located in Appendix F.The constraints located in <strong>the</strong> vicinity of O’Connor Road include adjacent residentialproperty and a nearby school. Access <strong>to</strong> adjacent properties could be maintainedvia access roads alongside O’Connor Road with at-grade u-turns located beneath<strong>the</strong> overpass on each side of <strong>the</strong> railroad.The grade separation of O’Connor Road is estimated <strong>to</strong> cost $7.9 million with anestimated public benefit of $23 million, which is nearly three times <strong>the</strong> estimated cos<strong>to</strong>f <strong>the</strong> grade separation.Grade Separation of Poplar St on <strong>the</strong> Austin Subdivision ML 1Poplar Street is currently a two-lane roadway that crosses <strong>the</strong> UP Austin SubdivisionML 1 in Bexar County in down<strong>to</strong>wn <strong>San</strong> <strong>An<strong>to</strong>nio</strong>. This roadway, with approximately8,700 daily vehicles crossing <strong>the</strong> railroad tracks, has been identified as a potentialcandidate for grade separation. According <strong>to</strong> FRA data, one accident occurred at<strong>the</strong> Poplar Street crossing from 2002 through 2006. The potential two-lane roadwayunderpass would separate vehicular traffic from <strong>the</strong> Austin Subdivision ML 1.A preliminary layout of <strong>the</strong> underpass is included in <strong>the</strong> figures in Appendix E, while<strong>the</strong> environmental constraints and adjacent property land uses are identified in <strong>the</strong>Austin Subdivision ML 1 Constraints Map on sheet 3 of 40 located in Appendix F.The constraints located in <strong>the</strong> vicinity of Poplar Street consist of adjacent industrialand commercial property and <strong>the</strong> IH-10 main lanes located immediately east of <strong>the</strong>crossing.Access <strong>to</strong> adjacent properties west of <strong>the</strong> railroad could be maintained via accessroads alongside Poplar Street with an at-grade u-turn located above <strong>the</strong> potentialunderpass just west of <strong>the</strong> railroad. Access <strong>to</strong> adjacent properties east of <strong>the</strong>8 - 12
<strong>San</strong> <strong>An<strong>to</strong>nio</strong> <strong>Region</strong> <strong>Freight</strong> <strong>Study</strong>Identified Improvementsrailroad and west of IH-10 along <strong>the</strong> identified grade separation would be eliminateddue <strong>to</strong> <strong>the</strong> underpass structure and lack of available right-of-way for frontage roads.The grade separation of Poplar Street is estimated <strong>to</strong> cost $8.8 million with anestimated public benefit of $7.2 million, which is 82 percent of <strong>the</strong> estimated cost of<strong>the</strong> grade separation.Grade Separation of Ruiz St on <strong>the</strong> Austin Subdivision ML 1Ruiz Street is currently a two-lane roadway that crosses <strong>the</strong> UP Austin SubdivisionML 1 in Bexar County in down<strong>to</strong>wn <strong>San</strong> <strong>An<strong>to</strong>nio</strong>. This roadway, with approximately5,400 daily vehicles crossing <strong>the</strong> railroad tracks, has been identified as a potentialcandidate for grade separation. The potential two-lane roadway underpass wouldseparate vehicular traffic from <strong>the</strong> Austin Subdivision ML 1.A preliminary layout of <strong>the</strong> underpass is included in <strong>the</strong> figures in Appendix E, while<strong>the</strong> environmental constraints and adjacent property land uses are identified in <strong>the</strong>Austin Subdivision ML 1 Constraints Map on sheet 2 of 40 located in Appendix F.The constraints located in <strong>the</strong> vicinity of Ruiz Street consist primarily of adjacentresidential and commercial property. Access <strong>to</strong> adjacent properties could bemaintained via access roads alongside Ruiz Street with at-grade u-turns locatedbeneath <strong>the</strong> overpass on each side of <strong>the</strong> railroad.The grade separation of Ruiz Street is estimated <strong>to</strong> cost $26.3 million with anestimated public benefit of $3.8 million, which is approximately 14 percent of <strong>the</strong>estimated cost of <strong>the</strong> grade separation.Grade Separation of <strong>San</strong> <strong>An<strong>to</strong>nio</strong> St on <strong>the</strong> Austin Subdivision ML 1<strong>San</strong> <strong>An<strong>to</strong>nio</strong> Street is currently a four-lane roadway that crosses <strong>the</strong> UP AustinSubdivision ML 1 in Comal County in <strong>the</strong> city of New Braunfels. This roadway, withapproximately 8,200 daily vehicles crossing <strong>the</strong> railroad tracks, has been identifiedas a potential candidate for grade separation. The potential four-lane roadwayunderpass would separate vehicular traffic from <strong>the</strong> Austin Subdivision ML 1.A preliminary layout of <strong>the</strong> underpass is included in <strong>the</strong> figures in Appendix E, while<strong>the</strong> environmental constraints and adjacent property land uses are identified in <strong>the</strong>Austin Subdivision ML 1 Constraints Map on sheet 30 of 40 located in Appendix F.The constraints located in <strong>the</strong> vicinity of <strong>San</strong> <strong>An<strong>to</strong>nio</strong> Street consist of adjacentcommercial, residential, and public and institutional properties, including registeredhis<strong>to</strong>ric sites. Access <strong>to</strong> adjacent properties would be eliminated alongside <strong>the</strong>identified <strong>San</strong> <strong>An<strong>to</strong>nio</strong> Street underpass due <strong>to</strong> <strong>the</strong> lack of available right-of-way forfrontage roads.The grade separation of <strong>San</strong> <strong>An<strong>to</strong>nio</strong> Street is estimated <strong>to</strong> cost $12.3 million with anestimated public benefit of $7.6 million, which is 62 percent of <strong>the</strong> estimated cost of<strong>the</strong> grade separation.8 - 13
<strong>San</strong> <strong>An<strong>to</strong>nio</strong> <strong>Region</strong> <strong>Freight</strong> <strong>Study</strong>Identified ImprovementsGrade Separation of Sunset Rd on <strong>the</strong> Austin Subdivision ML 1Sunset Road is currently a four-lane roadway that crosses <strong>the</strong> UP Austin SubdivisionML 1 in Bexar County in <strong>the</strong> city of <strong>San</strong> <strong>An<strong>to</strong>nio</strong>. This roadway, with approximately16,800 daily vehicles crossing <strong>the</strong> railroad tracks, has been identified as a potentialcandidate for grade separation. The potential four-lane roadway underpass wouldseparate vehicular traffic from <strong>the</strong> Austin Subdivision ML 1.A preliminary layout of <strong>the</strong> underpass is included in <strong>the</strong> figures in Appendix E, while<strong>the</strong> environmental constraints and adjacent property land uses are identified in <strong>the</strong>Austin Subdivision ML 1 Constraints Map on sheet 7 of 40 located in Appendix F.The constraints located in <strong>the</strong> vicinity of Sunset Road consist of adjacent commercialand residential property and <strong>the</strong> 100-year floodplain. The location of <strong>the</strong> 100-yearfloodplain may require additional drainage design considerations for this gradeseparation. Access <strong>to</strong> adjacent properties could be maintained via access roadsalongside <strong>the</strong> identified Sunset Road underpass with an at-grade u-turn locatedabove <strong>the</strong> underpass east of <strong>the</strong> railroad.The grade separation of Sunset Road is estimated <strong>to</strong> cost $11.9 million with anestimated public benefit of $12.7 million, which is approximately seven percentgreater than <strong>the</strong> estimated cost of <strong>the</strong> grade separation.Grade Separation of Thousand Oaks Dr on <strong>the</strong> Austin Subdivision ML 1Thousand Oaks Drive is currently a four-lane roadway that crosses <strong>the</strong> UP AustinSubdivision ML 1 in Bexar County in <strong>San</strong> <strong>An<strong>to</strong>nio</strong>. This roadway, with approximately27,600 daily vehicles crossing <strong>the</strong> railroad tracks, has been identified as a potentialcandidate for grade separation. According <strong>to</strong> FRA data, two accidents occurred at<strong>the</strong> Thousand Oaks Drive crossing from 2002 through 2006. The potential four-laneroadway underpass would separate vehicular traffic from <strong>the</strong> Austin Subdivision ML1.A preliminary layout of <strong>the</strong> underpass is included in <strong>the</strong> figures in Appendix E, while<strong>the</strong> environmental constraints and adjacent property land uses are identified in <strong>the</strong>Austin Subdivision ML 1 Constraints Map on sheet 12 of 40 located in Appendix F.The constraints located in <strong>the</strong> vicinity of Thousand Oaks Drive consist primarily of<strong>the</strong> adjacent commercial properties and <strong>the</strong> proximity of Wetmore Road, which runsparallel <strong>to</strong> <strong>the</strong> railroad. In order <strong>to</strong> maintain connectivity between Wetmore Roadand Thousand Oaks Drive, <strong>the</strong> existing lanes of Wetmore Road would need <strong>to</strong> bedepressed <strong>to</strong> meet <strong>the</strong> lanes of <strong>the</strong> Thousand Oaks Drive underpass. Access <strong>to</strong>adjacent properties should be unaffected for properties east of <strong>the</strong> railroad, whileproperties west of <strong>the</strong> railroad may require additional access roads or landacquisition due <strong>to</strong> <strong>the</strong> identified underpass.The grade separation of Thousand Oaks Drive is estimated <strong>to</strong> cost $20.6 million withan estimated public benefit of $25.9 million, which is 26 percent greater than <strong>the</strong>estimated cost of <strong>the</strong> grade separation.8 - 14
<strong>San</strong> <strong>An<strong>to</strong>nio</strong> <strong>Region</strong> <strong>Freight</strong> <strong>Study</strong>Identified ImprovementsGrade Separation of Woodlawn Ave on <strong>the</strong> Austin Subdivision ML 1Woodlawn Avenue is currently a two-lane roadway that crosses <strong>the</strong> UP AustinSubdivision ML 1 in Bexar County in down<strong>to</strong>wn <strong>San</strong> <strong>An<strong>to</strong>nio</strong>. This roadway, withapproximately 8,200 daily vehicles crossing <strong>the</strong> railroad tracks, has been identifiedas a potential candidate for grade separation. The potential two-lane roadwayunderpass would separate vehicular traffic from <strong>the</strong> Austin Subdivision ML 1.A preliminary layout of <strong>the</strong> underpass is included in <strong>the</strong> figures in Appendix E, while<strong>the</strong> environmental constraints and adjacent property land uses are identified in <strong>the</strong>Austin Subdivision ML 1 Constraints Map on sheet 4 of 40 located in Appendix F.The constraints located in <strong>the</strong> vicinity of Woodlawn Avenue consist primarily of <strong>the</strong>adjacent residential properties. Access <strong>to</strong> adjacent properties along <strong>the</strong> identifiedpotential grade separation would be eliminated due <strong>to</strong> <strong>the</strong> underpass structure andlack of available right-of-way for frontage roads.The grade separation of Woodlawn Avenue is estimated <strong>to</strong> cost $7.8 million with anestimated public benefit of $6.3 million, which is 81 percent of <strong>the</strong> estimated cost of<strong>the</strong> grade separation.Crossing ClosuresCrossing Closure of Coll Street, Mill Street, and Bridge Street on <strong>the</strong> AustinSubdivision ML 1Coll, Mill, and Bridge Streets are each currently two-lane roadways that cross <strong>the</strong>railroad at-grade in Comal County in <strong>the</strong> city of New Braunfels. Approximately 600vehicles cross <strong>the</strong> UP at each location daily. Coll, Mill, and Bridge Streets should beconsidered for closure at <strong>the</strong>ir intersections with <strong>the</strong> UP Austin Subdivision ML 1 inorder <strong>to</strong> reduce public safety hazards currently associated with <strong>the</strong> existing at-gradecrossings.The location of <strong>the</strong> potential crossing closures as well as <strong>the</strong> alternative routes andassociated distances are identified in Appendix E, while <strong>the</strong> environmentalconstraints and adjacent property uses are identified in <strong>the</strong> Austin Subdivision ML 1Constraints Map on sheet 30 of 40 located in Appendix F. Constraints located in <strong>the</strong>vicinity of <strong>the</strong>se streets consist primarily of residential properties as well ascommercial and public buildings.Access <strong>to</strong> adjacent properties could be maintained via <strong>the</strong> existing roadway network.Traffic could be rerouted from <strong>the</strong> potential crossing closures <strong>to</strong> <strong>San</strong> <strong>An<strong>to</strong>nio</strong> Street<strong>to</strong> cross <strong>the</strong> railroad. Right-of-way acquisition of <strong>the</strong> adjacent properties should notbe required since no new construction is required.The potential crossing closures are each estimated <strong>to</strong> cost $50,000. The estimatedpublic benefit could not be calculated for <strong>the</strong>se potential crossing closures since <strong>the</strong>traffic would be rerouted <strong>to</strong> ano<strong>the</strong>r at-grade crossing; however, <strong>the</strong> closures wouldproduce a safety benefit for <strong>the</strong> traveling public.8 - 15
<strong>San</strong> <strong>An<strong>to</strong>nio</strong> <strong>Region</strong> <strong>Freight</strong> <strong>Study</strong>Identified ImprovementsCrossing Closure of Comal Street, Castell Street, Elm Street, and Jahn Street on <strong>the</strong>Austin Subdivision ML 1Comal, Castell, Elm, and Jahn Streets are each currently two-lane roadways thatcross <strong>the</strong> railroad at-grade in Comal County in <strong>the</strong> city of New Braunfels.Approximately 600 vehicles cross <strong>the</strong> UP at each location daily. The crossingsshould be considered for closure at <strong>the</strong>ir intersections with <strong>the</strong> UP AustinSubdivision ML 1 in order <strong>to</strong> reduce public safety hazards currently associated with<strong>the</strong> existing at-grade crossings.The location of <strong>the</strong> potential crossing closures as well as <strong>the</strong> alternative routes andassociated distances are identified in Appendix E, while <strong>the</strong> environmentalconstraints and adjacent property uses are identified in <strong>the</strong> Austin Subdivision ML 1Constraints Map on sheet 31 of 40 located in Appendix F. Constraints located in <strong>the</strong>vicinity of <strong>the</strong>se streets consist primarily of residential properties as well ascommercial and public buildings and nearby schools.Access <strong>to</strong> adjacent properties could be maintained via <strong>the</strong> existing roadway network.Traffic could be rerouted from <strong>the</strong> potential crossing closures <strong>to</strong> Seguin Avenue,which is an existing grade separation. Right-of-way acquisition of <strong>the</strong> adjacentproperties should not be required since no new construction is required.The potential crossing closures are each estimated <strong>to</strong> cost $50,000. The estimatedpublic benefit for closing <strong>the</strong> crossings at Comal, Castell, and Elm Streets isapproximately $360 thousand for each of <strong>the</strong> crossings and <strong>the</strong> estimated benefit forclosing Jahn Street is $540 thousand.Crossing Closure of Commerce Street on <strong>the</strong> Austin Subdivision ML 1Commerce Street is currently a two-lane roadway with main lanes that overpass <strong>the</strong>railroad and frontage roads that cross <strong>the</strong> railroad at-grade in Bexar County in <strong>San</strong><strong>An<strong>to</strong>nio</strong>. Approximately 13,500 vehicles cross <strong>the</strong> UP at this location daily.Commerce Street should be considered for closure at <strong>the</strong> intersection with <strong>the</strong> UPAustin Subdivision ML 1 in order <strong>to</strong> reduce public safety hazards currentlyassociated with <strong>the</strong> existing at-grade crossing.The location of <strong>the</strong> potential crossing closure as well as <strong>the</strong> alternative route andassociated distance are identified in Appendix E, while <strong>the</strong> environmental constraintsand adjacent property uses are identified in <strong>the</strong> Austin Subdivision ML 1 ConstraintsMap on sheet 2 of 40 located in Appendix F. The primary constraint located in <strong>the</strong>vicinity of this street consists of adjacent commercial properties.Access <strong>to</strong> adjacent properties along <strong>the</strong> Commerce Street frontage roads could bemaintained via <strong>the</strong> existing roadway network. Traffic could be rerouted from <strong>the</strong>potential crossing closure <strong>to</strong> cross <strong>the</strong> railroad along <strong>the</strong> grade separated lanes ofCommerce Street. Right-of-way acquisition of <strong>the</strong> adjacent properties should not berequired since no new construction is required.8 - 16
<strong>San</strong> <strong>An<strong>to</strong>nio</strong> <strong>Region</strong> <strong>Freight</strong> <strong>Study</strong>Identified ImprovementsThe potential crossing closure at Commerce Street is estimated <strong>to</strong> cost $50,000 withan estimated public benefit for closing <strong>the</strong> crossing of approximately $9.7 million.Crossing Closure of Dora Street on <strong>the</strong> Austin Subdivision ML 1Dora Street is currently a two-lane roadway that crosses <strong>the</strong> railroad at-grade inBexar County in <strong>San</strong> <strong>An<strong>to</strong>nio</strong>. Approximately 400 vehicles cross <strong>the</strong> UP at thislocation daily. Dora Street should be considered for closure at <strong>the</strong> intersection with<strong>the</strong> UP Austin Subdivision ML 1 in order <strong>to</strong> reduce public safety hazards currentlyassociated with <strong>the</strong> existing at-grade crossing.The location of <strong>the</strong> potential crossing closure as well as <strong>the</strong> alternative route andassociated distance are identified in Appendix E, while <strong>the</strong> environmental constraintsand adjacent property uses are identified in <strong>the</strong> Austin Subdivision ML 1 ConstraintsMap on sheet 5 of 40 located in Appendix F. The primary constraints located in <strong>the</strong>vicinity of this street consist of adjacent residential properties and area schools.Access <strong>to</strong> adjacent properties along Dora Street could be maintained via <strong>the</strong> existingroadway network. Traffic could be rerouted from <strong>the</strong> potential crossing closure <strong>to</strong>cross <strong>the</strong> railroad along McCullough Avenue, Olmos Drive, or <strong>San</strong> Pedro Avenue.Right-of-way acquisition of <strong>the</strong> adjacent properties should not be required since nonew construction is required.The potential crossing closure at Dora Street is estimated <strong>to</strong> cost $50,000. Thepublic benefit could not be calculated for closing <strong>the</strong> crossing since traffic may bererouted <strong>to</strong> ano<strong>the</strong>r at-grade crossing, although closing <strong>the</strong> crossing would producea public benefit of improved safety.Crossing Closure of Hickman Street on <strong>the</strong> Austin Subdivision ML 1Hickman Street is currently a two-lane roadway that crosses <strong>the</strong> railroad at-grade inBexar County in <strong>San</strong> <strong>An<strong>to</strong>nio</strong>. Approximately 700 vehicles cross <strong>the</strong> UP at thislocation daily. Hickman Street should be considered for closure at <strong>the</strong> intersectionwith <strong>the</strong> UP Austin Subdivision ML 1 in order <strong>to</strong> reduce public safety hazardscurrently associated with <strong>the</strong> existing at-grade crossing.The location of <strong>the</strong> potential crossing closure as well as <strong>the</strong> alternative route andassociated distance are identified in Appendix E, while <strong>the</strong> environmental constraintsand adjacent property uses are identified in <strong>the</strong> Austin Subdivision ML 1 ConstraintsMap on sheet 3 of 40 located in Appendix F. Constraints located in <strong>the</strong> vicinity ofthis street consist primarily of residential, commercial, and industrial properties aswell as a nearby school.Access <strong>to</strong> adjacent properties could be maintained via <strong>the</strong> existing roadway network.Traffic could be rerouted from <strong>the</strong> potential crossing closure <strong>to</strong> <strong>the</strong> north on AshbyPlace or <strong>to</strong> <strong>the</strong> south on Fredericksburg Road <strong>to</strong> cross <strong>the</strong> railroad. Both AshbyPlace and Fredericksburg Road are included as potential grade separations as part8 - 17
<strong>San</strong> <strong>An<strong>to</strong>nio</strong> <strong>Region</strong> <strong>Freight</strong> <strong>Study</strong>Identified Improvementsof this study. Right-of-way acquisition of <strong>the</strong> adjacent properties should not berequired since no new construction is required.The potential crossing closure at Hickman Street is estimated <strong>to</strong> cost $50,000 withan estimated public benefit for closing <strong>the</strong> crossing of approximately $520 thousand.Crossing Closure of Hollywood Ave, Elsmere Pl, Kings Hwy, and Summit Ave on <strong>the</strong>Austin Subdivision ML 1Hollywood Avenue, Elsmere Place, Kings Highway and Summit Avenue are eachcurrently two-lane roadways that cross <strong>the</strong> railroad at-grade in Bexar County in <strong>San</strong><strong>An<strong>to</strong>nio</strong>. Approximately 700 vehicles cross <strong>the</strong> UP at each location daily. Thecrossings should be considered for closure at <strong>the</strong>ir intersections with <strong>the</strong> UP AustinSubdivision ML 1 in order <strong>to</strong> reduce public safety hazards currently associated with<strong>the</strong> existing at-grade crossings.The location of <strong>the</strong> potential crossing closures as well as <strong>the</strong> alternative routes andassociated distances are identified in Appendix E, while <strong>the</strong> environmentalconstraints and adjacent property uses are identified in <strong>the</strong> Austin Subdivision ML 1Constraints Map on sheet 4 of 40 located in Appendix F. Constraints located in <strong>the</strong>vicinity of <strong>the</strong>se streets consist primarily of residential properties as well as nearbyschools.Access <strong>to</strong> adjacent properties could be maintained via <strong>the</strong> existing roadway network.Traffic may be rerouted from <strong>the</strong> closed crossings <strong>to</strong> Ful<strong>to</strong>n Avenue, which is anexisting grade separation. Right-of-way acquisition of <strong>the</strong> adjacent properties wouldnot be required since no new construction is required.The crossing closures are each estimated <strong>to</strong> cost $50,000. The estimated publicbenefit for closing <strong>the</strong> crossings at Hollywood Avenue, Kings Highway and SummitAvenue is approximately $470 thousand each and <strong>the</strong> crossing at Elsmere Place isapproximately $300 thousand.Crossing Closure of Laurel Street and Lombrano Street on <strong>the</strong> Austin SubdivisionML 1Laurel and Lombrano Streets are each currently two-lane roadways that cross <strong>the</strong>railroad at-grade in Bexar County in <strong>San</strong> <strong>An<strong>to</strong>nio</strong>. Approximately 700 vehicles cross<strong>the</strong> UP at each location daily. The crossings should be considered for closure at<strong>the</strong>ir intersections with <strong>the</strong> UP Austin Subdivision ML 1 in order <strong>to</strong> reduce publicsafety hazards currently associated with <strong>the</strong> existing at-grade crossings.The location of <strong>the</strong> potential crossing closures as well as <strong>the</strong> alternative routes andassociated distances are identified in Appendix E, while <strong>the</strong> environmentalconstraints and adjacent property uses are identified in <strong>the</strong> Austin Subdivision ML 1Constraints Map on sheet 3 of 40 located in Appendix F. Constraints located in <strong>the</strong>vicinity of <strong>the</strong>se streets consist primarily of adjacent commercial and industrialproperty.8 - 18
<strong>San</strong> <strong>An<strong>to</strong>nio</strong> <strong>Region</strong> <strong>Freight</strong> <strong>Study</strong>Identified ImprovementsAccess <strong>to</strong> adjacent properties could be maintained via <strong>the</strong> existing roadway network.Traffic may be rerouted from <strong>the</strong> closed crossings <strong>to</strong> <strong>the</strong> north on Culebra Avenue,which is included as a potential grade separation in this study. Right-of-wayacquisition of <strong>the</strong> adjacent properties would not be required since no newconstruction is required.The crossing closures are each estimated <strong>to</strong> cost $50,000. The estimated publicbenefit for closing <strong>the</strong> crossing at Laurel Street is approximately $340 thousand andLombrano Street is approximately $320 thousand.Crossing Closure of Main Avenue /Zilla Street on <strong>the</strong> Austin Subdivision ML 1Main Avenue is currently a two-lane roadway that crosses <strong>the</strong> railroad at-grade inBexar County in <strong>San</strong> <strong>An<strong>to</strong>nio</strong>. Approximately 700 vehicles cross <strong>the</strong> UP at thislocation daily. Main Avenue should be considered for closure at <strong>the</strong> intersection with<strong>the</strong> UP Austin Subdivision ML 1 in order <strong>to</strong> reduce public safety hazards currentlyassociated with <strong>the</strong> existing at-grade crossing.The location of <strong>the</strong> potential crossing closure as well as <strong>the</strong> alternative route andassociated distance are identified in Appendix E, while <strong>the</strong> environmental constraintsand adjacent property uses are identified in <strong>the</strong> Austin Subdivision ML 1 ConstraintsMap on sheet 5 of 40 located in Appendix F. Constraints located in <strong>the</strong> vicinity ofthis street consist primarily of residential properties as well as a nearby school.Access <strong>to</strong> adjacent properties could be maintained via <strong>the</strong> existing roadway network.Traffic could be rerouted from <strong>the</strong> potential crossing closure <strong>to</strong> McCullough Avenue,which is included as a potential grade separation in this study, <strong>to</strong> cross <strong>the</strong> railroad.Right-of-way acquisition of <strong>the</strong> adjacent properties should not be required since nonew construction is required.The potential crossing closure at Main Avenue is estimated <strong>to</strong> cost $50,000 with anestimated public benefit for closing <strong>the</strong> crossing of approximately $600 thousand.Crossing Closure of Perez Street on <strong>the</strong> Austin Subdivision ML 1Perez Street is currently a two-lane roadway that crosses <strong>the</strong> railroad at-grade inBexar County in <strong>San</strong> <strong>An<strong>to</strong>nio</strong>. Approximately 700 vehicles cross <strong>the</strong> UP at thislocation daily. Perez Street should be considered for closure at <strong>the</strong> intersection with<strong>the</strong> UP Austin Subdivision ML 1 in order <strong>to</strong> reduce public safety hazards currentlyassociated with <strong>the</strong> existing at-grade crossing.The location of <strong>the</strong> potential crossing closure as well as <strong>the</strong> alternative route andassociated distance are identified in Appendix E, while <strong>the</strong> environmental constraintsand adjacent property uses are identified in <strong>the</strong> Austin Subdivision ML 1 ConstraintsMap on sheet 2 of 40 located in Appendix F. Constraints located in <strong>the</strong> vicinity ofthis street consist primarily of commercial properties as well as a nearby hospital.Access <strong>to</strong> and from <strong>the</strong> hospital should be minimally effected, if at all, by <strong>the</strong> closure8 - 19
<strong>San</strong> <strong>An<strong>to</strong>nio</strong> <strong>Region</strong> <strong>Freight</strong> <strong>Study</strong>Identified Improvementsof <strong>the</strong> Perez Street Crossing since <strong>the</strong> roadways immediately north and south ofPerez Street would remain open for hospital access.Access <strong>to</strong> adjacent properties could be maintained via <strong>the</strong> existing roadway network.Traffic may be rerouted from <strong>the</strong> closed crossing <strong>to</strong> <strong>the</strong> north on Leal Street or <strong>to</strong> <strong>the</strong>south on Morales Street or on <strong>the</strong> grade separated Commerce Street <strong>to</strong> cross <strong>the</strong>railroad. Right-of-way acquisition of <strong>the</strong> adjacent properties would not be requiredsince no new construction is required.The crossing closure at Perez Street is estimated <strong>to</strong> cost $50,000. The estimatedpublic benefit could not be calculated for this crossing closure since <strong>the</strong> traffic wouldbe rerouted <strong>to</strong> o<strong>the</strong>r at-grade crossings; however, <strong>the</strong> closure would produce asafety benefit for <strong>the</strong> traveling public.Crossing Closure of Magnolia Ave, Mistle<strong>to</strong>e Ave, Craig Pl, and Russell Pl on <strong>the</strong>Austin Subdivision ML 1Magnolia Avenue, Mistle<strong>to</strong>e Avenue, Craig Place and Russell Place are eachcurrently two-lane roadways that cross <strong>the</strong> railroad at-grade in Bexar County in <strong>San</strong><strong>An<strong>to</strong>nio</strong>. Approximately 700 vehicles cross <strong>the</strong> UP at each location daily. Thecrossings should be considered for closure at <strong>the</strong>ir intersections with <strong>the</strong> UP AustinSubdivision ML 1 in order <strong>to</strong> reduce public safety hazards currently associated with<strong>the</strong> existing at-grade crossings.The location of <strong>the</strong> potential crossing closures as well as <strong>the</strong> alternative routes andassociated distances are identified in Appendix E, while <strong>the</strong> environmentalconstraints and adjacent property uses are identified in <strong>the</strong> Austin Subdivision ML 1Constraints Map on sheet 4 of 40 located in Appendix F. Constraints located in <strong>the</strong>vicinity of <strong>the</strong>se streets consist primarily of residential properties.Access <strong>to</strong> adjacent properties could be maintained via <strong>the</strong> existing roadway network.Traffic may be rerouted from <strong>the</strong> closed crossings <strong>to</strong> Woodlawn Avenue, whichincluded as a potential grade separation in this study. Right-of-way acquisition of <strong>the</strong>adjacent properties would not be required since no new construction is required.The crossing closures are each estimated <strong>to</strong> cost $50,000. The estimated publicbenefit for closing <strong>the</strong> crossings at Magnolia Avenue, Craig Place and Russell Placeis approximately $470 thousand each and at Mistle<strong>to</strong>e Avenue is approximately $1.2million.Crossing Closure of Rivas St, Delgado St, and Arbor St on <strong>the</strong> Austin SubdivisionML 1Rivas Street, Delgado Street, and Arbor Place are each currently two-lane roadwaysthat cross <strong>the</strong> railroad at-grade in Bexar County in <strong>San</strong> <strong>An<strong>to</strong>nio</strong>. Approximately 700vehicles cross <strong>the</strong> UP at each location daily. The crossings should be considered forclosure at <strong>the</strong>ir intersections with <strong>the</strong> UP Austin Subdivision ML 1 in order <strong>to</strong> reducepublic safety hazards currently associated with <strong>the</strong> existing at-grade crossings.8 - 20
<strong>San</strong> <strong>An<strong>to</strong>nio</strong> <strong>Region</strong> <strong>Freight</strong> <strong>Study</strong>Identified ImprovementsThe location of <strong>the</strong> potential crossing closures as well as <strong>the</strong> alternative routes andassociated distances are identified in Appendix E, while <strong>the</strong> environmentalconstraints and adjacent property uses are identified in <strong>the</strong> Austin Subdivision ML 1Constraints Map on sheet 3 of 40 located in Appendix F. Constraints located in <strong>the</strong>vicinity of <strong>the</strong>se streets consist of adjacent residential and commercial property aswell as a nearby school.Access <strong>to</strong> adjacent properties could be maintained via <strong>the</strong> existing roadway network.Traffic may be rerouted from <strong>the</strong> closed crossings <strong>to</strong> <strong>the</strong> north on Poplar Street or <strong>to</strong><strong>the</strong> south on Ruiz Street, which are both included as a potential grade separations inthis study. Right-of-way acquisition of <strong>the</strong> adjacent properties would not be requiredsince no new construction is required.The crossing closures are each estimated <strong>to</strong> cost $50,000. The estimated publicbenefit for closing <strong>the</strong> crossing at Rivas Street is approximately $290 thousand, atDelgado Street is approximately $690 thousand, and at Arbor Place is approximately$260 thousand.Crossing Closure of Tampico St on <strong>the</strong> Austin Subdivision ML 1Tampico Street is currently a two-lane roadway that crosses <strong>the</strong> railroad at-grade inBexar County in <strong>San</strong> <strong>An<strong>to</strong>nio</strong>. Approximately 700 vehicles cross <strong>the</strong> UP at thislocation daily. Tampico Street should be considered for closure at <strong>the</strong> intersectionwith <strong>the</strong> UP Austin Subdivision ML 1 in order <strong>to</strong> reduce public safety hazardscurrently associated with <strong>the</strong> existing at-grade crossing.The location of <strong>the</strong> potential crossing closure as well as <strong>the</strong> alternative route andassociated distance are identified in Appendix E, while <strong>the</strong> environmental constraintsand adjacent property uses are identified in <strong>the</strong> Austin Subdivision ML 1 ConstraintsMap on sheet 1 of 40 located in Appendix F. Constraints located in <strong>the</strong> vicinity ofthis street consist primarily of adjacent residential, commercial, and industrialproperties.Access <strong>to</strong> adjacent properties could be maintained via <strong>the</strong> existing roadway network.Traffic may be rerouted from <strong>the</strong> closed crossing <strong>to</strong> <strong>the</strong> north on Guadalupe Street,which is an existing grade separation, or <strong>to</strong> <strong>the</strong> south on Laredo Street, which isincluded as a potential grade separation in this study. Right-of-way acquisition of <strong>the</strong>adjacent properties would not be required since no new construction is required.The crossing closure at Tampico Street is estimated <strong>to</strong> cost $50,000 with anestimated public benefit of approximately $330 thousand.Railroad ImprovementsNone of <strong>the</strong> improvements described as follows have been constructed nor areunder construction.8 - 21
<strong>San</strong> <strong>An<strong>to</strong>nio</strong> <strong>Region</strong> <strong>Freight</strong> <strong>Study</strong>Identified ImprovementsImprovement 4 – Construct one new connection track between Austin SubdivisionML 1 and Lockhart Subdivisions in <strong>San</strong> Marcos.The Lockhart Subdivision at milepost 51.90 connects <strong>to</strong> <strong>the</strong> Austin ML-1 Subdivisionmilepost 209.10 north of <strong>the</strong> <strong>San</strong> Marcos River. It is proposed <strong>to</strong> construct aconnection north of <strong>the</strong> existing switch <strong>to</strong> allow for westward traffic on <strong>the</strong> LockhartSubdivision a direct connection northward <strong>to</strong>wards Austin on Austin ML-1.Improvement 9 – Construct new connections in <strong>the</strong> nor<strong>the</strong>ast and northwestquadrants of <strong>the</strong> Austin Subdivision ML 1 and Del Rio Subdivision diamond south of<strong>San</strong> Fernando Yard and Apache Jct.At approximately milepost 259.87 of <strong>the</strong> Austin ML-1 Subdivision and milepost212.67 of <strong>the</strong> Del Rio Subdivision, it is proposed <strong>to</strong> construct nor<strong>the</strong>ast andnorthwest connections for direct train movements between <strong>the</strong> two lines.Improvement 11 - Extend Hestes and Hut<strong>to</strong> sidings (Austin Subdivision ML 1, southof Taylor) <strong>to</strong> just over 2 miles in lengthThe existing Hestes and Hut<strong>to</strong> sidings are located on <strong>the</strong> west and east sides ofAustin Subdivision ML 1 and extend from milepost 149.85 <strong>to</strong> milepost 151.43 andmilepost 153.07 <strong>to</strong> milepost 153.80, respectively, and connect at both ends <strong>to</strong> <strong>the</strong>mainline. There is an additional stub-ended siding 712 at approximate milepost153.30 connected <strong>to</strong> <strong>the</strong> Hestes siding. Both sidings are limited in length <strong>to</strong> meetcurrent freight operations. It is proposed <strong>to</strong> extend <strong>the</strong> Hestes siding approximately0.4 miles north and <strong>the</strong> Hut<strong>to</strong> siding 0.4 north and 0.7 miles south. Both locationswould now provide approximate two mile-long passing sidings.Improvement 12- Extend Landas Park siding (Austin Subdivision ML 1) <strong>to</strong> a length of2.9 milesLandas Park siding, milepost 227.90 <strong>to</strong> milepost 228.61 is located on <strong>the</strong> west sideof ML 1 just south of New Braunfels. It is proposed <strong>to</strong> extend this sidingapproximately 2.2 miles <strong>to</strong> <strong>the</strong> south with a connection back in<strong>to</strong> <strong>the</strong> main track.Improvement 13 – Extend and connect both North Loop and Adams sidings (AustinSubdivision ML 1) <strong>to</strong> create a 3.7 mile long passing sidingNorth Loop and Adams sidings are located on <strong>the</strong> east and west sides of ML 1 andextend from milepost 250.52 <strong>to</strong> milepost 252.12 and milepost 253.38 <strong>to</strong> milepost254.26 respectively and just north of <strong>San</strong> <strong>An<strong>to</strong>nio</strong>. It is proposed <strong>to</strong> extend NorthLoop siding south and Adams siding north with <strong>the</strong> addition of approximately 1.26miles of new track and new switches. With track swings, this would result in anapproximate 3.74 mile long passing siding.Improvement 17 - Siding upgrades between Round Rock and <strong>San</strong> <strong>An<strong>to</strong>nio</strong> <strong>to</strong>provide sufficient locations for train meetsRound Rock and <strong>San</strong> <strong>An<strong>to</strong>nio</strong> have milepost designations of 160.37 andapproximately 206.00 on <strong>the</strong> Austin Subdivision ML 1. Improvements <strong>to</strong> sidings inthis area include leng<strong>the</strong>ning and installation of #16 switches. There are existing8 - 22
<strong>San</strong> <strong>An<strong>to</strong>nio</strong> <strong>Region</strong> <strong>Freight</strong> <strong>Study</strong>Identified Improvementssidings that connect on both ends <strong>to</strong> ML 1 at Round Rock (milepost 160.37 <strong>to</strong>161.85), McNeil (milepost 166.09 <strong>to</strong> 167.16), Hooper (milepost 171.27 <strong>to</strong> 171.50),Sneed (milepost 172.51 <strong>to</strong> 174.33), Austin (milepost 179.06 <strong>to</strong> 179.50), Bergstrom(milepost 186.65 <strong>to</strong> 188.60), Buda (milepost 194.25 <strong>to</strong> 195.37), Kyle (milepost200.20 <strong>to</strong> 201.75), Centex (milepost 206.64 <strong>to</strong> 208.35), Goodwin (milepost 220.96 <strong>to</strong>223.14), New Braunfels (milepost 227.90 <strong>to</strong> 228.61), Brautex (milepost 230.07 <strong>to</strong>230.78), Dittlinger (milepost 230.84 <strong>to</strong> 231.37), Corbyn (milepost 233. 44 <strong>to</strong> 235.13),Bracken (milepost 239.36 <strong>to</strong> 241.10), North Loop (milepost 250.52 <strong>to</strong> 252.12) andAdams (milepost 253.38 <strong>to</strong> 254.26).Several of <strong>the</strong>se improvements are located in areas where new railroad bridgeswould be needed for construction and existing rail infrastructure (switches and o<strong>the</strong>rsidings) are in <strong>the</strong> immediate vicinity of proposed increases in siding lengths. Nowork was suggested in <strong>the</strong>se areas. See Table 8-2 below for improvements.Siding Name Milepost <strong>to</strong> Milepost LengthProposedLength CommentRound Rock 160.37 161.85 1.48 1.88 extend northMcNeil 166.09 167.16 1.07 2 extend southKyle 200.2 201.75 1.55 1.85 extend southCentex 206.64 208.35 1.71 2 extend northDittlinger 230.84 231.37 0.53 1.45 extend southCorbyn 233.44 235.13 1.69 2 extend northBracken 239.36 241.1 1.74 2 extend northNorth Loop 250.52 252.12 1.6 with Improvement 15Adams 253.38 254.26 0.88 with Improvement 15Table 8-2: Siding Upgrades between Round Rock and <strong>San</strong> <strong>An<strong>to</strong>nio</strong>Improvement 18 - Upgrade Austin Subdivision ML 1 sidings <strong>to</strong> CTC at Adams,Landas Park, <strong>Texas</strong> Lehigh, Buda, Austin, McNeil and White LimeTo expedite train movements and increase capacity, it is proposed <strong>to</strong> upgrade <strong>the</strong>sesidings from milepost 253.80 <strong>to</strong> 165.60 on <strong>the</strong> Austin Subdivision ML 1 <strong>to</strong>computerized train control (CTC) system. Today, <strong>the</strong> ML 1 track chart indicates anABS signal system beginning in <strong>San</strong> <strong>An<strong>to</strong>nio</strong> and milepost 259.10 <strong>to</strong> <strong>the</strong> <strong>San</strong><strong>An<strong>to</strong>nio</strong>/Hous<strong>to</strong>n Division limit (milepost 94.00), about 4 ½ miles south of Hearne.Absolute signals exist on <strong>the</strong> siding at Adams (milepost 254.26 <strong>to</strong> 253.38), nosignals for <strong>the</strong> siding at Landas Park (milepost 228.61 <strong>to</strong> 227.90), absolute signal for<strong>the</strong> siding at <strong>Texas</strong> Lehigh (milepost 197.14), no signals for <strong>the</strong> siding at Buda(milepost 195.37 <strong>to</strong> 194.25), no signals for <strong>the</strong> siding at Austin (milepost 179.50 <strong>to</strong>179.06) and no signals for McNeil siding (milepost 167.16 <strong>to</strong> 166.09). The WhiteLime siding (milepost 165.60) switch is located within McNeil Interlocking.Improvement 28 - Construct a new connection at Taylor between <strong>the</strong> between <strong>the</strong>Waco and Austin SubdivisionsConstruct a higher speed connection track and switches between <strong>the</strong> Waco andAustin ML-1 Subdivisions at milepost 919.35 on <strong>the</strong> Waco Subdivision. This8 - 23
<strong>San</strong> <strong>An<strong>to</strong>nio</strong> <strong>Region</strong> <strong>Freight</strong> <strong>Study</strong>Identified Improvementsinstallation would allow for through moves in ei<strong>the</strong>r direction. There are existing #14turn-outs connecting <strong>the</strong> Waco and Austin ML-1 Subdivisions.There is limited room available for a South-East wye connection track. A very tightcurve, approximately 7 degrees, would be required and would limit operating speed<strong>to</strong> 35 mph. There is an existing spur track <strong>to</strong> an agribusiness which would also beimpacted. Construction of a broader connection (for increased speed) would impactresidences, churches, businesses, a city park and an electrical substation.The installation of new turn-outs (switches), in an area where track speeds arecurrently 40 mph, would be difficult at best and leave any increase in freightmovement still within a confined area. If a higher speed connection between <strong>the</strong>setwo subdivisions is requested, <strong>the</strong>n a bypass route around Taylor should beconsidered.8 - 24
<strong>San</strong> <strong>An<strong>to</strong>nio</strong> <strong>Region</strong> <strong>Freight</strong> <strong>Study</strong>Identified ImprovementsAustin Subdivision ML 2The tracks of <strong>the</strong> Austin Subdivision ML 2 were originally constructed by <strong>the</strong>Missouri, Kansas & <strong>Texas</strong> Railway Company of <strong>Texas</strong> in 1900. The Subdivisionoriginates in <strong>San</strong> Marcos, <strong>Texas</strong> at <strong>the</strong> end of <strong>the</strong> Lockhart Subdivision andgenerally parallels <strong>the</strong> Austin Subdivision ML 1 and IH-35 before it ends indown<strong>to</strong>wn <strong>San</strong> <strong>An<strong>to</strong>nio</strong> with <strong>the</strong> tracks continuing southward as <strong>the</strong> Del RioSubdivision. The Subdivision is over 50 miles in <strong>to</strong>tal length, approximately 44 ofwhich are in <strong>the</strong> <strong>San</strong> <strong>An<strong>to</strong>nio</strong> <strong>Region</strong> study area in Comal and Bexar Counties.The Austin Subdivision ML 2 is a single track mainline with limited sidings utilized ina bidirectional manner, with trains dispatched <strong>to</strong> operate in both directions,averaging 10 trains daily.Potential improvements along <strong>the</strong> Austin Subdivision ML 2 include gradeseparations, crossing closures, and rail capacity enhancements, as listed in Table 8-3 with <strong>the</strong>ir associated costs.A breakdown of <strong>the</strong> order of magnitude cost estimates and <strong>the</strong> estimated associatedpublic benefits of <strong>the</strong> identified grade separations are included in Appendix C andAppendix G, respectively.8 - 25
<strong>San</strong> <strong>An<strong>to</strong>nio</strong> <strong>Region</strong> <strong>Freight</strong> <strong>Study</strong>Identified ImprovementsAustin Subdivision Mainline 2Grade SeparationsImprovementClassificationLevelEstimated CostEstimatedPublic Benefit(20-year)Ratio:Benefit/Cost(20-year)Binz Engleman Rd 3 $ 8,600,000 $ 2,790,000 0.32Eisenhauer 3 $ 30,300,000 $ 8,650,000 0.29FM 306 3 $ 7,300,000 $ 13,970,000 1.91Hous<strong>to</strong>n St 3 $ 10,200,000 $ 3,850,000 0.38I-35 Frontage Road 3 $ 27,800,000 $ 19,320,000 0.69Leonhardt Rd 3 $ 8,100,000 $ 2,130,000 0.26Rittiman 3 $ 34,300,000 $ 9,260,000 0.27S. Presa St 3 $ 8,000,000 $ 3,170,000 0.40Toepperwein Rd 3 $ 11,600,000 $ 2,280,000 0.20Walzem Rd 3 $ 31,600,000 $ 9,490,000 0.30Crossing ClosuresImprovementClassificationLevelEstimated CostEstimatedPublic Benefit(20-year)*Ratio:Benefit/Cost(20-year)Fairdale 3 $ 50,000 $ 1,120,000 22.40Fratt Rd 3 $ 50,000 $ 3,260,000 65.20Hoefgen Ave 3 $ 50,000 $ 500,000 10.00Lanark 3 $ 50,000 $ 670,000 13.40Rail ImprovementsImprovementClassificationLevelEstimated CostEstimatedPublic Benefit(20-year)**Ratio:Benefit/Cost(20-year)#10 - Extend and connect Fratt andRemount Au<strong>to</strong> Facility sidings <strong>to</strong> joinAustin ML-2 4 $ 6,190,000 NA NA*Public benefit could only be estimated for crossing closures which would be rerouted <strong>to</strong> a grade separated crossing.However, all crossing closures produce a public benefit of improved safety.**No public benefits of individual rail improvements were identified.Class 3 Improvements (Separations/Closures) $ 178,000,000 $ 80,460,000 0.45Class 4 Improvements (Long-term Improvements) $ 6,190,000 NA NATotal Identified Improvements $ 184,190,000 $ 80,460,000 0.44Grade SeparationsTable 8-3: Austin Subdivision ML 2 ImprovementsGrade Separation of Binz Engleman Rd on <strong>the</strong> Austin Subdivision ML 2Binz Engleman Road is currently a two-lane roadway west of <strong>the</strong> railroad and a fourlaneroadway east of <strong>the</strong> railroad that crosses <strong>the</strong> UP Austin Subdivision ML 2 inBexar County nor<strong>the</strong>ast of down<strong>to</strong>wn <strong>San</strong> <strong>An<strong>to</strong>nio</strong>. This roadway, withapproximately 9,300 daily vehicles crossing <strong>the</strong> railroad tracks, has been identified8 - 26
<strong>San</strong> <strong>An<strong>to</strong>nio</strong> <strong>Region</strong> <strong>Freight</strong> <strong>Study</strong>Identified Improvementsas a potential candidate for grade separation. The potential four-lane roadwayoverpass would separate vehicular traffic from <strong>the</strong> Austin Subdivision ML 2.A preliminary layout of <strong>the</strong> overpass is included in Appendix E, while <strong>the</strong>environmental constraints and adjacent property land uses are identified in <strong>the</strong>Austin Subdivision ML 2 Constraints Map on sheet 7 of 39 located in Appendix F.Access <strong>to</strong> adjacent properties could be maintained via access roads alongside <strong>the</strong>identified Binz Engleman Road overpass with connections <strong>to</strong> <strong>the</strong> existing at-gradetraffic lanes beyond <strong>the</strong> identified location of <strong>the</strong> potential overpass.The grade separation of Binz Engleman Road is estimated <strong>to</strong> cost $8.6 million withan estimated public benefit of $2.8 million, which is 32 percent of <strong>the</strong> estimated cos<strong>to</strong>f <strong>the</strong> grade separation.Grade Separation of Eisenhauer Rd on <strong>the</strong> Austin Subdivision ML 2Eisenhauer Road is currently a two-lane roadway west of <strong>the</strong> railroad and a fourlaneroadway east of <strong>the</strong> railroad that crosses <strong>the</strong> UP Austin Subdivision ML 2 inBexar County in <strong>San</strong> <strong>An<strong>to</strong>nio</strong> inside <strong>the</strong> nor<strong>the</strong>ast corner of Loop 410. Thisroadway, with approximately 21,200 daily vehicles crossing <strong>the</strong> railroad tracks, hasbeen identified as a potential candidate for grade separation. The potential four-laneroadway underpass would separate vehicular traffic from <strong>the</strong> Austin Subdivision ML2.A preliminary layout of <strong>the</strong> underpass is included in Appendix E, while <strong>the</strong>environmental constraints and adjacent property land uses are identified in <strong>the</strong>Austin Subdivision ML 2 Constraints Map on sheet 10 of 39 located in Appendix F.Constraints in <strong>the</strong> vicinity of <strong>the</strong> Eisenhauer Road crossing consist primarily ofadjacent residential property and a school west of <strong>the</strong> railroad and commercial andindustrial property east of <strong>the</strong> railroad.In order <strong>to</strong> maintain connectivity between Eisenhauer Road and Loop 410, <strong>the</strong>frontage road lanes of Loop 410 would need <strong>to</strong> be depressed <strong>to</strong> meet <strong>the</strong>Eisenhauer Road underpass. Access <strong>to</strong> adjacent properties east of <strong>the</strong> railroadcould be maintained via access roads alongside <strong>the</strong> identified Eisenhauer Roadunderpass with an at-grade u-turn located above <strong>the</strong> underpass east of <strong>the</strong> railroad.Access <strong>to</strong> adjacent properties west of <strong>the</strong> railroad would be eliminated due <strong>to</strong> <strong>the</strong>potential underpass structure and <strong>the</strong> lack of available right-of-way for access roads.The grade separation of Eisenhauer Road is estimated <strong>to</strong> cost $30.3 million with anestimated public benefit of $8.7 million, which is 29 percent of <strong>the</strong> estimated cost of<strong>the</strong> grade separation.Grade Separation of FM 306 on <strong>the</strong> Austin Subdivision ML 2FM 306 is currently a two-lane roadway that crosses <strong>the</strong> UP Austin Subdivision ML 2in Comal County in <strong>the</strong> city of New Braunfels. This roadway, with approximately11,400 daily vehicles crossing <strong>the</strong> railroad tracks, has been identified as a potential8 - 27
<strong>San</strong> <strong>An<strong>to</strong>nio</strong> <strong>Region</strong> <strong>Freight</strong> <strong>Study</strong>Identified Improvementscandidate for grade separation. The potential two-lane roadway overpass wouldseparate vehicular traffic from <strong>the</strong> Austin Subdivision ML 2.A preliminary layout of <strong>the</strong> overpass is included in Appendix E, while <strong>the</strong>environmental constraints and adjacent property land uses are identified in <strong>the</strong>Austin Subdivision ML 2 Constraints Map on sheet 33 of 39 located in Appendix F.Access <strong>to</strong> adjacent properties and connecting roadways could be maintained viaaccess roads alongside <strong>the</strong> identified FM 306 overpass with at-grade u-turns locatedbeneath <strong>the</strong> overpass bridge on each side of <strong>the</strong> railroad.The grade separation of FM 306 is estimated <strong>to</strong> cost $7.3 million with an estimatedpublic benefit of $14 million, which is nearly two times <strong>the</strong> estimated cost of <strong>the</strong>grade separation.Grade Separation of Hous<strong>to</strong>n St on <strong>the</strong> Austin Subdivision ML 2Hous<strong>to</strong>n Street is currently a four-lane roadway west that crosses <strong>the</strong> UP AustinSubdivision ML 2 in Bexar County in down<strong>to</strong>wn <strong>San</strong> <strong>An<strong>to</strong>nio</strong> just south of <strong>the</strong> AT&TCenter. This roadway, with approximately 14,500 daily vehicles crossing <strong>the</strong> railroadtracks, has been identified as a potential candidate for grade separation. Thepotential four-lane roadway underpass would separate vehicular traffic from <strong>the</strong>Austin Subdivision ML 2.A preliminary layout of <strong>the</strong> underpass is included in Appendix E, while <strong>the</strong>environmental constraints and adjacent property land uses are identified in <strong>the</strong>Austin Subdivision ML 2 Constraints Map on sheet 4 of 39 located in Appendix F.Constraints in <strong>the</strong> vicinity of <strong>the</strong> Hous<strong>to</strong>n Street crossing consist primarily of adjacentresidential property and a school west of <strong>the</strong> railroad and commercial and property,including <strong>the</strong> AT&T Center and <strong>the</strong> Freeman Coliseum east of <strong>the</strong> railroad.Access <strong>to</strong> adjacent properties and connecting roadways would be eliminated due <strong>to</strong><strong>the</strong> potential underpass structure and <strong>the</strong> lack of available right-of-way for frontageroads along <strong>the</strong> underpass. Rosary Street, which runs parallel <strong>to</strong> <strong>the</strong> railroad, couldbridge over <strong>the</strong> potential underpass in order <strong>to</strong> maintain through traffic along <strong>the</strong>roadway, although connectivity with Hous<strong>to</strong>n Street would be eliminated.The grade separation of Hous<strong>to</strong>n Street is estimated <strong>to</strong> cost $10.2 million with anestimated public benefit of $3.9 million, which is 38 percent of <strong>the</strong> estimated cost of<strong>the</strong> grade separation.Grade Separation of IH-35 Frontage Roads on <strong>the</strong> Austin Subdivision ML 2The IH-35 frontage roads are currently three-lane roadways in each direction thatcross <strong>the</strong> UP Austin Subdivision ML 2 in Bexar County nor<strong>the</strong>ast of down<strong>to</strong>wn <strong>San</strong><strong>An<strong>to</strong>nio</strong>. These frontage roads, with a combined 44,200 daily vehicles crossing <strong>the</strong>railroad tracks, have been identified as potential candidates for grade separation.The potential three-lane roadway underpass on each side of I-35 would separatevehicular traffic from <strong>the</strong> Austin Subdivision ML 2.8 - 28
<strong>San</strong> <strong>An<strong>to</strong>nio</strong> <strong>Region</strong> <strong>Freight</strong> <strong>Study</strong>Identified ImprovementsA preliminary layout of <strong>the</strong> underpass is included in Appendix E, while <strong>the</strong>environmental constraints and adjacent property land uses are identified in <strong>the</strong>Austin Subdivision ML 2 Constraints Map on sheet 5 of 39 located in Appendix F.Constraints in <strong>the</strong> vicinity of <strong>the</strong> IH-35 frontage roads crossings consist of adjacentcommercial and industrial property, an oil/gas pipeline, and Fort Sam Hous<strong>to</strong>n wes<strong>to</strong>f <strong>the</strong> railroad. Access <strong>to</strong> adjacent properties and connecting roadways would beeliminated due <strong>to</strong> <strong>the</strong> potential underpass structure. Additional access roads mayneed <strong>to</strong> be provided for properties that would lose access <strong>to</strong> <strong>the</strong> IH-35 frontageroads.The grade separation of <strong>the</strong> IH-35 frontage roads is estimated <strong>to</strong> cost $27.8 millionwith an estimated public benefit of $19.3 million, which is 69 percent of <strong>the</strong> estimatedcost of <strong>the</strong> grade separation.Grade Separation of Leonhardt Road on <strong>the</strong> Austin Subdivision ML 2Leonhardt Road is currently a two-lane roadway that crosses <strong>the</strong> UP AustinSubdivision ML 2 in Bexar County in north <strong>San</strong> <strong>An<strong>to</strong>nio</strong>. This roadway, withapproximately 5,900 daily vehicles crossing <strong>the</strong> railroad tracks, has been identifiedas a potential candidate for grade separation. According <strong>to</strong> FRA data, one acciden<strong>to</strong>ccurred at <strong>the</strong> Leonhardt Road crossing from 2002 through 2006. The potentialtwo-lane roadway overpass would separate vehicular traffic from <strong>the</strong> AustinSubdivision ML 2.A preliminary layout of <strong>the</strong> overpass is included in Appendix E, while <strong>the</strong>environmental constraints and adjacent property land uses are identified in <strong>the</strong>Austin Subdivision ML 2 Constraints Map on sheet 13 of 39 located in Appendix F.Constraints in <strong>the</strong> vicinity of <strong>the</strong> Leonhardt Road crossing with <strong>the</strong> railroad consistprimarily of adjacent residential property as well as <strong>the</strong> 100-year floodplain.In order <strong>to</strong> maintain connectivity between Leonhardt Road and Weidner Road, <strong>the</strong>lanes of Weidner Road would need <strong>to</strong> be elevated <strong>to</strong> meet <strong>the</strong> Leonhardt Roadoverpass. Access <strong>to</strong> adjacent properties and connecting roadways could bemaintained via access roads alongside <strong>the</strong> identified Leonhardt Road overpass withan at-grade u-turn located beneath <strong>the</strong> overpass bridge east of <strong>the</strong> railroad.The grade separation of Leonhardt Road is estimated <strong>to</strong> cost $8.1 million with anestimated public benefit of $2.1 million, which is approximately 26 percent of <strong>the</strong>estimated cost of <strong>the</strong> grade separation.Grade Separation of Rittiman Road on <strong>the</strong> Austin Subdivision ML 2Rittiman Road is currently a four-lane roadway that crosses <strong>the</strong> UP AustinSubdivision ML 2 in Bexar County in north <strong>San</strong> <strong>An<strong>to</strong>nio</strong>. This roadway, withapproximately 27,400 daily vehicles crossing <strong>the</strong> railroad tracks, has been identifiedas a potential candidate for grade separation. According <strong>to</strong> FRA data, one acciden<strong>to</strong>ccurred at <strong>the</strong> Rittiman Road crossing from 2002 through 2006. The potential two-8 - 29
<strong>San</strong> <strong>An<strong>to</strong>nio</strong> <strong>Region</strong> <strong>Freight</strong> <strong>Study</strong>Identified Improvementslane roadway underpass would separate vehicular traffic from <strong>the</strong> Austin SubdivisionML 2.A preliminary layout of <strong>the</strong> underpass is included in Appendix E, while <strong>the</strong>environmental constraints and adjacent property land uses are identified in <strong>the</strong>Austin Subdivision ML 2 Constraints Map on sheet 9 of 39 located in Appendix F.Constraints in <strong>the</strong> vicinity of <strong>the</strong> Rittiman Road crossing with <strong>the</strong> railroad consistprimarily of adjacent commercial property as well as an oil/gas pipeline.In order <strong>to</strong> maintain connectivity between Rittiman Road and Loop 410, <strong>the</strong> lanes ofLoop 410 would need <strong>to</strong> be depressed <strong>to</strong> meet <strong>the</strong> Rittiman Road underpass.Access <strong>to</strong> adjacent properties and connecting roadways could be maintained viaaccess roads alongside <strong>the</strong> identified Rittiman Road underpass with at-grade u-turnslocated beneath <strong>the</strong> overpass bridge each side of <strong>the</strong> railroad.The grade separation of Rittiman Road is estimated <strong>to</strong> cost $34.3 million with anestimated public benefit of $9.3 million, which is approximately 27 percent of <strong>the</strong>estimated cost of <strong>the</strong> grade separation.Grade Separation of Presa Street on <strong>the</strong> Austin Subdivision ML 2Presa Street is currently a two-lane roadway that crosses <strong>the</strong> UP Austin SubdivisionML 2 in Bexar County in north <strong>San</strong> <strong>An<strong>to</strong>nio</strong>. This roadway, with approximately10,600 daily vehicles crossing <strong>the</strong> railroad tracks, has been identified as a potentialcandidate for grade separation. The potential two-lane roadway underpass wouldseparate vehicular traffic from <strong>the</strong> Austin Subdivision ML 2.A preliminary layout of <strong>the</strong> overpass is included in Appendix E, while <strong>the</strong>environmental constraints and adjacent property land uses are identified in <strong>the</strong>Austin Subdivision ML 2 Constraints Map on sheet 1 of 39 located in Appendix F.Constraints in <strong>the</strong> vicinity of <strong>the</strong> Presa Street crossing with <strong>the</strong> railroad consist ofadjacent residential and commercial property as well as schools and an oil/gaspipeline.Access <strong>to</strong> adjacent properties and connecting roadways would be eliminated along<strong>the</strong> identified Presa Street underpass due <strong>to</strong> <strong>the</strong> lack of available right-of-way foraccess roads alongside <strong>the</strong> structure. The identified underpass would require <strong>the</strong>closure of Vitra Street, Panama Avenue, Conrad Street, Boyer Avenue, LowellStreet, and Drexel Avenue at <strong>the</strong>ir intersections with Presa Street.The grade separation of Presa Street is estimated <strong>to</strong> cost $8.0 million with anestimated public benefit of $3.2 million, which is approximately 40 percent of <strong>the</strong>estimated cost of <strong>the</strong> grade separation.Grade Separation of Toepperwein Road on <strong>the</strong> Austin Subdivision ML 2Toepperwein Road is currently a two-lane roadway that crosses <strong>the</strong> UP AustinSubdivision ML 2 in Bexar County in <strong>the</strong> city of <strong>San</strong> <strong>An<strong>to</strong>nio</strong>. This roadway, with8 - 30
<strong>San</strong> <strong>An<strong>to</strong>nio</strong> <strong>Region</strong> <strong>Freight</strong> <strong>Study</strong>Identified Improvementsapproximately 6,900 daily vehicles crossing <strong>the</strong> railroad tracks, has been identifiedas a potential candidate for grade separation. The potential two-lane roadwayoverpass would separate vehicular traffic from <strong>the</strong> Austin Subdivision ML 2.A preliminary layout of <strong>the</strong> overpass is included in Appendix E, while <strong>the</strong>environmental constraints and adjacent property land uses are identified in <strong>the</strong>Austin Subdivision ML 2 Constraints Map on sheet 15 of 39 located in Appendix F.The primary constraints in <strong>the</strong> vicinity of <strong>the</strong> potential grade separation forToepperwein Road consist of adjacent residential and commercial property. Access<strong>to</strong> adjacent properties and connecting roadways could be maintained via accessroads alongside <strong>the</strong> identified overpass with at-grade u-turns located beneath <strong>the</strong>overpass bridge on each side of <strong>the</strong> railroad.The grade separation of Toepperwein Road is estimated <strong>to</strong> cost $11.6 million withan estimated public benefit of $2.3 million, which is 20 percent of <strong>the</strong> estimated cos<strong>to</strong>f <strong>the</strong> grade separation.Grade Separation of Walzem Road on <strong>the</strong> Austin Subdivision ML 2Walzem Road is currently a four-lane roadway that crosses <strong>the</strong> UP AustinSubdivision ML 2 in Bexar County in north <strong>San</strong> <strong>An<strong>to</strong>nio</strong>. This roadway, withapproximately 29,400 daily vehicles crossing <strong>the</strong> railroad tracks, has been identifiedas a potential candidate for grade separation. The potential two-lane roadwayunderpass would separate vehicular traffic from <strong>the</strong> Austin Subdivision ML 2.A preliminary layout of <strong>the</strong> overpass is included in Appendix E, while <strong>the</strong>environmental constraints and adjacent property land uses are identified in <strong>the</strong>Austin Subdivision ML 2 Constraints Map on sheet 11 of 39 located in Appendix F.Constraints in <strong>the</strong> vicinity of <strong>the</strong> Walzem Road crossing with <strong>the</strong> railroad consist ofadjacent commercial property, leaking petroleum s<strong>to</strong>rage tanks, a school, ashopping center, and an oil/gas pipeline.In order <strong>to</strong> maintain connectivity between Walzem Road and Loop 410, <strong>the</strong> lanes ofLoop 410 would need <strong>to</strong> be depressed <strong>to</strong> meet <strong>the</strong> Walzem Road underpass.Access <strong>to</strong> adjacent properties and connecting roadways could be maintained viaaccess roads alongside <strong>the</strong> identified Walzem Road underpass with at-grade u-turnslocated beneath <strong>the</strong> overpass bridge each side of <strong>the</strong> railroad.The grade separation of Walzem Road is estimated <strong>to</strong> cost $31.6 million with anestimated public benefit of $9.5 million, which is approximately 30 percent of <strong>the</strong>estimated cost of <strong>the</strong> grade separation.8 - 31
<strong>San</strong> <strong>An<strong>to</strong>nio</strong> <strong>Region</strong> <strong>Freight</strong> <strong>Study</strong>Identified ImprovementsCrossing ClosuresCrossing Closure of Fairdale Road on <strong>the</strong> Austin Subdivision ML 2Fairdale Road is currently a two-lane roadway that crosses <strong>the</strong> railroad at-grade inBexar County in <strong>San</strong> <strong>An<strong>to</strong>nio</strong>. Approximately 4,100 vehicles cross <strong>the</strong> UP at thislocation daily. Fairdale Road should be considered for closure at <strong>the</strong> intersectionwith <strong>the</strong> UP Austin Subdivision ML 2 in order <strong>to</strong> reduce public safety hazardscurrently associated with <strong>the</strong> existing at-grade crossing.The location of <strong>the</strong> potential crossing closure as well as <strong>the</strong> alternative route andassociated distance are identified in Appendix E, while <strong>the</strong> environmental constraintsand adjacent property uses are identified in <strong>the</strong> Austin Subdivision ML 2 ConstraintsMap on sheet 9 of 39 located in Appendix F. Constraints located in <strong>the</strong> vicinity ofthis street consist of residential and commercial properties as well as a school.Access <strong>to</strong> adjacent properties could be maintained via <strong>the</strong> existing roadway network.Traffic could be rerouted from <strong>the</strong> potential crossing closure <strong>to</strong> Rittiman Road or <strong>to</strong>Eisenhauer Road, which are included as potential grade separations in this study, <strong>to</strong>cross <strong>the</strong> railroad. Right-of-way acquisition of <strong>the</strong> adjacent properties should not berequired since no new construction is required.The potential crossing closure at Fairdale Road is estimated <strong>to</strong> cost $50,000 with anestimated public benefit for closing <strong>the</strong> crossing of approximately $1.1 million.Crossing Closure of Fratt Road on <strong>the</strong> Austin Subdivision ML 2Fratt Road is currently a two-lane roadway that crosses <strong>the</strong> railroad at-grade inBexar County in <strong>San</strong> <strong>An<strong>to</strong>nio</strong>. Approximately 10,800 vehicles cross <strong>the</strong> UP at thislocation daily. Fratt Road should be considered for closure at <strong>the</strong> intersection with<strong>the</strong> UP Austin Subdivision ML 2 in order <strong>to</strong> reduce public safety hazards currentlyassociated with <strong>the</strong> existing at-grade crossing.The location of <strong>the</strong> potential crossing closure as well as <strong>the</strong> alternative route andassociated distance are identified in Appendix E, while <strong>the</strong> environmental constraintsand adjacent property uses are identified in <strong>the</strong> Austin Subdivision ML 2 ConstraintsMap on sheet 11 of 39 located in Appendix F. Constraints located in <strong>the</strong> vicinity ofthis street consist primarily of commercial properties.Access <strong>to</strong> adjacent properties could be maintained via <strong>the</strong> existing roadway network.Traffic could be rerouted from <strong>the</strong> potential crossing closure <strong>to</strong> Walzem Road, whichis included as a potential grade separation in this study, <strong>to</strong> cross <strong>the</strong> railroad. Righ<strong>to</strong>f-wayacquisition of <strong>the</strong> adjacent properties should not be required since no newconstruction is required.The potential crossing closure at Fratt Road is estimated <strong>to</strong> cost $50,000 with anestimated public benefit for closing <strong>the</strong> crossing of approximately $3.3 million.8 - 32
<strong>San</strong> <strong>An<strong>to</strong>nio</strong> <strong>Region</strong> <strong>Freight</strong> <strong>Study</strong>Identified ImprovementsCrossing Closure of Hoefgen Avenue on <strong>the</strong> Austin Subdivision ML 2Hoefgen Avenue is currently a two-lane roadway that crosses <strong>the</strong> railroad at-gradein Bexar County in down<strong>to</strong>wn <strong>San</strong> <strong>An<strong>to</strong>nio</strong>. Approximately 2,000 vehicles cross <strong>the</strong>UP at this location daily. Hoefgen Avenue should be considered for closure at <strong>the</strong>intersection with <strong>the</strong> UP Austin Subdivision ML 2 in order <strong>to</strong> reduce public safetyhazards currently associated with <strong>the</strong> existing at-grade crossing.The location of <strong>the</strong> potential crossing closure as well as <strong>the</strong> alternative route andassociated distance are identified in Appendix E, while <strong>the</strong> environmental constraintsand adjacent property uses are identified in <strong>the</strong> Austin Subdivision ML 2 ConstraintsMap on sheet 1 of 39 located in Appendix F. Constraints located in <strong>the</strong> vicinity ofthis street consist primarily of residential and commercial properties. Access <strong>to</strong>adjacent properties could be maintained via <strong>the</strong> existing roadway network. Trafficcould be rerouted from <strong>the</strong> potential crossing closure <strong>to</strong> Hackberry Street, whichunderpasses <strong>the</strong> railroad. Right-of-way acquisition of <strong>the</strong> adjacent properties shouldnot be required since no new construction is required.The potential crossing closure at Hoefgen Avenue is estimated <strong>to</strong> cost $50,000 withan estimated public benefit for closing <strong>the</strong> crossing of approximately $500 thousand.Crossing Closure of Lanark Dr on <strong>the</strong> Austin Subdivision ML 2Lanark Drive is currently a two-lane roadway that crosses <strong>the</strong> railroad at-grade inBexar County in <strong>San</strong> <strong>An<strong>to</strong>nio</strong>. Approximately 2,500 vehicles cross <strong>the</strong> UP at thislocation daily. Lanark Drive should be considered for closure at <strong>the</strong> intersection with<strong>the</strong> UP Austin Subdivision ML 2 in order <strong>to</strong> reduce public safety hazards currentlyassociated with <strong>the</strong> existing at-grade crossing.The location of <strong>the</strong> potential crossing closure as well as <strong>the</strong> alternative route andassociated distance are identified in Appendix E, while <strong>the</strong> environmental constraintsand adjacent property uses are identified in <strong>the</strong> Austin Subdivision ML 2 ConstraintsMap on sheet 10 of 39 located in Appendix F. Constraints located in <strong>the</strong> vicinity ofthis street consist primarily of residential and industrial properties. Access <strong>to</strong>adjacent properties could be maintained via <strong>the</strong> existing roadway network. Trafficcould be rerouted from <strong>the</strong> potential crossing closure <strong>to</strong> Eisenhauer Road, which isincluded as a potential grade separation in this study, <strong>to</strong> cross <strong>the</strong> railroad. Right-ofwayacquisition of <strong>the</strong> adjacent properties should not be required since no newconstruction is required.The potential crossing closure at Lanark Drive is estimated <strong>to</strong> cost $50,000 with anestimated public benefit for closing <strong>the</strong> crossing of approximately $670 thousand.Railroad ImprovementsNone of <strong>the</strong> following improvements have been constructed nor are underconstruction.8 - 33
<strong>San</strong> <strong>An<strong>to</strong>nio</strong> <strong>Region</strong> <strong>Freight</strong> <strong>Study</strong>Identified ImprovementsImprovement 10 – Extend and connect Fratt and Remount Au<strong>to</strong> Facility sidings <strong>to</strong>join Austin Subdivision ML 2The Fratt and Remount sidings are located on <strong>the</strong> west side of Austin SubdivisionML 2 and extend from milepost 248.23 <strong>to</strong> milepost 248.89 and milepost 251.20 <strong>to</strong>milepost 251.82, respectively, along <strong>the</strong> Austin Subdivision ML 2. Both sidings arelimited in length <strong>to</strong> meet current freight operations. It is proposed <strong>to</strong> extend andconnect both sidings for a distance of approximately 2.3 miles resulting in a newpassing siding. The new siding will connect at <strong>the</strong> north and south limits <strong>to</strong> <strong>the</strong> AustinSubdivision ML 2. They are located northwest of <strong>San</strong> <strong>An<strong>to</strong>nio</strong> and east of Fort SamHous<strong>to</strong>n.Corpus Christi SubdivisionThe tracks of <strong>the</strong> Corpus Christi Subdivision were originally constructed by <strong>the</strong> <strong>San</strong><strong>An<strong>to</strong>nio</strong>, Uvalde & Gulf Railroad in 1914. The Subdivision originates in <strong>San</strong> <strong>An<strong>to</strong>nio</strong>,<strong>Texas</strong> at <strong>the</strong> South <strong>San</strong> <strong>An<strong>to</strong>nio</strong> (So<strong>San</strong>) rail yard and terminates in Corpus Christi,<strong>Texas</strong>. The Subdivision is approximately 146 miles in <strong>to</strong>tal length, approximately 59of which are in <strong>the</strong> <strong>San</strong> <strong>An<strong>to</strong>nio</strong> <strong>Region</strong> study area in Atascosa and Bexar Counties.The Corpus Christi Subdivision is a single track mainline with limited sidings utilizedin a bidirectional manner, with trains dispatched <strong>to</strong> operate in both directions,averaging between five and 15 trains daily, depending upon location.Potential improvements along <strong>the</strong> Corpus Christi Subdivision include gradeseparations, crossing closures, and rail capacity enhancements, as listed in Table 8-4 with <strong>the</strong>ir associated costs.8 - 34
<strong>San</strong> <strong>An<strong>to</strong>nio</strong> <strong>Region</strong> <strong>Freight</strong> <strong>Study</strong>Identified ImprovementsA breakdown of <strong>the</strong> order of magnitude cost estimates and <strong>the</strong> estimated associatedpublic benefits of <strong>the</strong> identified grade separations are included in Appendix C andAppendix G, respectively.Corpus Christi SubdivisionGrade SeparationsImprovementClassificationLevelEstimated CostEstimatedPublic Benefit(20-year)Ratio:Benefit/Cost(20-year)2nd Street 3 $ 8,300,000 $ 5,540,000 0.67Bensdale Dr 3 $ 5,000,000 $ 2,890,000 0.58Gillette 3 $ 7,100,000 $ 1,710,000 0.24W Malone 3 $ 12,000,000 $ 9,640,000 0.80Nogali<strong>to</strong>s 3 $ 10,100,000 $ 2,900,000 0.29S. Tx 1604 Loop 3 $ 5,000,000 $ 1,950,000 0.39Somerset/Southcross 3 $ 20,700,000 $ 5,840,000 0.28SW Military 3 $ 9,100,000 $ 7,600,000 0.84Villaret 3 $ 6,900,000 $ 1,910,000 0.28Crossing ClosuresImprovementClassificationLevelEstimated CostEstimatedPublic Benefit(20-year)*Ratio:Benefit/Cost(20-year)Hutchins 3 $ 50,000 NA NAMayfield Ave 3 $ 50,000 NA NAPetaluma 3 $ 50,000 $ 1,000,000 20.00Rail ImprovementsImprovementClassificationLevelEstimated CostEstimatedPublic Benefit(20-year)**Ratio:Benefit/Cost(20-year)#3 - Construct a 9000’ siding track andswitches adjacent <strong>to</strong> <strong>the</strong> Corpus ChristiSubdivision near <strong>the</strong> lead track <strong>to</strong> <strong>the</strong>Toyota Facility 4 $ 4,990,000 NA NA#7 - Extend <strong>the</strong> new Mauermann Sidingnorth and south as a second mainline <strong>to</strong>So<strong>San</strong> Yard 4 $ 25,190,000 NA NA*Public benefit could only be estimated for crossing closures which would be rerouted <strong>to</strong> a grade separated crossing.However, all crossing closures produce a public benefit of improved safety.**No public benefits of individual rail improvements were identified.Class 3 Improvements (Separations/Closures) $ 84,350,000 $ 44,366,000 0.53Class 4 Improvements (Long-term Improvements) $ 30,180,000 NA NATotal Identified Improvements $ 114,530,000 $ 44,366,000 0.39Table 8-4: Corpus Christi Subdivision Improvements8 - 35
<strong>San</strong> <strong>An<strong>to</strong>nio</strong> <strong>Region</strong> <strong>Freight</strong> <strong>Study</strong>Identified ImprovementsGrade SeparationsGrade Separation of Second Street on <strong>the</strong> Corpus Christi SubdivisionSecond Street is currently a four-lane roadway that crosses <strong>the</strong> UP Corpus ChristiSubdivision in Atascosa County in <strong>the</strong> city of Pleasan<strong>to</strong>n. This roadway, withapproximately 19,000 daily vehicles crossing <strong>the</strong> railroad tracks, has been identifiedas a potential candidate for grade separation. The potential four-lane roadwayoverpass would separate vehicular traffic from <strong>the</strong> Corpus Christi Subdivision.A preliminary layout of <strong>the</strong> overpass is included in Appendix E. The primaryconstraints in <strong>the</strong> vicinity of <strong>the</strong> potential grade separation consist of adjacentcommercial and residential property. Access <strong>to</strong> adjacent properties and connectingroadways could be maintained via access roads alongside <strong>the</strong> identified overpasswith at-grade u-turns located beneath <strong>the</strong> overpass bridge on <strong>the</strong> north side of <strong>the</strong>railroad and at-grade connections <strong>to</strong> E Adams Street south of <strong>the</strong> railroad.The grade separation of Second Street is estimated <strong>to</strong> cost $8.3 million with anestimated public benefit of $5.5 million, which is 67 percent of <strong>the</strong> estimated cost of<strong>the</strong> grade separation.Grade Separation of Bensdale Drive on <strong>the</strong> Corpus Christi SubdivisionBensdale Drive is currently a four-lane roadway that crosses <strong>the</strong> UP Corpus ChristiSubdivision in Atascosa County in <strong>the</strong> city of Pleasan<strong>to</strong>n. This roadway, withapproximately 8,500 daily vehicles crossing <strong>the</strong> railroad tracks, has been identifiedas a potential candidate for grade separation. The potential four-lane roadwayoverpass would separate vehicular traffic from <strong>the</strong> Corpus Christi Subdivision.A preliminary layout of <strong>the</strong> overpass is included in Appendix E. The primaryconstraints in <strong>the</strong> vicinity of <strong>the</strong> potential grade separation consist of adjacentcommercial property on <strong>the</strong> east side of <strong>the</strong> railroad. Access <strong>to</strong> First Street could bemaintained via <strong>San</strong> <strong>An<strong>to</strong>nio</strong> and Market Streets connecting <strong>to</strong> <strong>the</strong> grade separation.The grade separation of Bensdale Drive is estimated <strong>to</strong> cost $5.0 million with anestimated public benefit of $2.9 million, which is 58 percent of <strong>the</strong> estimated cost of<strong>the</strong> grade separation.Grade Separation of Gillette Avenue on <strong>the</strong> Corpus Christi SubdivisionGillette Avenue is currently a two-lane roadway that crosses <strong>the</strong> UP Corpus ChristiSubdivision in Bexar County in <strong>the</strong> city of <strong>San</strong> <strong>An<strong>to</strong>nio</strong>. This roadway, withapproximately 6,100 daily vehicles crossing <strong>the</strong> railroad tracks, has been identifiedas a potential candidate for grade separation. The potential two-lane roadwayoverpass would separate vehicular traffic from <strong>the</strong> Corpus Christi Subdivision.A preliminary layout of <strong>the</strong> overpass is included in Appendix E, while <strong>the</strong>environmental constraints and adjacent property land uses are identified in <strong>the</strong>Corpus Christi Subdivision Constraints Map on sheet 5 of 17 located in Appendix F.8 - 36
<strong>San</strong> <strong>An<strong>to</strong>nio</strong> <strong>Region</strong> <strong>Freight</strong> <strong>Study</strong>Identified ImprovementsThe primary constraints in <strong>the</strong> vicinity of <strong>the</strong> potential grade separation consist ofadjacent residential and commercial property as well as a nearby school. Access <strong>to</strong>adjacent properties and connecting roadways could be maintained via access roadsalongside <strong>the</strong> identified overpass with at-grade u-turns located beneath <strong>the</strong> overpassbridge on each side of <strong>the</strong> railroad.The grade separation of Gillette Avenue is estimated <strong>to</strong> cost $7.1 million with anestimated public benefit of $1.7 million, which is 24 percent of <strong>the</strong> estimated cost of<strong>the</strong> grade separation.Grade Separation of W Malone Avenue on <strong>the</strong> Corpus Christi SubdivisionW Malone Avenue is currently a four-lane roadway that crosses <strong>the</strong> UP CorpusChristi Subdivision and <strong>the</strong> UP Laredo Subdivision tracks and intersects Frio CityRoad in Bexar County in <strong>the</strong> city of <strong>San</strong> <strong>An<strong>to</strong>nio</strong>. This roadway, with approximately5,900 daily vehicles crossing <strong>the</strong> railroad tracks, has been identified as a potentialcandidate for grade separation. The potential four-lane roadway overpass wouldseparate vehicular traffic from <strong>the</strong> Corpus Christi Subdivision.A preliminary layout of <strong>the</strong> overpass is included in Appendix E, while <strong>the</strong>environmental constraints and adjacent property land uses are identified in <strong>the</strong>Corpus Christi Subdivision Constraints Map on sheet 1 of 17 located in Appendix F.The primary constraints in <strong>the</strong> vicinity of <strong>the</strong> potential grade separation consist ofadjacent commercial property.The proposed grade separation includes elevating <strong>the</strong> mainlanes of Malone Avenue<strong>to</strong> bridge over <strong>the</strong> railroad and meet with elevated lanes of Fri City Road. Access <strong>to</strong>adjacent properties and connecting roadways along Malone Avenue could bemaintained via access roads alongside <strong>the</strong> identified overpass with an at-grade u-turn located beneath <strong>the</strong> overpass bridge east of <strong>the</strong> railroad. Access <strong>to</strong> adjacentproperties along Frio City Road would be eliminated due <strong>to</strong> <strong>the</strong> identified overpassstructure.The grade separation of W Malone Avenue is estimated <strong>to</strong> cost $12.0 million with anestimated public benefit of $9.6 million, which is 80 percent of <strong>the</strong> estimated cost of<strong>the</strong> grade separation.Grade Separation of Nogali<strong>to</strong>s Street on <strong>the</strong> Corpus Christi SubdivisionNogali<strong>to</strong>s Street is currently a four-lane roadway that crosses <strong>the</strong> UP Corpus ChristiSubdivision in Bexar County in <strong>the</strong> city of <strong>San</strong> <strong>An<strong>to</strong>nio</strong>. This roadway, withapproximately 9,900 daily vehicles crossing <strong>the</strong> railroad tracks, has been identifiedas a potential candidate for grade separation. The potential four-lane roadwayoverpass would separate vehicular traffic from <strong>the</strong> Corpus Christi Subdivision.A preliminary layout of <strong>the</strong> overpass is included in Appendix E, while <strong>the</strong>environmental constraints and adjacent property land uses are identified in <strong>the</strong>Corpus Christi Subdivision Constraints Map on sheet 2 of 17 located in Appendix F.8 - 37
<strong>San</strong> <strong>An<strong>to</strong>nio</strong> <strong>Region</strong> <strong>Freight</strong> <strong>Study</strong>Identified ImprovementsThe primary constraints in <strong>the</strong> vicinity of <strong>the</strong> potential grade separation consist ofadjacent industrial and commercial property as well as a nearby school. Access <strong>to</strong>adjacent properties and connecting roadways could be maintained via access roadsalongside <strong>the</strong> identified overpass with at-grade u-turns located beneath <strong>the</strong> overpassbridge on each side of <strong>the</strong> railroad.The grade separation of Nogali<strong>to</strong>s Street is estimated <strong>to</strong> cost $10.1 million with anestimated public benefit of $2.9 million, which is approximately 29 percent of <strong>the</strong>estimated cost of <strong>the</strong> grade separation.Grade Separation of South <strong>Texas</strong> Loop 1604 on <strong>the</strong> Corpus Christi SubdivisionSouth <strong>Texas</strong> Loop 1604 is currently a two-lane roadway that crosses <strong>the</strong> UP CorpusChristi Subdivision in Bexar County in <strong>the</strong> city of Leming. This roadway, withapproximately 5,900 daily vehicles crossing <strong>the</strong> railroad tracks, has been identifiedas a potential candidate for grade separation. The potential two-lane roadwayoverpass would separate vehicular traffic from <strong>the</strong> Corpus Christi Subdivision.A preliminary layout of <strong>the</strong> overpass is included in Appendix E, while <strong>the</strong>environmental constraints and adjacent property land uses are identified in <strong>the</strong>Corpus Christi Subdivision Constraints Map on sheet 12 of 17 located in Appendix F.The primary constraints in <strong>the</strong> vicinity of <strong>the</strong> potential grade separation consist ofadjacent residential property as well as a nearby school. Access <strong>to</strong> adjacentproperties and connecting roadways could be maintained via access roadsalongside <strong>the</strong> identified overpass with at-grade u-turns located beneath <strong>the</strong> overpassbridge on each side of <strong>the</strong> railroad.The grade separation of South <strong>Texas</strong> Loop 1604 is estimated <strong>to</strong> cost $5 million withan estimated public benefit of nearly $2, which is approximately 39 percent of <strong>the</strong>estimated cost of <strong>the</strong> grade separation.Grade Separation of Somerset Road and Southcross Blvd on <strong>the</strong> Corpus ChristiSubdivisionSomerset Road and Southcross Boulevard are currently two-lane and four-laneroadways, respectively, that cross <strong>the</strong> UP Corpus Christi Subdivision in BexarCounty in <strong>the</strong> city of <strong>San</strong> <strong>An<strong>to</strong>nio</strong>. These roadways, with approximately 11,000 dailyvehicles crossing <strong>the</strong> railroad tracks at Somerset Road and 9,700 daily vehiclescrossing <strong>the</strong> railroad tracks at Southcross Boulevard, have been identified aspotential candidates for grade separation. The potential roadway overpasses wouldseparate vehicular traffic from <strong>the</strong> Austin Subdivision ML 1.A preliminary layout of <strong>the</strong> overpass structures is included in Appendix E, while <strong>the</strong>environmental constraints and adjacent property land uses are identified in <strong>the</strong>Corpus Christi Subdivision Constraints Map on sheet 2 of 17 located in Appendix F.The primary constraints in <strong>the</strong> vicinity of <strong>the</strong> potential grade separation consist ofadjacent industrial and commercial property as well as a nearby school.8 - 38
<strong>San</strong> <strong>An<strong>to</strong>nio</strong> <strong>Region</strong> <strong>Freight</strong> <strong>Study</strong>Identified ImprovementsThe grade separation proposed includes elevated lanes of Southcross Boulevardand Somerset Road that bridge over <strong>the</strong> railroad. Because <strong>the</strong> two roadwaysintersect near <strong>the</strong> railroad crossings, an intersection of <strong>the</strong> two roadways would belocated on a bridge above <strong>the</strong> ground. Access <strong>to</strong> adjacent properties along <strong>the</strong>grade separated roadways could be maintained via access roads alongside <strong>the</strong>identified overpass structures for Somerset Road and Southcross Boulevard with atgradeu-turns located beneath <strong>the</strong> overpass bridges on each side of <strong>the</strong> railroad.The grade separation of Somerset Road and Southcross Boulevard is estimated <strong>to</strong>cost $20.7 million with an estimated public benefit of $5.8 million, which is 28percent of <strong>the</strong> estimated cost of <strong>the</strong> grade separation.Grade Separation of SW Military Drive on <strong>the</strong> Corpus Christi SubdivisionSW Military Drive is currently a six-lane roadway that crosses <strong>the</strong> UP Corpus ChristiSubdivision in Bexar County in <strong>the</strong> city of <strong>San</strong> <strong>An<strong>to</strong>nio</strong>. This roadway, withapproximately 23,200 daily vehicles crossing <strong>the</strong> railroad tracks, has been identifiedas a potential candidate for grade separation. The potential four-lane roadwayoverpass would separate vehicular traffic from <strong>the</strong> Corpus Christi Subdivision.A preliminary layout of <strong>the</strong> overpass is included in Appendix E, while <strong>the</strong>environmental constraints and adjacent property land uses are identified in <strong>the</strong>Corpus Christi Subdivision Constraints Map on sheet 3 of 17 located in Appendix F.The primary constraints in <strong>the</strong> vicinity of <strong>the</strong> potential grade separation consist ofadjacent commercial properties. Access <strong>to</strong> adjacent properties and connectingroadways could be maintained via access roads along <strong>the</strong> west side of <strong>the</strong> identifiedoverpass with <strong>the</strong> use of commercial drives east of <strong>the</strong> railroad.The grade separation of SW Military Drive is estimated <strong>to</strong> cost $9.1 million with anestimated public benefit of $7.6 million, which is 84 percent of <strong>the</strong> estimated cost of<strong>the</strong> grade separation.Grade Separation of Villaret Boulevard on <strong>the</strong> Corpus Christi SubdivisionVillaret Boulevard is currently a two-lane roadway that crosses <strong>the</strong> UP CorpusChristi Subdivision in Bexar County in <strong>the</strong> city of <strong>San</strong> <strong>An<strong>to</strong>nio</strong>. This roadway, withapproximately 6,800 daily vehicles crossing <strong>the</strong> railroad tracks, has been identifiedas a potential candidate for grade separation. The potential two-lane roadwayoverpass would separate vehicular traffic from <strong>the</strong> Corpus Christi Subdivision.A preliminary layout of <strong>the</strong> overpass is included in Appendix E, while <strong>the</strong>environmental constraints and adjacent property land uses are identified in <strong>the</strong>Corpus Christi Subdivision Constraints Map on sheet 5 of 17 located in Appendix F.The primary constraints in <strong>the</strong> vicinity of <strong>the</strong> potential grade separation consist ofadjacent residential property. Access <strong>to</strong> adjacent properties could be maintained viaaccess roads alongside Villaret Boulevard with at-grade u-turns located beneath <strong>the</strong>overpass on each side of <strong>the</strong> railroad.8 - 39
<strong>San</strong> <strong>An<strong>to</strong>nio</strong> <strong>Region</strong> <strong>Freight</strong> <strong>Study</strong>Identified ImprovementsThe grade separation of Villaret Boulevard is estimated <strong>to</strong> cost $6.9 million with anestimated public benefit of $1.9 million, which is approximately 28 percent of <strong>the</strong>estimated cost of <strong>the</strong> grade separation.Crossing ClosuresCrossing Closure of Hutchins Place on <strong>the</strong> Corpus Christi SubdivisionHutchins Place is currently a two-lane roadway that crosses <strong>the</strong> railroad at-grade inBexar County in south <strong>San</strong> <strong>An<strong>to</strong>nio</strong>. Approximately 600 vehicles cross <strong>the</strong> UP at thislocation daily. The crossing should be considered for closure at <strong>the</strong> intersection with<strong>the</strong> UP Corpus Christi Subdivision in order <strong>to</strong> reduce public safety hazards currentlyassociated with <strong>the</strong> existing at-grade crossing.The location of <strong>the</strong> potential crossing closure as well as <strong>the</strong> alternative route andassociated distance are identified in Appendix E, while <strong>the</strong> environmental constraintsand adjacent property uses are identified in <strong>the</strong> Corpus Christi SubdivisionConstraints Map on sheet 4 of 17 located in Appendix F.Access <strong>to</strong> adjacent properties could be maintained via <strong>the</strong> existing roadway network.Traffic could be rerouted from <strong>the</strong> closed crossing west of <strong>the</strong> railroad <strong>to</strong> travel northon Zarzamora Street, <strong>the</strong>n east on <strong>the</strong> IH-35 frontage road <strong>to</strong> cross <strong>the</strong> railroad, <strong>the</strong>nsouth on Logwood Avenue <strong>to</strong> reach Hutchins Place on <strong>the</strong> east side of <strong>the</strong> railroad.Right-of-way acquisition of <strong>the</strong> adjacent properties should not be required since nonew construction is required.The crossing closure is estimated <strong>to</strong> cost $50,000. The estimated public benefitcould not be calculated for <strong>the</strong> closure of Hutchins Place since traffic may beredirected <strong>to</strong> ano<strong>the</strong>r at-grade crossing.Crossing Closure of Mayfield Avenue on <strong>the</strong> Corpus Christi SubdivisionMayfield Avenue is currently a two-lane roadway that crosses <strong>the</strong> railroad at-grade inBexar County in south <strong>San</strong> <strong>An<strong>to</strong>nio</strong>. Approximately 3000 vehicles cross <strong>the</strong> UP atthis location daily. The crossing should be considered for closure at <strong>the</strong> intersectionwith <strong>the</strong> UP Corpus Christi Subdivision in order <strong>to</strong> reduce public safety hazardscurrently associated with <strong>the</strong> existing at-grade crossing.The location of <strong>the</strong> potential crossing closure as well as <strong>the</strong> alternative route andassociated distance are identified in Appendix E, while <strong>the</strong> environmental constraintsand adjacent property uses are identified in <strong>the</strong> Corpus Christi SubdivisionConstraints Map on sheet 2 of 17 located in Appendix F. Located near <strong>the</strong> crossingis a school as well as hospitals. Access <strong>to</strong> such facilities and o<strong>the</strong>r nearbyproperties could be maintained via <strong>the</strong> existing roadway network. Traffic may bererouted from <strong>the</strong> closed crossing <strong>to</strong> <strong>the</strong> north on Pyron Avenue or <strong>to</strong> <strong>the</strong> south onSW Military Drive, which is included as a potential grade separation in this study.8 - 40
<strong>San</strong> <strong>An<strong>to</strong>nio</strong> <strong>Region</strong> <strong>Freight</strong> <strong>Study</strong>Identified ImprovementsRight-of-way acquisition of <strong>the</strong> adjacent properties should not be required since nonew construction is identified.The crossing closure is estimated <strong>to</strong> cost $50,000. The estimated public benefitcould not be calculated for <strong>the</strong> closure of Mayfield Avenue since traffic may beredirected <strong>to</strong> ano<strong>the</strong>r at-grade crossing.Crossing Closure of Petaluma Boulevard on <strong>the</strong> Corpus Christi SubdivisionPetaluma Boulevard is currently a two-lane roadway that crosses <strong>the</strong> railroad atgradein Bexar County in south <strong>San</strong> <strong>An<strong>to</strong>nio</strong>. Approximately 2,200 vehicles cross <strong>the</strong>UP at this location daily. The crossing should be considered for closure at <strong>the</strong>intersection with <strong>the</strong> UP Corpus Christi Subdivision in order <strong>to</strong> reduce public safetyhazards currently associated with <strong>the</strong> existing at-grade crossing.The location of <strong>the</strong> potential crossing closure as well as <strong>the</strong> alternative route andassociated distance are identified in Appendix E, while <strong>the</strong> environmental constraintsand adjacent property uses are identified in <strong>the</strong> Corpus Christi SubdivisionConstraints Map on sheet 4 of 17 located in Appendix F. Access <strong>to</strong> adjacentproperties could be maintained via <strong>the</strong> existing roadway network. Traffic could bererouted <strong>to</strong> <strong>the</strong> adjacent roadway <strong>to</strong> <strong>the</strong> south on Gillette Boulevard, which isincluded as a potential grade separation in this study. Right-of-way acquisition of <strong>the</strong>adjacent properties should not be required since no new construction is identified.The crossing closure of Petaluma Boulevard is estimated <strong>to</strong> cost $50,000 with anestimated public benefit of $1 million.Railroad ImprovementsNone of <strong>the</strong> following improvements have been constructed nor are underconstruction.Improvement 3 – Construct a new 9000’ siding track and switches adjacent <strong>to</strong> <strong>the</strong>Corpus Christi Subdivision near <strong>the</strong> lead track <strong>to</strong> <strong>the</strong> Toyota Facility (planned UPimprovement)Commonly referred <strong>to</strong> as <strong>the</strong> Mauermann Siding, this proposed 9000’ siding will belocated just north of <strong>the</strong> switch lead <strong>to</strong> <strong>the</strong> newly opened Toyota Facility and on <strong>the</strong>west side of <strong>the</strong> Corpus Christi Subdivision. The Toyota Facility is locatedapproximately 13 miles south of central <strong>San</strong> <strong>An<strong>to</strong>nio</strong>. North and South connectiontracks from <strong>the</strong> Toyota lead <strong>to</strong> <strong>the</strong> new siding and <strong>the</strong> Corpus Christi mainline will beconstructed.Improvement 7 – Extend <strong>the</strong> new Mauermann Siding north and south as a secondmainline <strong>to</strong> So<strong>San</strong> YardThe new 9000’ long Mauermann Sidng on <strong>the</strong> Corpus Christi subdivision would beextended north approximately eight (8) miles and connect <strong>to</strong> <strong>the</strong> new switching lead<strong>to</strong> <strong>the</strong> north end of So<strong>San</strong> Yard as described in Improvement 2. It would also beextended approximately two miles (2) south from <strong>the</strong> Toyota switch <strong>to</strong> a location for8 - 41
<strong>San</strong> <strong>An<strong>to</strong>nio</strong> <strong>Region</strong> <strong>Freight</strong> <strong>Study</strong>Identified Improvementsa future track connection. This would now provide a second Corpus Christi mainlinefrom <strong>the</strong> Toyota Facility <strong>to</strong> So<strong>San</strong> Yard.Del Rio SubdivisionThe tracks of <strong>the</strong> Del Rio Subdivision were originally constructed by <strong>the</strong> Galves<strong>to</strong>n,Harrisburg & <strong>San</strong> <strong>An<strong>to</strong>nio</strong> Railway in 1881. The Subdivision originates at <strong>the</strong> eastend of Kirby Yard in nor<strong>the</strong>ast <strong>San</strong> <strong>An<strong>to</strong>nio</strong>, which also corresponds <strong>to</strong> <strong>the</strong> terminusof <strong>the</strong> Glidden Subdivision, and ends in Del Rio, <strong>Texas</strong> with <strong>the</strong> tracks continuing as<strong>the</strong> <strong>San</strong>derson Subdivision. The Subdivision is approximately 178 miles in <strong>to</strong>tallength, approximately 120 of which are in <strong>the</strong> <strong>San</strong> <strong>An<strong>to</strong>nio</strong> <strong>Region</strong> study area inBexar, Medina, and Uvalde Counties.The Del Rio Subdivision is a predominately single track mainline with limitedlocations of double mainline track and numerous sidings utilized in a bidirectionalmanner, with trains dispatched <strong>to</strong> operate in both directions, averaging between 20and 30 trains daily, depending upon location.Potential improvements along <strong>the</strong> Del Rio Subdivision include grade separations,crossing closures, and rail capacity enhancements, as listed in Table 8-5 with <strong>the</strong>irassociated costs.8 - 42
<strong>San</strong> <strong>An<strong>to</strong>nio</strong> <strong>Region</strong> <strong>Freight</strong> <strong>Study</strong>Identified ImprovementsA breakdown of <strong>the</strong> order of magnitude cost estimates and <strong>the</strong> estimated associatedpublic benefits of <strong>the</strong> identified grade separations are included in Appendix C andAppendix G, respectively.Del Rio SubdivisionGrade SeparationsImprovementClassificationLevelEstimated CostEstimatedPublic Benefit(20-year)Ratio:Benefit/Cost(20-year)Avenue M 3 $ 7,600,000 $ 4,290,000 0.56Avenue U 3 $ 7,500,000 $ 2,610,000 0.35Ceralvo/Zarzamora 3 $ 24,900,000 $ 9,570,000 0.38E. Commerce St 3 $ 16,700,000 $ 60,470,000 3.62Flores St 3 $ 8,800,000 $ 30,420,000 3.46Florida St 3 $ 14,600,000 $ 6,210,000 0.43FM 1343 3 $ 5,000,000 $ 2,460,000 0.49FM 536/Probandt 3 $ 11,200,000 $ 22,860,000 2.04E. Hous<strong>to</strong>n St 3 $ 14,300,000 $ 39,300,000 2.75N. Pine St 3 $ 5,000,000 $ 7,260,000 1.45S Presa St 3 $ 10,700,000 $ 33,350,000 3.12Crossing ClosuresImprovementClassificationLevelEstimated CostEstimatedPublic Benefit(20-year)*Ratio:Benefit/Cost(20-year)Avenue I 3 $ 50,000 NA NAAvenue K 3 $ 50,000 $ 420,000 8.40Avenue P 3 $ 50,000 $ 620,000 12.40Avenue Y 3 $ 50,000 NA NABrady Blvd 3 $ 50,000 $ 2,330,000 46.60Burleson St 3 $ 50,000 NA NABurnet St 3 $ 50,000 $ 2,700,000 54.00Carolina St 3 $ 50,000 $ 10,870,000 217.40Center St 3 $ 50,000 $ 1,160,000 23.20Crockett St 3 $ 50,000 $ 1,500,000 30.00Dawson St 3 $ 50,000 $ 1,300,000 26.00Delaware St 3 $ 50,000 $ 1,090,000 21.80Ellis Bean St 3 $ 50,000 $ 760,000 15.20Hackberry St 3 $ 50,000 $ 2,590,000 51.80Hoefgen Ave 3 $ 50,000 $ 2,590,000 51.80Indiana St 3 $ 50,000 $ 1,120,000 22.40Iowa St 3 $ 50,000 $ 1,110,000 22.20Merida St 3 $ 50,000 $ 610,000 12.20Roosevelt Ave 3 $ 50,000 $ 22,100,000 442.00Sherman St 3 $ 50,000 NA NAVirginia Blvd 3 $ 50,000 $ 1,110,000 22.20Table 8-5: Del Rio Subdivision Improvements8 - 43
<strong>San</strong> <strong>An<strong>to</strong>nio</strong> <strong>Region</strong> <strong>Freight</strong> <strong>Study</strong>Identified ImprovementsRail ImprovementsImprovementClassificationLevelEstimated CostEstimatedPublic Benefit(20-year)**Ratio:Benefit/Cost(20-year)#1 - Construct second mainline Alamo Jct.<strong>to</strong> Wi<strong>the</strong>rs Jct. 4 $ 6,520,000 NA NA#2 - Construct a second mainline andswitches on <strong>the</strong> Del Rio Subdivisionbetween East Yard and Kirby Yard milepost203.5 <strong>to</strong> 201.4 4 $ 6,460,000 NA NA#5 - Extend <strong>the</strong> new second mainline of <strong>the</strong>Del Rio Subdivision at milepost 201.40approximately 1.0 miles north <strong>to</strong> “SevenStates Corporate Park” 1 $ 3,370,000 NA NA#6 - Construct new switches on <strong>the</strong> Del RioSubdivision in <strong>the</strong> vicinity of Quintana Roadfor a proposed connection in<strong>to</strong> <strong>the</strong> nor<strong>the</strong>nd of So<strong>San</strong> Yard 1 $ 1,310,000 NA NA#19 - Construct an additional Del Rio Subdivisionmain track west and adjacent <strong>to</strong> <strong>the</strong>Del Rio Subdivision <strong>to</strong> Macdona 4 $ 6,040,000 NA NA*Public benefit could only be estimated for crossing closures which would be rerouted <strong>to</strong> a grade separated crossing.However, all crossing closures produce a public benefit of improved safety.**No public benefits of individual rail improvements were identified.Class 1 Improvements (Near-term Improvements) $ 4,680,000 NA NAClass 3 Improvements (Separations/Closures) $ 127,350,000 $ 272,780,000 2.14Class 4 Improvements (Long-term Improvements) $ 19,020,000 NA NATotal Identified Improvements $ 151,050,000 $ 272,780,000 1.81Grade SeparationsTable 8-5 (continued): Del Rio Subdivision ImprovementsGrade Separation of Avenue M on <strong>the</strong> Del Rio SubdivisionAvenue M is currently a two-lane roadway that crosses <strong>the</strong> UP Del Rio Subdivisionin Medina County in <strong>the</strong> city of Hondo. This roadway, with approximately 10,100daily vehicles crossing <strong>the</strong> railroad tracks, has been identified as a potentialcandidate for grade separation. According <strong>to</strong> FRA data, one accident occurred at<strong>the</strong> Avenue M crossing from 2002 through 2006. The potential two-lane roadwayunderpass would separate vehicular traffic from <strong>the</strong> Del Rio Subdivision.A preliminary layout of <strong>the</strong> potential underpass and adjacent property land uses areincluded in Appendix E. Additional environmental constraints mapping may berequired for fur<strong>the</strong>r analysis.Access <strong>to</strong> Avenue M would be eliminated for properties adjacent <strong>to</strong> <strong>the</strong> identifiedunderpass structure. Roadways connecting <strong>to</strong> Avenue M along <strong>the</strong> identifiedunderpass, such as 17 th Street, 18 th Street, 20 th Street, and 21 st Street, would need8 - 44
<strong>San</strong> <strong>An<strong>to</strong>nio</strong> <strong>Region</strong> <strong>Freight</strong> <strong>Study</strong>Identified Improvements<strong>to</strong> be closed at <strong>the</strong>ir intersection with Avenue M. Traffic could be rerouted <strong>to</strong>connect <strong>to</strong> Avenue M along <strong>the</strong> adjacent roadways on Avenue K or Avenue N. US90 could maintain through traffic by bridging over <strong>the</strong> potential underpass, althoughthis would remove connectivity between Avenue M and US 90. Traffic from AvenueM that currently turns on<strong>to</strong> US 90 could be rerouted on Avenue P or Avenue K <strong>to</strong>reach US 90.The grade separation of Avenue M is estimated <strong>to</strong> have a cost of $7.6 million with anestimated public benefit of $4.3 million, which is 56 percent of <strong>the</strong> estimated cost of<strong>the</strong> grade separation.Grade Separation of Avenue U on <strong>the</strong> Del Rio SubdivisionAvenue U is currently a two-lane roadway that crosses <strong>the</strong> UP Del Rio Subdivision inMedina County in <strong>the</strong> city of Hondo. This roadway, with approximately 5,700 dailyvehicles crossing <strong>the</strong> railroad tracks, has been identified as a potential candidate forgrade separation. The potential two-lane roadway underpass would separatevehicular traffic from <strong>the</strong> Del Rio Subdivision.A preliminary layout of <strong>the</strong> potential underpass and adjacent property land uses areincluded in Appendix E. Additional environmental constraints mapping may berequired for fur<strong>the</strong>r analysis.Access <strong>to</strong> Avenue U would be eliminated for properties adjacent <strong>to</strong> <strong>the</strong> identifiedunderpass structure. Roadways connecting <strong>to</strong> Avenue U along <strong>the</strong> identifiedunderpass, such as 17 th Street, 18 th Street, 20 th Street, and 21 st Street, would need<strong>to</strong> be closed at <strong>the</strong>ir intersection with Avenue U. Traffic could be rerouted <strong>to</strong> connect<strong>to</strong> Avenue U along <strong>the</strong> adjacent roadways on Avenue T or Avenue V. US 90 couldmaintain through traffic by bridging over <strong>the</strong> potential underpass, although this wouldremove connectivity between Avenue U and US 90. Traffic from Avenue U thatcurrently turns on<strong>to</strong> US 90 could be rerouted on Avenue P or Avenue Y <strong>to</strong> reach US90.The grade separation of Avenue U is estimated <strong>to</strong> have a cost of $7.5 million with anestimated public benefit of $2.6 million, which is 35 percent of <strong>the</strong> estimated cost of<strong>the</strong> grade separation.Grade Separation of Zarzamora Street and Ceralvo Street on <strong>the</strong> Del RioSubdivisionZarzamora Street and Ceralvo Street are currently four-lane and two-lane roadways,respectively, that cross <strong>the</strong> UP Del Rio Subdivision in Bexar County in <strong>the</strong> city of<strong>San</strong> <strong>An<strong>to</strong>nio</strong>. Approximately 22,000 and 5,400 daily vehicles cross <strong>the</strong> railroad atZarzamora Street and Ceralvo Street, respectively. These roadways have beenidentified as potential candidates for grade separations in order <strong>to</strong> minimize <strong>the</strong>public safety risk associated with <strong>the</strong> at-grade crossings. According <strong>to</strong> FRA data,two accidents occurred at <strong>the</strong> Ceralvo/Zarzamora crossing from 2002 through 2006.8 - 45
<strong>San</strong> <strong>An<strong>to</strong>nio</strong> <strong>Region</strong> <strong>Freight</strong> <strong>Study</strong>Identified ImprovementsA preliminary layout of <strong>the</strong> overpass is included in Appendix E, while <strong>the</strong>environmental constraints and adjacent property land uses are identified in <strong>the</strong> DelRio Subdivision Constraints Map on sheet 19 of 31 located in Appendix F. Theprimary constraints in <strong>the</strong> vicinity of <strong>the</strong> potential grade separation consist ofadjacent commercial and residential property. Access <strong>to</strong> adjacent properties couldbe maintained via access roads alongside Zarzamora Street and Ceralvo Street withat-grade u-turns located beneath <strong>the</strong> overpass on each side of <strong>the</strong> railroad.The grade separations of Zarzamora Street and Ceralvo Street is estimated <strong>to</strong> havea combined cost of $24.9 million with an estimated public benefit of $9.6 million,which is 38 percent of <strong>the</strong> estimated cost of <strong>the</strong> grade separation.Grade Separation of Commerce Street on <strong>the</strong> Del Rio SubdivisionCommerce Street is currently a four-lane roadway that crosses <strong>the</strong> UP Del RioSubdivision in Bexar County in <strong>the</strong> city of <strong>San</strong> <strong>An<strong>to</strong>nio</strong>. This roadway, withapproximately 20,500 daily vehicles crossing <strong>the</strong> railroad tracks, has been identifiedas a potential candidate for grade separation. The potential four-lane roadwayunderpass would separate vehicular traffic from <strong>the</strong> Del Rio Subdivision.A preliminary layout of <strong>the</strong> underpass is included in Appendix E, while <strong>the</strong>environmental constraints and adjacent property land uses are identified in <strong>the</strong> DelRio Subdivision Constraints Map on sheet 23 of 31 located in Appendix F. Theprimary constraints in <strong>the</strong> vicinity of <strong>the</strong> potential grade separation consist ofadjacent commercial properties and a his<strong>to</strong>ric district.Access <strong>to</strong> Commerce Street would be eliminated for properties adjacent <strong>to</strong> <strong>the</strong>identified underpass structure. Roadways connecting <strong>to</strong> Commerce Street along <strong>the</strong>identified underpass would need <strong>to</strong> be closed at <strong>the</strong>ir intersection with CommerceStreet, except for Cherry Street, which would bridge over <strong>the</strong> potential underpass.Traffic east of <strong>the</strong> railroad could be rerouted on Hackberry Street <strong>to</strong> connect withCommerce Street, while traffic west of <strong>the</strong> railroad could be rerouted on <strong>the</strong> US 281frontage road <strong>to</strong> connect with Commerce Street.The grade separation of Commerce Street is estimated <strong>to</strong> have a cost of $16.7million with an estimated public benefit of $60.5 million, which is approximately 3.6times <strong>the</strong> estimated cost of <strong>the</strong> grade separation.Grade Separation of Flores Street on <strong>the</strong> Del Rio SubdivisionFlores Street is currently a two-lane roadway that crosses <strong>the</strong> UP Del RioSubdivision in Bexar County in down<strong>to</strong>wn <strong>San</strong> <strong>An<strong>to</strong>nio</strong>. This roadway, withapproximately 12,300 daily vehicles crossing <strong>the</strong> railroad tracks, has been identifiedas a potential candidate for grade separation. According <strong>to</strong> FRA data, one acciden<strong>to</strong>ccurred at <strong>the</strong> Flores Street crossing with <strong>the</strong> Del Rio Subdivision from 2002through 2006. The potential two-lane roadway underpass would separate vehiculartraffic from <strong>the</strong> Del Rio Subdivision.8 - 46
<strong>San</strong> <strong>An<strong>to</strong>nio</strong> <strong>Region</strong> <strong>Freight</strong> <strong>Study</strong>Identified ImprovementsA preliminary layout of <strong>the</strong> underpass is included in Appendix E, while <strong>the</strong>environmental constraints and adjacent property land uses are identified in <strong>the</strong> DelRio Subdivision Constraints Map on sheet 21 of 31 located in Appendix F.Constraints in <strong>the</strong> vicinity of <strong>the</strong> potential grade separation include adjacentcommercial property, an oil/gas pipeline, and a school.Access <strong>to</strong> Flores Street would be eliminated for properties adjacent <strong>to</strong> <strong>the</strong> identifiedunderpass structure. Roadways connecting <strong>to</strong> Flores Street along <strong>the</strong> identifiedunderpass, such as Fest Street, LaChapelle Street, Cassiano Street, Lone StarBoulevard, Stribling Street, and St. Francis Avenue, would need <strong>to</strong> be closed at <strong>the</strong>irintersection with Flores Street.The grade separation of Flores Street is estimated <strong>to</strong> have a cost of $8.8 million withan estimated public benefit of $30.4 million, which is nearly 3.5 times <strong>the</strong> estimatedcost of <strong>the</strong> grade separation.Grade Separation of Florida Street on <strong>the</strong> Del Rio SubdivisionFlorida Street is currently a two-lane roadway that crosses <strong>the</strong> UP Del RioSubdivision in Bexar County in down<strong>to</strong>wn <strong>San</strong> <strong>An<strong>to</strong>nio</strong>. This roadway, withapproximately 2,500 daily vehicles crossing <strong>the</strong> railroad tracks, has been identifiedas a potential candidate for grade separation. According <strong>to</strong> FRA data, one acciden<strong>to</strong>ccurred at <strong>the</strong> Florida Street crossing with <strong>the</strong> Del Rio Subdivision from 2002through 2006. The potential two-lane roadway underpass would separate vehiculartraffic from <strong>the</strong> Del Rio Subdivision.A preliminary layout of <strong>the</strong> underpass is included in Appendix E, while <strong>the</strong>environmental constraints and adjacent property land uses are identified in <strong>the</strong> DelRio Subdivision Constraints Map on sheet 22 of 31 located in Appendix F.Constraints in <strong>the</strong> vicinity of <strong>the</strong> potential grade separation include adjacentcommercial and residential property and leaking petroleum s<strong>to</strong>rage tanks.Access <strong>to</strong> Florida Street would be eliminated for properties adjacent <strong>to</strong> <strong>the</strong> identifiedunderpass structure. Mesquite Street, which connects <strong>to</strong> Florida Street, would need<strong>to</strong> be closed at <strong>the</strong> intersection with Florida Street. Traffic could be rerouted <strong>to</strong> <strong>the</strong>east on Hackberry Street <strong>to</strong> access Florida Street. Cherry Street could maintainthrough traffic by bridging over <strong>the</strong> potential Florida Street underpass.The grade separation of Florida Street is estimated <strong>to</strong> have a cost of $14.6 millionwith an estimated public benefit of $6.2 million, which is 43 percent of <strong>the</strong> estimatedcost of <strong>the</strong> grade separation.Grade Separation of FM 1343 on <strong>the</strong> Del Rio SubdivisionFM 1343 is currently a two-lane roadway that crosses <strong>the</strong> UP Del Rio Subdivision inMedina County in Castroville. This roadway, with approximately 3,500 daily vehiclescrossing <strong>the</strong> railroad tracks, has been identified as a potential candidate for gradeseparation. According <strong>to</strong> FRA data, one accident occurred at <strong>the</strong> FM 1343 crossing8 - 47
<strong>San</strong> <strong>An<strong>to</strong>nio</strong> <strong>Region</strong> <strong>Freight</strong> <strong>Study</strong>Identified Improvementswith <strong>the</strong> Del Rio Subdivision from 2002 through 2006. The potential two-laneroadway overpass would separate vehicular traffic from <strong>the</strong> Del Rio Subdivision.Connectivity between FM 1343 and Francisco Road would be eliminated due <strong>to</strong> <strong>the</strong>identified overpass structure and may require <strong>the</strong> construction of an additionalaccess road between <strong>the</strong> two roadways. A preliminary layout of <strong>the</strong> overpass isincluded in Appendix E, although additional constraints mapping may be required.The grade separation of FM 1343 is estimated <strong>to</strong> have a cost of $5 million with anestimated public benefit of $2.5 million, which is 49 percent of <strong>the</strong> estimated cost of<strong>the</strong> grade separation.Grade Separation of Probandt/FM 536 on <strong>the</strong> Del Rio SubdivisionProbandt Street (also called FM 536) is currently a four-lane roadway that crosses<strong>the</strong> UP Del Rio Subdivision in Bexar County in down<strong>to</strong>wn <strong>San</strong> <strong>An<strong>to</strong>nio</strong>. Thisroadway, with approximately 12,200 daily vehicles crossing <strong>the</strong> railroad tracks, hasbeen identified as a potential candidate for grade separation. The potential four-laneroadway underpass would separate vehicular traffic from <strong>the</strong> Del Rio Subdivision.A preliminary layout of <strong>the</strong> underpass is included in Appendix E, while <strong>the</strong>environmental constraints and adjacent property land uses are identified in <strong>the</strong> DelRio Subdivision Constraints Map on sheet 21 of 31 located in Appendix F.Constraints in <strong>the</strong> vicinity of <strong>the</strong> potential grade separation consist of adjacentresidential, commercial, and industrial properties, a his<strong>to</strong>ric district, and an oil/gaspipeline.Access <strong>to</strong> Probandt Street would be eliminated for properties adjacent <strong>to</strong> <strong>the</strong>identified underpass structure. St. Francis Avenue, Lone Star Boulevard, and SimonStreet, which connect <strong>to</strong> Probandt Street, would need <strong>to</strong> be closed at <strong>the</strong> intersectionwith Probandt Street. South of <strong>the</strong> railroad, traffic could be rerouted on HelenaStreet <strong>to</strong> access Probandt Street. North of <strong>the</strong> railroad, traffic could be rerouted onClay Street <strong>to</strong> access Probandt Street.The grade separation of Probandt Street is estimated <strong>to</strong> have a cost of $11.2 millionwith an estimated public benefit of $22.9 million, which is more than two times <strong>the</strong>estimated cost of <strong>the</strong> grade separation.Grade Separation of Hous<strong>to</strong>n Street on <strong>the</strong> Del Rio SubdivisionHous<strong>to</strong>n Street is currently a two-lane roadway that crosses <strong>the</strong> UP Del RioSubdivision in Bexar County in <strong>the</strong> city of <strong>San</strong> <strong>An<strong>to</strong>nio</strong>. This roadway, withapproximately 14,500 daily vehicles crossing <strong>the</strong> railroad tracks, has been identifiedas a potential candidate for grade separation. The potential two-lane roadwayunderpass would separate vehicular traffic from <strong>the</strong> Del Rio Subdivision.A preliminary layout of <strong>the</strong> underpass is included in Appendix E, while <strong>the</strong>environmental constraints and adjacent property land uses are identified in <strong>the</strong> Del8 - 48
<strong>San</strong> <strong>An<strong>to</strong>nio</strong> <strong>Region</strong> <strong>Freight</strong> <strong>Study</strong>Identified ImprovementsRio Subdivision Constraints Map on sheet 23 of 31 located in Appendix F. Theprimary constraints in <strong>the</strong> vicinity of <strong>the</strong> potential grade separation consist ofadjacent commercial properties and his<strong>to</strong>ric sites.Access <strong>to</strong> Hous<strong>to</strong>n Street would be eliminated for properties adjacent <strong>to</strong> <strong>the</strong>identified underpass structure, although access <strong>to</strong> connecting roadways would bemaintained. Roadways connecting <strong>to</strong> Hous<strong>to</strong>n Street along <strong>the</strong> identified underpasswould require reconstruction in order <strong>to</strong> connect <strong>to</strong> <strong>the</strong> depressed lanes of <strong>the</strong>underpass.The grade separation of Hous<strong>to</strong>n Street is estimated <strong>to</strong> have a cost of $14.3 millionwith an estimated public benefit of $39.3 million, which is 2.75 times <strong>the</strong> estimatedcost of <strong>the</strong> grade separation.Grade Separation of N. Pine Street on <strong>the</strong> Del Rio SubdivisionN. Pine Street is currently a two-lane roadway that crosses <strong>the</strong> UP Del RioSubdivision and transitions <strong>to</strong> a four-lane roadway as it bridges over IH-35 in BexarCounty in down<strong>to</strong>wn <strong>San</strong> <strong>An<strong>to</strong>nio</strong>. This roadway, with approximately 3,000 dailyvehicles crossing <strong>the</strong> railroad tracks, has been identified as a potential candidate forgrade separation. The potential four-lane roadway overpass would separatevehicular traffic from <strong>the</strong> Del Rio Subdivision.A preliminary layout of <strong>the</strong> potential overpass is included in Appendix E, while <strong>the</strong>environmental constraints and adjacent property land uses are identified in <strong>the</strong> DelRio Subdivision Constraints Map on sheet 24 of 31 located in Appendix F.Constraints in <strong>the</strong> vicinity of <strong>the</strong> potential grade separation include adjacentresidential and commercial properties as well as a rail yard.Access <strong>to</strong> Pine Street would be eliminated for properties adjacent <strong>to</strong> <strong>the</strong> potentialoverpass structure. Roadways connecting <strong>to</strong> Pine Street along <strong>the</strong> identifiedunderpass, such as Panam Expressway as well as <strong>the</strong> existing Pine Street bridgeover <strong>the</strong> IH-35 mainlanes would require reconstruction in order <strong>to</strong> connect <strong>to</strong> <strong>the</strong>elevated lanes of <strong>the</strong> identified potential overpass.The grade separation of Pine Street is estimated <strong>to</strong> have a cost of $5 million with anestimated public benefit of $7.3 million, which is 45 percent greater than <strong>the</strong>estimated cost of <strong>the</strong> grade separation.Grade Separation of S. Presa Street on <strong>the</strong> Del Rio SubdivisionS. Presa Street is currently a two-lane roadway that crosses <strong>the</strong> UP Del RioSubdivision in Bexar County in down<strong>to</strong>wn <strong>San</strong> <strong>An<strong>to</strong>nio</strong>. This roadway, withapproximately 10,600 daily vehicles crossing <strong>the</strong> railroad tracks, has been identifiedas a potential candidate for grade separation. According <strong>to</strong> FRA data, threeaccidents occurred at <strong>the</strong> Presa Street crossing with <strong>the</strong> Del Rio Subdivision from2002 through 2006. The potential two-lane roadway underpass would separatevehicular traffic from <strong>the</strong> Del Rio Subdivision.8 - 49
<strong>San</strong> <strong>An<strong>to</strong>nio</strong> <strong>Region</strong> <strong>Freight</strong> <strong>Study</strong>Identified ImprovementsA preliminary layout of <strong>the</strong> potential underpass is included in Appendix E, while <strong>the</strong>environmental constraints and adjacent property land uses are identified in <strong>the</strong> DelRio Subdivision Constraints Map on sheet 22 of 31 located in Appendix F.Constraints in <strong>the</strong> vicinity of <strong>the</strong> potential grade separation include adjacentresidential and commercial properties, an oil/gas pipeline, and multiple nearbyschools.Access <strong>to</strong> Presa Street would be eliminated for properties adjacent <strong>to</strong> <strong>the</strong> identifiedunderpass structure due <strong>to</strong> <strong>the</strong> lack of available right-of-way for access roadsalongside <strong>the</strong> potential underpass. Roadways connecting <strong>to</strong> Presa Street along <strong>the</strong>identified underpass, such as Lowell Street, Drexel Avenue, Grove<strong>to</strong>n Street, BoyerAvenue, Panama Avenue, and Vitra Street, would need <strong>to</strong> be closed at <strong>the</strong>irintersection with Presa Street. Traffic could be rerouted <strong>to</strong> cross <strong>the</strong> railroad onMary Street and could access Presa Street from Lotus Avenue or Whittier Street.The grade separation of Presa Street is estimated <strong>to</strong> have a cost of $10.7 millionwith an estimated public benefit of $33.4 million, which is more than 3 times <strong>the</strong>estimated cost of <strong>the</strong> grade separation.Crossing ClosuresCrossing Closures of Avenues I, K, and P on <strong>the</strong> Del Rio SubdivisionAvenues I, K, and P are each currently two-lane roadways that cross <strong>the</strong> railroad atgradein Medina County in <strong>the</strong> city of Hondo. Approximately 700 daily vehicles cross<strong>the</strong> railroad at Avenue I and Avenue P, while approximately 1,100 daily vehiclescross <strong>the</strong> railroad at Avenue K. The crossings should be considered for closure at<strong>the</strong> intersections with <strong>the</strong> UP Del Rio Subdivision in order <strong>to</strong> reduce public safetyhazards currently associated with <strong>the</strong> existing at-grade crossing. According <strong>to</strong> FRAdata, one accident occurred at <strong>the</strong> Avenue I as well as <strong>the</strong> Avenue P crossings from2002 through 2006.The location of <strong>the</strong> potential crossing closures as well as <strong>the</strong> alternative routes andassociated distances are identified in Appendix E. Additional constraints mappingmay be required at this location. Access <strong>to</strong> area properties could be maintained via<strong>the</strong> existing roadway network. Traffic could be rerouted from <strong>the</strong> closed crossingsalong 16 th Street or 22 nd Street <strong>to</strong> cross <strong>the</strong> railroad on Avenue M, which is includedas a potential grade separation in this study. Right-of-way acquisition of <strong>the</strong>adjacent properties should not be required since no new construction is identified.The crossing closures are each estimated <strong>to</strong> cost $50,000 with an estimated publicbenefit of $420 thousand and $620 thousand for Avenue K and Avenue P,respectively. The public benefit for <strong>the</strong> closure of <strong>the</strong> Avenue I crossing could not becalculated since traffic may be rerouted from that crossing <strong>to</strong> <strong>the</strong> adjacent Avenue Ecrossing, which could remain at-grade.8 - 50
<strong>San</strong> <strong>An<strong>to</strong>nio</strong> <strong>Region</strong> <strong>Freight</strong> <strong>Study</strong>Identified ImprovementsCrossing Closure of Avenue Y on <strong>the</strong> Del Rio SubdivisionAvenue Y is currently a two-lane roadway that crosses <strong>the</strong> railroad at-grade inMedina County in <strong>the</strong> city of Hondo. Approximately 2,100 vehicles cross <strong>the</strong> UP atthis location daily. The crossing should be considered for closure at <strong>the</strong> intersectionwith <strong>the</strong> UP Del Rio Subdivision in order <strong>to</strong> reduce public safety hazards currentlyassociated with <strong>the</strong> existing at-grade crossing.The location of <strong>the</strong> potential crossing closures as well as <strong>the</strong> alternative routes andassociated distances are identified in Appendix E. Additional constraints mappingmay be required at this location. Access <strong>to</strong> area properties could be maintained via<strong>the</strong> existing roadway network. Traffic could be rerouted from <strong>the</strong> closed crossing <strong>to</strong><strong>the</strong> east on Avenue U, which is included as a potential grade separation in thisstudy, or <strong>to</strong> <strong>the</strong> west on 19 th Street/Castro Avenue. Right-of-way acquisition of <strong>the</strong>adjacent properties should not be required since no new construction is identified.The crossing closure is estimated <strong>to</strong> cost $50,000. The public benefit could not becalculated for this closure since traffic may be rerouted <strong>to</strong> ano<strong>the</strong>r at-grade crossing.Crossing Closure of Brady Boulevard on <strong>the</strong> Del Rio SubdivisionBrady Boulevard is currently a two-lane roadway that crosses <strong>the</strong> railroad at-grade inBexar County in <strong>San</strong> <strong>An<strong>to</strong>nio</strong>, just north of Highway 90. Approximately 3,300vehicles cross <strong>the</strong> UP at this location daily. The crossing should be considered forclosure at <strong>the</strong> intersection with <strong>the</strong> UP Del Rio Subdivision in order <strong>to</strong> reduce publicsafety hazards currently associated with <strong>the</strong> existing at-grade crossing. According <strong>to</strong>FRA data, three accidents have occurred at <strong>the</strong> Brady Boulevard crossing from 2002through 2006.The location of <strong>the</strong> potential crossing closure as well as <strong>the</strong> alternative route andassociated distance are identified in Appendix E, while <strong>the</strong> environmental constraintsand adjacent property uses are identified in <strong>the</strong> Del Rio Subdivision Constraints Mapon sheet 19 of 31 located in Appendix F. The primary constraints in <strong>the</strong> vicinity of<strong>the</strong> potential crossing closure consist of adjacent residential property. Access <strong>to</strong>area properties could be maintained via <strong>the</strong> existing roadway network. Traffic couldbe rerouted from <strong>the</strong> closed crossing <strong>to</strong> <strong>the</strong> north on Ceralvo Street, which isincluded as a potential grade separation in this study. Right-of-way acquisition of <strong>the</strong>adjacent properties should not be required since no new construction is identified.The crossing closure is estimated <strong>to</strong> cost $50,000 with an estimated public benefit ofapproximately $2.3 million.Crossing Closures of Burnet St, Dawson St, Crockett St, and Center St on <strong>the</strong> DelRio SubdivisionBurnet, Dawson, Crockett, and Center Streets are each currently two-lane roadwaysthat cross <strong>the</strong> railroad at-grade in Bexar County in down<strong>to</strong>wn <strong>San</strong> <strong>An<strong>to</strong>nio</strong>, just eas<strong>to</strong>f IH 37. Approximately 700 vehicles cross <strong>the</strong> UP at each of <strong>the</strong>se locations daily.The crossings should be considered for closure at <strong>the</strong> intersections with <strong>the</strong> UP Del8 - 51
<strong>San</strong> <strong>An<strong>to</strong>nio</strong> <strong>Region</strong> <strong>Freight</strong> <strong>Study</strong>Identified ImprovementsRio Subdivision in order <strong>to</strong> reduce public safety hazards currently associated with<strong>the</strong> existing at-grade crossings. According <strong>to</strong> FRA data, one accident has occurredat <strong>the</strong> Crockett Street crossing from 2002 through 2006.The location of <strong>the</strong> potential crossing closures as well as <strong>the</strong> alternative routes andassociated distances are identified in Appendix E, while <strong>the</strong> environmentalconstraints and adjacent property uses are identified in <strong>the</strong> Del Rio SubdivisionConstraints Map on sheets 23 and 24 of 31 located in Appendix F. The primaryconstraints in <strong>the</strong> vicinity of <strong>the</strong> potential crossing closures consist of adjacentresidential and commercial property as well as his<strong>to</strong>ric sites. Access <strong>to</strong> areaproperties could be maintained via <strong>the</strong> existing roadway network. Traffic could bererouted from <strong>the</strong> potentially closed Burnet and Dawson Street crossings <strong>to</strong> NolanStreet, which is an existing grade separation <strong>to</strong> cross <strong>the</strong> railroad. Traffic could bererouted from <strong>the</strong> potentially closed Crockett and Center Street crossings <strong>to</strong> Hous<strong>to</strong>nStreet or Commerce Street, which are included as potential grade separations aspart of this study <strong>to</strong> cross <strong>the</strong> railroad.The crossing closures are each estimated <strong>to</strong> cost $50,000. The estimated publicbenefit for <strong>the</strong> closure of <strong>the</strong> Burnet Street crossing is $2.7 million, while <strong>the</strong>estimated public benefit for <strong>the</strong> Dawson Street closure is $1.3 million, <strong>the</strong> estimatedpublic benefit for <strong>the</strong> Crockett Street closure is $1.5 million, and <strong>the</strong> estimated publicbenefit for <strong>the</strong> Center Street closure is $1.2 million.Crossing Closures of Burleson, Hackberry, and Sherman Streets on <strong>the</strong> Del RioSubdivisionBurleson Street is currently a two-lane roadway at which approximately 1,600 dailyvehicles cross <strong>the</strong> railroad at-grade in Bexar County in down<strong>to</strong>wn <strong>San</strong> <strong>An<strong>to</strong>nio</strong>, whileHackberry Street is currently a four-lane roadway at which approximately 1,500 dailyvehicles cross <strong>the</strong> railroad, and Sherman Street is currently a two-lane roadway atwhich approximately 1,400 daily vehicles cross <strong>the</strong> railroad. The crossings should beconsidered for closure at <strong>the</strong> intersection with <strong>the</strong> UP Del Rio Subdivision in order <strong>to</strong>reduce public safety hazards currently associated with <strong>the</strong> existing at-gradecrossings. According <strong>to</strong> FRA data, two accidents occurred at <strong>the</strong> Sherman Streetcrossing from 2002 through 2006.The location of <strong>the</strong> potential crossing closures as well as <strong>the</strong> alternative route andassociated distance are identified in Appendix E, while <strong>the</strong> environmental constraintsand adjacent property uses are identified in <strong>the</strong> Del Rio Subdivision Constraints Mapon sheet 24 of 31 located in Appendix F. Located near <strong>the</strong> crossing are residentialand commercial properties as well as a rail yard. Access <strong>to</strong> <strong>the</strong> nearby propertiescould be maintained via <strong>the</strong> existing roadway network.Traffic could be rerouted from <strong>the</strong> closed Burleson and Sherman Street crossings <strong>to</strong>Pine Street, which is included as a potential grade separation in this study, or <strong>to</strong>Lamar Street <strong>to</strong> cross <strong>the</strong> railroad. Traffic could be rerouted from <strong>the</strong> closedHackberry Street crossing <strong>to</strong> Pine Street, which is <strong>the</strong> adjacent roadway <strong>to</strong> <strong>the</strong> east.8 - 52
<strong>San</strong> <strong>An<strong>to</strong>nio</strong> <strong>Region</strong> <strong>Freight</strong> <strong>Study</strong>Identified ImprovementsRight-of-way acquisition of <strong>the</strong> adjacent properties should not be required since nonew construction is identified.The crossing closures are estimated <strong>to</strong> cost $50,000 with an estimated public benefitfor <strong>the</strong> closure of <strong>the</strong> Hackberry Street crossing of approximately $2.6 million. Thepublic benefit for <strong>the</strong> closures of Burleson and Sherman Streets could not becalculated since traffic may be rerouted <strong>to</strong> ano<strong>the</strong>r at-grade crossing.Crossing Closures of Carolina St and Hoefgen Ave on <strong>the</strong> Del Rio SubdivisionCarolina Street and Hoefgen Avenue are each currently two-lane roadways thatcross <strong>the</strong> railroad at-grade in Bexar County in down<strong>to</strong>wn <strong>San</strong> <strong>An<strong>to</strong>nio</strong>, just east of IH37. Approximately 4,300 vehicles cross <strong>the</strong> UP at Carolina Street daily, whileapproximately 700 vehicles cross <strong>the</strong> UP at Hoefgen Avenue daily. The crossingsshould be considered for closure at <strong>the</strong> intersections with <strong>the</strong> UP Del Rio Subdivisionin order <strong>to</strong> reduce public safety hazards currently associated with <strong>the</strong> existing atgradecrossings. According <strong>to</strong> FRA data, four accidents have occurred at HoefgenAvenue crossing from 2002 through 2006.The location of <strong>the</strong> potential crossing closures as well as <strong>the</strong> alternative routes andassociated distances are identified in Appendix E, while <strong>the</strong> environmentalconstraints and adjacent property uses are identified in <strong>the</strong> Del Rio SubdivisionConstraints Map on sheets 22 of 31 located in Appendix F. The primary constraintsin <strong>the</strong> vicinity of <strong>the</strong> potential crossing closures consist of adjacent residential andcommercial property. Access <strong>to</strong> area properties could be maintained via <strong>the</strong> existingroadway network. Traffic could be rerouted from <strong>the</strong> potentially closed crossings <strong>to</strong>Westfall Avenue Street, which is an existing grade separation, or <strong>to</strong> Florida Street,which is included as a potential grade separation as part of this study, <strong>to</strong> cross <strong>the</strong>railroad.The crossing closures are each estimated <strong>to</strong> cost $50,000. The estimated publicbenefit for <strong>the</strong> closure of <strong>the</strong> Carolina Street crossing is $10.9 million, while <strong>the</strong>estimated public benefit for <strong>the</strong> Hoefgen Avenue closure is $2.6 million.Crossing Closures of Delaware St, Indiana St, Virginia St, and Iowa St on <strong>the</strong> DelRio SubdivisionDelaware, Indiana, Virginia, and Iowa Streets are each currently two-lane roadwaysthat cross <strong>the</strong> railroad at-grade in Bexar County in down<strong>to</strong>wn <strong>San</strong> <strong>An<strong>to</strong>nio</strong>, just eas<strong>to</strong>f IH 37. Approximately 700 vehicles cross <strong>the</strong> UP at each of <strong>the</strong>se locations daily.The crossings should be considered for closure at <strong>the</strong> intersections with <strong>the</strong> UP DelRio Subdivision in order <strong>to</strong> reduce public safety hazards currently associated with<strong>the</strong> existing at-grade crossings.The location of <strong>the</strong> potential crossing closures as well as <strong>the</strong> alternative routes andassociated distances are identified in Appendix E, while <strong>the</strong> environmentalconstraints and adjacent property uses are identified in <strong>the</strong> Del Rio SubdivisionConstraints Map on sheets 22 of 31 located in Appendix F. The primary constraints8 - 53
<strong>San</strong> <strong>An<strong>to</strong>nio</strong> <strong>Region</strong> <strong>Freight</strong> <strong>Study</strong>Identified Improvementsin <strong>the</strong> vicinity of <strong>the</strong> potential crossing closures consist of adjacent residential andcommercial property. Access <strong>to</strong> area properties could be maintained via <strong>the</strong> existingroadway network. Traffic could be rerouted from <strong>the</strong> potentially closed Delaware andIndiana Street crossings <strong>to</strong> Florida Street, which is included as a potential gradeseparation as part of this study, <strong>to</strong> cross <strong>the</strong> railroad. Traffic could be rerouted from<strong>the</strong> potentially closed Virginia and Iowa Street crossings <strong>to</strong> Durango Boulevard,which is an existing grade separation over <strong>the</strong> railroad.The crossing closures are each estimated <strong>to</strong> cost $50,000. The estimated publicbenefit for <strong>the</strong> closure of <strong>the</strong> crossings at Delaware Street, Indiana Street, VirginiaStreet and Iowa Street is $1.1 million for each crossing.Crossing Closure of Ellis Bean Street on <strong>the</strong> Del Rio SubdivisionEllis Bean Street is currently a two lane roadway that crosses <strong>the</strong> railroad at-grade inBexar County in down<strong>to</strong>wn <strong>San</strong> <strong>An<strong>to</strong>nio</strong>. Approximately 700 vehicles cross <strong>the</strong> UP atthis location daily. The crossing should be considered for closure at <strong>the</strong> intersectionwith <strong>the</strong> UP Del Rio Subdivision in order <strong>to</strong> reduce public safety hazards currentlyassociated with <strong>the</strong> existing at-grade crossing.The location of <strong>the</strong> potential crossing closure as well as <strong>the</strong> alternative route andassociated distance are identified in Appendix E, while <strong>the</strong> environmental constraintsand adjacent property uses are identified in <strong>the</strong> Del Rio Subdivision Constraints Mapon sheet 21 of 31 located in Appendix F. Located near <strong>the</strong> crossing are residentialand commercial properties as well as a school. Access <strong>to</strong> <strong>the</strong> school and o<strong>the</strong>rnearby properties could be maintained via <strong>the</strong> existing roadway network. Trafficcould be rerouted from <strong>the</strong> closed crossing <strong>to</strong> <strong>the</strong> west on Flores Street, which isincluded as a potential grade separation in this study. Right-of-way acquisition of <strong>the</strong>adjacent properties should not be required since no new construction is identified.The crossing closure is estimated <strong>to</strong> cost $50,000 with an estimated public benefit ofapproximately $760 thousand.Crossing Closure of Merida Street on <strong>the</strong> Del Rio SubdivisionMerida Street is currently a two lane roadway that crosses <strong>the</strong> railroad at-grade inBexar County in <strong>San</strong> <strong>An<strong>to</strong>nio</strong>. Approximately 700 vehicles cross <strong>the</strong> UP at thislocation daily. The crossing should be considered for closure at <strong>the</strong> intersection with<strong>the</strong> UP Del Rio Subdivision in order <strong>to</strong> reduce public safety hazards currentlyassociated with <strong>the</strong> existing at-grade crossing. According <strong>to</strong> FRA data, one accidenthas occurred at <strong>the</strong> Merida Street crossing from 2002 through 2006.The location of <strong>the</strong> potential crossing closure as well as <strong>the</strong> alternative route andassociated distance are identified in Appendix E, while <strong>the</strong> environmental constraintsand adjacent property uses are identified in <strong>the</strong> Del Rio Subdivision Constraints Mapon sheet 19 of 31 located in Appendix F. Located near <strong>the</strong> crossing are residentialproperties as well as multiple schools. Access <strong>to</strong> <strong>the</strong> schools and o<strong>the</strong>r nearbyproperties could be maintained via <strong>the</strong> existing roadway network. Traffic could be8 - 54
<strong>San</strong> <strong>An<strong>to</strong>nio</strong> <strong>Region</strong> <strong>Freight</strong> <strong>Study</strong>Identified Improvementsrerouted from <strong>the</strong> closed crossing <strong>to</strong> <strong>the</strong> south on Ceralvo Street, which is includedas a potential grade separation in this study. Right-of-way acquisition of <strong>the</strong> adjacentproperties should not be required since no new construction is identified.The crossing closure is estimated <strong>to</strong> cost $50,000 with an estimated public benefit ofapproximately $610 thousand.Crossing Closure of Roosevelt Avenue on <strong>the</strong> Del Rio SubdivisionRoosevelt Avenue is currently a two-lane roadway that crosses <strong>the</strong> railroad at-gradein Bexar County in down<strong>to</strong>wn <strong>San</strong> <strong>An<strong>to</strong>nio</strong>. Approximately 7,900 vehicles cross <strong>the</strong>UP at this location daily. The crossing should be considered for closure at <strong>the</strong>intersection with <strong>the</strong> UP Del Rio Subdivision in order <strong>to</strong> reduce public safety hazardscurrently associated with <strong>the</strong> existing at-grade crossing.The location of <strong>the</strong> potential crossing closure as well as <strong>the</strong> alternative route andassociated distance are identified in Appendix E, while <strong>the</strong> environmental constraintsand adjacent property uses are identified in <strong>the</strong> Del Rio Subdivision Constraints Mapon sheet 22 of 31 located in Appendix F. Located near <strong>the</strong> crossing are residentialand commercial properties as well as multiple schools and a park. Access <strong>to</strong> <strong>the</strong>schools and o<strong>the</strong>r nearby properties could be maintained via <strong>the</strong> existing roadwaynetwork. Traffic could be rerouted from <strong>the</strong> closed crossing <strong>to</strong> <strong>the</strong> adjacent roadway<strong>to</strong> <strong>the</strong> west on St. Mary Street, which is grade separated from <strong>the</strong> railroad. Right-ofwayacquisition of <strong>the</strong> adjacent properties should not be required since no newconstruction is identified.The crossing closure is estimated <strong>to</strong> cost $50,000 with an estimated public benefit ofapproximately $22.1 million.Railroad ImprovementsNone of <strong>the</strong> following improvements have been constructed nor are underconstruction.Improvement 1 – Construct a second mainline Alamo Jct. <strong>to</strong> Wi<strong>the</strong>rs Jct. (plannedUP improvement)The installation of a second mainline is proposed from milepost 218.8 <strong>to</strong> milepost220.8 on <strong>the</strong> Del Rio Subdivision, including new switch installations. This segment ofrailroad currently operates with a single mainline. The second mainline will beconstructed from <strong>the</strong> south end of So<strong>San</strong> Yard <strong>to</strong> a point approximately two milessouth along <strong>the</strong> west side of <strong>the</strong> Del Rio Subdivision. This second mainline willincrease fluidity of rail traffic in western <strong>San</strong> <strong>An<strong>to</strong>nio</strong>. This project is located insouthwestern <strong>San</strong> <strong>An<strong>to</strong>nio</strong> and south of <strong>the</strong> former Kelly USAF Base and So<strong>San</strong>Yard. The project extends <strong>to</strong> <strong>the</strong> southwest <strong>to</strong> just east of Interstate Loop 410.8 - 55
<strong>San</strong> <strong>An<strong>to</strong>nio</strong> <strong>Region</strong> <strong>Freight</strong> <strong>Study</strong>Identified ImprovementsImprovement 2 – Construct a second mainline and switches on <strong>the</strong> Del RioSubdivision between East Yard and Kirby YardAn extension <strong>to</strong> <strong>the</strong> north of <strong>the</strong> second mainline is proposed between milepost201.4 and 203.5 on <strong>the</strong> Del Rio Subdivision. The construction of <strong>the</strong> new track willcontinue on <strong>the</strong> east side of <strong>the</strong> existing Del Rio Subdivision mainline <strong>to</strong> KirbyInterlocking at <strong>the</strong> north end of <strong>the</strong> yard. Through trains will now have a second maintrack on which <strong>to</strong> operate. Trains would now have a direct route and trafficentering/leaving Kirby Yard and East Yard would not have cross-over moves.Located in east-central <strong>San</strong> <strong>An<strong>to</strong>nio</strong> <strong>to</strong> Kirby, this improvement is located betweenIH 35 and State Highway 78 <strong>to</strong> <strong>the</strong> north and south and between New BraunfelsAvenue on <strong>the</strong> west and Forest Road in Kirby, <strong>to</strong> <strong>the</strong> east.Improvement 5 – Extend <strong>the</strong> new second mainline of <strong>the</strong> Del Rio Subdivision atmilepost 201.40 approximately 1.0 miles north <strong>to</strong> “Seven States Corporate Park”At KIRBY interlocking and milepost 201.40, it is proposed <strong>to</strong> extend <strong>the</strong> new secondmainline approximately one mile north (now on <strong>the</strong> Glidden subdivision). This newtrack would include <strong>the</strong> limits of <strong>the</strong> switch <strong>to</strong> <strong>the</strong> Seven Springs Corporate Park.Improvement 6 – Construct new switches on <strong>the</strong> Del Rio Subdivision in <strong>the</strong> vicinity ofQuintana Road for a proposed connection in<strong>to</strong> <strong>the</strong> north end of So<strong>San</strong> YardAt approximately milepost 215.90 on <strong>the</strong> Del Rio Subdivision, it is proposed <strong>to</strong>construct switches connecting Del Rio number 1 <strong>to</strong> Del Rio number 2 at <strong>the</strong> nor<strong>the</strong>nd of So<strong>San</strong> Yard.Improvement 19 - Construct an additional Del Rio Sub-division main track west andadjacent <strong>to</strong> <strong>the</strong> Del Rio Subdivision <strong>to</strong> MacdonaWith <strong>the</strong> anticipated increase in traffic, it is proposed <strong>to</strong> construct a second new maintrack approximately 1.5 miles in length <strong>to</strong> expedite train movements betweenMacdona (milepost 223.60) and Alamo Jct. (milepost 220.10) on <strong>the</strong> Del RioSubdivision.8 - 56
<strong>San</strong> <strong>An<strong>to</strong>nio</strong> <strong>Region</strong> <strong>Freight</strong> <strong>Study</strong>Identified ImprovementsGlidden SubdivisionThe tracks of <strong>the</strong> Glidden Subdivision were originally constructed by <strong>the</strong> Galves<strong>to</strong>n,Harrisburg, & <strong>San</strong> <strong>An<strong>to</strong>nio</strong> Railway in 1877. The Subdivision originates in Hous<strong>to</strong>n,<strong>Texas</strong> and ends in <strong>San</strong> <strong>An<strong>to</strong>nio</strong> at <strong>the</strong> east end of Kirby Yard with <strong>the</strong> trackscontinuing southward as <strong>the</strong> Del Rio Subdivision. The Subdivision is approximately201 miles in <strong>to</strong>tal length, approximately 45 of which are in <strong>the</strong> <strong>San</strong> <strong>An<strong>to</strong>nio</strong> <strong>Region</strong>study area in Guadalupe and Bexar Counties.The Glidden Subdivision is a single track mainline with sidings utilized in abidirectional manner, with trains dispatched <strong>to</strong> operate in both directions, averagingbetween 20 and 30 trains daily, depending upon location.Potential improvements along <strong>the</strong> Glidden Subdivision include grade separations,crossing closures, and rail capacity enhancements, as listed in Table 8-6 with <strong>the</strong>irassociated costs.A breakdown of <strong>the</strong> order of magnitude cost estimates and <strong>the</strong> estimated associatedpublic benefits of <strong>the</strong> identified grade separations are included in Appendix C andAppendix G, respectively.8 - 57
<strong>San</strong> <strong>An<strong>to</strong>nio</strong> <strong>Region</strong> <strong>Freight</strong> <strong>Study</strong>Identified ImprovementsGlidden SubdivisionGrade SeparationsImprovementClassificationLevelEstimated CostEstimatedPublic Benefit(20-year)Ratio:Benefit/Cost(20-year)Austin St 3 $ 5,300,000 $ 9,280,000 1.75FM 1103 3 $ 11,100,000 $ 5,960,000 0.54FM 3009 3 $ 12,300,000 $ 20,060,000 1.63Hwy 218/Pat Booker 3 $ 87,600,000 $ 19,320,000 0.22Rittiman Rd 3 $ 10,100,000 $ 18,140,000 1.80Schertz Pkwy 3 $ 10,600,000 $ 4,900,000 0.46Toepperwein Rd 3 $ 19,800,000 $ 7,580,000 0.38Walzem Rd 3 $ 9,100,000 $ 17,840,000 1.96Crossing ClosuresImprovementClassificationLevelEstimated CostEstimatedPublic Benefit(20-year)*Ratio:Benefit/Cost(20-year)Guadalupe St 3 $ 50,000 $ 440,000 8.80Randolphe Rd 3 $ 50,000 NA NARail ImprovementsImprovementClassificationLevelEstimated CostEstimatedPublic Benefit(20-year)**Ratio:Benefit/Cost(20-year)#15 - Upgrade and extendConverse s<strong>to</strong>rage track(Glidden Sub. East of KirbyYard) <strong>to</strong> a 2 mile long siding 4 $ 4,910,000 NA NA*Public benefit could only be estimated for crossing closures which would be rerouted <strong>to</strong> a grade separatedcrossing. However, all crossing closures produce a public benefit of improved safety.**No public benefits of individual rail improvements were identified.$ $ 103,520,000 0.62$ NA NATotal Identified Improvements $ 170,910,000 $ 103,520,000 0.61Table 8-6: Glidden Subdivision ImprovementsClass 3 Improvements (Separations/Closures) 166,000,000Class 4 Improvements (Long-term Improvements) 4,910,000Grade SeparationsGrade Separation of Austin Street on <strong>the</strong> Glidden SubdivisionAustin Street is currently a two-lane roadway that crosses <strong>the</strong> UP GliddenSubdivision in Guadalupe County in <strong>the</strong> city of Seguin. This roadway, withapproximately 11,200 daily vehicles crossing <strong>the</strong> railroad tracks, has been identifiedas a potential candidate for grade separation. The potential two-lane roadwayoverpass would separate vehicular traffic from <strong>the</strong> Glidden Subdivision.8 - 58
<strong>San</strong> <strong>An<strong>to</strong>nio</strong> <strong>Region</strong> <strong>Freight</strong> <strong>Study</strong>Identified ImprovementsA preliminary layout of <strong>the</strong> overpass is included in Appendix E, while <strong>the</strong>environmental constraints and adjacent property land uses are identified in <strong>the</strong>Glidden Subdivision Constraints Map on sheet 25 of 30 located in Appendix F. Theprimary constraints in <strong>the</strong> vicinity of <strong>the</strong> potential grade separation consist ofadjacent residential, commercial, and industrial property. Access <strong>to</strong> adjacentproperties could be maintained via access roads alongside Austin Street with atgradeu-turns located beneath <strong>the</strong> overpass on each side of <strong>the</strong> railroad.The grade separation of Austin Street is estimated <strong>to</strong> cost $5.3 million with anestimated public benefit of nearly $9.3 million, which is 75 percent greater than <strong>the</strong>estimated cost of <strong>the</strong> grade separation.Grade Separation of FM 1103 on <strong>the</strong> Glidden SubdivisionFM 1103 is currently a two-lane roadway that crosses <strong>the</strong> UP Glidden SubdivisionGuadalupe County in <strong>the</strong> city of Cibolo. This roadway, with approximately 6,100daily vehicles crossing <strong>the</strong> railroad tracks, has been identified as a potentialcandidate for grade separation. According <strong>to</strong> FRA data, one accident occurred at<strong>the</strong> FM 1103 crossing with <strong>the</strong> Del Rio Subdivision from 2002 through 2006. Thepotential two-lane roadway underpass would separate vehicular traffic from <strong>the</strong>Glidden Subdivision.A preliminary layout of <strong>the</strong> underpass is included in Appendix E, while <strong>the</strong>environmental constraints and adjacent property land uses are identified in <strong>the</strong>Glidden Subdivision Constraints Map on sheet 10 of 30 located in Appendix F. Theprimary constraint in <strong>the</strong> vicinity of <strong>the</strong> potential grade separation consists ofadjacent commercial property. Since no properties currently access FM 1103 or FM78 along <strong>the</strong> portions of <strong>the</strong> roadways that are identified <strong>to</strong> be grade separated,access <strong>to</strong> adjacent properties and connecting roadways would be maintained. Themainlanes of Highway 78 would need <strong>to</strong> be depressed <strong>to</strong> meet <strong>the</strong> FM 1103underpass lanes and maintain connectivity between <strong>the</strong> two roads.The grade separation of FM 1103 and depressed lanes for Highway 78 is estimated<strong>to</strong> cost $11.1 million with an estimated public benefit of nearly $6 million, which isapproximately 54 percent of <strong>the</strong> estimated cost of <strong>the</strong> grade separation.Grade Separation of FM 3009 on <strong>the</strong> Glidden SubdivisionFM 3009 is currently a four-lane roadway that crosses <strong>the</strong> UP Glidden Subdivisionand intersects FM 78 in Guadalupe County in <strong>the</strong> city of Cibolo. This roadway, withapproximately 16,500 daily vehicles crossing <strong>the</strong> railroad tracks, has been identifiedas a potential candidate for grade separation. According <strong>to</strong> FRA data, threeaccidents occurred at <strong>the</strong> FM 3009 crossing with <strong>the</strong> Del Rio Subdivision from 2002through 2006. The potential four-lane roadway overpass would separate vehiculartraffic from <strong>the</strong> Glidden Subdivision.8 - 59
<strong>San</strong> <strong>An<strong>to</strong>nio</strong> <strong>Region</strong> <strong>Freight</strong> <strong>Study</strong>Identified ImprovementsA preliminary layout of <strong>the</strong> overpass is included in Appendix E, while <strong>the</strong>environmental constraints and adjacent property land uses are identified in <strong>the</strong>Glidden Subdivision Constraints Map on sheet 9 of 30 located in Appendix F. Theprimary constraints in <strong>the</strong> vicinity of <strong>the</strong> potential grade separation consist ofadjacent residential property and <strong>the</strong> location of <strong>the</strong> 100-year floodplain. Access <strong>to</strong>adjacent properties could be maintained via access roads alongside FM 3009 aswell as Highway 78 with an at-grade u-turn located beneath <strong>the</strong> overpass north of<strong>the</strong> railroad. The mainlanes of Highway 78 would need <strong>to</strong> be elevated <strong>to</strong> meet <strong>the</strong>FM 3009 overpass lanes and maintain connectivity between <strong>the</strong> two roads.The grade separation of FM 3009 and elevated lanes for Highway 78 is estimated <strong>to</strong>cost $12.3 million with an estimated public benefit of $20.1 million, which isapproximately 63 percent greater than <strong>the</strong> estimated cost of <strong>the</strong> grade separation.Grade Separation of Highway 218/Pat Booker Road on <strong>the</strong> Glidden SubdivisionHighway 218 is currently a five-lane roadway that crosses <strong>the</strong> UP GliddenSubdivision in Bexar County in <strong>the</strong> city of Universal City. This roadway, withapproximately 23,200 daily vehicles crossing <strong>the</strong> railroad tracks, has been identifiedas a potential candidate for grade separation. The potential five-lane roadwayoverpass would separate vehicular traffic from <strong>the</strong> Glidden Subdivision.A preliminary layout of <strong>the</strong> overpass is included in Appendix E, while <strong>the</strong>environmental constraints and adjacent property land uses are identified in <strong>the</strong>Glidden Subdivision Constraints Map on sheet 7 of 30 located in Appendix F. Theprimary constraint in <strong>the</strong> vicinity of <strong>the</strong> potential grade separation consists ofadjacent commercial and residential property. Access <strong>to</strong> adjacent properties couldbe maintained via at-grade access roads alongside FM 78 and Highway 218.The grade separation of Highway 218/Pat Booker Road is estimated <strong>to</strong> cost $87.6million with an estimated public benefit of nearly $19.3 million, which is 22 percent of<strong>the</strong> estimated cost of <strong>the</strong> grade separation.Grade Separation of Rittiman Road on <strong>the</strong> Glidden SubdivisionRittiman Road is currently a four-lane roadway that crosses <strong>the</strong> UP GliddenSubdivision in Bexar County in <strong>the</strong> city of Kirby. This roadway, with approximately22,100 daily vehicles crossing <strong>the</strong> railroad tracks, has been identified as a potentialcandidate for grade separation. The potential four-lane roadway overpass wouldseparate vehicular traffic from <strong>the</strong> Glidden Subdivision.A preliminary layout of <strong>the</strong> overpass is included in Appendix E, while <strong>the</strong>environmental constraints and adjacent property land uses are identified in <strong>the</strong>Glidden Subdivision Constraints Map on sheet 1 of 30 located in Appendix F. Theprimary constraint in <strong>the</strong> vicinity of <strong>the</strong> potential grade separation consists ofadjacent commercial property. Access <strong>to</strong> adjacent properties could be maintainedvia access roads alongside Rittiman Road with an at-grade u-turn located beneath<strong>the</strong> overpass east of <strong>the</strong> railroad.8 - 60
<strong>San</strong> <strong>An<strong>to</strong>nio</strong> <strong>Region</strong> <strong>Freight</strong> <strong>Study</strong>Identified ImprovementsThe grade separation of Rittiman Road is estimated <strong>to</strong> cost $10.1 million with anestimated public benefit of nearly $18.18 million, which is 80 percent greater than<strong>the</strong> estimated cost of <strong>the</strong> grade separation.Grade Separation of Schertz Parkway on <strong>the</strong> Glidden SubdivisionSchertz Parkway is currently a two-lane roadway that crosses <strong>the</strong> UP GliddenSubdivision and intersects FM 78 in Guadalupe County in <strong>the</strong> city of Cibolo. Thisroadway, with approximately 7,300 daily vehicles crossing <strong>the</strong> railroad tracks, hasbeen identified as a potential candidate for grade separation. According <strong>to</strong> FRAdata, three accidents occurred at <strong>the</strong> Schertz Parkway crossing with <strong>the</strong> Del RioSubdivision from 2002 through 2006. The potential two-lane roadway overpasswould separate vehicular traffic from <strong>the</strong> Glidden Subdivision.A preliminary layout of <strong>the</strong> overpass is included in Appendix E, while <strong>the</strong>environmental constraints and adjacent property land uses are identified in <strong>the</strong>Glidden Subdivision Constraints Map on sheet 6 of 30 located in Appendix F. Theprimary constraint in <strong>the</strong> vicinity of <strong>the</strong> potential grade separation consists ofadjacent residential and commercial property. Access <strong>to</strong> adjacent properties couldbe maintained via access roads alongside Schertz Parkway as well as Highway 78with an at-grade u-turn located beneath <strong>the</strong> overpass west of <strong>the</strong> railroad. Themainlanes of Highway 78 would need <strong>to</strong> be elevated <strong>to</strong> meet <strong>the</strong> Schertz Parkwayoverpass lanes and maintain connectivity between <strong>the</strong> two roads.The grade separation of Schertz Parkway and elevated lanes for Highway 78 isestimated <strong>to</strong> cost $10.6 million with an estimated public benefit of nearly $4.9 million,which is approximately 46 percent of <strong>the</strong> estimated cost of <strong>the</strong> grade separation.Grade Separation of Toepperwein Rd on <strong>the</strong> Glidden SubdivisionToepperwein Road is currently a two-lane roadway that crosses <strong>the</strong> UP GliddenSubdivision and intersects Gribb Sprawl Road in Bexar County in <strong>the</strong> city ofConverse. This roadway, with approximately 8,700 daily vehicles crossing <strong>the</strong>railroad tracks, has been identified as a potential candidate for grade separation.According <strong>to</strong> FRA data, one accident occurred at <strong>the</strong> Toepperwein Road crossingwith <strong>the</strong> Del Rio Subdivision from 2002 through 2006. The potential two-laneroadway overpass would separate vehicular traffic from <strong>the</strong> Glidden Subdivision.A preliminary layout of <strong>the</strong> overpass is included in Appendix E, while <strong>the</strong>environmental constraints and adjacent property land uses are identified in <strong>the</strong>Glidden Subdivision Constraints Map on sheet 5 of 30 located in Appendix F.Located near <strong>the</strong> crossing are residential and commercial properties and afirehouse. Access <strong>to</strong> adjacent properties could be maintained via access roadsalongside Toepperwein Road as well as Gribb Sprawl Road with at-grade u-turnslocated beneath <strong>the</strong> overpass each side of <strong>the</strong> railroad. The mainlanes of GribbSprawl Road would need <strong>to</strong> be elevated <strong>to</strong> meet <strong>the</strong> Toepperwein Road overpasslanes and maintain connectivity between <strong>the</strong> two roads.8 - 61
<strong>San</strong> <strong>An<strong>to</strong>nio</strong> <strong>Region</strong> <strong>Freight</strong> <strong>Study</strong>Identified ImprovementsThe grade separation of Toepperwein Road and elevated lanes for Gribb SprawlRoad is estimated <strong>to</strong> cost $19.8 million with an estimated public benefit of nearly$7.6 million, which is approximately 38 percent of <strong>the</strong> estimated cost of <strong>the</strong> gradeseparation.Grade Separation of Walzem Rd on <strong>the</strong> Glidden SubdivisionWalzem Road is currently a two-lane roadway that crosses <strong>the</strong> UP GliddenSubdivision and intersects Gribbs Sprawl Road in Bexar County in <strong>the</strong> city of Kirby.This roadway, with approximately 17,600 daily vehicles crossing <strong>the</strong> railroad tracks,has been identified as a potential candidate for grade separation. The potential twolaneroadway overpass would separate vehicular traffic from <strong>the</strong> GliddenSubdivision.A preliminary layout of <strong>the</strong> overpass is included in Appendix E, while <strong>the</strong>environmental constraints and adjacent property land uses are identified in <strong>the</strong>Glidden Subdivision Constraints Map on sheet 2 of 30 located in Appendix F.Access <strong>to</strong> adjacent properties could be maintained via access roads alongsideWalzem Road as well as Gribbs Sprawl Road with an at-grade u-turn locatedbeneath <strong>the</strong> overpass west of <strong>the</strong> railroad. The mainlanes of Gribbs Sprawl Roadwould need <strong>to</strong> be elevated <strong>to</strong> meet <strong>the</strong> Walzem Road overpass lanes and maintainconnectivity between <strong>the</strong> two roads.The grade separation of Walzem Road and elevated lanes for Gribb Sprawl Road isestimated <strong>to</strong> cost $9.1 million with an estimated public benefit of nearly $17.8 million,which is nearly two times <strong>the</strong> estimated cost of <strong>the</strong> grade separation.Crossing ClosuresCrossing Closure of Guadalupe Street on <strong>the</strong> Glidden SubdivisionGuadalupe Street is currently a two lane roadway that crosses <strong>the</strong> railroad at-gradein Guadalupe County and Seguin. Approximately 800 vehicles cross <strong>the</strong> UP at thislocation daily. The crossing should be considered for closure at <strong>the</strong> intersection with<strong>the</strong> UP Glidden Subdivision in order <strong>to</strong> reduce public safety hazards currentlyassociated with <strong>the</strong> existing at-grade crossing.The location of <strong>the</strong> potential crossing closure as well as <strong>the</strong> alternative route andassociated distance are identified in Appendix E, while <strong>the</strong> environmental constraintsand adjacent property uses are identified in <strong>the</strong> Glidden Subdivision Constraints Mapon sheet 25 of 30 located in Appendix F. Access <strong>to</strong> adjacent properties could bemaintained via <strong>the</strong> existing roadway network. Traffic could be rerouted <strong>to</strong> adjacentroadways <strong>to</strong> <strong>the</strong> east <strong>to</strong> Austin Street, which is included as a potential gradeseparation. Right-of-way acquisition of <strong>the</strong> adjacent properties should not berequired since no new construction is identified.8 - 62
<strong>San</strong> <strong>An<strong>to</strong>nio</strong> <strong>Region</strong> <strong>Freight</strong> <strong>Study</strong>Identified ImprovementsThe crossing closure is estimated <strong>to</strong> cost $50,000 with an estimated public benefit ofapproximately $440 thousand.Crossing Closure of Randolph Avenue on <strong>the</strong> Glidden SubdivisionRandolph Avenue is currently a four lane roadway that crosses <strong>the</strong> railroad at-gradein Guadalupe County and Cibolo. Approximately 700 vehicles cross <strong>the</strong> UP at thislocation daily. The crossing should be considered for closure at <strong>the</strong> intersection with<strong>the</strong> UP Glidden Subdivision in order <strong>to</strong> reduce public safety hazards currentlyassociated with <strong>the</strong> existing at-grade crossing.The location of <strong>the</strong> potential crossing closure as well as <strong>the</strong> alternative route andassociated distance are identified in Appendix E, while <strong>the</strong> environmental constraintsand adjacent property uses are identified in <strong>the</strong> Glidden Subdivision Constraints Mapon sheet 8 of 30 located in Appendix F. Right-of-way acquisition of <strong>the</strong> adjacentproperties should not be required since no new construction is identified. Access <strong>to</strong>adjacent properties could be maintained via <strong>the</strong> existing roadway network. Trafficcould be rerouted <strong>to</strong> adjacent roadways <strong>to</strong> <strong>the</strong> north <strong>to</strong> Schertz Parkway or south <strong>to</strong>1 st Street.The crossing closure is estimated <strong>to</strong> cost $50,000. The estimated public benefitcould not be calculated for <strong>the</strong> closure of Randolph Avenue since traffic may beredirected <strong>to</strong> ano<strong>the</strong>r at-grade crossing.Railroad ImprovementsNone of <strong>the</strong> following improvements have been constructed nor are underconstruction.Improvement 15 - Upgrade and extend Converse s<strong>to</strong>rage track (Glidden SubdivisionEast of Kirby Yard) <strong>to</strong> a 2 mile long sidingThe Converse s<strong>to</strong>rage track, milepost 196.40 <strong>to</strong> milepost 196.94 is located inConverse approximately 10 miles northwest of down<strong>to</strong>wn <strong>San</strong> <strong>An<strong>to</strong>nio</strong> on <strong>the</strong>Glidden Subdivision. It is proposed <strong>to</strong> extend its current half mile approximatelength westward <strong>to</strong> milepost 198.44 <strong>to</strong> create an approximate 2 mile long siding.8 - 63
<strong>San</strong> <strong>An<strong>to</strong>nio</strong> <strong>Region</strong> <strong>Freight</strong> <strong>Study</strong>Identified ImprovementsLaredo SubdivisionThe tracks of <strong>the</strong> Laredo Subdivision were originally constructed in 1882 by <strong>the</strong>International & Great Nor<strong>the</strong>rn Railroad. The Subdivision originates in <strong>San</strong> <strong>An<strong>to</strong>nio</strong>at <strong>the</strong> terminus of <strong>the</strong> Austin Subdivision ML 2 and travels south where it ends at <strong>the</strong>US/Mexico border in Laredo, <strong>Texas</strong>. The Subdivision is approximately 152 miles in<strong>to</strong>tal length, approximately 71 of which are in <strong>the</strong> <strong>San</strong> <strong>An<strong>to</strong>nio</strong> <strong>Region</strong> study area inBexar, Atascosa, Medina, and Frio Counties. The Laredo Subdivision is a singletrack mainline with sidings utilized in a bidirectional manner, with trains dispatched <strong>to</strong>operate in both directions, averaging between 10 and 20 trains daily, dependingupon location.Potential improvements along <strong>the</strong> Laredo Subdivision include grade separations,crossing closures, and rail capacity enhancements, as listed in Table 8-7 with <strong>the</strong>irassociated costs. A breakdown of <strong>the</strong> order of magnitude cost estimates and <strong>the</strong>estimated associated public benefits of <strong>the</strong> identified grade separations are includedin Appendix C and Appendix G, respectively.8 - 64
<strong>San</strong> <strong>An<strong>to</strong>nio</strong> <strong>Region</strong> <strong>Freight</strong> <strong>Study</strong>Identified ImprovementsLaredo SubdivisionGrade SeparationsImprovementClassificationLevelEstimated CostEstimatedPublic Benefit(20-year)Ratio:Benefit/Cost(20-year)Brazos St 3 $ 22,400,000 $ 9,620,000 0.43Comal St 3 $ 9,200,000 $ 3,500,000 0.38CR 4201 3 $ 20,500,000 $ 4,750,000 0.23FM 2790/Lytle 3 $ 10,000,000 $ 1,380,000 0.14FM 471 3 $ 7,700,000 $ 1,000,000 0.13SH 173 3 $ 13,300,000 $ 2,950,000 0.22Zarzamora St 3 $ 18,600,000 $ 37,360,000 2.01Crossing ClosuresImprovementClassificationLevelEstimated CostEstimatedPublic Benefit(20-year)*Ratio:Benefit/Cost(20-year)Ben<strong>to</strong>n St 3 $ 50,000 NA NACoker 3 $ 50,000 NA NACollege 3 $ 50,000 NA NADrake Ave 3 $ 50,000 NA NAFrio St 3 $ 50,000 $ 650,000 13.00Galbreath 3 $ 50,000 NA NAHarriman Pl 3 $ 50,000 $ 8,490,000 169.80Medina St 3 $ 50,000 $ 260,000 5.20Railroad St/Somers 3 $ 50,000 NA NARail ImprovementsImprovementClassificationLevelEstimated CostEstimatedPublic Benefit(20-year)**Ratio:Benefit/Cost(20-year)#8 - Construct new Laredo Subdivisionmainline track approximately 1.0 miles fromSo<strong>San</strong> Yard west <strong>to</strong> Heafer Junction 4 $ 2,740,000 NA NA#14 - Upgrade/extend Pearsall s<strong>to</strong>ragetrack (Laredo Sub.) <strong>to</strong> a 2.9 mile siding 4 $ 6,010,000 NA NA*Public benefit could only be estimated for crossing closures which would be rerouted <strong>to</strong> a grade separated crossing.However, all crossing closures produce a public benefit of improved safety.**No public benefits of individual rail improvements were identified.Class 3 Improvements (Separations/Closures) $ 102,150,000 $ 69,960,000 0.68Class 4 Improvements (Long-term Improvements) $ 8,750,000 NA NATotal Identified Improvements $ 110,900,000 $ 69,960,000 0.63Grade SeparationsTable 8-7: Laredo Subdivision ImprovementsGrade Separation of Brazos St on <strong>the</strong> Laredo SubdivisionBrazos Street is currently a two-lane roadway that crosses <strong>the</strong> UP LaredoSubdivision and <strong>the</strong> Del Rio Subdivision in Bexar County just southwest ofdown<strong>to</strong>wn <strong>San</strong> <strong>An<strong>to</strong>nio</strong>. Approximately 6,100 daily vehicles cross <strong>the</strong> Laredo8 - 65
<strong>San</strong> <strong>An<strong>to</strong>nio</strong> <strong>Region</strong> <strong>Freight</strong> <strong>Study</strong>Identified ImprovementsSubdivision and 8,400 daily vehicles cross <strong>the</strong> Del Rio Subdivision on Brazos Street,which has been identified as a potential candidate for grade separation in order <strong>to</strong>minimize <strong>the</strong> public safety risk associated with <strong>the</strong> at-grade crossings. According <strong>to</strong>FRA data, two accidents occurred at <strong>the</strong> Brazos Street crossing with <strong>the</strong> Del RioSubdivision from 2002 through 2006.A preliminary layout of <strong>the</strong> underpass is included in Appendix E, while <strong>the</strong>environmental constraints and adjacent property land uses are identified in <strong>the</strong>Laredo Subdivision Constraints Map on sheet 19 of 19 located in Appendix F. Theprimary constraints located near <strong>the</strong> Brazos Street crossing consist of adjacentcommercial and residential property.Access <strong>to</strong> Brazos Street for adjacent properties and connecting roadways south of<strong>the</strong> crossing with <strong>the</strong> Laredo Subdivision would be maintained via access roadsalongside <strong>the</strong> identified underpass. Access <strong>to</strong> adjacent properties north of <strong>the</strong>crossing with <strong>the</strong> Laredo Subdivision could be eliminated due <strong>to</strong> <strong>the</strong> identifiedunderpass structure and <strong>the</strong> lack of available right-of-way for access roads. In order<strong>to</strong> minimize impacts <strong>to</strong> properties, roadways such as Merida Street and SaltilloStreet could bridge over <strong>the</strong> identified Brazos Street underpass <strong>to</strong> access <strong>the</strong>commercial properties east of Brazos Street.The grade separation of Brazos Street is estimated <strong>to</strong> cost $22.4 million with anestimated public benefit of $9.6 million, which is 43 percent of <strong>the</strong> estimated cost of<strong>the</strong> grade separation.Grade Separation of Comal St on <strong>the</strong> Laredo SubdivisionComal Street is currently a two-lane roadway that crosses <strong>the</strong> UP LaredoSubdivision in Frio County in <strong>the</strong> city of Pearsall. Approximately 9,700 daily vehiclescross <strong>the</strong> Laredo Subdivision t, which has been identified as a potential candidate forgrade separation in order <strong>to</strong> minimize <strong>the</strong> public safety risk associated with <strong>the</strong> atgradecrossing. According <strong>to</strong> FRA data, one accident occurred at <strong>the</strong> Comal Streetcrossing with <strong>the</strong> Del Rio Subdivision from 2002 through 2006.A preliminary layout of <strong>the</strong> underpass is included in Appendix E. Additionalconstraints mapping may be required for this location. Access <strong>to</strong> Comal Street foradjacent properties and connecting roadways west of <strong>the</strong> crossing with <strong>the</strong> LaredoSubdivision would be maintained via access roads alongside <strong>the</strong> identifiedunderpass. Access <strong>to</strong> adjacent properties east of <strong>the</strong> crossing with <strong>the</strong> LaredoSubdivision could be eliminated due <strong>to</strong> <strong>the</strong> identified underpass structure and <strong>the</strong>lack of available right-of-way for access roads.The grade separation of Comal Street is estimated <strong>to</strong> cost $9.2 million with anestimated public benefit of $3.5 million, which is 38 percent of <strong>the</strong> estimated cost of<strong>the</strong> grade separation.8 - 66
<strong>San</strong> <strong>An<strong>to</strong>nio</strong> <strong>Region</strong> <strong>Freight</strong> <strong>Study</strong>Identified ImprovementsGrade Separation of CR 4201 on <strong>the</strong> Laredo SubdivisionCR 4201 is currently a two-lane roadway that crosses <strong>the</strong> UP Laredo Subdivision inFrio County in <strong>the</strong> city of Pearsall. Approximately 17,400 daily vehicles cross <strong>the</strong>Laredo Subdivision on CR 4201, which has been identified as a potential candidatefor grade separation in order <strong>to</strong> minimize <strong>the</strong> public safety risk associated with <strong>the</strong>at-grade crossings. A preliminary layout of <strong>the</strong> underpass is included in Appendix E.Additional environmental constraints mapping may be required for fur<strong>the</strong>r analysis.Access <strong>to</strong> CR 4201 for adjacent properties and connecting roadways west of <strong>the</strong>crossing with <strong>the</strong> Laredo Subdivision would be maintained via access roadsalongside <strong>the</strong> identified underpass. Access <strong>to</strong> adjacent properties east of <strong>the</strong>crossing with <strong>the</strong> Laredo Subdivision could be maintained via frontage roadsconnecting <strong>to</strong> CR 4201 beyond <strong>the</strong> location of <strong>the</strong> potential underpass.The grade separation of CR 4201 is estimated <strong>to</strong> cost $20.5 million with anestimated public benefit of $4.8 million, which is 23 percent of <strong>the</strong> estimated cost of<strong>the</strong> grade separation.Grade Separation of FM 2790 on <strong>the</strong> Laredo SubdivisionFM 2790 is currently a two-lane roadway that crosses <strong>the</strong> UP Laredo Subdivision inAtascosa County in <strong>the</strong> city of Lytle. Approximately 5,000 daily vehicles cross <strong>the</strong>Laredo Subdivision on FM 2790, which has been identified as a potential candidatefor grade separation in order <strong>to</strong> minimize <strong>the</strong> public safety risk associated with <strong>the</strong>at-grade crossings.A preliminary layout of <strong>the</strong> overpass is included in Appendix E. Additionalconstraints mapping may be required for this location. In order <strong>to</strong> maintainconnectivity between FM 2790 and Main Street, <strong>the</strong> lanes of Main Street would need<strong>to</strong> be elevated <strong>to</strong> meet <strong>the</strong> identified overpass lanes of FM 2790. Access <strong>to</strong> FM2790 as well as Main Street for adjacent properties and connecting roadways wouldbe maintained via access roads alongside <strong>the</strong> identified underpass.The grade separation of FM 2790 and Main Street is estimated <strong>to</strong> cost $10 millionwith an estimated public benefit of $1.4 million, which is 14 percent of <strong>the</strong> estimatedcost of <strong>the</strong> grade separation.Grade Separation of FM 471 on <strong>the</strong> Laredo SubdivisionFM 471 is currently a two-lane roadway that crosses <strong>the</strong> UP Laredo Subdivision inMedina County in <strong>the</strong> city of Natalia. Approximately 1,800 daily vehicles cross <strong>the</strong>Laredo Subdivision on FM 471, which has been identified as a potential candidatefor grade separation in order <strong>to</strong> minimize <strong>the</strong> public safety risk associated with <strong>the</strong>at-grade crossings. According <strong>to</strong> FRA data, one accident occurred at <strong>the</strong> FM 471crossing from 2002 through 2006.A preliminary layout of <strong>the</strong> underpass is included in Appendix E. Additionalenvironmental constraints mapping may be required for fur<strong>the</strong>r analysis. Access <strong>to</strong>8 - 67
<strong>San</strong> <strong>An<strong>to</strong>nio</strong> <strong>Region</strong> <strong>Freight</strong> <strong>Study</strong>Identified ImprovementsFM 471 for adjacent properties and connecting roadways could be maintained viaaccess roads alongside <strong>the</strong> identified underpass for potentially landlockedproperties.The grade separation of FM 471 is estimated <strong>to</strong> cost $7.7 million with an estimatedpublic benefit of $1 million, which is 13 percent of <strong>the</strong> estimated cost of <strong>the</strong> gradeseparation.Grade Separation of SH 173 on <strong>the</strong> Laredo SubdivisionSH 173 is currently a four-lane roadway that crosses <strong>the</strong> UP Laredo Subdivision inMedina County in <strong>the</strong> city of Devine. Approximately 10,200 daily vehicles cross <strong>the</strong>Laredo Subdivision on SH 173 and <strong>the</strong> roadway has been identified as a potentialcandidate for a grade separation in order <strong>to</strong> minimize <strong>the</strong> public safety riskassociated with <strong>the</strong> at-grade crossing.A preliminary layout of <strong>the</strong> proposed underpass is included in Appendix E.Additional constraints mapping may be required for fur<strong>the</strong>r analysis. Access <strong>to</strong> SH173 for adjacent properties would be eliminated along <strong>the</strong> identified underpassstructure due <strong>to</strong> <strong>the</strong> lack of available right-of-way for access roads. Roadwayscurrently connecting <strong>to</strong> SH 173 such as SH 132, Transportation Drive, and Fuller<strong>to</strong>nDrive would bridge over <strong>the</strong> depressed lanes of <strong>the</strong> identified SH 173 underpass.O<strong>the</strong>r roadways such as Sayers Drive, Upson Drive, and Rossville Road would need<strong>to</strong> be closed at <strong>the</strong> existing crossings with SH 173.The grade separation of SH 173 is estimated <strong>to</strong> cost $13.3 million with an estimatedpublic benefit of nearly $3 million, which is 22 percent of <strong>the</strong> estimated cost of <strong>the</strong>grade separation.Grade Separation of Zarzamora St on <strong>the</strong> Laredo SubdivisionZarzamora Street is currently a four-lane roadway that crosses <strong>the</strong> UP LaredoSubdivision in Bexar County just southwest of down<strong>to</strong>wn <strong>San</strong> <strong>An<strong>to</strong>nio</strong>.Approximately 21,000 daily vehicles cross <strong>the</strong> Laredo Subdivision on ZarzamoraStreet and this roadway has been identified as a potential candidate for a gradeseparation in order <strong>to</strong> minimize <strong>the</strong> public safety risk associated with <strong>the</strong> at-gradecrossing.A preliminary layout of <strong>the</strong> underpass is included in Appendix E, while <strong>the</strong>environmental constraints and adjacent property land uses are identified in <strong>the</strong>Laredo Subdivision Constraints Map on sheet 18 of 19 located in Appendix F. Theprimary constraints located near <strong>the</strong> Zarzamora Street crossing consist of adjacentcommercial and residential property. Access <strong>to</strong> Zarzamora Street for adjacentproperties would be eliminated along <strong>the</strong> identified underpass structure due <strong>to</strong> <strong>the</strong>lack of available right-of-way for access roads. In order <strong>to</strong> maintain access <strong>to</strong>Zarzamora Street, Kirk Street and Frio City Road would need <strong>to</strong> be reconstructed asdepressed lanes <strong>to</strong> connect with <strong>the</strong> identified underpass.8 - 68
<strong>San</strong> <strong>An<strong>to</strong>nio</strong> <strong>Region</strong> <strong>Freight</strong> <strong>Study</strong>Identified ImprovementsThe grade separation of Zarzamora Street is estimated <strong>to</strong> cost $18.6 million with anestimated public benefit of nearly $37.4 million, which is over two times <strong>the</strong>estimated cost of <strong>the</strong> grade separation.Crossing ClosuresCrossing Closure of Ben<strong>to</strong>n and Somers Streets on <strong>the</strong> Laredo SubdivisionBen<strong>to</strong>n and Somers Streets are each currently two-lane roadways that cross <strong>the</strong>railroad at-grade in Atascosa County in <strong>the</strong> city of Lytle. Approximately 300 vehiclescross <strong>the</strong> UP at both of <strong>the</strong>se locations daily. The crossings should be considered forclosure at <strong>the</strong> intersections with <strong>the</strong> UP Laredo Subdivision in order <strong>to</strong> reduce publicsafety hazards currently associated with <strong>the</strong> existing at-grade crossing.The location of <strong>the</strong> potential crossing closure as well as <strong>the</strong> alternative route andassociated distance are identified in Appendix E. Additional constraints mappingmay be required for fur<strong>the</strong>r analysis. Access <strong>to</strong> adjacent properties could bemaintained via <strong>the</strong> existing roadway network. Traffic could be rerouted <strong>to</strong> <strong>the</strong>adjacent roadway <strong>to</strong> <strong>the</strong> west on Prairie Street <strong>to</strong> cross <strong>the</strong> railroad. Right-of-wayacquisition of <strong>the</strong> adjacent properties should not be required since no newconstruction is identified.The crossing closures are each estimated <strong>to</strong> cost $50,000; however, <strong>the</strong> publicbenefit could not be calculated for <strong>the</strong> closures of Ben<strong>to</strong>n and Somers Streets sincetraffic may be rerouted <strong>to</strong> ano<strong>the</strong>r at-grade crossing.Crossing Closure of Coker Street on <strong>the</strong> Laredo SubdivisionCoker Street is currently a two-lane roadway that crosses <strong>the</strong> railroad at-grade inMedina County in <strong>the</strong> city of Devine. Approximately 300 vehicles cross <strong>the</strong> UP atthis location daily. The crossing should be considered for closure at <strong>the</strong> intersectionwith <strong>the</strong> UP Laredo Subdivision in order <strong>to</strong> reduce public safety hazards currentlyassociated with <strong>the</strong> existing at-grade crossing.The location of <strong>the</strong> potential crossing closure as well as <strong>the</strong> alternative route andassociated distance are identified in Appendix E. Additional constraints mappingmay be required for fur<strong>the</strong>r analysis. Access <strong>to</strong> adjacent properties could bemaintained via <strong>the</strong> existing roadway network. Traffic could be rerouted <strong>to</strong> <strong>the</strong>adjacent roadway <strong>to</strong> <strong>the</strong> south on Dilley Street <strong>to</strong> cross <strong>the</strong> railroad. Right-of-wayacquisition of <strong>the</strong> adjacent properties should not be required since no newconstruction is identified.The crossing closure is estimated <strong>to</strong> cost $50,000; however, <strong>the</strong> public benefit couldnot be calculated for <strong>the</strong> closure of Coker Street since traffic may be rerouted <strong>to</strong>ano<strong>the</strong>r at-grade crossing.8 - 69
<strong>San</strong> <strong>An<strong>to</strong>nio</strong> <strong>Region</strong> <strong>Freight</strong> <strong>Study</strong>Identified ImprovementsCrossing Closure of College and Galbreath Streets on <strong>the</strong> Laredo SubdivisionCollege and Galbreath Streets are each currently two-lane roadways that cross <strong>the</strong>railroad at-grade in Medina County in <strong>the</strong> city of Devine. Approximately 400 vehiclesand 300 vehicles cross <strong>the</strong> UP at College and Galbreath Streets daily. The crossingsshould be considered for closure at <strong>the</strong> intersections with <strong>the</strong> UP Laredo Subdivisionin order <strong>to</strong> reduce public safety hazards currently associated with <strong>the</strong> existing atgradecrossing.The location of <strong>the</strong> potential crossing closures as well as <strong>the</strong> alternative route andassociated distance are identified in Appendix E. Additional constraints mappingmay be required for fur<strong>the</strong>r analysis. Access <strong>to</strong> adjacent properties could bemaintained via <strong>the</strong> existing roadway network. Traffic could be rerouted <strong>to</strong> HerringStreet, which is located between <strong>the</strong> two potential closures, <strong>to</strong> cross <strong>the</strong> railroad.Right-of-way acquisition of <strong>the</strong> adjacent properties should not be required since nonew construction is identified.The crossing closures are each estimated <strong>to</strong> cost $50,000; however, <strong>the</strong> publicbenefit could not be calculated for <strong>the</strong> closures of College and Galbreath Streetssince traffic may be rerouted <strong>to</strong> ano<strong>the</strong>r at-grade crossing.Crossing Closure of Drake Avenue on <strong>the</strong> Laredo SubdivisionDrake Avenue is currently a two-lane roadway that crosses <strong>the</strong> railroad at-grade inBexar County in <strong>San</strong> <strong>An<strong>to</strong>nio</strong>. Approximately 700 vehicles cross <strong>the</strong> UP at thislocation daily. The crossing should be considered for closure at <strong>the</strong> intersection with<strong>the</strong> UP Laredo Subdivision in order <strong>to</strong> reduce public safety hazards currentlyassociated with <strong>the</strong> existing at-grade crossing.The location of <strong>the</strong> potential crossing closure as well as <strong>the</strong> alternative route andassociated distance are identified in Appendix E, while <strong>the</strong> environmental constraintsand adjacent property uses are identified in <strong>the</strong> Laredo Subdivision Constraints Mapon sheet 18 of 19 located in Appendix F. Access <strong>to</strong> adjacent properties could bemaintained via <strong>the</strong> existing roadway network. Traffic could be rerouted <strong>to</strong> <strong>the</strong>adjacent roadway <strong>to</strong> <strong>the</strong> north on Cumberland Street <strong>to</strong> cross <strong>the</strong> railroad. Right-ofwayacquisition of <strong>the</strong> adjacent properties should not be required since no newconstruction is identified.The crossing closure is estimated <strong>to</strong> cost $50,000; however, <strong>the</strong> public benefit couldnot be calculated for <strong>the</strong> closure of Drake Avenue since traffic may be rerouted <strong>to</strong>ano<strong>the</strong>r at-grade crossing.Crossing Closure of Frio and Medina Streets on <strong>the</strong> Laredo SubdivisionFrio and Medina Streets are each currently two-lane roadways that cross <strong>the</strong> railroadat-grade in Frio County in <strong>the</strong> city of Pearsall. Approximately 2,300 daily vehiclesand 700 daily vehicles cross <strong>the</strong> UP at Frio and Medina Streets, respectively. Thecrossings should be considered for closure at <strong>the</strong> intersections with <strong>the</strong> UP Laredo8 - 70
<strong>San</strong> <strong>An<strong>to</strong>nio</strong> <strong>Region</strong> <strong>Freight</strong> <strong>Study</strong>Identified ImprovementsSubdivision in order <strong>to</strong> reduce public safety hazards currently associated with <strong>the</strong>existing at-grade crossing.The location of <strong>the</strong> potential crossing closures as well as <strong>the</strong> alternative route andassociated distance are identified in Appendix E. Additional constraints mappingmay be required for fur<strong>the</strong>r analysis. Access <strong>to</strong> adjacent properties could bemaintained via <strong>the</strong> existing roadway network. Traffic could be rerouted <strong>to</strong> cross <strong>the</strong>railroad on <strong>the</strong> adjacent street <strong>to</strong> <strong>the</strong> north on Comal Street, which is included as apotential grade separation in this study. Right-of-way acquisition of <strong>the</strong> adjacentproperties should not be required since no new construction is identified.The crossing closures of Frio and Medina Streets are each estimated <strong>to</strong> cost$50,000 with estimated public benefits of $650 thousand and $260 thousand,respectively.Crossing Closure of Harriman Place on <strong>the</strong> Laredo SubdivisionHarriman Place is currently a two-lane roadway that crosses <strong>the</strong> railroad at-grade inBexar County in <strong>San</strong> <strong>An<strong>to</strong>nio</strong>. Approximately 5,500 vehicles cross <strong>the</strong> UP at thislocation daily. The crossing should be considered for closure at <strong>the</strong> intersection with<strong>the</strong> UP Laredo Subdivision in order <strong>to</strong> reduce public safety hazards currentlyassociated with <strong>the</strong> existing at-grade crossing.The location of <strong>the</strong> potential crossing closure as well as <strong>the</strong> alternative route andassociated distance are identified in Appendix E, while <strong>the</strong> environmental constraintsand adjacent property uses are identified in <strong>the</strong> Laredo Subdivision Constraints Mapon sheet 18 of 30 located in Appendix F. Access <strong>to</strong> adjacent properties could bemaintained via <strong>the</strong> existing roadway network. Traffic could be rerouted <strong>to</strong> adjacentroadways <strong>to</strong> <strong>the</strong> west on Zarzamora Street, which is included as a potential gradeseparation <strong>to</strong> cross <strong>the</strong> railroad. Right-of-way acquisition of <strong>the</strong> adjacent propertiesshould not be required since no new construction is identified.The crossing closure is estimated <strong>to</strong> cost $50,000 with an estimated public benefit ofapproximately $8.5 million.Railroad ImprovementsNone of <strong>the</strong> following improvements have been constructed nor are underconstruction.Improvement 8 - Construct a new Laredo Subdivision mainline track approximately1.0 miles from So<strong>San</strong> Yard west <strong>to</strong> Heafer JunctionTo provide fur<strong>the</strong>r operational enhancements in<strong>to</strong> and out of <strong>the</strong> south end of So<strong>San</strong>Yard, it is proposed <strong>to</strong> construct a second new mile long main line and switches on<strong>the</strong> Laredo Subdivision <strong>to</strong> Heafer Jct. This second track would begin at milepost264.65 <strong>to</strong> milepost 265.78 at Heafer Jct. on <strong>the</strong> Laredo Subdivision.8 - 71
<strong>San</strong> <strong>An<strong>to</strong>nio</strong> <strong>Region</strong> <strong>Freight</strong> <strong>Study</strong>Identified ImprovementsImprovement 14 - Upgrade/extend Pearsall s<strong>to</strong>rage track (Laredo Sub.) <strong>to</strong> a 2.9 milesidingPearsall s<strong>to</strong>rage track, milepost 312.48 <strong>to</strong> milepost 313.10, is located on <strong>the</strong> westside of <strong>the</strong> Laredo Subdivision. Track upgrades and an increase of approximately2.28 miles <strong>to</strong> <strong>the</strong> north in siding length are proposed. Pearsall is locatedapproximately 50 miles southwest of <strong>San</strong> <strong>An<strong>to</strong>nio</strong>.Lockhart SubdivisionThe tracks of <strong>the</strong> Lockhart Subdivision were originally constructed in 1887 by <strong>the</strong>Taylor, Bastrop, and Hous<strong>to</strong>n Railway Company. The Subdivision is approximately52 miles in <strong>to</strong>tal length between Smithville, <strong>Texas</strong> and <strong>San</strong> Marcos, <strong>Texas</strong>. TheLockhart is a single track mainline with limited sidings utilized primarily forwestbound traffic, averaging between 10 and 20 trains daily. Potentialimprovements along <strong>the</strong> Lockhart Subdivision include four rail capacityenhancements as listed in Table 8-8 with <strong>the</strong>ir associated costs.Lockhart SubdivisionRail ImprovementsImprovementClassificationLevelEstimated CostEstimatedPublicBenefit**Ratio:Benefit/Cost#16 - Install full CTC between Taylor,Smithville, and <strong>San</strong> Marcos 4 $ 21,670,000 NA NA#20 - Construct one new siding west ofLockhart 4 $ 5,040,000 NA NA#21 - Upgrades <strong>to</strong> Lockhart (curvemodifications and line swings) 2 $ 10,080,000 NA NA#22 - Construct 3 new sidings betweenLockhart and Smithville 4 $ 15,060,000 NA NA**No public benefits of individual rail improvements were identified.Class 2 Improvements (Mid-range Improvements) $ 10,080,000 NA NAClass 4 Improvements (Long-term Improvements) $ 41,770,000 NA NATotal Identified Improvements $ 51,850,000 NA NATable 8-8: Lockhart Subdivision ImprovementsRailroad ImprovementsNone of <strong>the</strong> following improvements have been constructed nor are underconstruction.Improvement 16 - Install full CTC between Taylor, Smithville, and <strong>San</strong> MarcosTo expedite train movements and increase capacity, it is proposed <strong>to</strong> upgrade <strong>to</strong> afull computerized train control (CTC) system on <strong>the</strong> Lockhart Subdivision between<strong>San</strong> Marcos milepost 51.90 and Smithville milepost 0.00 and on <strong>the</strong> WacoSubdivision between Taylor milepost 918.90 and Smithville milepost 969.40. Today,<strong>the</strong> Lockhart Subdivision track chart indicates track warrant control beginning in <strong>San</strong>8 - 72
<strong>San</strong> <strong>An<strong>to</strong>nio</strong> <strong>Region</strong> <strong>Freight</strong> <strong>Study</strong>Identified ImprovementsMarcos (milepost 51.90) <strong>to</strong> <strong>the</strong> interlocking signal at approximately milepost 40.50where ABS begins. ABS continues <strong>to</strong> <strong>the</strong> interlocking signal at approximatelymilepost 34.40, and changes back <strong>to</strong> track warrant control <strong>to</strong> Smithville (milepost0.0). The Waco Subdivision track chart indicates track warrant control beginning inSmithville (milepost 969.40) <strong>to</strong> <strong>the</strong> interlocking signal at approximately milepost921.40 where ABS begins. ABS continues through Taylor <strong>to</strong> Birge at <strong>the</strong> <strong>San</strong><strong>An<strong>to</strong>nio</strong>/Ft. Worth Division limit (milepost 918.80).Improvement 20 - Construct one new siding west of LockhartThere is an existing siding on <strong>the</strong> east side of <strong>the</strong> Lockhart Subdivision at Lockhart.It has milepost limits of 36.55 <strong>to</strong> 38.54, north <strong>to</strong> south <strong>to</strong>wards Reedville. To expeditetrain movements and increase capacity, it is proposed <strong>to</strong> construct an additionalsiding, milepost 40.80 <strong>to</strong> 42.80 and approximately two miles longImprovement 21 - Upgrades <strong>to</strong> LockhartTrack upgrades are proposed for <strong>the</strong> Lockhart area, on <strong>the</strong> Lockhart Subdivision.Lockhart is located at approximately milepost 36.60 and <strong>the</strong> improvements wouldinclude curve modifications and line swings. These improvements would result inincreased timetable speeds. Table 8-9 below identifies 11 milepost locations(unshaded) for <strong>the</strong> proposed improvements.Table 8-9: Lockhart Subdivision CurvesImprovement 22 - Construct three new sidings between Lockhart and SmithvilleLocated on <strong>the</strong> Lockhart Subdivision between milepost 36.60 and 0.00, it isproposed <strong>to</strong> construct three passing sidings, milepost 1.90 <strong>to</strong> 3.90, milepost 18.4 <strong>to</strong>8 - 73
<strong>San</strong> <strong>An<strong>to</strong>nio</strong> <strong>Region</strong> <strong>Freight</strong> <strong>Study</strong>Identified Improvements20.3 and milepost 29.0 <strong>to</strong> 31.0, each approximately two miles long. This is intendedas stand alone improvements <strong>to</strong> <strong>the</strong> Lockhart Subdivision.Waco SubdivisionThe tracks of <strong>the</strong> Waco Subdivision were originally constructed in 1887 by <strong>the</strong>Taylor, Bastrop & Hous<strong>to</strong>n Railway Company. The Subdivision runs betweenSmithville and Birge, <strong>Texas</strong> for a <strong>to</strong>tal length of approximately 51 miles. The WacoSubdivision is a single track mainline with numerous sidings utilized in a bidirectionalmanner, with trains dispatched <strong>to</strong> operate in both directions, averaging five trainsweekly. Potential improvements along <strong>the</strong> Waco Subdivision include five railcapacity enhancements as listed in Table 8-10 with <strong>the</strong>ir associated costs.Waco SubdivisionRail ImprovementsImprovementClassificationLevelEstimated CostEstimatedPublicBenefit**Ratio:Benefit/Cost#23 - Construct 2 new sidings betweenSmithville and Phelan 4 $ 9,620,000 NA NA#24 - Upgrades <strong>to</strong> Phelan (curvemodifications and line swings) 2 $ 4,170,000 NA NA#25 - Construct one new siding betweenPhelan and Elgin 2 $ 5,040,000 NA NA#26 - Upgrades <strong>to</strong> Elgin by ExtendingSiding (consider 12.3 mile line change) 4 $ 1,590,000 NA NA#27 - Construct one new siding betweenElgin and Taylor 4 $ 5,040,000 NA NA**No public benefits of individual rail improvements were identified.Class 2 Improvements (Mid-range Improvements) $ 9,210,000 NA NAClass 4 Improvements (Long-term Improvements) $ 16,250,000 NA NATotal Identified Improvements $ 25,460,000 NA NATable 8-10: Waco Subdivision ImprovementsRailroad ImprovementsNone of <strong>the</strong> following improvements have been constructed nor are underconstruction.Improvement 23 - Construct 2 new sidings between Smithville and PhelanLocated on <strong>the</strong> Waco Subdivision, Smithville and Phelan are located at milepost969.40 and 948.90, respectively. There is one existing siding in Phelan, running frommilepost 949.98 <strong>to</strong> milepost 948.27, a distance of approximately 1.7 miles on <strong>the</strong>west side of <strong>the</strong> Waco Subdivision. To increase fluidity of train movements, it isproposed <strong>to</strong> construct two passing sidings located on <strong>the</strong> east side of <strong>the</strong> WacoSubdivision with milepost limits of 952.30 <strong>to</strong> 954.10 and 958.00 <strong>to</strong> 960.00. Thisimprovement would allow for sufficient locations for train meets through <strong>the</strong> area.8 - 74
<strong>San</strong> <strong>An<strong>to</strong>nio</strong> <strong>Region</strong> <strong>Freight</strong> <strong>Study</strong>Identified ImprovementsImprovement 24 - Upgrades <strong>to</strong> PhelanTrack upgrades are proposed for <strong>the</strong> Phelan area on <strong>the</strong> Waco Subdivision. Phelanis located at approximately milepost 948.90. These upgrades include curvemodifications and line swings. Table 8-11 below identifies <strong>the</strong> seven (7) milepostslocations (unshaded) for <strong>the</strong> proposed improvements. This information is based onsimple curves and does not take spirals in<strong>to</strong> consideration. It does, however, providean approximate look at <strong>the</strong> magnitude of <strong>the</strong> track changes required for <strong>the</strong> curvereductions. As <strong>the</strong> size of <strong>the</strong> maximum track shift increases, so do <strong>the</strong> impacts <strong>to</strong>adjacent properties and <strong>the</strong> need for additional right of way.Table 8-11: Waco Subdivision CurvesImprovement 25 - Construct 1 new siding between Phelan and ElginLocated on <strong>the</strong> Waco Subdivision, Phelan and Elgin are located at milepost 948.90and 936.40, respectively. The existing Phelan and Elgin sidings have milepost limitsof 948.27 <strong>to</strong> 949.98 and 935.62 <strong>to</strong> 936.92, respectively. It is proposed <strong>to</strong> constructan additional passing siding approximately two miles long between milepost 940.60and 942.60 on <strong>the</strong> east side of <strong>the</strong> Waco Subdivision <strong>to</strong> allow for train meets.Improvement 26 - Upgrades <strong>to</strong> Elgin by Extending SidingLocated at milepost 936.40 on <strong>the</strong> Waco Subdivision, track upgrades are proposed<strong>to</strong> expedite train movements. It is proposed <strong>to</strong> extend <strong>the</strong> existing Elgin sidingapproximately 0.70 mile <strong>to</strong> <strong>the</strong> south <strong>to</strong> create a 2 mile siding. Future considerationwould be given <strong>to</strong> a new 12.3 mile line change around <strong>the</strong> west side of Elgin.Improvement 27 - Construct 1 new siding between Elgin and Taylor.There is an existing siding in Elgin milepost 935.62 <strong>to</strong> 936.92 on <strong>the</strong> west side of <strong>the</strong>Waco Subdivision. It is proposed <strong>to</strong> construct a second siding in Taylor, milepost926.00 <strong>to</strong> 928.00, also on <strong>the</strong> west side. This second siding will allow additionalfluidity for train movements, specifically for train meets.Possible <strong>San</strong> <strong>An<strong>to</strong>nio</strong> BypassWhile a precise location of a possible <strong>San</strong> <strong>An<strong>to</strong>nio</strong> bypass has not been identified,conceptual alternatives have been developed in order <strong>to</strong> obtain order of magnitude8 - 75
<strong>San</strong> <strong>An<strong>to</strong>nio</strong> <strong>Region</strong> <strong>Freight</strong> <strong>Study</strong>Identified Improvementsestimates for mileage, necessary bridge structures, and roadway-rail crossing gradeseparations. While every roadway that may cross <strong>the</strong> possible bypass was notevaluated, 14 roadways and two rail crossings were analyzed that may warrantconsideration for grade separation in <strong>the</strong> event that a <strong>San</strong> <strong>An<strong>to</strong>nio</strong> bypass isconstructed. This analysis was conceptual in nature and did not include detailedcost estimates. The cost estimates shown in Table 8-12 are order of magnitudeestimates based on <strong>the</strong> number of lanes of <strong>the</strong> roadway and <strong>the</strong> general level ofcomplexity of <strong>the</strong> crossing. Brief descriptions as well as conceptual layouts for six of<strong>the</strong> grade separations are included in <strong>the</strong> following section and Appendix E.Laredo Subdivision RailCrossing <strong>San</strong> <strong>An<strong>to</strong>nio</strong> n/a $8,000,000 $0 0.00IH 35 (Mainlanes and frontageroads) <strong>San</strong> <strong>An<strong>to</strong>nio</strong> 44,500 $16,000,000 $37,390,000 2.34FM 2790 (Somerset Road) <strong>San</strong> <strong>An<strong>to</strong>nio</strong> 5,200 $8,000,000 $2,890,000 0.36SH 16 <strong>San</strong> <strong>An<strong>to</strong>nio</strong> 19,400 $8,000,000 $10,980,000 1.37Corpus Christi Sub RailCrossing <strong>San</strong> <strong>An<strong>to</strong>nio</strong> n/a $8,000,000 $0 0.00US HWY 281 Cassin 14,000 $12,000,000 $6,790,000 0.57IH 37 (Mainlanes and frontageroads) Buena Vista 49,000 $16,000,000 $38,440,000 2.40Loop 1604 Buena Vista 5,000 $8,000,000 $2,860,000 0.36US HWY 181 Saspamco 18,400 $12,000,000 $8,720,000 0.73FM 3432 (Sulphur SpringsRoad) La Vernia 3,300 $8,000,000 $1,650,000 0.21US HWY 87 Adkins 10,500 $12,000,000 $4,600,000 0.38FM 1346 St. Hedwig 1,900 $5,000,000 $990,000 0.20IH 10 (Mainlanes and frontageroads) <strong>San</strong>ta Clara 36,500 $16,000,000 $22,730,000 1.42FM 78 McQueeney 5,500 $8,000,000 $2,650,000 0.33SH 46 McQueeney 13,900 $10,000,000 $6,270,000 0.63SH 123 Geronimo 14,000 $8,000,000 $6,340,000 0.79Total:$163,000,000 $153,300,000 0.94Grade SeparationsStreet Name City Name AADTEstimatedCost20-YearBenefit (2007dollars)Table 8-12: Possible <strong>San</strong> <strong>An<strong>to</strong>nio</strong> Bypass Grade SeparationsBenfit/ CostRatioGrade Separation of Possible <strong>San</strong> <strong>An<strong>to</strong>nio</strong> Bypass with Interstate 35 and <strong>the</strong> LaredoSubdivisionThe possible <strong>San</strong> <strong>An<strong>to</strong>nio</strong> bypass would cross both I-35 and <strong>the</strong> Laredo Subdivisionin Bexar County southwest from <strong>the</strong> city of <strong>San</strong> <strong>An<strong>to</strong>nio</strong>. This segment of <strong>the</strong>possible <strong>San</strong> <strong>An<strong>to</strong>nio</strong> bypass has been identified as a potential candidate for gradeseparation.A preliminary layout of an elevated structure for <strong>the</strong> possible <strong>San</strong> <strong>An<strong>to</strong>nio</strong> bypass isincluded in <strong>the</strong> figures in Appendix E, while <strong>the</strong> environmental constraints andadjacent property land uses are identified in <strong>the</strong> <strong>San</strong> <strong>An<strong>to</strong>nio</strong> bypass ConstraintsMap on sheets 2 and 3 of 63 located in Appendix F. The primary constraints locatedin <strong>the</strong> vicinity of <strong>the</strong> possible <strong>San</strong> <strong>An<strong>to</strong>nio</strong> bypass at <strong>the</strong> crossing with I-35 and <strong>the</strong>8 - 76
<strong>San</strong> <strong>An<strong>to</strong>nio</strong> <strong>Region</strong> <strong>Freight</strong> <strong>Study</strong>Identified ImprovementsLaredo Subdivision are adjacent parks, open areas, agricultural production land, and<strong>the</strong> 100-year floodplain. The location of <strong>the</strong> 100-year floodplain may requireadditional drainage design considerations for this grade separation. Acquisition ofright of way along <strong>the</strong> possible <strong>San</strong> <strong>An<strong>to</strong>nio</strong> Bypass alignment may be required.Grade Separation of Possible <strong>San</strong> <strong>An<strong>to</strong>nio</strong> Bypass with <strong>Texas</strong> 16The possible <strong>San</strong> <strong>An<strong>to</strong>nio</strong> bypass would cross I-37 in Bexar County south of <strong>San</strong><strong>An<strong>to</strong>nio</strong>. This segment of <strong>the</strong> <strong>San</strong> <strong>An<strong>to</strong>nio</strong> bypass has been identified as a potentialcandidate for grade separation.A preliminary layout of an elevated structure for <strong>the</strong> possible <strong>San</strong> <strong>An<strong>to</strong>nio</strong> bypass isincluded in <strong>the</strong> figures in Appendix E, while <strong>the</strong> environmental constraints andadjacent property land uses are identified in <strong>the</strong> <strong>San</strong> <strong>An<strong>to</strong>nio</strong> Bypass ConstraintsMap on sheets 6 and 7 of 63 located in Appendix F. The primary constraints locatedin <strong>the</strong> vicinity of <strong>the</strong> possible <strong>San</strong> <strong>An<strong>to</strong>nio</strong> bypass crossing with I-37 are adjacentagricultural production land and <strong>the</strong> 100-year floodplain. The location of <strong>the</strong> 100-yearfloodplain may require additional drainage design considerations for this gradeseparation. Applewhite Road east of SH 16 may be impacted by <strong>the</strong> possible trackalignment. A new roadway reroute alongside <strong>the</strong> possible track alignment may berequired <strong>to</strong> make Applewhite Road continuous and accessible for local properties.Acquisition of right of way along <strong>the</strong> possible <strong>San</strong> <strong>An<strong>to</strong>nio</strong> bypass alignment andApplewhite Road reroute may be required.Grade Separation of Possible <strong>San</strong> <strong>An<strong>to</strong>nio</strong> Bypass with US 281The possible <strong>San</strong> <strong>An<strong>to</strong>nio</strong> bypass would cross US 281 in Bexar County sou<strong>the</strong>ast of<strong>San</strong> <strong>An<strong>to</strong>nio</strong>. This segment of <strong>the</strong> <strong>San</strong> <strong>An<strong>to</strong>nio</strong> bypass has been identified as apotential candidate for grade separation.A preliminary layout of an elevated structure for <strong>the</strong> possible <strong>San</strong> <strong>An<strong>to</strong>nio</strong> bypass isincluded in <strong>the</strong> figures in Appendix E, while <strong>the</strong> environmental constraints andadjacent property land uses are identified in <strong>the</strong> <strong>San</strong> <strong>An<strong>to</strong>nio</strong> Bypass ConstraintsMap on sheets 11 thru 13 of 63 located in Appendix F. The primary constraintslocated in <strong>the</strong> vicinity of <strong>the</strong> possible <strong>San</strong> <strong>An<strong>to</strong>nio</strong> bypass crossing with I-37 areadjacent agricultural production land and <strong>the</strong> 100-year floodplain. The location of <strong>the</strong>100-year floodplain may require additional drainage design considerations for thisgrade separation. Acquisition of right of way along <strong>the</strong> possible <strong>San</strong> <strong>An<strong>to</strong>nio</strong> Bypassalignment may be required.Grade Separation of Possible <strong>San</strong> <strong>An<strong>to</strong>nio</strong> Bypass with Interstate 37The possible <strong>San</strong> <strong>An<strong>to</strong>nio</strong> bypass would cross I-37 in Bexar County sou<strong>the</strong>ast from<strong>the</strong> city of <strong>San</strong> <strong>An<strong>to</strong>nio</strong>. This segment of <strong>the</strong> <strong>San</strong> <strong>An<strong>to</strong>nio</strong> bypass has been identifiedas a potential candidate for grade separation.A preliminary layout of an elevated structure for <strong>the</strong> possible <strong>San</strong> <strong>An<strong>to</strong>nio</strong> bypass isincluded in <strong>the</strong> figures in Appendix E, while <strong>the</strong> environmental constraints andadjacent property land uses are identified in <strong>the</strong> <strong>San</strong> <strong>An<strong>to</strong>nio</strong> Bypass Constraints8 - 77
<strong>San</strong> <strong>An<strong>to</strong>nio</strong> <strong>Region</strong> <strong>Freight</strong> <strong>Study</strong>Identified ImprovementsMap on sheet 16 of 63 located in Appendix F. The primary constraints located in <strong>the</strong>vicinity of <strong>the</strong> possible <strong>San</strong> <strong>An<strong>to</strong>nio</strong> bypass crossing with I-37 are adjacent parks,open areas, agricultural production land, and commercial properties. Liedecke Rd,west of I- 37, may also be impacted by <strong>the</strong> possible track alignment. A new roadwayreroute alongside <strong>the</strong> possible track alignment may be required <strong>to</strong> make LiedeckeRd continuous and accessible for local properties. Acquisition of right of way along<strong>the</strong> possible <strong>San</strong> <strong>An<strong>to</strong>nio</strong> Bypass alignment and Liedecke Rd reroute may berequired.Grade Separation of Possible <strong>San</strong> <strong>An<strong>to</strong>nio</strong> Bypass with US 181The possible <strong>San</strong> <strong>An<strong>to</strong>nio</strong> bypass would cross US 181 in Wilson County sou<strong>the</strong>as<strong>to</strong>f <strong>San</strong> <strong>An<strong>to</strong>nio</strong>. This segment of <strong>the</strong> <strong>San</strong> <strong>An<strong>to</strong>nio</strong> bypass has been identified as apotential candidate for grade separation.A preliminary layout of an elevated structure for <strong>the</strong> possible <strong>San</strong> <strong>An<strong>to</strong>nio</strong> bypass isincluded in <strong>the</strong> figures in Appendix E, while <strong>the</strong> environmental constraints andadjacent property land uses are identified in <strong>the</strong> <strong>San</strong> <strong>An<strong>to</strong>nio</strong> Bypass ConstraintsMap on sheets 24 and 25 of 63 located in Appendix F. The primary constraintslocated in <strong>the</strong> vicinity of <strong>the</strong> possible <strong>San</strong> <strong>An<strong>to</strong>nio</strong> bypass crossing with I- 37 areadjacent parks, open areas, agricultural production land, and <strong>the</strong> 100-yearfloodplain. The location of <strong>the</strong> 100-year floodplain may require additional drainagedesign considerations for this grade separation. Stuart Road/CR 350 and TowerRoad, east of US 181, may be impacted by <strong>the</strong> possible track alignment. A newroadway reroute alongside <strong>the</strong> possible track alignment may be required <strong>to</strong> make<strong>the</strong>se roadways continuous and accessible for local properties. Acquisition of righ<strong>to</strong>f way along <strong>the</strong> possible <strong>San</strong> <strong>An<strong>to</strong>nio</strong> bypass alignment and new roadway reroutemay be required.Grade Separation of Possible <strong>San</strong> <strong>An<strong>to</strong>nio</strong> Bypass with Interstate 10/US 90The possible <strong>San</strong> <strong>An<strong>to</strong>nio</strong> bypass would cross I-10/US 90 in Guadalupe Countysouthwest from <strong>the</strong> city of Seguin. This segment of <strong>the</strong> <strong>San</strong> <strong>An<strong>to</strong>nio</strong> bypass hasbeen identified as a potential candidate for grade separation.A preliminary layout of an elevated structure for <strong>the</strong> possible <strong>San</strong> <strong>An<strong>to</strong>nio</strong> bypass isincluded in <strong>the</strong> figures in Appendix E, while <strong>the</strong> environmental constraints andadjacent property land uses are identified in <strong>the</strong> <strong>San</strong> <strong>An<strong>to</strong>nio</strong> Bypass ConstraintsMap on sheets 42 and 43 of 63 located in Appendix F. Caffey Road south of I-10/US 90, and Bol<strong>to</strong>n Road, north of I-10/US 90, may be impacted by <strong>the</strong> possibletrack alignment. New roadway reroutes alongside <strong>the</strong> possible track alignment maybe required <strong>to</strong> make <strong>the</strong> two roadways continuous and accessible for localproperties. Acquisition of right of way along <strong>the</strong> possible <strong>San</strong> <strong>An<strong>to</strong>nio</strong> Bypassalignment and new roadway reroutes may be required.8 - 78
<strong>San</strong> <strong>An<strong>to</strong>nio</strong> <strong>Region</strong> <strong>Freight</strong> <strong>Study</strong>Austin DistrictSECTION 9: AUSTIN DISTRICTExisting UP Austin SubdivisionThe Austin Subdivision originates in Hearne, <strong>Texas</strong> and passes through Taylor,George<strong>to</strong>wn, Round Rock, Austin, <strong>San</strong> Marcos, and New Braunfels before itterminates in <strong>San</strong> <strong>An<strong>to</strong>nio</strong> just south of <strong>the</strong> Bexar County Jail. The rail line continuessouthward <strong>to</strong> Laredo, and becomes <strong>the</strong> Laredo Subdivision. The Laredo Subdivisionsegment services <strong>the</strong> Toyota Facility via So<strong>San</strong> Yard and <strong>the</strong> Corpus ChristiSubdivision. The Austin Subdivision is approximately 171 miles in <strong>to</strong>tal length and ispredominately a single track line with sidings; although, double track segments existfrom <strong>San</strong> Marcos <strong>to</strong> Craig Junction (near Garden Ridge, <strong>Texas</strong>) for a distance ofapproximately 27 miles.Nor<strong>the</strong>ast of <strong>San</strong> <strong>An<strong>to</strong>nio</strong> near Craig Junction, <strong>the</strong> two mainlines separate in<strong>to</strong>different subdivisions (ML 1 and ML 2). ML 1 is <strong>the</strong> former Missouri Pacific Railroadtrack that continues <strong>to</strong>ward <strong>San</strong> <strong>An<strong>to</strong>nio</strong> from Austin, while ML 2 is <strong>the</strong> formerMissouri-Kansas-<strong>Texas</strong> Railroad alignment that continues <strong>to</strong>ward <strong>San</strong> <strong>An<strong>to</strong>nio</strong> fromSmithville via Lockhart and <strong>San</strong> Marcos. Trains operate in both directions on <strong>the</strong>Austin Subdivision, averaging between 15 and 40 trains daily, depending uponlocation.This section centers on an analysis of <strong>the</strong> existing UP Austin Subdivision identifyingroadway/rail grade crossing impacts and alternatives, along with <strong>the</strong> feasibilityassociated with potential infrastructure improvements, for grade separations andcrossing closures, within <strong>the</strong> TxDOT Austin and <strong>San</strong> <strong>An<strong>to</strong>nio</strong> Districts. The analysisalso includes defining <strong>the</strong> existing rail infrastructure’s physical characteristics andidentifying current rail operations such as average daily train counts and averagetrains speeds on <strong>the</strong> railroad.<strong>Freight</strong> Rail OperationsThe existing freight rail operations on <strong>the</strong> UP Austin Subdivision between Hearneand <strong>San</strong> <strong>An<strong>to</strong>nio</strong> were modeled in RTC in what is referred <strong>to</strong> as <strong>the</strong> base casescenario, which also includes <strong>the</strong> o<strong>the</strong>r existing rail lines between Hearne and <strong>San</strong><strong>An<strong>to</strong>nio</strong> such as <strong>the</strong> Waco, Giddings, Lockhart, Glidden, Del Rio, and LaredoSubdivisions.Figure 9-1 shows <strong>the</strong> rail lines as <strong>the</strong>y appear on <strong>the</strong> RTC computer screen. TheRTC diagram “folds” <strong>the</strong> lines internally <strong>to</strong> make best use of <strong>the</strong> computer screenspace. Mainline, siding, yard, and selected industrial tracks were coded in<strong>to</strong> RTCwith attributes that impact train operations, including allowable operating speed,distance, grade, switch type, and o<strong>the</strong>r features.9-1
<strong>San</strong> <strong>An<strong>to</strong>nio</strong> <strong>Region</strong> <strong>Freight</strong> <strong>Study</strong>Austin DistrictFigure 9-1: RTC Base Case NetworkThe RTC simulation model produces summary data including <strong>the</strong> followingperformance measures for each of three groups of trains (passenger, expeditedfreight, and o<strong>the</strong>r freight):‣ Train Count - provides <strong>the</strong> train volume over a specified time period‣ Average Speed - includes dwell time at stations, yards, and en-route worklocations‣ Meet-Pass Delay Percentage - represents <strong>the</strong> percentage of delay timeincurred by trains <strong>to</strong> meet and pass on a single track‣ Delay Minutes per 100 Train Miles - assesses <strong>to</strong>tal delay <strong>to</strong> all trains for allreasonsThe base case was simulated for a four-week period for <strong>the</strong> railroad subdivisionswithin <strong>the</strong> study area and included an average of 103 trains per day operatingthroughout <strong>the</strong> entire network. Summary simulation results are shown in Table 9-1.RTC Performance MeasureBase Case ResultsTrains Operated (28 days) 2,891Train Miles (28 Days) 359,028Total Run Time Hours (Avg. Daily Hours) 496.2Delay Time Hours (Avg. Daily Hours) 86.6Delay Percentage 17.50%Delay Minutes/100 Train Miles 40.52Average Speed 25.8Fuel (gallons) 2,956,784Gallons/Train Mile 8.2Table 9-1: RTC Performance Measure Results for Base Case Scenario9-2
<strong>San</strong> <strong>An<strong>to</strong>nio</strong> <strong>Region</strong> <strong>Freight</strong> <strong>Study</strong>Austin DistrictExisting rail traffic on <strong>the</strong> Austin Subdivision between <strong>San</strong> Marcos and ValleyJunction (near Hearne) is heaviest in <strong>the</strong> north and eastbound directions. TheAustin Subdivision is typically <strong>the</strong> preferred route for northbound freight from <strong>San</strong><strong>An<strong>to</strong>nio</strong>. Many of <strong>the</strong> trains headed south and westbound from Hearne use <strong>the</strong>Giddings, Smithville, and Lockhart Subdivisions between Valley Junction and <strong>San</strong>Marcos, or <strong>the</strong> Giddings, Glidden, and Del Rio Subdivisions from Valley Junctionand <strong>San</strong> <strong>An<strong>to</strong>nio</strong>. These directional flows help minimize meets between trains oneach route, and inherently allow for additional line capacity. Daily trains, includingthrough-freight, passenger, and local service trains on <strong>the</strong> Austin Subdivision as wellas average train speed and length, by segment, are shown in Table 9-2.LocationDailyTrainsAvg. Speed(mph)Avg. Length(feet)East of Taylor 23 34 5269Taylor <strong>to</strong> Round Rock 30 20 4785Round Rock <strong>to</strong> <strong>San</strong> Marcos 27 22 5174<strong>San</strong> Marcos <strong>to</strong> Craig Jct, ML 1 36 27 5184<strong>San</strong> Marcos <strong>to</strong> Craig Jct, ML 2 38 8 5856Craig Junction <strong>to</strong> <strong>San</strong> <strong>An<strong>to</strong>nio</strong>, ML 1 27 18 4999Craig Junction <strong>to</strong> <strong>San</strong> <strong>An<strong>to</strong>nio</strong>, ML 2 10 28 6794Table 9-2: Daily Train Counts (including through-freight, passenger, and localservice trains) on <strong>the</strong> Austin SubdivisionWhile <strong>the</strong> majority of <strong>the</strong> traffic on <strong>the</strong> Austin Subdivision is comprised of throughfreighttrains, which may potentially be rerouted <strong>to</strong> a possible bypass route, <strong>the</strong>re arealso passenger and local service trains that use <strong>the</strong> subdivision. The segment fromTaylor <strong>to</strong> Round Rock serves two daily Amtrak trains, two daily manifest trains (<strong>to</strong>and from Corbyn), and local traffic comprised of local service trains, rock trains, afew engines moving between Taylor and Round Rock or McNeil, and an occasionalcoal train that has local s<strong>to</strong>ps between Taylor and Adams. The segment fromRound Rock <strong>to</strong> Austin also has local service trains that include <strong>the</strong> daily Amtrak andmanifest trains, occasional coal trains, and a daily local train that operates fromTaylor <strong>to</strong> Austin. The segment from Austin <strong>to</strong> <strong>San</strong> Marcos is used by <strong>the</strong> dailyAmtrak and manifest trains, occasional coal trains, and a local train that operatesbetween New Braunfels and Buda.The Austin Subdivision between <strong>San</strong> Marcos and Hunter serves daily Amtrak andmanifest trains, occasional coal trains, a local train <strong>to</strong> Buda, and rock trains <strong>to</strong> andfrom Hunter. The rock trains, which now operate north through Austin, may bediverted at <strong>San</strong> Marcos <strong>to</strong> use <strong>the</strong> possible bypass route. Between Hunter and NewBraunfels <strong>the</strong> local traffic includes Amtrak and manifest trains, occasional coal trains,a local train <strong>to</strong> Buda, an additional local train working between New Braunfels andHunter, and a few rock trains between West Point and Ogden/Dittlinger.Local traffic between New Braunfels and Ogden will be similar <strong>to</strong> that north of NewBraunfels, with an additional local train that works between New Braunfels and9-3
<strong>San</strong> <strong>An<strong>to</strong>nio</strong> <strong>Region</strong> <strong>Freight</strong> <strong>Study</strong>Austin DistrictCorbyn/Dittlinger/Ogden. Lastly, local traffic south of Ogden Junction/Craig Junctionis split between <strong>the</strong> two Austin Subdivision mainline tracks. Local traffic includesadditional rock trains and local trains that operate between <strong>the</strong> Dittlinger area and<strong>San</strong> <strong>An<strong>to</strong>nio</strong>. The daily Amtrak trains can use ei<strong>the</strong>r track, and some rock trains willbe able <strong>to</strong> use ei<strong>the</strong>r track as well.Along with daily train counts, <strong>the</strong> RTC model calculates fuel consumption based on<strong>the</strong> specific operation of each train over <strong>the</strong> network, and <strong>to</strong>tals <strong>the</strong> fuel usage for alltrains run during <strong>the</strong> simulation. During <strong>the</strong> simulation, <strong>the</strong> <strong>to</strong>tal fuel consumption forall trains on <strong>the</strong> Austin Subdivision between Hearne and <strong>San</strong> <strong>An<strong>to</strong>nio</strong> was reportedas shown in Table 9-3.Gallons Train Miles Miles Gallons per MileAustin Sub 2,639,917 328,632 171.7 8.03Table 9-3: Average Fuel Consumption Statistics for <strong>the</strong> Austin SubdivisionAs shown in Table 9-2, <strong>the</strong> average speed over <strong>the</strong> Austin Subdivision betweenHearne and <strong>San</strong> <strong>An<strong>to</strong>nio</strong> ranges from 20 <strong>to</strong> 34 miles per hour. The maximumallowable speeds along <strong>the</strong> subdivision with <strong>the</strong> <strong>the</strong>oretical run times of <strong>the</strong> trainsare shown in Table 9-4 for <strong>the</strong> existing Austin Subdivision between milepost 143.12(east of Taylor) and milepost 260.40 (Tower 105 in <strong>San</strong> <strong>An<strong>to</strong>nio</strong>). A 50 mile per hourmaximum train speed was used <strong>to</strong> calculate <strong>the</strong> <strong>the</strong>oretical trip times.Timetable Speed RestrictionsMP MP DISTANCE SPEED ( MPH ) TIME ( SEC )From To (Miles) PSGR FREIGHT Max PSGR FREIGHT Max144.3 144.9 0.6 15 15 15 144 144 144145.9 146.7 0.8 40 40 40 72 72 72146.7 147.7 1 60 45 45 60 80 80160.0 161.8 1.8 60 60 50 108 108 130165.9 166.0 0.1 25 25 25 14 14 14166.9 171.0 4.1 60 60 50 246 246 295171.0 174.3 3.3 60 35 35 198 339 339174.3 178.2 3.9 50 35 35 281 401 401178.2 179.6 1.4 40 35 35 126 144 144179.6 179.8 0.2 15 15 15 48 48 48179.8 186.1 6.3 35 35 35 648 648 648190.5 192.0 1.5 60 55 50 90 98 108192.0 195.0 3 65 60 50 166 180 216201.6 203.2 1.6 55 50 50 105 115 115205.3 207.6 2.3 55 50 50 151 166 166207.6 211.1 3.5 30 30 30 420 420 420224.5 229.2 4.7 30 30 30 564 564 564229.2 232.0 2.8 60 50 50 168 202 202232.0 235.6 3.6 60 60 50 216 216 259240.3 240.7 0.4 60 60 50 24 24 29242.8 244.3 1.5 60 60 50 90 90 108247.4 248.6 1.2 60 60 50 72 72 86248.6 256.1 7.5 45 45 45 600 600 600256.1 257.4 1.3 40 40 40 117 117 117257.4 258.5 1.1 30 30 30 132 132 132258.5 260.4 1.9 20 20 20 342 342 342Maximum Unrestricted Subdivision Speed142.1 260.4 56.9 70 60.0 50.0 2925 3413 4095TOTAL TIME ( MINUTES ) 135.4 149.9 164.6Table 9-4: Austin Subdivision Timetable Speeds and Theoretical Run Times(based on a 50 mph maximum train speed)9-4
<strong>San</strong> <strong>An<strong>to</strong>nio</strong> <strong>Region</strong> <strong>Freight</strong> <strong>Study</strong>Austin DistrictHighway/ Rail Grade Crossing Impacts AnalysisPotential improvements along <strong>the</strong> Austin Subdivision within <strong>the</strong> Austin District’sWilliamson, Travis, and Hays Counties, include grade separations and crossingclosures as listed in Tables 9-5 and 9-6 and are described in <strong>the</strong> following section.Street NameCity NameAADTAccidents(2002-2006)20-Year BenefitEstimated Cost(2007 dollars)Benfit/ CostRatioAQUARENA SPRINGS/ LOOP 82and POST ROAD SAN MARCOS 20,400 0 $14,800,000 $14,180,000 0.96BANISTER LANE AUSTIN 4,800 0 $6,600,000 $2,790,000 0.42BUGG LANE SAN MARCOS 8,400 0 $6,100,000 $8,800,000 1.44BURNET STREET ROUND ROCK 6,900 0 $14,300,000 $5,490,000 0.38CENTER STREET/ FM 150 KYLE 5,000 0 $5,200,000 $3,370,000 0.65CM ALLEN PKWY and SH 12 SAN MARCOS 37,900 0 $22,200,000 $41,620,000 1.87DITTMAR ROAD AUSTIN 20,400 0 $5,000,000 $20,980,000 4.20DUVAL ROAD AUSTIN 17,700 0 $11,200,000 $12,530,000 1.12FM 1626 MANCHACA 14,700 0 $5,900,000 $12,470,000 2.11FM 1660 HUTTO 4,600 2 $12,200,000 $5,170,000 0.42FM 685 HUTTO 12,200 1 $13,500,000 $10,230,000 0.76GUADALUPE STREET/LOOP 82 SAN MARCOS 17,900 0 $6,500,000 $25,220,000 3.88IH 35 NB and SB FRONTAGEROADS ROUND ROCK 49,800 1 $22,300,000 $51,870,000 2.33KOHLERS XING/ CR 171 KYLE 7,200 0 $5,000,000 $5,160,000 1.03LBJ DRIVE SAN MARCOS 16,500 0 $7,000,000 $22,080,000 3.15MATTHEWS LANE AUSTIN 5,700 1 $11,600,000 $4,480,000 0.39NORTH MAIN ST./LOOP 4 BUDA 13,300 0 $6,400,000 $10,730,000 1.68OLTORF STREET AUSTIN 16,800 0 $12,300,000 $11,790,000 0.96QUICK HILL ROAD (CR 172) ROUND ROCK 11,400 1 $14,300,000 $9,290,000 0.65RED BUD LANE ROUND ROCK 6,200 0 $14,000,000 $4,750,000 0.34SOUTH MAIN ST/LOOP 4 BUDA 13,400 0 $5,200,000 $10,910,000 2.10STASSNEY LANE AUSTIN 25,000 0 $8,200,000 $19,590,000 2.39WONDER WORLD DRIVE SAN MARCOS 13,900 0 $8,200,000 $17,380,000 2.12TOTAL:$238,000,000 $331,780,000 1.39Table 9-5: Potential Grade SeparationsStreet NameCity NameAADTAccidents(2002-2006)EstimatedCost20-Year Benefit(2007 dollars)Benfit/ CostRatioPEACH STREET BUDA 600 0 $50,000 $260,000 5.20JIM CAGE RD/ FM 1660 HUTTO 600 0 $50,000 $330,000 6.60MARY STREET AUSTIN 3,900 0 $50,000 $2,530,000 50.60SLOAN STREET TAYLOR 600 0 $50,000 $270,000 5.40TOTAL:$200,000 $3,390,000 16.95Table 9-6: Potential Crossing ClosuresThe study team analyzed at-grade crossings in <strong>the</strong> region and evaluated <strong>the</strong>crossings based on roadway and rail alignments, vehicular and train traffic counts,and crossing accident information. Every crossing in <strong>the</strong> region has not beenevaluated; ra<strong>the</strong>r <strong>the</strong> analysis of grade crossings was limited <strong>to</strong> those locationswhich <strong>the</strong> traffic data analysis (average traffic volumes of vehicles and trains) andRTC modeling results warranted fur<strong>the</strong>r review. The identification of gradeseparations or closures should not be misconstrued as a final listing, but ra<strong>the</strong>r as alist of improvements, which may ultimately require additional analysis and additionsas well.9-5
<strong>San</strong> <strong>An<strong>to</strong>nio</strong> <strong>Region</strong> <strong>Freight</strong> <strong>Study</strong>Austin DistrictGrade separations consist of roadway overpasses and underpasses that separatevehicular traffic from rail traffic, minimizing <strong>the</strong> safety exposure and noise associatedwith <strong>the</strong> roadway/rail interface. The roadways identified as potential gradeseparations are listed in Table 9-5 with associated average annual daily trafficvolumes (AADT), average daily train volumes, number of crossing accidents within<strong>the</strong> past five years, estimated public benefits over a 20-year period, estimated costs,and benefit/cost ratios.Crossing closures minimize <strong>the</strong> safety hazards associated with <strong>the</strong> vehicle/traininterface by closing a roadway at <strong>the</strong> point where <strong>the</strong> roadway traverses <strong>the</strong> railroad.A crossing closure would require an alternate route for vehicular through-traffic. Thecrossing closures are listed with calculated associated public benefits that resultfrom redirecting traffic <strong>to</strong> a grade separated structure. The roadways identified aspotential closures are listed in Table 9-6 with associated AADT’s, number ofcrossing accidents within <strong>the</strong> past five years, estimated public benefits, estimatedcosts, and benefit/cost ratios.Each identified improvement was analyzed with respect <strong>to</strong> existing conditions,estimated implementation costs, and associated estimated public and privatebenefits. The existing conditions identified for <strong>the</strong> locations of potentialimprovements include descriptions of adjacent property land use and estimatedvalue, environmental constraints, traffic flow volumes for both vehicular and railtraffic, and traffic accident statistics for <strong>the</strong> crossing.The estimated implementation costs for each improvement are order of magnitudecosts based on preliminary planning. The costs included in this study represent anestimate of probable costs prepared in good faith and with reasonable care. The<strong>Study</strong> Team has no control over <strong>the</strong> costs of construction labor, materials, orequipment, nor over competitive bidding or negotiating methods and does not makeany commitment or assume any duty <strong>to</strong> assure that bids or negotiated prices will notvary from <strong>the</strong>se estimates. The costs are subject <strong>to</strong> inflation, and in some cases willbe calculated using county appraisal district values for right-of-way acquisition,which may vary significantly from <strong>the</strong> actual cost of acquisition of property.Anticipated public benefits include reductions in vehicular delay times at existing atgradecrossings, reductions in vehicle and locomotive fuel consumption,improvements in air quality, improvements in public safety, improvements in mobilityfor vehicular and freight traffic due <strong>to</strong> changes in train operations fromimprovements; reductions in noise and vibration from rerouting of trains; andimproved freight mobility from more efficient routes. The estimated public benefitswere determined by using a grade crossing impedance model as described insection 10. Existing at-grade crossings along <strong>the</strong> Austin Subdivision in Hays, Travis,and Williamson Counties are shown in Figure 9-2.9-6
<strong>San</strong> <strong>An<strong>to</strong>nio</strong> <strong>Region</strong> <strong>Freight</strong> <strong>Study</strong>Austin DistrictFigure 9-2: Public Grade Crossing Locations along <strong>the</strong> Austin SubdivisionThe benefit of <strong>the</strong> grade separations and crossing closures identified in this sectionis a <strong>to</strong>tal of more than $335 million reduction in costs incurred at crossings along <strong>the</strong>Austin Subdivision (within <strong>the</strong> Austin District boundaries) over a 20 year period,which equates <strong>to</strong> a 90 percent reduction in costs.The identified potential grade separations and crossing closures primarily providebenefit <strong>to</strong> <strong>the</strong> public in <strong>the</strong> form of reduced delays and improved safety, but also mayprovide a benefit <strong>to</strong> <strong>the</strong> railroads.Potential benefits that may be realized by <strong>the</strong> railroads as a result of <strong>the</strong> identifiedimprovements may include improvements in train operating efficiency (includingreductions in train delays) that could result by increasing <strong>the</strong> number of locationswhere trains would be permitted <strong>to</strong> temporarily s<strong>to</strong>p and not block existinghighway/rail crossings, improvements in train run-times, as well as reductions in <strong>the</strong>railroads exposure <strong>to</strong> at-grade crossing accidents.The grade separations and closures identified in this analysis are individuallydetailed in <strong>the</strong> following discussions, while a breakdown of <strong>the</strong> order of magnitude9-7
<strong>San</strong> <strong>An<strong>to</strong>nio</strong> <strong>Region</strong> <strong>Freight</strong> <strong>Study</strong>Austin Districtcost estimates and <strong>the</strong> estimated associated public benefits of <strong>the</strong> identified potentialgrade separations are included in Appendix C and Appendix G, respectively.Grade SeparationsGrade Separation of Loop 82 (Aquarena Springs Drive) and Post RoadLoop 82 is currently a four-lane road that crosses <strong>the</strong> UP Austin Subdivision in HaysCounty in <strong>the</strong> city of <strong>San</strong> Marcos. Post Road is currently a two-lane road thatcrosses <strong>the</strong> UP Austin Subdivision approximately 600 ft from <strong>the</strong> Loop 82 crossing of<strong>the</strong> rail line and intersects Loop 82 approximately 500 ft from <strong>the</strong> crossing. Loop 82,with approximately 11,400 vehicles crossing <strong>the</strong> railroad tracks daily and Post Road,with approximately 9,000 vehicles crossing <strong>the</strong> railroad tracks daily have beenidentified as potential candidates for grade separation. Due <strong>to</strong> <strong>the</strong> close proximity of<strong>the</strong> two crossings and <strong>the</strong> intersection of <strong>the</strong> two roadways, <strong>the</strong> potential four-laneand two-lane roadway overpasses would have <strong>to</strong> be constructed in conjunction withone ano<strong>the</strong>r <strong>to</strong> separate vehicular traffic from <strong>the</strong> Austin Subdivision.A preliminary layout of <strong>the</strong> overpass is included in <strong>the</strong> figures in Appendix E, alongwith environmental constraints and adjacent property land uses. The constraintslocated in <strong>the</strong> vicinity of Loop 82 and Post Road consist of adjacent commercialproperty, residential property, agricultural property, <strong>the</strong> <strong>Texas</strong> State Universityfootball stadium and <strong>the</strong> <strong>Texas</strong> State University golf course. Access <strong>to</strong> adjacentproperties could be maintained via access roads alongside Loop 82 and Post Road.The intersection of Loop 82 and Post Road would be maintained on <strong>the</strong> east side of<strong>the</strong> rail line. An at-grade intersection, with a u-turn, would be provided beneath <strong>the</strong>overpass on <strong>the</strong> west side of <strong>the</strong> rail line <strong>to</strong> provide access <strong>to</strong> Laurel Ridge Roadfrom Loop 82 and Post Road.The grade separation of Loop 82 and Post Road is estimated <strong>to</strong> cost $14.8 million.The estimated public benefit calculated for <strong>the</strong> grade separation of Loop 82 and PostRoad is approximately $14.2 million, which is approximately 96 percent of <strong>the</strong>estimated cost of <strong>the</strong> grade separations.Grade Separation of Banister LaneBanister Lane is currently a two-lane road that crosses <strong>the</strong> UP Austin Subdivision inTravis County in <strong>the</strong> city of Austin. This roadway, with approximately 4,800 vehiclescrossing <strong>the</strong> railroad tracks daily, has been identified as a potential candidate forgrade separation. The potential two-lane roadway overpass would separatevehicular traffic from <strong>the</strong> Austin Subdivision.A preliminary layout of <strong>the</strong> overpass is included in <strong>the</strong> figures in Appendix E, alongwith environmental constraints and adjacent property land uses. The constraintslocated in <strong>the</strong> vicinity of Banister Lane consist of adjacent commercial andresidential property. Access <strong>to</strong> adjacent properties could be maintained via accessroads alongside Banister Lane along with at-grade u-turns located beneath <strong>the</strong>overpass on each side of <strong>the</strong> railroad.9-8
<strong>San</strong> <strong>An<strong>to</strong>nio</strong> <strong>Region</strong> <strong>Freight</strong> <strong>Study</strong>Austin DistrictThe grade separation of Banister Lane is estimated <strong>to</strong> cost $6.6 million. Theestimated public benefit calculated for <strong>the</strong> grade separation of Banister Lane isapproximately $2.8 million, which is approximately 42 percent of <strong>the</strong> estimated cos<strong>to</strong>f <strong>the</strong> grade separation.Grade Separation of Bugg Lane (Bobcat Drive/Charles Austin Drive)Bugg Lane is currently a two-lane road that crosses <strong>the</strong> UP Austin Subdivision inHays County in <strong>the</strong> city of <strong>San</strong> Marcos. This roadway, with approximately 8,400vehicles crossing <strong>the</strong> railroad tracks daily, has been identified as a potentialcandidate for grade separation. The potential two-lane roadway overpass wouldseparate vehicular traffic from <strong>the</strong> Austin Subdivision.A preliminary layout of <strong>the</strong> overpass is included in <strong>the</strong> figures in Appendix E, alongwith environmental constraints and adjacent property land uses. The constraintslocated in <strong>the</strong> vicinity of Bugg Lane consist of adjacent commercial and <strong>Texas</strong> StateUniversity property. Some access <strong>to</strong> adjacent properties could be maintained viaaccess roads alongside Bugg Lane; however, <strong>the</strong>re may be some impact <strong>to</strong>buildings at <strong>the</strong> adjacent Riverside Apartments. Additionally, parking along <strong>the</strong> roadmay be eliminated. At-grade u-turns could be located beneath <strong>the</strong> overpass on eachside of <strong>the</strong> railroad <strong>to</strong> provide access <strong>to</strong> adjacent properties.The grade separation of Bugg Lane is estimated <strong>to</strong> cost $6.1 million. The estimatedpublic benefit calculated for <strong>the</strong> grade separation of Bugg Lane is approximately$8.8 million, which is approximately 44 percent greater than <strong>the</strong> estimated cost of<strong>the</strong> grade separation.Grade Separation of Burnet StreetBurnet Street is currently a two-lane roadway where it crosses <strong>the</strong> UP AustinSubdivision in Williamson County in <strong>the</strong> city of Round Rock. This roadway, withapproximately 6,900 vehicles crossing <strong>the</strong> railroad tracks daily, has been identifiedas a potential candidate for grade separation. The potential two-lane roadwayoverpass would separate vehicular traffic from <strong>the</strong> Austin Subdivision.A preliminary layout of <strong>the</strong> overpass is included in <strong>the</strong> figures in Appendix E, alongwith environmental constraints and adjacent property land uses. The constraintslocated in <strong>the</strong> vicinity of Burnet Road consist of adjacent residential and commercialproperty. Access <strong>to</strong> adjacent properties south of <strong>the</strong> railroad could be maintainedvia access roads alongside Burnet Road along with an at-grade u-turn locatedbeneath <strong>the</strong> overpass on <strong>the</strong> south side of <strong>the</strong> railroad. Access <strong>to</strong> properties directlyadjacent <strong>to</strong> <strong>the</strong> identified overpass structure north of <strong>the</strong> railroad would beeliminated, and <strong>the</strong> cost of such properties was included in <strong>the</strong> cost estimate for <strong>the</strong>grade separation.The grade separation of Burnet Road is estimated <strong>to</strong> cost $14.3 million. Theestimated public benefit calculated for <strong>the</strong> grade separation of Burnet Road is9-9
<strong>San</strong> <strong>An<strong>to</strong>nio</strong> <strong>Region</strong> <strong>Freight</strong> <strong>Study</strong>Austin Districtapproximately $5.5 million, which is approximately 38 percent of <strong>the</strong> estimated cos<strong>to</strong>f <strong>the</strong> grade separation.Grade Separation of FM 150 (Center Street)FM 150 is currently a four-lane road that crosses <strong>the</strong> UP Austin Subdivision in HaysCounty in <strong>the</strong> city of Kyle. This roadway, with approximately 5,000 vehicles crossing<strong>the</strong> railroad tracks daily, has been identified as a potential candidate for gradeseparation. The potential four-lane roadway overpass would separate vehiculartraffic from <strong>the</strong> Austin Subdivision.A preliminary layout of <strong>the</strong> overpass is included in <strong>the</strong> figures in Appendix E, alongwith environmental constraints and adjacent property land uses. The constraintslocated in <strong>the</strong> vicinity of FM 150 consist of adjacent commercial property. Access <strong>to</strong>adjacent properties could be maintained via existing side streets and drives. NorthFront Street and <strong>the</strong> I-35 frontage road would remain open beneath <strong>the</strong> overpass.North Main Street would be closed with a turnaround area provided on each side ofFM 150.The grade separation of FM 150 is estimated <strong>to</strong> cost $5.2 million. The estimatedpublic benefit calculated for <strong>the</strong> grade separation of FM 150 is approximately $3.4million, which is approximately 65 percent of <strong>the</strong> estimated cost of <strong>the</strong> gradeseparation.Grade Separation of CM Allen Pkwy and SH 12CM Allen Parkway is currently a four-lane road that crosses <strong>the</strong> UP AustinSubdivision (MLs 1 and 2) in Hays County in <strong>the</strong> city of <strong>San</strong> Marcos. SH 12 iscurrently a four-lane road that crosses <strong>the</strong> UP Austin Subdivision (MLs 1 and 2) aswell as <strong>the</strong> UP Lockhart Subdivision approximately 900 ft from <strong>the</strong> CM AllenParkway crossing of <strong>the</strong> Austin Subdivision ML 1 and intersects CM Allenapproximately 800 ft from <strong>the</strong> crossing. CM Allen Pkwy, with approximately 13,700vehicles crossing <strong>the</strong> railroad tracks daily and SH 12, with approximately 24,200vehicles crossing <strong>the</strong> railroad tracks daily have been identified as potentialcandidates for grade separation. Due <strong>to</strong> <strong>the</strong> close proximity of <strong>the</strong> two crossings and<strong>the</strong> intersection of <strong>the</strong> two roadways, <strong>the</strong> potential four-lane roadway overpasseswould have <strong>to</strong> be constructed in conjunction with one ano<strong>the</strong>r <strong>to</strong> separate vehiculartraffic from <strong>the</strong> UP Austin and Lockhart Subdivisions.A preliminary layout of <strong>the</strong> overpass is included in <strong>the</strong> figures in Appendix E, alongwith environmental constraints and adjacent property land uses. The constraintslocated in <strong>the</strong> vicinity of CM Allen and SH 12 consist of adjacent commercialproperty west of Austin Subdivision ML 1 and east of Austin Subdivision ML 2 aswell as a public library, activity/recreation center, and <strong>San</strong> Marcos City Hall locatedin between <strong>the</strong> two Austin Subdivision mainlines. Access <strong>to</strong> properties in between<strong>the</strong> two Austin Subdivision Mainlines, including <strong>the</strong> City Hall, could be maintained viaaccess roads alongside SH 12 that cross beneath <strong>the</strong> overpass and provide access<strong>to</strong> Bugg Lane; however, access <strong>to</strong> SH 12 would be eliminated for such properties9-10
<strong>San</strong> <strong>An<strong>to</strong>nio</strong> <strong>Region</strong> <strong>Freight</strong> <strong>Study</strong>Austin Districtdue <strong>to</strong> <strong>the</strong> location of <strong>the</strong> identified overpass structure. Connectivity between CMAllen and SH 12 would be maintained, although <strong>the</strong> intersection would no longer beat-grade. However, access <strong>to</strong> SH 12 east of Austin Subdivision ML 2 and <strong>the</strong>Lockhart Subdivision from Thorpe Lane, Long Street, and Cheatham Street wouldbe eliminated due <strong>to</strong> <strong>the</strong> location of <strong>the</strong> identified overpass structure, and such trafficwould need <strong>to</strong> be rerouted <strong>to</strong> o<strong>the</strong>r roadways.The grade separation of CM Allen and SH 12 is estimated <strong>to</strong> cost $14 million with anestimated public benefit of approximately $41.6 million, which is 87 percent greaterthan <strong>the</strong> estimated cost of <strong>the</strong> grade separations.Grade Separation of Dittmar RoadDittmar Road is currently a two-lane roadway that crosses <strong>the</strong> UP Austin Subdivisionin Travis County in <strong>the</strong> city of Austin. This roadway, with approximately 20,400vehicles crossing <strong>the</strong> railroad tracks daily, has been identified as a potentialcandidate for grade separation. The potential two-lane roadway overpass wouldseparate vehicular traffic from <strong>the</strong> Austin Subdivision.A preliminary layout of <strong>the</strong> overpass is included in <strong>the</strong> figures in Appendix E, alongwith environmental constraints and adjacent property land uses. The constraintslocated in <strong>the</strong> vicinity of Dittmar Road consist of adjacent residential property;however, since <strong>the</strong> adjacent properties do not directly access Dittmar Road at <strong>the</strong>location of <strong>the</strong> identified overpass, access <strong>to</strong> adjacent properties should not beimpacted.The grade separation of Dittmar Road is estimated <strong>to</strong> cost $5 million. The estimatedpublic benefit calculated for <strong>the</strong> grade separation of Dittmar Road is approximately$21 million, which is more than four times <strong>the</strong> estimated cost of <strong>the</strong> gradeseparation.Grade Separation of Duval RoadDuval Road is currently a four-lane roadway that crosses <strong>the</strong> UP Austin Subdivisionin Travis County in <strong>the</strong> city of Austin. This roadway, with approximately 17,700vehicles crossing <strong>the</strong> railroad tracks daily, has been identified as a potentialcandidate for grade separation. The potential four-lane roadway underpass wouldseparate vehicular traffic from <strong>the</strong> Austin Subdivision.A preliminary layout of <strong>the</strong> overpass is included in <strong>the</strong> figures in Appendix E, alongwith environmental constraints and adjacent property land uses. The constraintslocated in <strong>the</strong> vicinity of Duval Road consist of adjacent residential property,including single family homes as well and multi family residences such as apartmenthomes. Access <strong>to</strong> adjacent properties east of <strong>the</strong> railroad could be maintained viaaccess roads alongside Duval Road along with an at-grade u-turn located above <strong>the</strong>underpass on <strong>the</strong> east side of <strong>the</strong> railroad. Access <strong>to</strong> properties directly adjacent <strong>to</strong><strong>the</strong> identified underpass structure west of <strong>the</strong> railroad would be eliminated, and <strong>the</strong>cost of such properties was included in <strong>the</strong> cost estimate for <strong>the</strong> grade separation.9-11
<strong>San</strong> <strong>An<strong>to</strong>nio</strong> <strong>Region</strong> <strong>Freight</strong> <strong>Study</strong>Austin DistrictThe grade separation of Duval Road is estimated <strong>to</strong> cost $11.2 million. Theestimated public benefit calculated for <strong>the</strong> grade separation of Duval Road isapproximately $12.5 million, which is approximately 12 percent greater than <strong>the</strong>estimated cost of <strong>the</strong> grade separation.Grade Separation of FM 1626FM 1626 is currently a two-lane roadway that crosses <strong>the</strong> UP Austin Subdivision inTravis County in <strong>the</strong> city of Manchaca. This roadway, with approximately 14,700vehicles crossing <strong>the</strong> railroad tracks daily, has been identified as a potentialcandidate for grade separation. The potential two-lane roadway overpass wouldseparate vehicular traffic from <strong>the</strong> Austin Subdivision.A preliminary layout of <strong>the</strong> overpass is included in <strong>the</strong> figures in Appendix E, alongwith environmental constraints and adjacent property land uses. The constraintslocated in <strong>the</strong> vicinity of FM 1626 consist of adjacent commercial and residentialproperty. Access <strong>to</strong> adjacent properties could be maintained via access roadsalongside FM 1626 along with at-grade u-turns located beneath <strong>the</strong> overpass oneach side of <strong>the</strong> railroad.The grade separation of FM 1626 is estimated <strong>to</strong> cost $5.9 million. The estimatedpublic benefit calculated for <strong>the</strong> grade separation of FM 1626 is approximately $12.5million, which is more than two times <strong>the</strong> estimated cost of <strong>the</strong> grade separation.Grade Separation of FM 1660FM 1660 is currently a two-lane roadway that crosses <strong>the</strong> UP Austin Subdivision inWilliamson County in <strong>the</strong> city of Hut<strong>to</strong>. This roadway, with approximately 4,600vehicles crossing <strong>the</strong> railroad tracks daily, has been identified as a potentialcandidate for grade separation. The potential two-lane roadway overpass wouldseparate vehicular traffic from <strong>the</strong> Austin Subdivision. Due <strong>to</strong> <strong>the</strong> proximity of <strong>the</strong>intersection between FM 1660 and US 79 <strong>to</strong> <strong>the</strong> railroad, <strong>the</strong> mainlanes of US 79would need <strong>to</strong> be elevated <strong>to</strong> meet <strong>the</strong> FM 1660 overpass in order <strong>to</strong> maintainconnectivity between <strong>the</strong> roadways.A preliminary layout of <strong>the</strong> overpass is included in <strong>the</strong> figures in Appendix E, alongwith environmental constraints and adjacent property land uses. The constraintslocated in <strong>the</strong> vicinity of FM 1660 consist of adjacent commercial, industrial andresidential (single family and multi-family) properties. Access <strong>to</strong> adjacent propertiesalong FM 1660 south of <strong>the</strong> railroad would be would be eliminated; however, suchproperties would maintain access <strong>to</strong> o<strong>the</strong>r adjacent roadways as alternate routes.Access <strong>to</strong> adjacent properties along <strong>the</strong> identified lanes of US 79 would beeliminated and were accounted for in <strong>the</strong> cost estimate for <strong>the</strong> grade separation.The construction of access roads alongside <strong>the</strong> overpass may not be justified inorder <strong>to</strong> maintain adjacent property access due <strong>to</strong> right-of-way constraints that wouldrequire <strong>the</strong> construction of such access roads within <strong>the</strong> boundaries of adjacentproperties. The identified overpass would require <strong>the</strong> closure of Park Avenue at <strong>the</strong>9-12
<strong>San</strong> <strong>An<strong>to</strong>nio</strong> <strong>Region</strong> <strong>Freight</strong> <strong>Study</strong>Austin Districtintersection with US 79, resulting in <strong>the</strong> alternate routing of traffic <strong>to</strong> Jim Cage Road<strong>to</strong> access US 79.The grade separation of FM 1660 is estimated <strong>to</strong> cost $12.2 million. The estimatedpublic benefit calculated for <strong>the</strong> grade separation of FM 1660 is approximately $5.2million, which is approximately 42 percent of <strong>the</strong> estimated cost of <strong>the</strong> gradeseparation.Grade Separation of FM 685FM 685 is currently a four-lane roadway that crosses <strong>the</strong> UP Austin Subdivision inWilliamson County in <strong>the</strong> city of Hut<strong>to</strong>. This roadway, with approximately 12,200vehicles crossing <strong>the</strong> railroad tracks daily, has been identified as a potentialcandidate for grade separation. The potential four-lane roadway overpass wouldseparate vehicular traffic from <strong>the</strong> Austin Subdivision and would create a gradeseparated intersection with US 79. While <strong>the</strong> mainlanes of US 79 would remain atgrade,entrance and exit ramp lanes could be elevated <strong>to</strong> meet <strong>the</strong> elevated lanes ofFM 685 in order <strong>to</strong> minimize impacts <strong>to</strong> through-traffic on US 79.A preliminary layout of <strong>the</strong> overpass is included in <strong>the</strong> figures in Appendix E, alongwith environmental constraints and adjacent property land uses. The constraintslocated in <strong>the</strong> vicinity of FM 685 consist of adjacent industrial properties well asHut<strong>to</strong> High School. Access <strong>to</strong> adjacent properties along FM 685 north of <strong>the</strong> railroadcould be maintained via access roads alongside <strong>the</strong> grade separation that wouldprovide access at locations beyond <strong>the</strong> extent of <strong>the</strong> elevated lanes/ramp, where <strong>the</strong>existing lanes will remain at-grade. There are no properties currently accessing FM685 south of <strong>the</strong> railroad along <strong>the</strong> identified overpass. Access <strong>to</strong> adjacentproperties along <strong>the</strong> elevated entrance and exit ramps on US 79 should not beimpacted significantly by <strong>the</strong> identified grade separation.The grade separation of FM 685 is estimated <strong>to</strong> cost $13.5 million. The estimatedpublic benefit calculated for <strong>the</strong> grade separation of FM 685 is approximately $10.2million, which is approximately 76 percent of <strong>the</strong> estimated cost of <strong>the</strong> gradeseparation.Grade Separation of Guadalupe StreetGuadalupe Street is currently a two-lane roadway south of <strong>the</strong> railroad that widensin<strong>to</strong> a three-lane roadway north of <strong>the</strong> railroad that crosses <strong>the</strong> UP AustinSubdivision in Hays County in <strong>the</strong> city of <strong>San</strong> Marcos. This roadway, withapproximately 17,900 vehicles crossing <strong>the</strong> railroad tracks daily, has been identifiedas a potential candidate for grade separation. The potential two-lane roadwayoverpass would separate vehicular traffic from <strong>the</strong> Austin Subdivision.A preliminary layout of <strong>the</strong> overpass is included in <strong>the</strong> figures in Appendix E, alongwith environmental constraints and adjacent property land uses. The constraintslocated in <strong>the</strong> vicinity of Guadalupe Street consist of adjacent commercial andresidential property. Access <strong>to</strong> adjacent properties could be maintained via access9-13
<strong>San</strong> <strong>An<strong>to</strong>nio</strong> <strong>Region</strong> <strong>Freight</strong> <strong>Study</strong>Austin Districtroads alongside Guadalupe Street along with at-grade u-turns located beneath <strong>the</strong>overpass on each side of <strong>the</strong> railroad.The grade separation of Guadalupe Street is estimated <strong>to</strong> cost $6.5 million. Theestimated public benefit calculated for <strong>the</strong> grade separation of Guadalupe Street isapproximately $25.2 million, which is approximately 3.9 times <strong>the</strong> estimated cost of<strong>the</strong> grade separation.Grade Separation of IH-35 Frontage Roads and McNeil RdThe IH-35 frontage roads are currently three-lane roadways in each direction thatcross <strong>the</strong> UP Austin Subdivision ML 1 in Williamson County northwest of down<strong>to</strong>wnAustin. McNeil Road is a two-lane roadway in each direction that parallels <strong>the</strong>Austin Subdivision and crosses <strong>the</strong> IH-35 frontage roads as well as <strong>the</strong> CapitalMetro owned Central Subdivision rail line. The frontage roads, with a combined49,800 daily vehicles crossing <strong>the</strong> railroad tracks, have been identified as potentialcandidates for grade separation. The potential three-lane roadway underpass oneach side of IH-35 would separate vehicular traffic from <strong>the</strong> Austin Subdivision.McNeil Road is also identified as a potential underpass structure <strong>to</strong> separatevehicular traffic from <strong>the</strong> Capital Metro Central Subdivision and join <strong>the</strong> IH-35frontage roads for connectivity on <strong>the</strong> east-west direction.A preliminary layout of <strong>the</strong> underpass is included in Appendix E, along wi<strong>the</strong>nvironmental constraints and adjacent property land uses. Constraints in <strong>the</strong>vicinity of <strong>the</strong> IH-35 frontage roads and McNeil Road crossings consist of adjacentcommercial, industrial, and residential property. Access <strong>to</strong> adjacent properties couldbe maintained via access roads alongside <strong>the</strong> IH-35 frontage roads along with atgradeu-turns located beneath <strong>the</strong> existing IH-35 mainlanes overpass and above <strong>the</strong>identified potential underpass frontage lanes on each side of <strong>the</strong> railroad. Additionalaccess roads on <strong>the</strong> northwest quadrant would be needed for vehicles <strong>to</strong> access <strong>the</strong>southbound IH-35 frontage road.The grade separation of <strong>the</strong> IH-35 frontage roads and McNeil Road is estimated <strong>to</strong>cost $20.7 million with an estimated public benefit of $51.9 million, which is morethan 2.3 times <strong>the</strong> estimated cost of <strong>the</strong> grade separation.Grade Separation of Kohler’s Crossing/ CR 171County Road (CR) 171 is currently a two-lane roadway that crosses <strong>the</strong> UP AustinSubdivision in Hays County in <strong>the</strong> city of Kyle. This roadway, with approximately7,200 vehicles crossing <strong>the</strong> railroad tracks daily, has been identified as a potentialcandidate for grade separation. The potential two-lane roadway overpass wouldseparate vehicular traffic from <strong>the</strong> Austin Subdivision.A preliminary layout of <strong>the</strong> overpass is included in <strong>the</strong> figures in Appendix E. Theproperty adjacent <strong>to</strong> <strong>the</strong> identified grade separation consists of agricultural land withno direct access or connecting roadways <strong>to</strong> CR 171 along <strong>the</strong> identified location of9-14
<strong>San</strong> <strong>An<strong>to</strong>nio</strong> <strong>Region</strong> <strong>Freight</strong> <strong>Study</strong>Austin District<strong>the</strong> overpass. As a result, access <strong>to</strong> adjacent properties should not be impacted by<strong>the</strong> grade separation, and since <strong>the</strong> overpass may be able <strong>to</strong> be constructed inside<strong>the</strong> existing right-of-way of <strong>the</strong> roadway, no additional right-of-way would need <strong>to</strong> beacquired.The grade separation of CR 171 is estimated <strong>to</strong> cost $5 million. The estimatedpublic benefit calculated for <strong>the</strong> grade separation of CR 171 is approximately $5.2million, which is three percent greater than <strong>the</strong> estimated cost of <strong>the</strong> gradeseparation.Grade Separation of LBJ DriveLBJ Drive is currently a two-lane roadway south of <strong>the</strong> railroad that widens in<strong>to</strong> athree-lane roadway north of <strong>the</strong> railroad that crosses <strong>the</strong> UP Austin Subdivision inHays County in <strong>the</strong> city of <strong>San</strong> Marcos. This roadway, with approximately 16,500vehicles crossing <strong>the</strong> railroad tracks daily, has been identified as a potentialcandidate for grade separation. The potential two-lane roadway overpass wouldseparate vehicular traffic from <strong>the</strong> Austin Subdivision.A preliminary layout of <strong>the</strong> overpass is included in <strong>the</strong> figures in Appendix E, alongwith environmental constraints and adjacent property land uses. The constraintslocated in <strong>the</strong> vicinity of LBJ Drive consist of adjacent commercial and residentialproperty. Access <strong>to</strong> adjacent properties could be maintained via access roadsalongside LBJ Drive along with at-grade u-turns located beneath <strong>the</strong> overpass oneach side of <strong>the</strong> railroad.The grade separation of LBJ Drive is estimated <strong>to</strong> cost $7 million. The estimatedpublic benefit calculated for <strong>the</strong> grade separation of LBJ Drive is approximately$22.1 million, which is approximately 3.2 times <strong>the</strong> estimated cost of <strong>the</strong> gradeseparation.Grade Separation of Mat<strong>the</strong>ws LaneMat<strong>the</strong>ws Lane is currently a two-lane roadway that crosses <strong>the</strong> UP AustinSubdivision in Travis County in <strong>the</strong> city of Austin. This roadway, with approximately5,700 vehicles crossing <strong>the</strong> railroad tracks daily, has been identified as a potentialcandidate for grade separation. The potential two-lane roadway underpass wouldseparate vehicular traffic from <strong>the</strong> Austin Subdivision.A preliminary layout of <strong>the</strong> underpass is included in <strong>the</strong> figures in Appendix E, alongwith environmental constraints and adjacent property land uses. The constraintslocated in <strong>the</strong> vicinity of Mat<strong>the</strong>ws Lane consist of adjacent residential property.Access <strong>to</strong> adjacent properties east of <strong>the</strong> railroad could be maintained via accessroads alongside Mat<strong>the</strong>ws Lane along with an at-grade u-turn located above <strong>the</strong>underpass on <strong>the</strong> east side of <strong>the</strong> railroad. Access <strong>to</strong> properties directly adjacent <strong>to</strong><strong>the</strong> identified underpass structure west of <strong>the</strong> railroad would be eliminated, and <strong>the</strong>cost of such properties was included in <strong>the</strong> cost estimate for <strong>the</strong> grade separation.9-15
<strong>San</strong> <strong>An<strong>to</strong>nio</strong> <strong>Region</strong> <strong>Freight</strong> <strong>Study</strong>Austin DistrictThe grade separation of Mat<strong>the</strong>ws Lane is estimated <strong>to</strong> cost $11.6 million. Theestimated public benefit calculated for <strong>the</strong> grade separation of Mat<strong>the</strong>ws Lane isapproximately $4.5 million, which is approximately 39 percent of <strong>the</strong> estimated cos<strong>to</strong>f <strong>the</strong> grade separation.Grade Separation of North Loop 4 (North Main Street)North Loop 4 is currently a two-lane road that crosses <strong>the</strong> UP Austin Subdivision inHays County in <strong>the</strong> city of Buda. This roadway, with approximately 13,300 vehiclescrossing <strong>the</strong> railroad tracks daily, has been identified as a potential candidate forgrade separation. The potential two-lane roadway overpass would separatevehicular traffic from <strong>the</strong> Austin Subdivision.A preliminary layout of <strong>the</strong> overpass is included in <strong>the</strong> figures in Appendix E, alongwith environmental constraints and adjacent property land uses. The constraintslocated in <strong>the</strong> vicinity of North Loop 4 consist of adjacent commercial and residentialproperty. Access <strong>to</strong> adjacent properties could be maintained via access roadsalongside North Loop 4. An at-grade u-turn could be provided on <strong>the</strong> east side of<strong>the</strong> railroad with a roadway connecting <strong>the</strong> north side access road <strong>to</strong> Railroad Streetbeneath <strong>the</strong> overpass. A roadway connecting Garison Road <strong>to</strong> North Main Streetcould be provided underneath <strong>the</strong> overpass on <strong>the</strong> west side.The grade separation of North Loop 4 is estimated <strong>to</strong> cost $6.4 million. Theestimated public benefit calculated for <strong>the</strong> grade separation of North Loop 4 isapproximately $10.7 million, which is approximately 68 percent greater than <strong>the</strong>estimated cost of <strong>the</strong> grade separation.Grade Separation of South Loop 4 (South Main Street)South Loop 4 is currently a two-lane road that crosses <strong>the</strong> UP Austin Subdivision inHays County in <strong>the</strong> city of Buda. This roadway, with approximately 13,400 vehiclescrossing <strong>the</strong> railroad tracks daily, has been identified as a potential candidate forgrade separation. The potential two-lane roadway overpass would separatevehicular traffic from <strong>the</strong> Austin Subdivision.A preliminary layout of <strong>the</strong> overpass is included in <strong>the</strong> figures in Appendix E, alongwith environmental constraints and adjacent property land uses. The constraintslocated in <strong>the</strong> vicinity of South Loop 4 consist of adjacent commercial, agriculturaland residential property. Access <strong>to</strong> adjacent properties could be maintained viaaccess roads alongside South Loop 4. An at-grade u-turn could be provided on <strong>the</strong>west side of South Loop 4. A roadway connecting <strong>the</strong> south access road of SouthLoop 4 could be provided underneath <strong>the</strong> overpass along with an at-grade u-turn.The grade separation of South Loop 4 is estimated <strong>to</strong> cost $5.2 million. Theestimated public benefit calculated for <strong>the</strong> grade separation of South Loop 4 isapproximately $10.9 million, which is approximately 2.1 times <strong>the</strong> estimated cost of<strong>the</strong> grade separation.9-16
<strong>San</strong> <strong>An<strong>to</strong>nio</strong> <strong>Region</strong> <strong>Freight</strong> <strong>Study</strong>Austin DistrictGrade Separation of Ol<strong>to</strong>rf StreetOl<strong>to</strong>rf Street is currently a four-lane road that crosses <strong>the</strong> UP Austin Subdivision inTravis County in <strong>the</strong> city of Austin. This roadway, with approximately 16,800vehicles crossing <strong>the</strong> railroad tracks daily, has been identified as a potentialcandidate for grade separation. The potential four-lane roadway overpass wouldseparate vehicular traffic from <strong>the</strong> Austin Subdivision.A preliminary layout of <strong>the</strong> overpass is included in <strong>the</strong> figures in Appendix E, alongwith environmental constraints and adjacent property land uses. The constraintslocated in <strong>the</strong> vicinity of Ol<strong>to</strong>rf Street consist of adjacent commercial, industrial andresidential property. Access <strong>to</strong> adjacent properties could be maintained via accessroads alongside Ol<strong>to</strong>rf Street along with at-grade u-turns located beneath <strong>the</strong>overpass on each side of <strong>the</strong> railroad.The grade separation of Ol<strong>to</strong>rf Street is estimated <strong>to</strong> cost $12.3 million. Theestimated public benefit calculated for <strong>the</strong> grade separation of Ol<strong>to</strong>rf Street isapproximately $11.8 million, which is approximately 96 percent of <strong>the</strong> estimated cos<strong>to</strong>f <strong>the</strong> grade separation.Grade Separation of Quick Hill Road/ CR 172Quick Hill Road is currently a four-lane roadway that crosses <strong>the</strong> UP AustinSubdivision in Williamson County in <strong>the</strong> city of Round Rock. This roadway, withapproximately 11,400 vehicles crossing <strong>the</strong> railroad tracks daily, has been identifiedas a potential candidate for grade separation. The potential four-lane roadwayoverpass would separate vehicular traffic from <strong>the</strong> Austin Subdivision.A preliminary layout of <strong>the</strong> overpass is included in <strong>the</strong> figures in Appendix E, alongwith environmental constraints and adjacent property land uses. The constraintslocated in <strong>the</strong> vicinity of Quick Hill Road consist of adjacent commercial, residential,and industrial property as well as a school located a few blocks away. Access <strong>to</strong>adjacent properties along Quick Hill Road could be maintained via access roadsalongside <strong>the</strong> grade separation along with an at-grade u-turn located beneath <strong>the</strong>overpass east of <strong>the</strong> railroad.Due <strong>to</strong> <strong>the</strong> close proximity of <strong>the</strong> intersection between Quick Hill Road and McNeilRoad <strong>to</strong> <strong>the</strong> railroad, <strong>the</strong> lanes of McNeil Road would also need <strong>to</strong> be elevated <strong>to</strong>meet <strong>the</strong> Quick Hill Road overpass lanes. The residential properties adjacent <strong>to</strong>McNeil Road along <strong>the</strong> identified grade separated lanes do not currently have directaccess or any connecting roadways <strong>to</strong> McNeil Road. As a result, access <strong>to</strong> adjacentproperties should not be impacted by <strong>the</strong> grade separation.The grade separation of Quick Hill Road is estimated <strong>to</strong> cost $14.3 million. Theestimated public benefit calculated for <strong>the</strong> grade separation of Quick Hill Road isapproximately $9.3 million, which is approximately 65 percent of <strong>the</strong> estimated cos<strong>to</strong>f <strong>the</strong> grade separation.9-17
<strong>San</strong> <strong>An<strong>to</strong>nio</strong> <strong>Region</strong> <strong>Freight</strong> <strong>Study</strong>Austin DistrictGrade Separation of Red Bud LaneRed Bud Lane is currently a two-lane roadway that crosses <strong>the</strong> UP AustinSubdivision in Williamson County in <strong>the</strong> city of Round Rock. This roadway, withapproximately 6,200 vehicles crossing <strong>the</strong> railroad tracks daily, has been identifiedas a potential candidate for grade separation. The potential two-lane roadwayoverpass would separate vehicular traffic from <strong>the</strong> Austin Subdivision and wouldcreate a grade separated intersection with US 79. While <strong>the</strong> mainlanes of US 79would remain at-grade, entrance and exit ramp lanes could be elevated <strong>to</strong> meet <strong>the</strong>elevated lanes of Red Bud Lane.A preliminary layout of <strong>the</strong> overpass is included in <strong>the</strong> figures in Appendix E, alongwith environmental constraints and adjacent property land uses. The constraintslocated in <strong>the</strong> vicinity of Red Bud Lane consist of adjacent residential andcommercial property, including a large retail s<strong>to</strong>re. Access <strong>to</strong> adjacent propertiescould be maintained via access roads alongside S<strong>to</strong>ney Point Road (a continuationof Red Bud Lane north of <strong>the</strong> railroad) along with an at-grade u-turn located beneath<strong>the</strong> overpass on <strong>the</strong> north side of <strong>the</strong> railroad. There are minimal propertiescurrently accessing Red Bud Lane south of <strong>the</strong> railroad, <strong>the</strong>reby not justifying <strong>the</strong>cost of access roads alongside <strong>the</strong> overpass. However, any properties with accesseliminated by <strong>the</strong> overpass would need <strong>to</strong> be provided an alternative access route(as shown in <strong>the</strong> layout) or accounted for in <strong>the</strong> cost estimate of <strong>the</strong> gradeseparation. Access <strong>to</strong> adjacent properties along <strong>the</strong> elevated entrance and exitramps on US 79 should not be impacted significantly by <strong>the</strong> identified gradeseparation.The grade separation of Red Bud Lane is estimated <strong>to</strong> cost $14 million. Theestimated public benefit calculated for <strong>the</strong> grade separation of Red Bud Lane isapproximately $4.8 million, which is approximately 34 percent of <strong>the</strong> estimated cos<strong>to</strong>f <strong>the</strong> grade separation.Grade Separation of Stassney LaneStassney Lane is currently a four-lane roadway that crosses <strong>the</strong> UP AustinSubdivision in Travis County in <strong>the</strong> city of Austin. This roadway, with approximately25,000 vehicles crossing <strong>the</strong> railroad tracks daily, has been identified as a potentialcandidate for grade separation. The potential four-lane roadway overpass wouldseparate vehicular traffic from <strong>the</strong> Austin Subdivision.A preliminary layout of <strong>the</strong> overpass is included in <strong>the</strong> figures in Appendix E, alongwith environmental constraints and adjacent property land uses. The constraintslocated in <strong>the</strong> vicinity of Stassney Lane consist of adjacent commercial property aswell as Crockett High School located at <strong>the</strong> corner of Manchaca Road and StassneyLane. Access <strong>to</strong> adjacent properties could be maintained via access roadsalongside Stassney Lane along with at-grade u-turns located beneath <strong>the</strong> overpasson each side of <strong>the</strong> railroad.9-18
<strong>San</strong> <strong>An<strong>to</strong>nio</strong> <strong>Region</strong> <strong>Freight</strong> <strong>Study</strong>Austin DistrictThe grade separation of Stassney Lane is estimated <strong>to</strong> cost $8.2 million. Theestimated public benefit calculated for <strong>the</strong> grade separation of Stassney Lane isapproximately $19.6 million, which is approximately 2.4 times <strong>the</strong> estimated cost of<strong>the</strong> grade separation.Grade Separation of Wonder World DriveWonder World Drive is currently a two-lane road that crosses <strong>the</strong> UP AustinSubdivision in Hays County in <strong>the</strong> city of <strong>San</strong> Marcos. This roadway, withapproximately 13,900 vehicles crossing <strong>the</strong> railroad tracks daily, has been identifiedas a potential candidate for grade separation. The potential two-lane roadwayoverpass would separate vehicular traffic from <strong>the</strong> Austin Subdivision.A preliminary layout of <strong>the</strong> overpass is included in <strong>the</strong> figures in Appendix E, alongwith environmental constraints and adjacent property land uses. The constraintslocated in <strong>the</strong> vicinity of Wonder World Drive consist of adjacent commercial,industrial and public property. Access <strong>to</strong> adjacent properties could be maintainedvia access roads alongside Wonder World Drive along with at-grade u-turns locatedbeneath <strong>the</strong> overpass on each side of <strong>the</strong> railroad.The grade separation of Wonder World Drive is estimated <strong>to</strong> cost $8.2 million. Theestimated public benefit calculated for <strong>the</strong> grade separation of Wonder World Driveis approximately $17.4 million, which is approximately 2.1 times <strong>the</strong> estimated cos<strong>to</strong>f <strong>the</strong> grade separation.Crossing ClosuresCrossing Closure of Peach StreetPeach Street is currently a two-lane roadway that crosses <strong>the</strong> railroad at-grade inHays County in <strong>the</strong> city of Buda. Approximately 600 vehicles cross <strong>the</strong> UP at thislocation daily. Peach Street should be considered for closure at <strong>the</strong> intersection with<strong>the</strong> UP Austin Subdivision in order <strong>to</strong> reduce public safety hazards currentlyassociated with <strong>the</strong> existing at-grade crossing.The location of <strong>the</strong> potential crossing closure as well as <strong>the</strong> alternative routes,associated distances, environmental constraints, and adjacent land uses areidentified in Appendix E. Constraints located in <strong>the</strong> vicinity of this street consistprimarily of residential properties as well as a nearby fire station. Access <strong>to</strong> adjacentproperties could be maintained via <strong>the</strong> existing roadway network. Traffic could bererouted from <strong>the</strong> potential crossing closures <strong>to</strong> North Main Street, which is includedin this report as a potential grade separation, <strong>to</strong> cross <strong>the</strong> railroad.The potential crossing closures is estimated <strong>to</strong> cost $50,000 with an estimated publicbenefit of $260,000.9-19
<strong>San</strong> <strong>An<strong>to</strong>nio</strong> <strong>Region</strong> <strong>Freight</strong> <strong>Study</strong>Austin DistrictCrossing Closure of West Mary StreetMary Street is currently a two-lane roadway that crosses <strong>the</strong> railroad at-grade inTravis County in <strong>the</strong> city of Austin. Approximately 3,900 vehicles cross <strong>the</strong> UP at thislocation daily. Mary Street should be considered for closure at <strong>the</strong> intersection with<strong>the</strong> UP Austin Subdivision in order <strong>to</strong> reduce public safety hazards currentlyassociated with <strong>the</strong> existing at-grade crossing.The location of <strong>the</strong> potential crossing closure as well as <strong>the</strong> alternative routes,associated distances, environmental constraints, and adjacent land uses areidentified in Appendix E. Constraints located in <strong>the</strong> vicinity of this street consistprimarily of commercial and residential properties. Access <strong>to</strong> adjacent propertiescould be maintained via <strong>the</strong> existing roadway network. Traffic could be reroutedfrom <strong>the</strong> potential crossing closures <strong>to</strong> Ol<strong>to</strong>rf Street, which is included in this reportas a potential grade separation, <strong>to</strong> cross <strong>the</strong> railroad.The potential crossing closures is estimated <strong>to</strong> cost $50,000 with an estimated publicbenefit of $2.5 million.Crossing Closure of Jim Cage RdJim Cage Road is currently a two-lane roadway that crosses <strong>the</strong> railroad at-grade inWilliamson County in <strong>the</strong> city of Hut<strong>to</strong>. Approximately 600 vehicles cross <strong>the</strong> UP atthis location daily. Jim Cage Road should be considered for closure at <strong>the</strong>intersection with <strong>the</strong> UP Austin Subdivision in order <strong>to</strong> reduce public safety hazardscurrently associated with <strong>the</strong> existing at-grade crossing.The location of <strong>the</strong> potential crossing closure as well as <strong>the</strong> alternative routes,associated distances, environmental constraints, and adjacent land uses areidentified in Appendix E. Constraints located in <strong>the</strong> vicinity of this street consistprimarily of residential properties as well as a nearby fire station and school. Access<strong>to</strong> adjacent properties could be maintained via <strong>the</strong> existing roadway network. Trafficcould be rerouted from <strong>the</strong> potential crossing closures <strong>to</strong> FM 1660, which is includedin this report as a potential grade separation, <strong>to</strong> cross <strong>the</strong> railroad.The potential crossing closures is estimated <strong>to</strong> cost $50,000 with an estimated publicbenefit of $330,000.Crossing Closure of Sloan StSloan Street is currently a two-lane roadway that crosses <strong>the</strong> railroad at-grade inWilliamson County in <strong>the</strong> city of Taylor. Approximately 600 vehicles cross <strong>the</strong> UP atthis location daily. Sloan Street should be considered for closure at <strong>the</strong> intersectionwith <strong>the</strong> UP Austin Subdivision in order <strong>to</strong> reduce public safety hazards currentlyassociated with <strong>the</strong> existing at-grade crossing.The location of <strong>the</strong> potential crossing closure as well as <strong>the</strong> alternative routes andassociated distances are identified in Appendix E. Access <strong>to</strong> adjacent propertiescould be maintained via <strong>the</strong> existing roadway network. Traffic could be rerouted9-20
<strong>San</strong> <strong>An<strong>to</strong>nio</strong> <strong>Region</strong> <strong>Freight</strong> <strong>Study</strong>Austin Districtfrom <strong>the</strong> potential crossing closures <strong>to</strong> US, which is an existing grade separation, <strong>to</strong>cross <strong>the</strong> railroad.The potential crossing closures is estimated <strong>to</strong> cost $50,000 with an estimated publicbenefit of $270,000.Possible Austin BypassWhile a precise location of a possible Austin bypass has not been identified,conceptual alternatives have been developed in order <strong>to</strong> obtain order of magnitudeestimates for mileage, necessary bridge structures, and roadway-rail crossing gradeseparations. While every roadway that may cross <strong>the</strong> possible bypass was notevaluated, eight roadways were identified that may warrant consideration for gradeseparation in <strong>the</strong> event that an Austin bypass is constructed. This analysis wasconceptual in nature and did not include detailed cost estimates. The cost estimatesshown in Table 9-8 are order of magnitude estimates based on <strong>the</strong> number of lanesof <strong>the</strong> roadway and <strong>the</strong> general level of complexity of <strong>the</strong> crossing.Street Name City Name AADTEstimatedCost20-YearBenefit (2007Benfit/ CostRatiodollars)SH 80 Prairie Lea 5,300 $8,000,000 $2,720,000 0.34US HWY 183 Lockhart 14,900 $6,000,000 $9,530,000 1.59FM 20 Lockhart 5,500 $6,000,000 $2,820,000 0.47FM 812 Cedar Creek 4,600 $8,000,000 $2,190,000 0.27SH 21 Cedar Creek 8,200 $8,000,000 $3,960,000 0.50SH 71 Cedar Creek 28,700 $12,000,000 $15,070,000 1.26US HWY 290 Littig 26,700 $12,000,000 $13,600,000 1.13SH 95 (Main Street) Taylor 6,300 $8,000,000 $2,960,000 0.37Total:$68,000,000 $52,850,000 0.78Table 9-8: Possible Austin Bypass Grade Separations9-21
<strong>San</strong> <strong>An<strong>to</strong>nio</strong> <strong>Region</strong> <strong>Freight</strong> <strong>Study</strong>MethodologySECTION 10: EVALUATION METHODOLOGYThe improvements selected <strong>to</strong> be analyzed were based on <strong>the</strong> results of both freightrail operations modeling (RTC) and truck freight movement modeling (SAM), and areintended <strong>to</strong> improve freight movement efficiency. Additional improvements and/orrecommendations were received from various discussions with stakeholder groups,such as <strong>the</strong> UP, <strong>the</strong> BNSF, <strong>the</strong> Austin-<strong>San</strong> <strong>An<strong>to</strong>nio</strong> Intermunicipal Commuter RailDistrict, <strong>the</strong> Port Authority of <strong>San</strong> <strong>An<strong>to</strong>nio</strong>, <strong>the</strong> <strong>San</strong> <strong>An<strong>to</strong>nio</strong> TransportationAssociation, <strong>the</strong> <strong>San</strong> <strong>An<strong>to</strong>nio</strong> Mobility Coalition, <strong>the</strong> <strong>San</strong> <strong>An<strong>to</strong>nio</strong> Chamber ofCommerce, and discussions with <strong>San</strong> <strong>An<strong>to</strong>nio</strong> Mayor Hardberger and Bexar CountyJudge Wolff.The potential improvements determined from <strong>the</strong> sources listed above have beenanalyzed <strong>to</strong> determine <strong>the</strong> effects on efficiency, mobility, and safety for both railoperations as well as vehicular and pedestrian traffic in <strong>the</strong> <strong>San</strong> <strong>An<strong>to</strong>nio</strong> region. Thisanalysis began with <strong>the</strong> identification of <strong>the</strong> existing conditions, and includedestimates of <strong>the</strong> construction cost, estimated implementation timeframe, andestimated public and private benefits for <strong>the</strong> identified improvements.The existing conditions for <strong>the</strong> locations of potential improvements incorporated areview of property land uses and estimated values, environmental constraints, trafficflow volumes for both vehicular and rail traffic, and traffic accident statistics.The estimated costs for each improvement are order of magnitude costs that weredetermined based on preliminary planning. The costs included in this studyrepresent an estimate of probable costs prepared in good faith and with reasonablecare. The study team has no control over <strong>the</strong> costs of construction labor, materials,or equipment, nor over competitive bidding or negotiating methods and does notmake any commitment or assume any duty <strong>to</strong> assure that bids or negotiated priceswill not vary from <strong>the</strong>se estimates. The costs are subject <strong>to</strong> inflation and in somecases are calculated using county appraisal district values for right-of-wayacquisition, which may vary from <strong>the</strong> actual cost of property acquisition.The implementation timeframe for each improvement was estimated based on <strong>the</strong>additional analysis, design, environmental mitigation, and funding that would berequired prior <strong>to</strong> implementation. Improvement classifications based onimplementation timeframes were determined for <strong>the</strong> potential improvements andhave been classified at this time in<strong>to</strong> <strong>the</strong> following categories:1. Level 1 Improvement - Identified near-term railroad improvements2. Level 2 Improvement - Identified mid-range railroad improvements3. Level 3 Improvement - All grade crossing closures and separations4. Level 4 Improvement - Identified long-range improvements such as doubletracking of or adding infrastructure capacity <strong>to</strong> existing line segments5. Level 5 Improvement - Identified long-range improvements such as possiblenew corridors/bypass routes10-1
<strong>San</strong> <strong>An<strong>to</strong>nio</strong> <strong>Region</strong> <strong>Freight</strong> <strong>Study</strong>MethodologyPublic BenefitsAnticipated public benefits of <strong>the</strong> potential improvements include reducedimpedance at roadway-rail grade crossings, benefits associated with <strong>the</strong> potential forimplementation of a commuter rail system, and property tax revenue benefits.Grade Crossing ImpedanceThe costs related <strong>to</strong> <strong>the</strong> interaction of vehicular and train traffic at roadway-railroadcrossings was evaluated and public benefits associated with identified improvementswithin <strong>the</strong> 12-county <strong>San</strong> <strong>An<strong>to</strong>nio</strong> region as well as <strong>the</strong> Austin Subdivision throughHays, Travis, and Williamson Counties were estimated. This analysis includedcalculating changes in vehicle emission volumes, delay times, operating costs, andaccident costs directly related <strong>to</strong> trains blocking roadway crossings. Public benefitsof identified railroad infrastructure improvements and grade crossing improvementssuch as crossing closures or <strong>the</strong> construction of grade separation structures wereestimated as <strong>the</strong> reduction of <strong>the</strong> public cost burden associated with <strong>the</strong> existing atgradecrossings in <strong>the</strong> region.As Figure 10-1 illustrates, <strong>the</strong> grade crossing analysis model was developed bycollecting railroad and roadway data that characterize existing conditions at morethan 600 existing at-grade crossings in <strong>the</strong> study region. Railroad input dataincluded daily train volumes, average train lengths and speeds, and <strong>the</strong> number oftracks at each crossing. Roadway input data included average daily traffic, vehicleclassification type, number of lanes, and accident his<strong>to</strong>ry. These parameters wereused <strong>to</strong> calculate a base cost associated with train-vehicle interactions underexisting conditions as prescribed by <strong>the</strong> Federal Railroad Administration (FRA).The model measured <strong>the</strong> impact of specific infrastructure planning cases bycalculating a second set of results that reflected proposed network modifications.New railroad train volumes and speeds were incorporated in<strong>to</strong> <strong>the</strong> model based onRTC simulation of <strong>the</strong> modified <strong>San</strong> <strong>An<strong>to</strong>nio</strong> network. This approach allowed for <strong>the</strong>public benefit of each planning case <strong>to</strong> be measured as a reduction in <strong>the</strong> <strong>to</strong>tal cos<strong>to</strong>f <strong>the</strong> base case (no-build network).10-2
<strong>San</strong> <strong>An<strong>to</strong>nio</strong> <strong>Region</strong> <strong>Freight</strong> <strong>Study</strong>MethodologyDataRailroad DataDaily Train VolumesTrain Characteristics• Length• SpeedNumber of TracksWarning DeviceRoadway DataDaily Traffic VolumesVehicle ClassificationNumber of Lanes5-Year AccidentHis<strong>to</strong>ryModel DevelopmentEmissionsIdling EmissionRatesDelayTotal Delay perDayTrain Related CrossingDelayVehicle Arrival RateOperatingCostsIdling Burn Rates• Fuel• OilAccidentsPredictedFatalitiesPredicted InjuriesResultsEmissionsCarbon Monoxide(CO)Hydrocarbons (HC)Nitrous Oxides (NO x )DelayMo<strong>to</strong>rist Delay(hours)OperatingCostFuel Cost• Diesel• GasolineOil CostAccidentCostsFatalitiesInjuryProperty DamageFigure 10-1: Procedure Flow Chart10-3
<strong>San</strong> <strong>An<strong>to</strong>nio</strong> <strong>Region</strong> <strong>Freight</strong> <strong>Study</strong>MethodologyRailroad and roadway data specific <strong>to</strong> each at-grade roadway-railroad crossingwithin <strong>the</strong> <strong>San</strong> <strong>An<strong>to</strong>nio</strong> District, shown in Figure 10-2, were obtained through TxDOT,Bexar County Metropolitan Planning Organization, and <strong>the</strong> FRA. Figure 10-3 shows<strong>the</strong> at-grade crossings along <strong>the</strong> Austin Subdivision north of <strong>the</strong> <strong>San</strong> <strong>An<strong>to</strong>nio</strong> Districtin Hays, Travis, and Williamson Counties.htu 290 %&'(tu 35290tu 87 tu 281SAN MARCOShtu 83 tu 87NEW BRAUNFELShSEGUINhtu 90SAN ANTONIOh%&'( 35HONDO CASTROVILLEh tu 90 h %&'( 410DEVINEhtu 281tu 57 tu 59tutu 377 290 tu 183 tu%&'( 9010tu 183tu 90Atu 87tu 277 LEGENDALL OTHER RAILROADStu tu 181 BNSF tu 83 83KCStuTXPF281UP%&'( 35 %&'(37!(Grade Crossings<strong>San</strong> <strong>An<strong>to</strong>nio</strong> DistrictEtu 81 tu 281A tu 77tu183PFigure 10-2: Grade Crossing Locations within <strong>the</strong> <strong>San</strong> <strong>An<strong>to</strong>nio</strong> District10-4
<strong>San</strong> <strong>An<strong>to</strong>nio</strong> <strong>Region</strong> <strong>Freight</strong> <strong>Study</strong>MethodologyFigure 10-3: Public Grade Crossing Locations along <strong>the</strong> Austin Subdivision in Hays,Travis, and Williamson CountiesThe model calculated annual public costs incurred at each at-grade crossing due <strong>to</strong>train-vehicle interactions. Public costs were estimated for vehicle emission volumes,delay times, operating costs, and accidents. The model projected <strong>the</strong>se current yearcosts over a 20-year project duration based on a 2.75 percent annual rate of growthin both vehicle traffic and train volumes.Vehicular delay within <strong>the</strong> study area occurs when grade crossings are occupied byone of three distinct train classes: freight trains, switching trains, or passenger trains.The estimated train length of each train class was matched with a representativetrain speed <strong>to</strong> determine <strong>the</strong> average grade crossing block time per train. Theseblock times were multiplied by <strong>the</strong> average number of daily trains per class, <strong>the</strong>naggregated <strong>to</strong> yield an average crossing block time per day for each crossing withina rail subdivision. Corresponding train volumes were generated by <strong>the</strong> RTCsimulation, which emulated existing train operations in <strong>the</strong> study area.Average vehicle arrival rates were calculated by aggregating data specific <strong>to</strong> threevehicle classes: passenger cars, busses, and trac<strong>to</strong>r-trailer trucks. Equivalent10-5
<strong>San</strong> <strong>An<strong>to</strong>nio</strong> <strong>Region</strong> <strong>Freight</strong> <strong>Study</strong>Methodologypassenger car equivalency rates were used <strong>to</strong> aggregate arrival rates of eachvehicle class at grade crossings blocked by trains in order <strong>to</strong> translate <strong>the</strong> data in<strong>to</strong>estimates of vehicle delay per occupied crossing.Emission costs were measured as <strong>the</strong> volume changes in carbon monoxide (CO),hydrocarbon (HC), and nitrous oxide (NO x ) produced by vehicles while idling atblocked crossings. Decreases in emissions during deceleration and increases inemissions during acceleration were not considered, resulting in a conservative <strong>to</strong>talcost estimate. Emission costs per crossing closure were estimated by multiplyingaverage idle time, <strong>the</strong> number of trains per day; and idle emission rates specific <strong>to</strong>each vehicle class <strong>to</strong> yield <strong>to</strong>tal CO, HC, and NO x emissions. Finally, <strong>the</strong> publiccost, or environmental impact, of <strong>the</strong>se emissions was calculated by multiplying <strong>the</strong>emission volumes by <strong>the</strong> respective unit cost of each pollutant.Operating costs measure <strong>the</strong> extra fuel and oil consumed by vehicles delayed at arailroad crossing. As with delay calculations, <strong>the</strong>se operating costs were basedstrictly on vehicle idle times and did not include <strong>the</strong> consumption of fuel and oildirectly related <strong>to</strong> vehicular deceleration and acceleration. Vehicle idle times at eachblocked crossing were converted <strong>to</strong> operating costs by multiplying <strong>the</strong>se estimatesby <strong>the</strong> burn rates and average costs of both fuel and oil.The severity of predicted accidents at each grade crossing was estimated usingDepartment of Transportation (DOT) formulas adopted by <strong>the</strong> FRA. The assumptionof vehicle accident rates were based on warning device type, numbers of trains,number of tracks, number of roadway lanes, roadway surface condition, vehicletraffic volumes, and five-year crash his<strong>to</strong>ries. The predicted numbers of accidentswere incorporated in<strong>to</strong> DOT formulas that estimate fatality, injury-only, and propertydamage-only rates. These rates were <strong>the</strong>n multiplied by <strong>the</strong> cost of each accidenttype as reported in <strong>the</strong> 2005 National Safety Council statistics.The anticipated 20-year costs were used <strong>to</strong> assess <strong>the</strong> benefit of using gradecrossing closures and <strong>the</strong> construction of grade separation structures as potential atgradecrossing improvements. Since only 30 percent of traffic can be expected <strong>to</strong>re-route <strong>to</strong> a grade separation following a grade crossing closure, vehicle impedancecosts were also assumed <strong>to</strong> decrease by only 30 percent as a result of this remedialmeasure. The remaining 70 percent of traffic was assumed <strong>to</strong> re-route <strong>to</strong> adjacentat-grade crossings. On <strong>the</strong> o<strong>the</strong>r hand, <strong>the</strong> installation of a grade separationstructure was obviously assumed <strong>to</strong> reduce impedance costs by 100 percent.The Net Present Value shown as <strong>the</strong> public benefit is <strong>the</strong> cumulative projected costburdenover a 20 year period. Net present value (NPV) is a standard method forfinancial evaluation of long-term projects. The NPV is <strong>the</strong> value of <strong>the</strong> improvementprojected 20 years in<strong>to</strong> <strong>the</strong> future in terms of <strong>to</strong>day’s dollars. This can be assessedas <strong>the</strong> savings associated with a grade separation or, as traffic levels change withchanges <strong>to</strong> roadways and rail, <strong>the</strong> net savings <strong>to</strong> <strong>the</strong> public of each improvement10-6
<strong>San</strong> <strong>An<strong>to</strong>nio</strong> <strong>Region</strong> <strong>Freight</strong> <strong>Study</strong>Methodologybeing evaluated. The calculated values of public cost burdens associated with eachroadway-rail crossing in <strong>the</strong> region can be found in Appendix G.Locomotive EmissionsThe diversion of through trains <strong>to</strong> a bypass will modify <strong>the</strong> run time and delay time ofexisting rail operations due <strong>to</strong> changes in travel distance, network capacity, andoperating speeds. The results of RTC simulation were used <strong>to</strong> translate <strong>the</strong>sechanges in run time and delay time <strong>to</strong> an expected change in locomotive emissions.Table 10-1 lists emission rates for hydrocarbons (HC), carbon monoxide (CO),nitrous oxides (NOx), and particulate matter (PM) according <strong>to</strong> each throttle positionof a locomotive. 1ThrottlePositionHC(g/hr)CO(g/hr)NO x(g/hr)PM 10(g/hr)Brake 1400 1849 1335 622Idle 478 492 309 2281 226 361 1299 1312 192 464 3000 1403 361 1197 7267 4274 294 2772 14014 3365 595 3895 25584 3486 748 5872 33600 4997 826 3302 39766 5858 984 3034 47027 697Table 10-1: Locomotive Emissions per Throttle Position.Scientific studies have valued <strong>the</strong> cost of emissions listed in Table 10-1 over a rangeof prices. The public benefit analysis estimates <strong>the</strong> cost of locomotive emissionsusing median reported values compiled from a survey of <strong>the</strong>se studies, as listed inTable 10-2.PollutantCost$/<strong>to</strong>nHC 1400CO 520NO x 1060PM 10 2800Table 10-2: External Cost of Emissions.Based on <strong>the</strong> costs of emissions in Table 10-2, <strong>the</strong> locomotive emission rates inTable 10-1 were converted <strong>to</strong> hourly emissions costs, as shown in Table 10-3. Totalhourly costs per throttle position are presented for a single locomotive and for a trainconsisting of two locomotives.1 Painter, T.D. and Barkan, C.P.L., Prospects for Dynamic Brake Energy Recovery on NorthAmerican <strong>Freight</strong> Locomotives, Proceedings of <strong>the</strong> 2006 Joint Rail Conference, April 4-6, Atlanta, GA.10-7
<strong>San</strong> <strong>An<strong>to</strong>nio</strong> <strong>Region</strong> <strong>Freight</strong> <strong>Study</strong>MethodologyThrottlePositionHC($/hr)CO($/hr)NOx($/hr)PM 10($/hr)Total Total($/engine-hr) ($/train-hr)Brake 2.16 1.06 1.56 1.92 6.69 13.39Idle 0.74 0.28 0.36 0.70 2.08 4.171 0.35 0.21 1.52 0.40 2.48 4.952 0.30 0.27 3.50 0.43 4.50 8.993 0.56 0.69 8.48 1.32 11.04 22.084 0.45 1.59 16.36 1.04 19.44 38.875 0.92 2.23 29.87 1.07 34.09 68.186 1.15 3.36 39.22 1.54 45.28 90.567 1.27 1.89 46.42 1.80 51.39 102.788 1.52 1.74 54.90 2.15 60.30 120.61Table 10-3: Locomotive and Train Emission Costs per Throttle Position.The annual change in emission costs assumes that train delay time is primarilyspent in <strong>the</strong> idle position, while train run time is spent at an average of throttlepositions 1 through 8. Table 10-4 lists <strong>the</strong> <strong>to</strong>tal benefit associated with eachplanning case, based on changes in <strong>the</strong> delay and run times produced by RTCsimulation. The results of this analysis show that <strong>the</strong> <strong>to</strong>tal annual benefit fromreduced locomotive emissions for <strong>the</strong> <strong>San</strong> <strong>An<strong>to</strong>nio</strong> bypass and <strong>the</strong> combined Austin-<strong>San</strong> <strong>An<strong>to</strong>nio</strong> bypass is $0.27 million and $1.34 million, respectively. Operations over<strong>the</strong> Austin bypass alone results in an annual public cost beyond that of existingconditions of $1.32 million for Austin B1 and $1.11 million for Austin B2.LocomotiveThrottleAvoided Emissions Costs($/year)Position<strong>San</strong>Austin B1 Austin B2 SA-Austin<strong>An<strong>to</strong>nio</strong>Idle 257 42,439 39,229 32,0511 19,698 94,517 92,709 113,1312 35,772 171,641 168,359 205,4443 87,864 421,586 413,525 504,6144 154,659 742,080 727,891 888,2265 271,238 1,301,443 1,276,559 1,557,7506 360,289 1,728,728 1,695,674 2,069,1857 408,921 1,962,073 1,924,557 2,348,4858 479,834 2,302,324 2,258,303 2,755,745Idle 257 42,439 39,229 32,051Run (ave) 227,285 1,090,549 1,069,697 1,305,322Total 227,542 1,132,988 1,108,926 1,337,374Table 10-4: Public Benefit of Locomotive Emissions Reduction.10-8
<strong>San</strong> <strong>An<strong>to</strong>nio</strong> <strong>Region</strong> <strong>Freight</strong> <strong>Study</strong>MethodologyExisting Rail Corridor Value (Commuter Rail)Commuter rail service between Austin and <strong>San</strong> <strong>An<strong>to</strong>nio</strong> has been desired for sometime, and relocation of through-trains <strong>to</strong> a possible bypass would allow for <strong>the</strong>seplans <strong>to</strong> materialize. The relocation of freight rail operations would lessen gradecrossing impedance, provide an alternative <strong>to</strong> vehicular travel, and capture <strong>the</strong>benefits of transit-oriented development.Assuming that <strong>the</strong> construction of a rail bypass between Taylor and Seguin wouldgive <strong>the</strong> state ownership of <strong>the</strong> existing rail lines, <strong>the</strong> old facilities could potentially beused for commuter rail service, significantly adding <strong>to</strong> <strong>the</strong> estimated public benefit of<strong>the</strong> possible bypass. The value of this asset has been determined using previouslyestimated costs of developing this commuter system. 2 Table 10-5 lists <strong>the</strong> itemizedcosts for <strong>the</strong> case where a new track dedicated <strong>to</strong> commuter service is constructed,and <strong>the</strong> case where commuter service is shared with freight rail operations on <strong>the</strong>existing line. The asset value <strong>to</strong> <strong>the</strong> state is <strong>the</strong> difference in <strong>the</strong>se costs, reflecting<strong>the</strong> benefit of acquiring a facility with track devoted <strong>to</strong> commuter rail operations.Table 10-5 shows <strong>the</strong> current value (2007 dollars) of this facility is approximately$285 million.Ownership of <strong>the</strong> corridor would also allow <strong>the</strong> state <strong>to</strong> sell or lease portions of <strong>the</strong>100-foot railroad right-of-way for <strong>the</strong> location of utilities or o<strong>the</strong>r non-intrusivefacilities. A market price that reflects <strong>the</strong> unique potential of rail corridor propertyvalues has been based on relevant estimations in <strong>the</strong> recent past. Estimates for adiscontinued rail corridor in East Memphis have ranged from $63.8 <strong>to</strong> $69.1 millionper square mile, 3 while that for property in Milwaukee has been sold at $52.0 millionper square mile. 4 The property value of <strong>the</strong> existing Austin-<strong>San</strong> <strong>An<strong>to</strong>nio</strong> corridorassumes a market price of $50.0 million per square mile, or approximately $106million in <strong>to</strong>tal value.2 Austin-<strong>San</strong> <strong>An<strong>to</strong>nio</strong> Commuter Rail Feasibility <strong>Study</strong>, <strong>Texas</strong> Department of Transportation, 1999.3 The Most Expensive Real Estate in Memphis?, Memphis Business Quarterly, Spring, 2007.4 Mequon Developer Buys Railroad Corridor for Business Park, The Business Journal of Milwaukee,April 20, 2007.10-9
<strong>San</strong> <strong>An<strong>to</strong>nio</strong> <strong>Region</strong> <strong>Freight</strong> <strong>Study</strong>MethodologyItemNewTrack1998 Costs ($ million)SharedTrackExistingAssetValueTrack 116 47 69Bridges 46 0 46Passenger Stations 20 20 0Signaling 48 21 27Maintenance Shop & Yard 7 7 0Grade Crossings 37 37 0Right-of-Way 27 2 25Trains 66 66 0Testing & Start-up 2 1 1Design & Management 49 22 27Agency Costs 7 3 4Contingency 50 24 26Total 475 250 2252007 Value ($ million) 284.76Table 10-5: Commuter Rail Facility ValueVehicle Reduction BenefitsThe FHWA has estimated <strong>the</strong> costs of highway travel for different vehicleclassifications. 5 Each of <strong>the</strong> categories shown in Table 10-6 was identified as a costincurred by <strong>the</strong> public sec<strong>to</strong>r when vehicles use <strong>the</strong> highway system. The dollaramounts listed for 2000 in Table 10-6 are FHWA-reported costs associated withpavement wear, congestion, etc. The 2007 costs are adjustments of <strong>the</strong> FHWAfinding <strong>to</strong> reflect current values, based on differences in 2000 and 2007 ConsumerPrice Index (CPI) values provided by <strong>the</strong> Federal Reserve Bank.In <strong>the</strong> case of commuter rail service, <strong>the</strong> costs per car-mile shown in Table 10-6represent <strong>the</strong> benefit of displacing vehicles from <strong>the</strong> roadway network with <strong>the</strong>implementation of commuter rail service on <strong>the</strong> existing rail corridor. Table 10-7incorporates ridership projections from <strong>the</strong> state’s commuter rail study in<strong>to</strong> <strong>the</strong>determination of a corresponding number of displaced vehicles, assuming anaverage of 1.2 occupants per vehicle. Analysis of <strong>the</strong>se benefits over a 20-yearperiod uses <strong>the</strong> 1.54 percent growth in ridership assumed in <strong>the</strong> commuter rail study<strong>to</strong> forecast increases in <strong>the</strong> $3.96 million avoided public cost shown in Table 10-7.5 Addendum <strong>to</strong> <strong>the</strong> 1997 Federal Highway Cost Allocation <strong>Study</strong>, Final Report, U.S. Department ofTransportation, Federal Highway Administration, May 2000.10-10
<strong>San</strong> <strong>An<strong>to</strong>nio</strong> <strong>Region</strong> <strong>Freight</strong> <strong>Study</strong>MethodologyCommuter Station SegmentPublic Cost($/car-mi)2000 2007Pavement 0.001 0.0012Congestion 0.077 0.0922Crash 0.0119 0.0143Air pollution 0.0133 0.0159Noise 0.0009 0.0011Total 0.1041 0.1247Table 10-6: FHWA Marginal Costs of Passenger Vehicles1st YearPassengersSegmentDistance(miles)Trip Length(passengermiles)DisplacedVehicles(car-miles)1st YearAvoidedPublic Cost($)George<strong>to</strong>wn & Round Rock 157,700 8.5 1,333,800 1,111,500 138,600Round Rock & McNeil Jct 394,200 6.8 2,680,200 2,233,500 278,500McNeil & US 183 370,700 4.5 1,675,700 1,396,400 174,100US 183 & RM 2222 387,800 3.1 1,194,300 995,200 124,100RM 2222 & Austin CBD 490,000 5.4 2,646,100 2,205,100 275,000Austin CBD & Ben White 458,100 3.0 1,374,200 1,145,200 142,800Ben White & <strong>San</strong> Marcos 502,800 27.0 13,575,900 11,313,200 1,410,900<strong>San</strong> Marcos & New Braunfels 289,800 17.5 5,070,700 4,225,600 527,000New Braunfels & Selma 232,200 16.0 3,715,700 3,096,400 386,200Selma & <strong>San</strong> <strong>An<strong>to</strong>nio</strong> Airport 277,000 9.0 2,492,700 2,077,300 259,100<strong>San</strong> <strong>An<strong>to</strong>nio</strong> Airport & CBD 262,100 7.0 1,842,200 1,535,200 191,500<strong>San</strong> <strong>An<strong>to</strong>nio</strong> CBD & Kelly 123,600 4.0 490,600 408,800 51,000Total 3,945,800 111.8 38,092,100 31,743,400 3,958,800Table 10-7: Avoided Public Costs of Commuter Rail TravelProperty Tax Revenue BenefitsEconomic studies have shown that property values near commuter stations along<strong>the</strong> Dallas Area Rapid Transit (DART) light rail system are at least 25 percent higherthan properties unrelated <strong>to</strong> rail service. 6 The economic impact of commuter rail on<strong>the</strong> existing Austin-<strong>San</strong> <strong>An<strong>to</strong>nio</strong> rail corridor was evaluated for <strong>the</strong> Austin-<strong>San</strong><strong>An<strong>to</strong>nio</strong> Intermunicipal Commuter Rail District assuming 50 percent “net new”property tax revenues associated with station-area development. 7 For <strong>the</strong> purposeof comparison, forecasts of added property tax revenue in <strong>the</strong> current analysis arebased on:1. Station-area property values prepared by Capi<strong>to</strong>l Market Research for <strong>the</strong>2006 year. 82. Taxable property values collected from <strong>the</strong> Tax Assessor-Collec<strong>to</strong>r’s office foreach county along <strong>the</strong> existing rail corridor for <strong>the</strong> 2006 year.6 Weinstein, B.L. and Clower, T.L., DART Light Rail’s Effect on Taxable Property Valuations andTransit-Oriented Development, January 2003.7 Final Financial & Economic Benefits Report, Austin-<strong>San</strong> <strong>An<strong>to</strong>nio</strong> Commuter Rail Project, Austin-<strong>San</strong><strong>An<strong>to</strong>nio</strong> Intermunicipal Commuter Rail District, March 2007.8 Economic Impact Analysis Executive Summary, Austin-<strong>San</strong> <strong>An<strong>to</strong>nio</strong> Commuter rail Project, Austin-<strong>San</strong> <strong>An<strong>to</strong>nio</strong> Intermunicipal Commuter Rail District, April 2006.10-11
<strong>San</strong> <strong>An<strong>to</strong>nio</strong> <strong>Region</strong> <strong>Freight</strong> <strong>Study</strong>MethodologyTable 10-8 lists <strong>the</strong> 2006 value of property surrounding commuter rail stationsproposed for an Austin-<strong>San</strong> <strong>An<strong>to</strong>nio</strong> commuter rail system. The increase in taxrevenue at <strong>the</strong>se locations was estimated assuming an average tax rate of 2.20percent and an increase in property value of 25 percent, resulting in a net base yearincrease in tax revenue of $2.45 million.Area Tax BaseTaxable PropertyValue in 2006Station Location($)George<strong>to</strong>wn $2,432,882Round Rock $37,248,059McNeil Road $1,107,190Braker Lane $67,166,53335th Street $43,358,457Seaholm $142,736,610Slaughter Lane $41,796,175Kyle-Buda $610,449<strong>San</strong> Marcos $36,296,335New Braunfels $18,479,540Schertz $6,624,636Loop 1604 $5,182,294Loop 410 $17,324,833<strong>San</strong> <strong>An<strong>to</strong>nio</strong> CBD $23,360,365Kelly USA $1,468,300Total $445,192,658Commuter Rail Impact (2006 $)Property Tax Rate 2.20%Property Value Increase 25.00%Added Tax Revenue $2,448,560Table 10-8: Additions <strong>to</strong> Property Tax Revenue using Austin-<strong>San</strong> <strong>An<strong>to</strong>nio</strong> CommuterRail District DataTable 10-9 lists <strong>the</strong> taxable property values for <strong>the</strong> five counties along <strong>the</strong> existingrail corridor, as reported by <strong>the</strong> Tax Assessor-Collec<strong>to</strong>r’s office of each county. Theincrease in tax revenue in <strong>the</strong>se counties was estimated assuming that 0.25 percen<strong>to</strong>f county properties would be affected by development along <strong>the</strong> commuter line.The estimate also assumes an average tax rate of 2.20 percent and an increase inproperty value of 25 percent, resulting in a net base year increase in tax revenue of$2.56 million.The net present value analysis shown in Appendix G includes a net base increase inproperty tax revenue using an average ($2.50 million) of <strong>the</strong> results shown in Tables10-8 and 10-9. Station-area property values presented by Capi<strong>to</strong>l Market Researchprojected an average annual growth of 9.63 percent over 25 years in its economicimpact analysis, while <strong>the</strong> current net present value calculations assume <strong>the</strong> baseyear $2.50 million increase in property tax revenues grows at 7.50 percent annually.10-12
<strong>San</strong> <strong>An<strong>to</strong>nio</strong> <strong>Region</strong> <strong>Freight</strong> <strong>Study</strong>MethodologyCountyCounty Tax BaseTaxable PropertyValue in 2006($)Land Size(sq. miles)<strong>San</strong> <strong>An<strong>to</strong>nio</strong> $66,000,000,000 1247Comal $12,000,000,000 562Hays $8,219,469,587 678Travis $74,193,296,448 989Williamson $25,655,237,959 1124Total $186,068,003,994 4,600Average Value ($/sq. mile) $40,449,566Commuter Rail Impact (2006 $)Affected Property 0.25%Affected Tax Base ($) $465,170,010Property Tax Rate 2.20%Property Value Increase 25.00%Added Tax Revenue $2,558,435Table 10-9: Additions <strong>to</strong> Property Tax Revenue using County Tax Assessor-Collec<strong>to</strong>r DataPrivate BenefitsThe private benefits of rail improvements are generally associated with improvedoperating and maintenance conditions, as reflected by savings in time and cost. Asufficiently designed facility will also reduce <strong>the</strong> railroad’s exposure <strong>to</strong> gradecrossing incidents and eliminate <strong>the</strong> related damages <strong>to</strong> property.Establishing an associated dollar value <strong>to</strong> what may be considered <strong>the</strong> privatebenefit resulting from railroad infrastructure improvements, upgrades, or operatingchanges is difficult in its own right, and is additionally complex without <strong>the</strong> availabilityof detailed economic analyses and benefit/cost studies.The private benefit values were estimated based on calculated delay hours per dayoperated over <strong>the</strong> <strong>San</strong> <strong>An<strong>to</strong>nio</strong> region rail network for each planning case.Additional benefits that may be realized by <strong>the</strong> railroads as a result of <strong>the</strong> modeledimprovements, but not explicitly quantified, may include:‣ Reduced exposure <strong>to</strong> roadway-rail crossings‣ Improved train operating efficiency‣ Reduced train delays‣ Improved train run-times‣ Reduced public exposure in generalOperating Cost SavingsBenefits <strong>to</strong> <strong>the</strong> private sec<strong>to</strong>r are based on <strong>the</strong> degree <strong>to</strong> which operationalperformance measures such as train mileage, run time, and delay time for eachplanning case change relative <strong>to</strong> those of <strong>the</strong> base case. Each performancemeasure has been translated <strong>to</strong> an economic value using <strong>the</strong> following unit costs:10-13
<strong>San</strong> <strong>An<strong>to</strong>nio</strong> <strong>Region</strong> <strong>Freight</strong> <strong>Study</strong>Methodology‣ Train mileage = $51.23/mile‣ Run time or delay time = $407.19/hour‣ Fuel = $3.33/gallon 9The train mileage cost of $51.23/mile is a representative industry cost that reflectsrail operating expense per train mile. The run and delay time cost of $407.19/hourassumes a 60:40 ratio of yard-<strong>to</strong>-line haul operating times within <strong>San</strong> <strong>An<strong>to</strong>nio</strong>, whereexpected yard operating expenses are $285.82 per hour and line haul operatingexpenses are $589.24 per hour.Projecting this annualized cost 20 years in<strong>to</strong> <strong>the</strong> future with an annual 3 percent rateof inflation, <strong>the</strong> NPV of this private burden was <strong>the</strong>n calculated, and used as anindica<strong>to</strong>r of <strong>the</strong> private benefit that may be associated with <strong>the</strong> results of <strong>the</strong> planningcases discussed in section 7.Track Maintenance Cost SavingsClass 1 railroads spend approximately $46,000 per mile each year maintaining trackat current conditions. 10 This cost is based on <strong>the</strong> maintenance needs of railinfrastructure that, in general, has been in place for considerable time. For newtrack, such as <strong>the</strong> potential Austin-<strong>San</strong> <strong>An<strong>to</strong>nio</strong> rail bypass, significant savings arerealized in early years due <strong>to</strong> <strong>the</strong> absence of accumulated wear that comes withfreight operations over time. This feasibility analysis assumes <strong>the</strong> maintenance costsavings schedule shown in Table 10-10.YearTrack MaintenanceSavings Annual(%) Cost/Mile1 97 $1,3802 93 $3,2203 88 $5,5204 81 $8,7405 72 $12,8806 61 $17,9407 43 $26,2208 35 $29,9009 19 $37,26010 2 $45,08011 0 $46,000Table 10-10: Savings Schedule for New TrackSource: Testimony of Dr. Allan M. Zarembski, before <strong>the</strong> United States Senate9 Hous<strong>to</strong>n Spot Diesel Prices, Argus Rail Business, Vol. 14,16, April 21, 2008.10 Testimony of Dr. Allan M. Zarembski, President of ZETA-TECH, before <strong>the</strong> United States SenateCommittee on Commerce, Science and Transportation, Surface Transportation and Merchant MarineSubcommittee.10-14
<strong>San</strong> <strong>An<strong>to</strong>nio</strong> <strong>Region</strong> <strong>Freight</strong> <strong>Study</strong>MethodologyConstruction of a rail bypass that results in <strong>the</strong> elimination of through-freigh<strong>to</strong>perations along <strong>the</strong> Austin-<strong>San</strong> <strong>An<strong>to</strong>nio</strong> corridor will likely be accompanied by <strong>the</strong>state’s assumption of rights and obligations associated with ownership of <strong>the</strong> oldfacility. In this case, UP will avoid fur<strong>the</strong>r maintenance costs on <strong>the</strong> old facility andassume maintenance costs on <strong>the</strong> possible bypass. Since <strong>the</strong> <strong>to</strong>tal length of eachfacility is different, <strong>the</strong> change in UP’s maintenance cost can be determined asfollows:Δ[ d ( 1−% ) − d ]( costmile)cos t=bypass savings exist/Where,∆ cost = change in private railroad maintenance costsd bypass = bypass lengthd exsit = length of <strong>the</strong> existing line% savings = percent of maintenance cost saved in any yearAssuming an Austin-<strong>San</strong> <strong>An<strong>to</strong>nio</strong> bypass length of 145 miles and a 129-mile lengthfor <strong>the</strong> existing line, <strong>the</strong> equation above indicates that <strong>the</strong> savings rate threshold forany maintenance cost savings is:dexist 129% savings = 1−= 1−= 11%d 145bypassA savings rate threshold of 11 percent indicates that <strong>the</strong> railroad will realizemaintenance cost savings through year 9 according <strong>to</strong> <strong>the</strong> schedule shown in Table10-10. This finding is reflected in <strong>the</strong> 20-year analysis of <strong>the</strong> possible Austin-<strong>San</strong><strong>An<strong>to</strong>nio</strong> bypass in Appendix G. Similar results are obtained for a possible Austinonlybypass using a d exist of 72 miles and a d bypass of 77 miles (6.5 percent threshold)and a possible <strong>San</strong> <strong>An<strong>to</strong>nio</strong>-only bypass using a d exist of 57 miles and a d bypass of 68miles (16 percent threshold). The equations above reflect <strong>the</strong> fact that UP canrealize positive savings in maintenance over a greater number of years as <strong>the</strong>difference in length between <strong>the</strong> existing line and <strong>the</strong> possible bypass decreases.Grade Crossing Accident SavingsProperty damages due <strong>to</strong> grade crossing accidents have been found <strong>to</strong> average$100,000 per incident. 11 Approximately eight grade crossing accidents occur eachyear in <strong>the</strong> counties encompassing <strong>the</strong> possible Austin-<strong>San</strong> <strong>An<strong>to</strong>nio</strong> bypass studyarea, suggesting that a new rail facility can play a role in <strong>the</strong> elimination of accidentsand related property damage. 12 Assuming that <strong>the</strong> construction of a rail bypass willreduce <strong>the</strong> number of grade crossings by 85 percent, and that this reduction willeliminate one half of <strong>the</strong> annual grade crossing incidents, damages <strong>to</strong> property canbe reduced by approximately $400,000 per year.11 Rail Safety Cost Fac<strong>to</strong>rs, Washing<strong>to</strong>n State Department of Transportation, 2004.12 Safety Data, Office of Safety, Federal Railroad Administration, Oc<strong>to</strong>ber, 2004.10-15
<strong>San</strong> <strong>An<strong>to</strong>nio</strong> <strong>Region</strong> <strong>Freight</strong> <strong>Study</strong>Next StepsSECTION 11: THE NEXT STEPSBuilding upon <strong>the</strong> information contained within this report, <strong>the</strong> potentialimprovements, realignments, or relocations of <strong>the</strong> existing railway infrastructurehave been analyzed <strong>to</strong> determine <strong>the</strong> efficiencies of through-freight rail operationsand improvements associated with roadway user mobility and safety within <strong>the</strong>region. The private benefits generated for <strong>the</strong> respective modeling cases have beenreviewed by UP. The railroad’s concurrence <strong>to</strong> <strong>the</strong> methodology used, <strong>the</strong> proposedimprovements <strong>to</strong> <strong>the</strong>ir infrastructure, and <strong>the</strong> overall public and private benefitsassociated with this study may streng<strong>the</strong>n stakeholder relationships.Rail network improvements, reconfigurations, and possible realignments have beenreviewed utilizing appropriate engineering methods <strong>to</strong> determine <strong>the</strong> operationalviability of <strong>the</strong> existing and possible routes. Proposed ancillary and support facilitieshave also been identified.The next step in this analysis would be <strong>to</strong> continue <strong>to</strong> review and analyze currentand projected freight flow volumes <strong>to</strong> determine possible freight flows <strong>to</strong> and/or from<strong>the</strong> conceptual Trans-<strong>Texas</strong> Corridor routes and truck <strong>to</strong> rail freight shifts within <strong>the</strong><strong>San</strong> <strong>An<strong>to</strong>nio</strong> region. Alternate uses for <strong>the</strong> existing freight rail corridor, <strong>the</strong> result ofpossible excess capacity windows generated by <strong>the</strong> proposed rail improvements,would also support <strong>the</strong> MPO’s 2025 multimodal transportation plan.The last step would be <strong>to</strong> proceed with an environmental impact study, with anemphasis on current and proposed land use for a recommended through-freightalignment.The alternate uses for <strong>the</strong> existing freight rail corridor and current and proposedland use carries with it <strong>the</strong> increased potential for economic developments thatcould accompany new intermodal facilities, logistics parks, or mega-industrial ormanufacturing facilities intended <strong>to</strong> allow <strong>the</strong> <strong>San</strong> <strong>An<strong>to</strong>nio</strong> region <strong>to</strong> flourisheconomically during this period of growth.11-1