Stereoscopic depth processing in the visual cortex: a coarse-to-fine ...
Stereoscopic depth processing in the visual cortex: a coarse-to-fine ...
Stereoscopic depth processing in the visual cortex: a coarse-to-fine ...

Create successful ePaper yourself
Turn your PDF publications into a flip-book with our unique Google optimized e-Paper software.
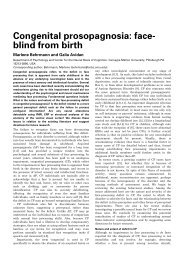
METHODSIsoflurane. (2–4%) was used <strong>to</strong> anes<strong>the</strong>tize animals dur<strong>in</strong>g surgery. Aftersurgery, anes<strong>the</strong>sia was switched <strong>to</strong> thiopental sodium (cont<strong>in</strong>uous <strong>in</strong>fusionas required of around 1.4 mg per kg per h). Paralysis was ma<strong>in</strong>ta<strong>in</strong>edwith pancuronium (cont<strong>in</strong>uous <strong>in</strong>fusion of 0.2 mg per kg per h). Artiarticles© 2003 Nature Publish<strong>in</strong>g Group http://www.nature.com/natureneuroscienceStrength of cross-correlationPostsynaptic/presynapticfir<strong>in</strong>g rates3020100–50 –25 0 25 50 75Coarse-<strong>to</strong>-f<strong>in</strong>e F<strong>in</strong>e-<strong>to</strong>-<strong>coarse</strong>Disparity range difference (%)43210acn = 20n = 20–50 –25 0 25 50 75Coarse-<strong>to</strong>-f<strong>in</strong>e F<strong>in</strong>e-<strong>to</strong>-<strong>coarse</strong>Disparity range difference (%)0–50 –25 0 25 50F<strong>in</strong>e-<strong>to</strong>-<strong>coarse</strong> Coarse-<strong>to</strong>-f<strong>in</strong>eDisparity frequency difference (%)Strength of cross-correlationPostsynaptic/presynapticfir<strong>in</strong>g rates3020104321bdn = 20n = 200–50 –25 0 25 50F<strong>in</strong>e-<strong>to</strong>-<strong>coarse</strong> Coarse-<strong>to</strong>-f<strong>in</strong>eDisparity frequency difference (%)Fig. 6. Asymmetries <strong>in</strong> <strong>coarse</strong>-<strong>to</strong>-f<strong>in</strong>e and f<strong>in</strong>e-<strong>to</strong>-<strong>coarse</strong> connections.(a, b) Strength of neural cross-correlation (area of <strong>the</strong> peak) is givenbetween monosynaptic and polysynaptic pairs of disparity-tuned cells(all comb<strong>in</strong>ations of simple/complex except simple-<strong>to</strong>-complex).Coarse-<strong>to</strong>-f<strong>in</strong>e and f<strong>in</strong>e-<strong>to</strong>-<strong>coarse</strong> connections are def<strong>in</strong>ed by ei<strong>the</strong>r <strong>the</strong>difference <strong>in</strong> disparity range (a) or disparity frequency (b) between <strong>the</strong>pairs, expressed as a percentage of <strong>the</strong> average value for <strong>the</strong> pair. Thedashed vertical l<strong>in</strong>es <strong>in</strong>dicate that pre and post-synaptic cells are not differentwith respect <strong>to</strong> <strong>the</strong> given parameter (frequency or range).(a) This plot def<strong>in</strong>es <strong>the</strong> relationships of <strong>the</strong> cells <strong>in</strong> terms of differences<strong>in</strong> disparity range. To <strong>the</strong> left of <strong>the</strong> vertical dashed l<strong>in</strong>e, <strong>the</strong> pre-synapticcell has a larger range (<strong>coarse</strong>-<strong>to</strong>-f<strong>in</strong>e); <strong>to</strong> <strong>the</strong> right, <strong>the</strong> pre-synaptic cellhas a smaller range (f<strong>in</strong>e-<strong>to</strong>-<strong>coarse</strong>). The most common type of connectionis f<strong>in</strong>e-<strong>to</strong>-<strong>coarse</strong>. The robust regression (solid l<strong>in</strong>e) is significantlydifferent from zero (P = 0.001). The Pearson correlation coefficient is–0.62. Coarse-<strong>to</strong>-f<strong>in</strong>e connections tend <strong>to</strong> be stronger than f<strong>in</strong>e-<strong>to</strong><strong>coarse</strong>connections. (b) This plot def<strong>in</strong>es <strong>the</strong> relationships of <strong>the</strong> cells <strong>in</strong>terms of differences <strong>in</strong> disparity frequency. To <strong>the</strong> left of <strong>the</strong> verticaldashed l<strong>in</strong>e, <strong>the</strong> pre-synaptic cell has a smaller frequency (f<strong>in</strong>e-<strong>to</strong><strong>coarse</strong>);<strong>to</strong> <strong>the</strong> right, <strong>the</strong> pre-synaptic cell has a larger frequency(<strong>coarse</strong>-<strong>to</strong>-f<strong>in</strong>e). There are far more f<strong>in</strong>e-<strong>to</strong>-<strong>coarse</strong> connections. Therobust regression (solid l<strong>in</strong>e) is significantly different from zero(P = 0.005). The Pearson correlation coefficient is 0.40. Consistent with<strong>the</strong> results <strong>in</strong> (a), <strong>coarse</strong>-<strong>to</strong>-f<strong>in</strong>e connections tend <strong>to</strong> be stronger.(c, d) The relationship between relative fir<strong>in</strong>g rate (fir<strong>in</strong>g rate of <strong>the</strong>post-synaptic cell divided by that of <strong>the</strong> pre-synaptic cell) and <strong>coarse</strong>/f<strong>in</strong>econnectivity, as def<strong>in</strong>ed above. The stronger <strong>coarse</strong>-<strong>to</strong>-f<strong>in</strong>e connectionsdef<strong>in</strong>ed ei<strong>the</strong>r by range differences (c) or by frequency differences(d) tend <strong>to</strong> have a relatively higher postsynaptic fir<strong>in</strong>g rates (robustregression, P = 0.0098, P = 0.039, respectively).(SI < 0). However, among <strong>the</strong> ten pairs with an SI > 0, <strong>the</strong> difference<strong>in</strong> optimal disparity was less than 10% for eight of <strong>the</strong>sepairs (difference <strong>in</strong> optimal disparity expressed as a percentageof <strong>the</strong> average disparity period of <strong>the</strong> pair, where disparity periodis <strong>the</strong> <strong>in</strong>verse of disparity frequency and has units of degrees).In <strong>the</strong> example shown above (Fig. 5a), <strong>the</strong> optimal disparitiesdef<strong>in</strong>ed by <strong>the</strong> positive peaks differed by 13% (this example isone of only two with differences greater than 10%), but <strong>the</strong><strong>in</strong>hibi<strong>to</strong>ry troughs were almost perfectly aligned. In <strong>the</strong> ‘tuned<strong>in</strong>hibi<strong>to</strong>ry’ type of cells (Fig. 5b), <strong>the</strong> location of <strong>the</strong> troughsdiffered by 8%. Thus, for a subclass of connected cells, <strong>the</strong> disparitytun<strong>in</strong>g peaks are approximately aligned, whereas <strong>the</strong>o<strong>the</strong>r parameters (notably disparity frequency and disparityrange) may differ considerably.DISCUSSIONThe three types of neurophysiological evidence presented hereare consistent with <strong>coarse</strong>-<strong>to</strong>-f<strong>in</strong>e sequential <strong>process<strong>in</strong>g</strong> as a majorcomponent of <strong>the</strong> neural mechanism of stereopsis. The improvement<strong>in</strong> resolution with greater correlation delay is similar <strong>to</strong> thatfor o<strong>the</strong>r parameters such as orientation 19 and spatial frequency20,21 . A previous <strong>in</strong>vestigation also shows direction tun<strong>in</strong>gchanges of medial temporal (MT) neurons dur<strong>in</strong>g a similar temporalw<strong>in</strong>dow (60 ms) 22 . There is some behavioral evidence thatsupports <strong>coarse</strong>-<strong>to</strong>-f<strong>in</strong>e temporal <strong>process<strong>in</strong>g</strong> of <strong>in</strong>formation. Forexample, low-pass and high-pass spatially filtered versions ofimages have been studied 23 . The spatially filtered versions werepresented <strong>in</strong> different temporal sequences: low-<strong>to</strong>-high andhigh-<strong>to</strong>-low frequencies. The subject’s task was <strong>to</strong> discrim<strong>in</strong>atea full-bandwidth image from <strong>the</strong> spatially filtered versions. Thelow-<strong>to</strong>-high temporal sequence was more often mistaken for <strong>the</strong>full bandwidth presentation than <strong>the</strong> high-<strong>to</strong>-low sequence. Theseperceptual and neurophysiological results are consistent with ourf<strong>in</strong>d<strong>in</strong>gs <strong>in</strong> support of a general, temporal <strong>coarse</strong>-<strong>to</strong>-f<strong>in</strong>e <strong>process<strong>in</strong>g</strong>mechanism <strong>in</strong> <strong>the</strong> <strong>visual</strong> <strong>cortex</strong>.A model of neural connectivity that is compatible with all ofour results consists of a post-synaptic neuron that pools overmany neurons of slightly different spatial scales (some larger ando<strong>the</strong>rs smaller). All of <strong>the</strong> neurons are tuned <strong>to</strong> approximately<strong>the</strong> same optimal disparity. The pre-synaptic neurons of relativelylower disparity frequency and larger disparity size haveshorter latencies that would dom<strong>in</strong>ate <strong>the</strong> early response of <strong>the</strong>post-synaptic neuron. Pre-synaptic neurons with relatively largerdisparity range (size) form stronger connections compared <strong>to</strong><strong>the</strong> more numerous pre-synaptic neurons with smaller disparityrange. Considered <strong>to</strong>ge<strong>the</strong>r, <strong>the</strong> post-synaptic neuron performs aweighted averag<strong>in</strong>g across spatial scale, with greater and earlierweight given <strong>to</strong> <strong>coarse</strong>-<strong>to</strong>-f<strong>in</strong>e connections.The concept of weighted averag<strong>in</strong>g across spatial scale with<strong>the</strong> same optimal disparity is also consistent with <strong>the</strong>oretical andbehavioral studies. For example, it has been proposed that averag<strong>in</strong>gdisparity signals across spatial scales helps <strong>to</strong> determ<strong>in</strong>e <strong>the</strong>correct disparity, reduc<strong>in</strong>g <strong>the</strong> ambiguity <strong>in</strong>herently present <strong>in</strong>any one spatial scale 7 . Psychophysical studies that show bothf<strong>in</strong>e-<strong>to</strong>-<strong>coarse</strong> and <strong>coarse</strong>-<strong>to</strong>-f<strong>in</strong>e <strong>in</strong>teractions are also compatiblewith weighted disparity averag<strong>in</strong>g, which <strong>in</strong>corporates both typesof connections. Perceptual weighted disparity averag<strong>in</strong>g acrossspatial scales is a well-known phenomenon when <strong>the</strong> stimulusconsists of multiple disparities <strong>in</strong> <strong>the</strong> same location 24 .Our results are consistent with o<strong>the</strong>r neurophysiological studies<strong>in</strong> which <strong>the</strong> dynamics of neural tun<strong>in</strong>g have been exam<strong>in</strong>ed19,20,21 . They are also compatible with psychophysical studiesthat support a temporal <strong>coarse</strong>-<strong>to</strong>-f<strong>in</strong>e <strong>process<strong>in</strong>g</strong> system, andwith <strong>the</strong>oretical models that advocate <strong>the</strong> advantages of comb<strong>in</strong><strong>in</strong>g<strong>in</strong>formation across spatial scale. Toge<strong>the</strong>r, <strong>the</strong>se neurophysiologicalresults and <strong>the</strong> behavioral studies <strong>in</strong> stereopsissuggest that <strong>coarse</strong> spatial scales constra<strong>in</strong> f<strong>in</strong>er scales, but <strong>the</strong>reis also a role for f<strong>in</strong>e-<strong>to</strong>-<strong>coarse</strong> <strong>process<strong>in</strong>g</strong>.nature neuroscience • volume 6 no 1 • january 2003 63