Stereoscopic depth processing in the visual cortex: a coarse-to-fine ...
Stereoscopic depth processing in the visual cortex: a coarse-to-fine ...
Stereoscopic depth processing in the visual cortex: a coarse-to-fine ...

You also want an ePaper? Increase the reach of your titles
YUMPU automatically turns print PDFs into web optimized ePapers that Google loves.
articles© 2003 Nature Publish<strong>in</strong>g Group http://www.nature.com/natureneuroscience<strong>Stereoscopic</strong> <strong>depth</strong> <strong>process<strong>in</strong>g</strong> <strong>in</strong><strong>the</strong> <strong>visual</strong> <strong>cortex</strong>: a <strong>coarse</strong>-<strong>to</strong>-f<strong>in</strong>emechanismMichael D. Menz 1 and Ralph D. FreemanGroup <strong>in</strong> Vision Science, School of Op<strong>to</strong>metry, and <strong>the</strong> Helen Wills Neuroscience Institute, University of California, Berkeley,California 94720-2020, USA1 Present address: Smith-Kettlewell Eye Research Institute, 2318 Fillmore Street, San Francisco, California 94115, USAPublished onl<strong>in</strong>e 9 December 2002; doi:10.1038/nn986For b<strong>in</strong>ocular animals view<strong>in</strong>g a three-dimensional scene, <strong>the</strong> left and right eyes receive slightlydifferent <strong>in</strong>formation, and <strong>the</strong> bra<strong>in</strong> uses this ‘b<strong>in</strong>ocular disparity’ <strong>to</strong> <strong>in</strong>terpret stereoscopic <strong>depth</strong>. Animportant <strong>the</strong>oretical conjecture <strong>in</strong> this mechanism is that <strong>coarse</strong> <strong>process<strong>in</strong>g</strong> precedes and constra<strong>in</strong>sf<strong>in</strong>ely detailed <strong>process<strong>in</strong>g</strong>. We present three types of neurophysiological data from <strong>the</strong> cat’s <strong>visual</strong> <strong>cortex</strong>that are consistent with a temporal <strong>coarse</strong>-<strong>to</strong>-f<strong>in</strong>e tun<strong>in</strong>g of disparity <strong>in</strong>formation. First, <strong>the</strong> disparitytun<strong>in</strong>g of cortical cells generally sharpened dur<strong>in</strong>g <strong>the</strong> time course of response. Second, cellsresponsive <strong>to</strong> large and small spatial scale had relatively shorter and longer temporal latencies, respectively.Third, cross-correlation analysis between simultaneously recorded pairs of cortical cells showedthat connections between disparity-tuned neurons were generally stronger for <strong>coarse</strong>-<strong>to</strong>-f<strong>in</strong>e <strong>process<strong>in</strong>g</strong>than for f<strong>in</strong>e-<strong>to</strong>-<strong>coarse</strong> <strong>process<strong>in</strong>g</strong>. These results are consistent with <strong>the</strong>oretical and behavioralstudies and suggest that rapid, <strong>coarse</strong> percepts are ref<strong>in</strong>ed over time <strong>in</strong> stereoscopic <strong>depth</strong> perception.The resolution of stereoscopic <strong>depth</strong> discrim<strong>in</strong>ation is extremelyf<strong>in</strong>e 1 . To achieve this, <strong>the</strong> b<strong>in</strong>ocular correspondence problem—whichresults from <strong>the</strong> slightly different <strong>in</strong>puts <strong>to</strong> eacheye while view<strong>in</strong>g a scene—must first be solved. That is, <strong>the</strong>match<strong>in</strong>g features <strong>in</strong> both eyes must be comb<strong>in</strong>ed <strong>to</strong> reconstructan accurate three-dimensional view of <strong>the</strong> scene. Spatialscale must be taken <strong>in</strong><strong>to</strong> account, as neurons respond <strong>to</strong> alimited range of disparities and spatial frequencies. Neuronsthat are tuned <strong>to</strong> low spatial frequencies code a relatively widerange of disparities, but with poor resolution. Conversely, cellstuned <strong>to</strong> high spatial frequencies have f<strong>in</strong>e resolution, but arelimited <strong>to</strong> <strong>process<strong>in</strong>g</strong> a narrow range of disparities 2–4 . A lead<strong>in</strong>g<strong>the</strong>ory concern<strong>in</strong>g stereoscopic <strong>process<strong>in</strong>g</strong> is that <strong>coarse</strong>disparity <strong>in</strong>formation constra<strong>in</strong>s that of f<strong>in</strong>e detail 5 . Given that<strong>coarse</strong> spatial scale covers <strong>the</strong> entire range of disparities <strong>to</strong>which <strong>the</strong> system responds, it is advantageous <strong>to</strong> first producea global solution <strong>to</strong> <strong>the</strong> correspondence problem. This <strong>in</strong>itialestimate of disparities across <strong>the</strong> <strong>visual</strong> field can <strong>the</strong>n be ref<strong>in</strong>edby neurons that have better resolution over a narrower range.Different underly<strong>in</strong>g mechanisms have been suggested for this<strong>coarse</strong>-<strong>to</strong>-f<strong>in</strong>e process 5–15 . Although <strong>the</strong>re is also an apparentrole for f<strong>in</strong>e-<strong>to</strong>-<strong>coarse</strong> <strong>process<strong>in</strong>g</strong> 13 , it is clear that a <strong>coarse</strong> spatialscale constra<strong>in</strong>s <strong>the</strong> correspondence solution at f<strong>in</strong>er values6,8,13,14 . An implicit extension of this idea is that a<strong>coarse</strong>-<strong>to</strong>-f<strong>in</strong>e sequence applies <strong>to</strong> all stereoscopic neural <strong>process<strong>in</strong>g</strong>,from establish<strong>in</strong>g b<strong>in</strong>ocular correspondence <strong>to</strong> perceiv<strong>in</strong>gdifferences <strong>in</strong> <strong>depth</strong>.Here, we report three types of neurophysiological data that areconsistent with a stereoscopic mechanism <strong>in</strong> which <strong>coarse</strong>-<strong>to</strong>-f<strong>in</strong>e<strong>process<strong>in</strong>g</strong> is a major component. Some of our data also <strong>in</strong>dicatethat <strong>the</strong>re is a f<strong>in</strong>e-<strong>to</strong>-<strong>coarse</strong> process <strong>in</strong>volved. For <strong>the</strong> first twotypes of data, we analyzed response characteristics of complexcells <strong>in</strong> <strong>the</strong> cat’s striate <strong>cortex</strong>. We limited <strong>the</strong> analysis <strong>to</strong> complexcells because <strong>the</strong>y are considered primary disparity detec<strong>to</strong>rs 16,17 .For <strong>the</strong> third category of data, we assessed cross-correlation resultsfrom both simple and complex cells <strong>to</strong> maximize sample size. For<strong>the</strong> first analysis, we exam<strong>in</strong>ed temporal characteristics ofdisparity-tun<strong>in</strong>g functions for each cell <strong>to</strong> determ<strong>in</strong>e if disparityfrequency (resolution) and range (size) change over time. Disparityfrequency refers <strong>to</strong> <strong>the</strong> modulation of each cell’s response fordifferent b<strong>in</strong>ocular disparities. Disparity range specifies <strong>the</strong> exten<strong>to</strong>f disparities that produces a response from <strong>the</strong> neuron. Toge<strong>the</strong>r,frequency and range characterize <strong>the</strong> degree of f<strong>in</strong>e or <strong>coarse</strong>tun<strong>in</strong>g of a cell’s disparity response. High frequencies and smallrange correspond <strong>to</strong> relatively f<strong>in</strong>e tun<strong>in</strong>g. For <strong>the</strong> second type ofevidence, we determ<strong>in</strong>ed latencies of <strong>the</strong> strongest responses andcompared <strong>the</strong>m with preferred disparity frequencies for each cell.The third type of evidence is derived from simultaneous record<strong>in</strong>gof responses of pairs of disparity-tuned cortical cells. We usedcross-correlation analysis <strong>to</strong> exam<strong>in</strong>e tim<strong>in</strong>g patterns betweencells and relative strengths of <strong>in</strong>teraction.Our f<strong>in</strong>d<strong>in</strong>gs are as follows. First, disparity tun<strong>in</strong>g of mostcortical cells sharpened dur<strong>in</strong>g responses. Second, populationanalysis showed that cells with low disparity frequency preferencestended <strong>to</strong> have relatively short response latencies. Third,cross-correlation analysis showed that more cell pairs showedf<strong>in</strong>e-<strong>to</strong>-<strong>coarse</strong> cortical connections than <strong>coarse</strong>-<strong>to</strong>-f<strong>in</strong>e, but <strong>the</strong><strong>coarse</strong>-<strong>to</strong>-f<strong>in</strong>e connections were generally stronger. Taken <strong>to</strong>ge<strong>the</strong>r,<strong>the</strong>se results are consistent with a stereoscopic <strong>coarse</strong>-<strong>to</strong>-f<strong>in</strong>eprocess that has a f<strong>in</strong>e-<strong>to</strong>-<strong>coarse</strong> component.nature neuroscience • volume 6 no 1 • january 2003 59
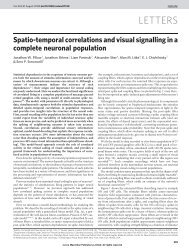
articles© 2003 Nature Publish<strong>in</strong>g Group http://www.nature.com/natureneuroscienceChange <strong>in</strong> range over 40 ms (%)Number of cells2520151050–407550250–25abDisparity range (size)Disparity frequency (resolution)n = 74–20 0 20 40 60 80 100Change over 40 ms (%)–50–25 0 25 50 75 100Change <strong>in</strong> frequency over 40 ms (%)Fig. 3. A population summary of changes <strong>in</strong> disparity frequency and disparityrange. (a) Distributions of disparity frequency (filled bars) and disparitysize (unfilled bars) dynamics are presented for 74 complex cells.The position of <strong>the</strong> dashed vertical l<strong>in</strong>e (at zero) shows that <strong>the</strong> meansof <strong>the</strong>se distributions are shifted away from zero. Change <strong>in</strong> a parameteris considered as a percent difference between 20 ms before optimaltime delay and 20 ms after. A positive value <strong>in</strong>dicates an <strong>in</strong>crease withgreater time delay, and a negative number signifies a decrease. The average<strong>in</strong>crease <strong>in</strong> frequency is 25%, and <strong>the</strong> average decrease <strong>in</strong> range is8.4%. These values are significantly different from zero (P < 0.001,P < 0.001). (b) A relationship is shown between <strong>the</strong> changes <strong>in</strong> range and<strong>in</strong> frequency over a 40 ms time period. Dashed vertical and horizontall<strong>in</strong>es <strong>in</strong>dicate no change. The robust regression (solid l<strong>in</strong>e) has a slope of–0.22 and is significantly different from zero (P = 0.0097). The Pearsoncorrelation coefficient (–0.24) and regression <strong>in</strong>dicate a weak correlationsuch that cells with a large <strong>in</strong>crease <strong>in</strong> frequency tend <strong>to</strong> have alarge decrease <strong>in</strong> size.basis, given <strong>the</strong> confidence <strong>in</strong>tervals for <strong>the</strong>se fitted parametersfrom <strong>the</strong> Levenberg-Marquardt algorithm 18 . Of 74 cells, 59showed a significant <strong>in</strong>crease <strong>in</strong> disparity frequency, 15 were notsignificantly different, and none showed a significant decrease <strong>in</strong>frequency. For disparity range, 41 cells showed no significant difference,28 showed a significant decrease, and 5 had a significant<strong>in</strong>crease. Whereas <strong>the</strong> frequency parameter was well constra<strong>in</strong>edby <strong>the</strong> fit, <strong>the</strong> range parameter was relatively less constra<strong>in</strong>ed. Thechange <strong>in</strong> disparity range was not as strong an effect as <strong>the</strong> change<strong>in</strong> disparity frequency. F<strong>in</strong>ally, we measured <strong>the</strong> change <strong>in</strong> optimaldisparity over <strong>the</strong> same 40-ms time span dur<strong>in</strong>g which <strong>the</strong>disparity frequency and disparity range measurements were made.Out of 74 cells, 64 had a change <strong>in</strong> optimal disparity of
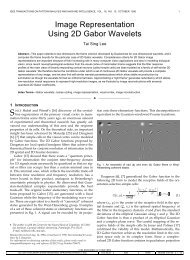
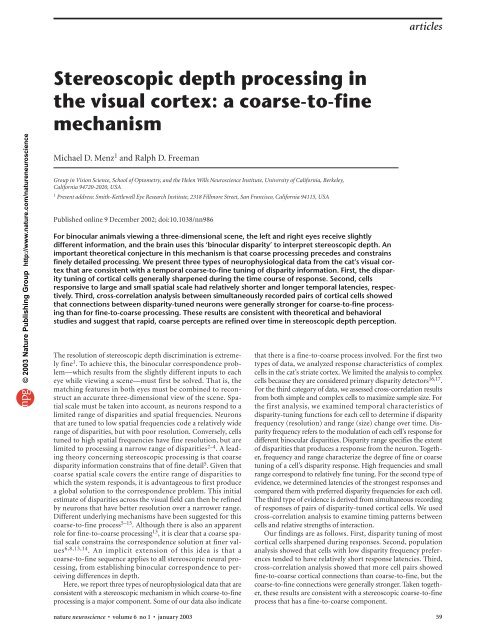
articles© 2003 Nature Publish<strong>in</strong>g Group http://www.nature.com/natureneuroscienceNormalized amplitude10–1210–1–5010–1–50abcdDisparity (°)0 50Correlation delay (ms)Disparity (°)2Spike 2 Spike 110–1Spike 2Spike 1Spike 1Spike 1 Spike 2Spike 20° 2°0° 2°0 50Correlation delay (ms)Fig. 5. Examples of f<strong>in</strong>e-<strong>to</strong>-<strong>coarse</strong> and <strong>coarse</strong>-<strong>to</strong>-f<strong>in</strong>e connectionsbetween disparity-tuned complex cells. (a) Spike 1 disparity tun<strong>in</strong>g data(open circles), Gabor fit (dashed l<strong>in</strong>e); Spike 2 disparity tun<strong>in</strong>g data(closed circles), Gabor fit (solid l<strong>in</strong>e). (b) Shuffle-subtracted, crosscorrelogramof <strong>the</strong> neurons <strong>in</strong> (a), normalized by <strong>the</strong> number of presynapticspikes (‘effectiveness’) 30 . The two horizontal l<strong>in</strong>es are <strong>the</strong> mean± 3 s.d. of <strong>the</strong> response <strong>in</strong> <strong>the</strong> range 50–100 ms. B<strong>in</strong>s that exceeded thiswere considered significant. Spike 1, which has a disparity frequency of0.31 cycle/° and size of 1.48° is clearly pre-synaptic <strong>to</strong> spike 2, which hasa frequency of 0.23 cycle/° and a range of 1.8°. This is a f<strong>in</strong>e-<strong>to</strong>-<strong>coarse</strong>connection and <strong>the</strong> effective connectivity (area of <strong>the</strong> peak) is relativelyweak. (c) The disparity tun<strong>in</strong>g function of a different pair of cells is shownhere. (d) The cross-correlogram of <strong>the</strong> pair <strong>in</strong> (c) shows a <strong>coarse</strong>-<strong>to</strong>-f<strong>in</strong>econnection. Pre-synaptic spike 2 has a frequency of 0.17 cycle/° and arange of 2.1°, whereas <strong>the</strong> post-synaptic spike 1 Gabor function fit yieldsa frequency of 0.21 cycle/° and a range of 1.3°. This <strong>coarse</strong>-<strong>to</strong>-f<strong>in</strong>e connectiondisplays a much stronger effective connectivity compared <strong>to</strong> <strong>the</strong>f<strong>in</strong>e-<strong>to</strong>-<strong>coarse</strong> connection <strong>in</strong> (b) (12.5 versus 5.6).sample size. We analyzed data for 20 pairs of disparity-tuned simpleand complex cells: 17 pairs were recorded from <strong>the</strong> same electrode,and 3 pairs were from different electrodes. Threecomb<strong>in</strong>ations of monosynaptic and polysynaptic connections(see Methods for classification criteria) were <strong>in</strong>cluded: simple<strong>to</strong>-simple,complex-<strong>to</strong>-simple and complex-<strong>to</strong>-complex. Thesimple-<strong>to</strong>-complex connection was not used because it is a specialcase <strong>in</strong> which we believe that simple cells are <strong>the</strong> subunits ofcomplex cells 3,4 ; it should <strong>the</strong>refore be considered separately. Representativecross-correlation data are shown for two pairs of complexcells (Fig. 5). For <strong>the</strong> first pair, <strong>the</strong> shuffle-subtractedcross-correlogram <strong>in</strong>dicates that cell 1 drove cell 2, and <strong>the</strong> disparityfrequency and range data <strong>in</strong>dicate that this cell comb<strong>in</strong>ationrepresents a f<strong>in</strong>e-<strong>to</strong>-<strong>coarse</strong> connection (Fig. 5a and b). Thesecond cell pair showed a stronger cross-correlation peak. In thiscase, cell 2 drove cell 1 (both complex cells). Disparity frequencyand range data <strong>in</strong>dicate that this cell comb<strong>in</strong>ation represents a<strong>coarse</strong>-<strong>to</strong>-f<strong>in</strong>e connection (Fig. 5c and d).For <strong>the</strong> pairs of neurons from which we derived crosscorrelogramdata, <strong>the</strong> type of connectivity between <strong>the</strong> cells wasassessed accord<strong>in</strong>g <strong>to</strong> ei<strong>the</strong>r disparity range (size) or disparityfrequency (resolution). If <strong>the</strong> disparity range was larger for <strong>the</strong>pre-synaptic cell compared <strong>to</strong> <strong>the</strong> post-synaptic cell, we considered<strong>the</strong> connection <strong>to</strong> be <strong>coarse</strong>-<strong>to</strong>-f<strong>in</strong>e. Conversely, a smallerpre-synaptic cell range signified a f<strong>in</strong>e-<strong>to</strong>-<strong>coarse</strong> connection. Toderive a quantitative measurement, we considered <strong>the</strong> difference<strong>in</strong> range expressed as a percentage of <strong>the</strong> average range (Methods).Similarly, if <strong>the</strong> disparity frequency was lower for <strong>the</strong> presynapticcell, <strong>the</strong>n <strong>the</strong> connection was considered <strong>coarse</strong>-<strong>to</strong>-f<strong>in</strong>e.Cell connectivity was asymmetrical (Fig. 6). Whe<strong>the</strong>r evaluated bydisparity range or disparity frequency, <strong>the</strong>re were more f<strong>in</strong>e-<strong>to</strong><strong>coarse</strong>than <strong>coarse</strong>-<strong>to</strong>-f<strong>in</strong>e connections. This difference was statisticallysignificant only for frequency (P = 0.021, b<strong>in</strong>omial signtest; Fig. 6b and d). This type of asymmetry <strong>in</strong>dicates that <strong>the</strong>quantities of connections are not equal. Ano<strong>the</strong>r type of asymmetry<strong>in</strong>volves <strong>the</strong> strength of connections and fir<strong>in</strong>g rates. InFig. 6a and b, we show <strong>the</strong> relationship between <strong>the</strong> strength (thatis, area) of <strong>the</strong> cross-correlation peak and <strong>the</strong> type of connectivity.Coarse-<strong>to</strong>-f<strong>in</strong>e connections, whe<strong>the</strong>r def<strong>in</strong>ed by range or frequency,tend <strong>to</strong> be stronger (robust regressions, P = 0.001 andP = 0.005, respectively). The fir<strong>in</strong>g rates of our pairs of cells weregenerally not equal. Relative fir<strong>in</strong>g rates (fir<strong>in</strong>g rate of <strong>the</strong> postsynapticcell divided by that of <strong>the</strong> pre-synaptic cell) <strong>in</strong>stead ofcorrelation strength are also shown (Fig. 6c and d). Fir<strong>in</strong>g rate isa much simpler, more <strong>in</strong>tuitive measure of neural response thanshuffle-subtracted, normalized, cross-correlogram peak area.Coarse-<strong>to</strong>-f<strong>in</strong>e connections, whe<strong>the</strong>r def<strong>in</strong>ed by range or frequency,tend <strong>to</strong> have higher post-synaptic fir<strong>in</strong>g rates compared<strong>to</strong> those of <strong>the</strong> pre-synaptic cells (robust regressions, P = 0.0098and P = 0.039, respectively). If <strong>the</strong> f<strong>in</strong>e-<strong>to</strong>-<strong>coarse</strong> connectionshave weak synaptic strengths, it follows that <strong>the</strong>ir post-synapticfir<strong>in</strong>g rates are low compared <strong>to</strong> those at pre-synaptic sites. Similarly,it is logically consistent that strong <strong>coarse</strong>-<strong>to</strong>-f<strong>in</strong>e connectionsresult <strong>in</strong> more robust post-synaptic fir<strong>in</strong>g rates compared<strong>to</strong> those at pre-synaptic levels. Two clear po<strong>in</strong>ts emerge from <strong>the</strong>sedata. First, <strong>the</strong>re were more cell pairs with f<strong>in</strong>e-<strong>to</strong>-<strong>coarse</strong> connections.Second, <strong>the</strong> <strong>coarse</strong>-<strong>to</strong>-f<strong>in</strong>e connections (<strong>to</strong> <strong>the</strong> left of<strong>the</strong> dashed l<strong>in</strong>es for range plots Fig. 6a and c and <strong>to</strong> <strong>the</strong> right forfrequency plots Fig. 6b and d) were generally stronger with postsynapticcells that had higher fir<strong>in</strong>g rates.Comb<strong>in</strong><strong>in</strong>g <strong>in</strong>formation across spatial scale is most usefulif <strong>the</strong> neurons are tuned <strong>to</strong> <strong>the</strong> same optimal disparity. Therefore,it is important <strong>to</strong> note whe<strong>the</strong>r disparity-tuned neuronsthat are connected are tuned <strong>to</strong> <strong>the</strong> same optimal disparity, eventhough <strong>the</strong>ir disparity frequencies and disparity ranges may bedifferent. We found that many connected pairs had nearly oppositedisparity tun<strong>in</strong>g curves. The ‘similarity <strong>in</strong>dex’ (SI) of tun<strong>in</strong>gcurves can be quantified by tak<strong>in</strong>g <strong>the</strong> Pearson correlation coefficien<strong>to</strong>f <strong>the</strong> pair (where +1 and –1 <strong>in</strong>dicate identical and exactlyopposite tun<strong>in</strong>g, respectively). Our 20 pairs of cells wereevenly split, such that half had an SI > 0, and <strong>the</strong> o<strong>the</strong>r half hadan SI < 0. Connections between neurons are likely <strong>to</strong> have multiplepurposes. The resolution of horizontal disparity acrossspatial scale is one possibility. It is not clear what functionalrole is performed by cell pairs with nearly opposite tun<strong>in</strong>g62 nature neuroscience • volume 6 no 1 • january 2003
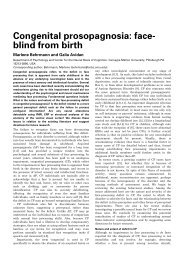
METHODSIsoflurane. (2–4%) was used <strong>to</strong> anes<strong>the</strong>tize animals dur<strong>in</strong>g surgery. Aftersurgery, anes<strong>the</strong>sia was switched <strong>to</strong> thiopental sodium (cont<strong>in</strong>uous <strong>in</strong>fusionas required of around 1.4 mg per kg per h). Paralysis was ma<strong>in</strong>ta<strong>in</strong>edwith pancuronium (cont<strong>in</strong>uous <strong>in</strong>fusion of 0.2 mg per kg per h). Artiarticles© 2003 Nature Publish<strong>in</strong>g Group http://www.nature.com/natureneuroscienceStrength of cross-correlationPostsynaptic/presynapticfir<strong>in</strong>g rates3020100–50 –25 0 25 50 75Coarse-<strong>to</strong>-f<strong>in</strong>e F<strong>in</strong>e-<strong>to</strong>-<strong>coarse</strong>Disparity range difference (%)43210acn = 20n = 20–50 –25 0 25 50 75Coarse-<strong>to</strong>-f<strong>in</strong>e F<strong>in</strong>e-<strong>to</strong>-<strong>coarse</strong>Disparity range difference (%)0–50 –25 0 25 50F<strong>in</strong>e-<strong>to</strong>-<strong>coarse</strong> Coarse-<strong>to</strong>-f<strong>in</strong>eDisparity frequency difference (%)Strength of cross-correlationPostsynaptic/presynapticfir<strong>in</strong>g rates3020104321bdn = 20n = 200–50 –25 0 25 50F<strong>in</strong>e-<strong>to</strong>-<strong>coarse</strong> Coarse-<strong>to</strong>-f<strong>in</strong>eDisparity frequency difference (%)Fig. 6. Asymmetries <strong>in</strong> <strong>coarse</strong>-<strong>to</strong>-f<strong>in</strong>e and f<strong>in</strong>e-<strong>to</strong>-<strong>coarse</strong> connections.(a, b) Strength of neural cross-correlation (area of <strong>the</strong> peak) is givenbetween monosynaptic and polysynaptic pairs of disparity-tuned cells(all comb<strong>in</strong>ations of simple/complex except simple-<strong>to</strong>-complex).Coarse-<strong>to</strong>-f<strong>in</strong>e and f<strong>in</strong>e-<strong>to</strong>-<strong>coarse</strong> connections are def<strong>in</strong>ed by ei<strong>the</strong>r <strong>the</strong>difference <strong>in</strong> disparity range (a) or disparity frequency (b) between <strong>the</strong>pairs, expressed as a percentage of <strong>the</strong> average value for <strong>the</strong> pair. Thedashed vertical l<strong>in</strong>es <strong>in</strong>dicate that pre and post-synaptic cells are not differentwith respect <strong>to</strong> <strong>the</strong> given parameter (frequency or range).(a) This plot def<strong>in</strong>es <strong>the</strong> relationships of <strong>the</strong> cells <strong>in</strong> terms of differences<strong>in</strong> disparity range. To <strong>the</strong> left of <strong>the</strong> vertical dashed l<strong>in</strong>e, <strong>the</strong> pre-synapticcell has a larger range (<strong>coarse</strong>-<strong>to</strong>-f<strong>in</strong>e); <strong>to</strong> <strong>the</strong> right, <strong>the</strong> pre-synaptic cellhas a smaller range (f<strong>in</strong>e-<strong>to</strong>-<strong>coarse</strong>). The most common type of connectionis f<strong>in</strong>e-<strong>to</strong>-<strong>coarse</strong>. The robust regression (solid l<strong>in</strong>e) is significantlydifferent from zero (P = 0.001). The Pearson correlation coefficient is–0.62. Coarse-<strong>to</strong>-f<strong>in</strong>e connections tend <strong>to</strong> be stronger than f<strong>in</strong>e-<strong>to</strong><strong>coarse</strong>connections. (b) This plot def<strong>in</strong>es <strong>the</strong> relationships of <strong>the</strong> cells <strong>in</strong>terms of differences <strong>in</strong> disparity frequency. To <strong>the</strong> left of <strong>the</strong> verticaldashed l<strong>in</strong>e, <strong>the</strong> pre-synaptic cell has a smaller frequency (f<strong>in</strong>e-<strong>to</strong><strong>coarse</strong>);<strong>to</strong> <strong>the</strong> right, <strong>the</strong> pre-synaptic cell has a larger frequency(<strong>coarse</strong>-<strong>to</strong>-f<strong>in</strong>e). There are far more f<strong>in</strong>e-<strong>to</strong>-<strong>coarse</strong> connections. Therobust regression (solid l<strong>in</strong>e) is significantly different from zero(P = 0.005). The Pearson correlation coefficient is 0.40. Consistent with<strong>the</strong> results <strong>in</strong> (a), <strong>coarse</strong>-<strong>to</strong>-f<strong>in</strong>e connections tend <strong>to</strong> be stronger.(c, d) The relationship between relative fir<strong>in</strong>g rate (fir<strong>in</strong>g rate of <strong>the</strong>post-synaptic cell divided by that of <strong>the</strong> pre-synaptic cell) and <strong>coarse</strong>/f<strong>in</strong>econnectivity, as def<strong>in</strong>ed above. The stronger <strong>coarse</strong>-<strong>to</strong>-f<strong>in</strong>e connectionsdef<strong>in</strong>ed ei<strong>the</strong>r by range differences (c) or by frequency differences(d) tend <strong>to</strong> have a relatively higher postsynaptic fir<strong>in</strong>g rates (robustregression, P = 0.0098, P = 0.039, respectively).(SI < 0). However, among <strong>the</strong> ten pairs with an SI > 0, <strong>the</strong> difference<strong>in</strong> optimal disparity was less than 10% for eight of <strong>the</strong>sepairs (difference <strong>in</strong> optimal disparity expressed as a percentageof <strong>the</strong> average disparity period of <strong>the</strong> pair, where disparity periodis <strong>the</strong> <strong>in</strong>verse of disparity frequency and has units of degrees).In <strong>the</strong> example shown above (Fig. 5a), <strong>the</strong> optimal disparitiesdef<strong>in</strong>ed by <strong>the</strong> positive peaks differed by 13% (this example isone of only two with differences greater than 10%), but <strong>the</strong><strong>in</strong>hibi<strong>to</strong>ry troughs were almost perfectly aligned. In <strong>the</strong> ‘tuned<strong>in</strong>hibi<strong>to</strong>ry’ type of cells (Fig. 5b), <strong>the</strong> location of <strong>the</strong> troughsdiffered by 8%. Thus, for a subclass of connected cells, <strong>the</strong> disparitytun<strong>in</strong>g peaks are approximately aligned, whereas <strong>the</strong>o<strong>the</strong>r parameters (notably disparity frequency and disparityrange) may differ considerably.DISCUSSIONThe three types of neurophysiological evidence presented hereare consistent with <strong>coarse</strong>-<strong>to</strong>-f<strong>in</strong>e sequential <strong>process<strong>in</strong>g</strong> as a majorcomponent of <strong>the</strong> neural mechanism of stereopsis. The improvement<strong>in</strong> resolution with greater correlation delay is similar <strong>to</strong> thatfor o<strong>the</strong>r parameters such as orientation 19 and spatial frequency20,21 . A previous <strong>in</strong>vestigation also shows direction tun<strong>in</strong>gchanges of medial temporal (MT) neurons dur<strong>in</strong>g a similar temporalw<strong>in</strong>dow (60 ms) 22 . There is some behavioral evidence thatsupports <strong>coarse</strong>-<strong>to</strong>-f<strong>in</strong>e temporal <strong>process<strong>in</strong>g</strong> of <strong>in</strong>formation. Forexample, low-pass and high-pass spatially filtered versions ofimages have been studied 23 . The spatially filtered versions werepresented <strong>in</strong> different temporal sequences: low-<strong>to</strong>-high andhigh-<strong>to</strong>-low frequencies. The subject’s task was <strong>to</strong> discrim<strong>in</strong>atea full-bandwidth image from <strong>the</strong> spatially filtered versions. Thelow-<strong>to</strong>-high temporal sequence was more often mistaken for <strong>the</strong>full bandwidth presentation than <strong>the</strong> high-<strong>to</strong>-low sequence. Theseperceptual and neurophysiological results are consistent with ourf<strong>in</strong>d<strong>in</strong>gs <strong>in</strong> support of a general, temporal <strong>coarse</strong>-<strong>to</strong>-f<strong>in</strong>e <strong>process<strong>in</strong>g</strong>mechanism <strong>in</strong> <strong>the</strong> <strong>visual</strong> <strong>cortex</strong>.A model of neural connectivity that is compatible with all ofour results consists of a post-synaptic neuron that pools overmany neurons of slightly different spatial scales (some larger ando<strong>the</strong>rs smaller). All of <strong>the</strong> neurons are tuned <strong>to</strong> approximately<strong>the</strong> same optimal disparity. The pre-synaptic neurons of relativelylower disparity frequency and larger disparity size haveshorter latencies that would dom<strong>in</strong>ate <strong>the</strong> early response of <strong>the</strong>post-synaptic neuron. Pre-synaptic neurons with relatively largerdisparity range (size) form stronger connections compared <strong>to</strong><strong>the</strong> more numerous pre-synaptic neurons with smaller disparityrange. Considered <strong>to</strong>ge<strong>the</strong>r, <strong>the</strong> post-synaptic neuron performs aweighted averag<strong>in</strong>g across spatial scale, with greater and earlierweight given <strong>to</strong> <strong>coarse</strong>-<strong>to</strong>-f<strong>in</strong>e connections.The concept of weighted averag<strong>in</strong>g across spatial scale with<strong>the</strong> same optimal disparity is also consistent with <strong>the</strong>oretical andbehavioral studies. For example, it has been proposed that averag<strong>in</strong>gdisparity signals across spatial scales helps <strong>to</strong> determ<strong>in</strong>e <strong>the</strong>correct disparity, reduc<strong>in</strong>g <strong>the</strong> ambiguity <strong>in</strong>herently present <strong>in</strong>any one spatial scale 7 . Psychophysical studies that show bothf<strong>in</strong>e-<strong>to</strong>-<strong>coarse</strong> and <strong>coarse</strong>-<strong>to</strong>-f<strong>in</strong>e <strong>in</strong>teractions are also compatiblewith weighted disparity averag<strong>in</strong>g, which <strong>in</strong>corporates both typesof connections. Perceptual weighted disparity averag<strong>in</strong>g acrossspatial scales is a well-known phenomenon when <strong>the</strong> stimulusconsists of multiple disparities <strong>in</strong> <strong>the</strong> same location 24 .Our results are consistent with o<strong>the</strong>r neurophysiological studies<strong>in</strong> which <strong>the</strong> dynamics of neural tun<strong>in</strong>g have been exam<strong>in</strong>ed19,20,21 . They are also compatible with psychophysical studiesthat support a temporal <strong>coarse</strong>-<strong>to</strong>-f<strong>in</strong>e <strong>process<strong>in</strong>g</strong> system, andwith <strong>the</strong>oretical models that advocate <strong>the</strong> advantages of comb<strong>in</strong><strong>in</strong>g<strong>in</strong>formation across spatial scale. Toge<strong>the</strong>r, <strong>the</strong>se neurophysiologicalresults and <strong>the</strong> behavioral studies <strong>in</strong> stereopsissuggest that <strong>coarse</strong> spatial scales constra<strong>in</strong> f<strong>in</strong>er scales, but <strong>the</strong>reis also a role for f<strong>in</strong>e-<strong>to</strong>-<strong>coarse</strong> <strong>process<strong>in</strong>g</strong>.nature neuroscience • volume 6 no 1 • january 2003 63
articles© 2003 Nature Publish<strong>in</strong>g Group http://www.nature.com/natureneuroscienceficial respiration was ma<strong>in</strong>ta<strong>in</strong>ed with 30% O 2 and 70% N 2 O at25 breaths/m<strong>in</strong>, and <strong>the</strong> stroke volume was adjusted accord<strong>in</strong>g <strong>to</strong> <strong>the</strong>cat’s weight. All procedures complied with <strong>the</strong> National Institutes ofHealth Guide for <strong>the</strong> Care and Use of Labora<strong>to</strong>ry Animals and wereapproved by <strong>the</strong> University of California Animal Care Committee. Visualstimuli were generated by a computer with two high-resolution graphicsboards that ran cus<strong>to</strong>m software. Images were displayed on a pair ofvideo moni<strong>to</strong>rs that <strong>the</strong> cat views dichoptically by means of beam splitters(mean lum<strong>in</strong>ance, 23 cd/m 2 ). Action potentials were discrim<strong>in</strong>atedby cus<strong>to</strong>m-made software and time-stamped with 40 µs resolution.Receptive field mapp<strong>in</strong>g. The results from drift<strong>in</strong>g grat<strong>in</strong>g runs wereused <strong>to</strong> determ<strong>in</strong>e optimal stimulus parameters for receptive field mapp<strong>in</strong>gwith dichoptic, one-dimensional, b<strong>in</strong>ary m-sequence noise. Sixteenadjacent bars were presented <strong>to</strong> each eye at optimal orientation. Thewidth of <strong>the</strong> bars was approximately one-fourth <strong>the</strong> period of <strong>the</strong> optimalspatial frequency. The length of <strong>the</strong> bar was equal <strong>to</strong> sixteen times <strong>the</strong>width. This square pattern was centered over <strong>the</strong> receptive field. Each of<strong>the</strong> sixteen bars was ei<strong>the</strong>r bright or dark, and <strong>the</strong> mean lum<strong>in</strong>ance of<strong>the</strong> bars constituted <strong>the</strong> background. One stimulus pattern lasted forthree frames (39 ms).Each spike tra<strong>in</strong> was cross-correlated with <strong>the</strong> stimulus sequence ateach location of b<strong>in</strong>ocular comb<strong>in</strong>ation of stimuli (which varies <strong>in</strong> <strong>depth</strong>and position along a fron<strong>to</strong>-parallel plane) <strong>to</strong> obta<strong>in</strong> a two-dimensionalb<strong>in</strong>ocular <strong>in</strong>teraction map for a particular time delay. Excita<strong>to</strong>ry response<strong>to</strong> bars of <strong>the</strong> same contrast or of opposite contrast was represented as apositive or a negative number, respectively. The two-dimensional b<strong>in</strong>ocular<strong>in</strong>teraction maps were reduced <strong>to</strong> one-dimensional disparity tun<strong>in</strong>gdata by <strong>in</strong>tegration along l<strong>in</strong>es of equal disparity. This was repeated forall time delays of <strong>in</strong>terest (0–200 ms) <strong>in</strong> <strong>in</strong>crements of 5 ms. Time delaywas measured relative <strong>to</strong> <strong>the</strong> middle po<strong>in</strong>t <strong>in</strong> <strong>the</strong> three frame pattern. Theoptimal time delay was def<strong>in</strong>ed as that which produced <strong>the</strong> greatest rootmean squared (RMS) signal strength. The time slices that preceded andfollowed optimal by 20 ms were chosen for fur<strong>the</strong>r analysis. These timeslices were chosen because <strong>the</strong> temporal resolution of <strong>the</strong> stimulus is40 ms, and symmetrical slices on ei<strong>the</strong>r side and close <strong>to</strong> optimal yieldhigh signal-<strong>to</strong>-noise values and best represent receptive field dynamics.A detailed description of <strong>the</strong>se procedures is provided elsewhere 2–4,25 .Curve fitt<strong>in</strong>g. The disparity tun<strong>in</strong>g curves were fitted with a Gabor function:S(d) = exp(–(d – d o ) 2 /2σ s 2 )cos(2πf ds (d – d o ) + φ),where d is disparity, d o is <strong>the</strong> center position, σ s is <strong>the</strong> disparity range(size) parameter, f ds is <strong>the</strong> disparity frequency, and φ is <strong>the</strong> phase. If <strong>the</strong>rewere <strong>in</strong>sufficient spikes (<strong>the</strong> Gabor fit was not good), that neuron wasnot <strong>in</strong>cluded <strong>in</strong> <strong>the</strong> data set. The criteria for a good fit were that (i)R 2 > 0.8, where R 2 is <strong>the</strong> coefficient of determ<strong>in</strong>ation, and (ii) <strong>the</strong> disparityfrequency and disparity range parameters were well-constra<strong>in</strong>edbased on <strong>the</strong> confidence <strong>in</strong>terval provided by <strong>the</strong> Levenberg-Marquardtalgorithm 18 . These criteria are more suitable than <strong>the</strong> signal/noise ratioor <strong>the</strong> <strong>to</strong>tal quantity of spikes. The percentage changes <strong>in</strong> disparity resolution(frequency) and range (size) with correlation were calculated as[100 × (P +20ms – P –20ms )/P –20ms ]where P is ei<strong>the</strong>r a frequency or a size parameter used <strong>to</strong> measure dynamicalterations <strong>in</strong> <strong>the</strong> <strong>coarse</strong>ness of disparity tun<strong>in</strong>g. The maximum amplitudeof <strong>the</strong> signal at optimal time delay was used <strong>to</strong> normalize allamplitudes from <strong>the</strong> o<strong>the</strong>r time delays (Figs. 1 and 2). Summary data <strong>in</strong>scatter plots were fit with robust regressions, which m<strong>in</strong>imize <strong>the</strong> <strong>in</strong>fluenceof outliers 26 .Neural cross-correlation. Two or more cells were recorded from ei<strong>the</strong>r<strong>the</strong> same electrode or adjacent electrodes for which <strong>the</strong> difference <strong>in</strong> cortical<strong>depth</strong> did not exceed 500 µm. Data for this study <strong>in</strong>cludes two ormore b<strong>in</strong>ocular disparity tuned cells with similar orientation and spatialfrequency tun<strong>in</strong>g, and adjacent or overlapp<strong>in</strong>g receptive field locations.Cell pairs <strong>in</strong>cluded <strong>in</strong> <strong>the</strong> analysis had clear structure <strong>in</strong> <strong>the</strong>ir neuralcross-correlograms and were ei<strong>the</strong>r mono- or polysynaptic 27 .Disparity tun<strong>in</strong>g curves were fit with a Gabor function at optimal delayonly. Differences <strong>in</strong> <strong>the</strong> range or frequency parameters between pre- andpost-synaptic cells were normalized by <strong>the</strong> average value as follows:100 × (S post – S pre )/((S post + S pre )/2),where S is ei<strong>the</strong>r <strong>the</strong> size or frequency parameter of <strong>the</strong> pre (pre-synaptic)or post (post-synaptic) neuron. This is a measure of <strong>the</strong> magnitude of<strong>the</strong> <strong>coarse</strong>-<strong>to</strong>-f<strong>in</strong>e and f<strong>in</strong>e-<strong>to</strong>-<strong>coarse</strong> connections.All raw neural correlograms were shuffle-subtracted <strong>to</strong> elim<strong>in</strong>atestimulus-based correlations 28 . Shuffle-subtraction was obta<strong>in</strong>ed by firsttak<strong>in</strong>g <strong>the</strong> cross-correlogram between pairs of cells from all <strong>the</strong> repetitionsof a stimulus. Cross-correlation between repetitions, which can onlybe stimulus-based, were <strong>the</strong>n subtracted out. The result was a neurallybased cross-correlogram. In this study, we need <strong>to</strong> dist<strong>in</strong>guish common<strong>in</strong>put connections from those of a mono- or polysynaptic nature. Inmono- and polysynaptic connections, <strong>the</strong>re was a relatively narrow peakshifted away from zero so that one cell (e.g. spike 1) can be said <strong>to</strong> consistentlyfire before ano<strong>the</strong>r (e.g. spike 2) 27 . From this, we <strong>in</strong>fer that spike1 is presynaptic <strong>to</strong> spike 2. If <strong>the</strong> peak was broad and straddled zero, <strong>the</strong>n<strong>the</strong> pair of cells was assumed <strong>to</strong> be receiv<strong>in</strong>g a common <strong>in</strong>put 27 . Thesecategories are somewhat arbitrary, as <strong>the</strong>re is a cont<strong>in</strong>uum of <strong>in</strong>teractions.It is also possible for one cell <strong>to</strong> be pre-synaptic <strong>to</strong> ano<strong>the</strong>r while <strong>the</strong>y bothreceive common <strong>in</strong>put. Three quantitative criteria were used for elim<strong>in</strong>at<strong>in</strong>ga common <strong>in</strong>put type of cross-correlogram from <strong>the</strong> analysis. First,<strong>the</strong> correlogram asymmetry <strong>in</strong>dex [(AI = (R – L)/(R + L), where R andL are <strong>the</strong> areas of <strong>the</strong> b<strong>in</strong>s <strong>to</strong> <strong>the</strong> right and <strong>to</strong> <strong>the</strong> left of zero (by ± 5 ms,respectively)], is a measure of how much <strong>the</strong> correlogram peak was shiftedfrom zero 29 . Second, <strong>the</strong> latency of <strong>the</strong> cross-correlogram peak is <strong>the</strong> b<strong>in</strong>of maximum amplitude. Third, <strong>the</strong> width of <strong>the</strong> peak is def<strong>in</strong>ed as <strong>the</strong>width at half-maximum amplitude. Common <strong>in</strong>put connections weredef<strong>in</strong>ed as hav<strong>in</strong>g a latency of ≤5 ms and an AI of
articles© 2003 Nature Publish<strong>in</strong>g Group http://www.nature.com/natureneuroscience6. Wilson, H.R., Blake, R. & Halpern, D.L. Coarse spatial scales constra<strong>in</strong> <strong>the</strong>range of b<strong>in</strong>ocular fusion on f<strong>in</strong>e scales. J. Opt. Soc. Am. A 8, 229–236(1991).7. Fleet, D.J., Wagner, H. & Heeger, D.J. Neural encod<strong>in</strong>g of b<strong>in</strong>ocular disparity:energy models, position shifts and phase shifts. Vision Res. 36, 1839–1857(1996).8. Rohaly, A.M. & Wilson, H.R. Nature of <strong>coarse</strong>-<strong>to</strong>-f<strong>in</strong>e constra<strong>in</strong>ts onb<strong>in</strong>ocular fusion. J. Opt. Soc. Am. A 10, 2433–2441 (1993).9. Anderson, C.H. & Van Essen, D.C. Shifter circuits: a computational strategyfor dynamic aspects of <strong>visual</strong> <strong>process<strong>in</strong>g</strong>. Proc. Natl. Acad. Sci. USA 84,6297–6301 (1987).10. Nishihara, H.K. Practical real-time imag<strong>in</strong>g stereo matcher. Opt. Eng. 23,536–545 (1984).11. Nomura, M. A model for neural representation of b<strong>in</strong>ocular disparity <strong>in</strong>striate <strong>cortex</strong>: distributed representation and ve<strong>to</strong> mechanism. Biol. Cybern.69, 165–171 (1993).12. Quam, L. H. Hierarchical warp stereo. <strong>in</strong> Read<strong>in</strong>gs <strong>in</strong> Computer Vision (eds.Fischler, M.A. & Firsche<strong>in</strong>, O.) 80–86 (Kauffman, Los Al<strong>to</strong>s, California,1987).13. Smallman, H. S. F<strong>in</strong>e-<strong>to</strong>-<strong>coarse</strong> scale disambiguation <strong>in</strong> stereopsis. VisionRes. 35, 1047–1060 (1995).14. Smallman, H.S. & MacLeod, D.I. Spatial scale <strong>in</strong>teractions <strong>in</strong> stereosensitivity and <strong>the</strong> neural representation of b<strong>in</strong>ocular disparity. Perception 26,977–994 (1997).15. Sanger, T.D. Stereo disparity computation us<strong>in</strong>g gabor filters. Biol. Cybern.59, 405–418 (1988).16. Qian, N. & Zhu, Y. Physiological computation of b<strong>in</strong>ocular disparity. VisionRes. 37, 1811–1827 (1997).17. Ohzawa, I., DeAngelis, G.C. & Freeman, R.D. <strong>Stereoscopic</strong> <strong>depth</strong>discrim<strong>in</strong>ation <strong>in</strong> <strong>the</strong> <strong>visual</strong> <strong>cortex</strong>: neurons ideally suited as disparitydetec<strong>to</strong>rs. Science 249, 1037–1041 (1990).18. Press, W.H., Teukolsky, S.A., Vetterl<strong>in</strong>g, W.T. & Flannery, B.P. NumericalRecipes <strong>in</strong> C (Cambridge Univ. Press, Cambridge, UK, 1992).19. R<strong>in</strong>gach, D.L., Hawken, M.J. & Shapley, R. Dynamics of orientation tun<strong>in</strong>g <strong>in</strong>macaque primary <strong>visual</strong> <strong>cortex</strong>. Nature 387, 281–284 (1997).20. Bredfeldt, C.E. & R<strong>in</strong>gach, D.L. Dynamics of spatial frequency tun<strong>in</strong>g <strong>in</strong>macaque V1. J. Neurosci. 22, 1976–1984 (2002).21. Mazer, J.A., V<strong>in</strong>je, W.E., McDermott, J., Schiller, P.H. & Gallant, J.L. Spatialfrequency and orientation tun<strong>in</strong>g dynamics <strong>in</strong> area V1. Proc. Natl. Acad. Sci.USA 99, 1645–1650 (2002).22. Pack, C.C. & Born, R.T. Temporal dynamics of a neural solution <strong>to</strong> <strong>the</strong>aperture problem <strong>in</strong> <strong>visual</strong> area MT of macaque bra<strong>in</strong>. Nature 409,1040–1042 (2001).23. Parker, D.M., Lishman, J.R. & Hughes, J. Evidence for <strong>the</strong> view thattemporospatial <strong>in</strong>tegration <strong>in</strong> vision is temporally anisotropic. Perception 26,1169–1180 (1997).24. Rohaly, A.M. & Wilson, H.R. Disparity averag<strong>in</strong>g across spatial scales. VisionRes. 34, 1315–1325 (1994).25. DeAngelis, G.C., Ohzawa, I. & Freeman, R.D. Spatiotemporal organization ofsimple-cell receptive fields <strong>in</strong> <strong>the</strong> cat’s striate <strong>cortex</strong>. I. General characteristicsand postnatal development. J. Neurophysiol. 69, 1091–1117 (1993).26. Li, G. Robust regression. <strong>in</strong> Explor<strong>in</strong>g Data Tables, Trends and Shapes (eds.Hoagl<strong>in</strong>, D.C., Mosteller, F. & Tukey, J.W.) 281–340 (Wiley, New York, 1985).27. Moore, G.P., Segundo, J.P., Perkel, D.H. & Levitan, H. Statistical signs ofsynaptic <strong>in</strong>teraction <strong>in</strong> neurons. Biophys. J. 10, 876–900 (1970).28. Perkel, D.H., Gerste<strong>in</strong>, G.L. & Moore, G.P. Neuronal spike tra<strong>in</strong>s ands<strong>to</strong>chastic po<strong>in</strong>t processes. II. Simultaneous spike tra<strong>in</strong>s. Biophys. J. 7,419–440 (1967).29. Alonso, J.M. & Mart<strong>in</strong>ez, L.M. Functional connectivity between simple cellsand complex cells <strong>in</strong> cat striate <strong>cortex</strong>. Nat. Neurosci. 1, 395–403 (1998).30. Aertsen, A.M. & Gerste<strong>in</strong>, G.L. Evaluation of neuronal connectivity:sensitivity of cross-correlation. Bra<strong>in</strong> Res. 340, 341–354 (1985).nature neuroscience • volume 6 no 1 • january 2003 65