Economic Impacts of Viticulture and Winemaking on Employment ...
Economic Impacts of Viticulture and Winemaking on Employment ...
Economic Impacts of Viticulture and Winemaking on Employment ...

Create successful ePaper yourself
Turn your PDF publications into a flip-book with our unique Google optimized e-Paper software.
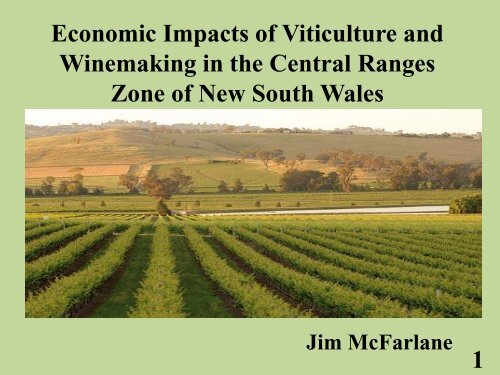
<str<strong>on</strong>g>Ec<strong>on</strong>omic</str<strong>on</strong>g> <str<strong>on</strong>g>Impacts</str<strong>on</strong>g> <str<strong>on</strong>g>of</str<strong>on</strong>g> <str<strong>on</strong>g>Viticulture</str<strong>on</strong>g> <str<strong>on</strong>g>and</str<strong>on</strong>g><str<strong>on</strong>g>Winemaking</str<strong>on</strong>g> in the Central RangesZ<strong>on</strong>e <str<strong>on</strong>g>of</str<strong>on</strong>g> New South WalesJim McFarlane1
The Central Ranges Z<strong>on</strong>e <str<strong>on</strong>g>of</str<strong>on</strong>g> NSWThe Central Ranges Z<strong>on</strong>e is a wine growing regi<strong>on</strong> inNew South Wales <strong>on</strong> the inl<str<strong>on</strong>g>and</str<strong>on</strong>g> side <str<strong>on</strong>g>of</str<strong>on</strong>g> the GreatDividing Range. It includes the formal wine regi<strong>on</strong>s<str<strong>on</strong>g>of</str<strong>on</strong>g> Cowra, Mudgee <str<strong>on</strong>g>and</str<strong>on</strong>g> Orange. 2
Grape Yields (t/ha)Farm Price($/t)Grape Yields & Prices in the Central Ranges15105Yields 11.5 12.47.4 8.102001 2006 2012 2012Yield(t/ha) Breakeven Yield$2,000$1,468 $1,331$583 $626$1,500$1,000Prices$500$02001 2006 2012 2012Average Price/t Breakeven Price 3
Milli<strong>on</strong>sHectares <str<strong>on</strong>g>of</str<strong>on</strong>g> Vines40%The Importance <str<strong>on</strong>g>of</str<strong>on</strong>g> Compiled DataAverage Vineyard Margins30%20%10%0%-10%$70$60$50$40$30$20$10$034% 33%-7%2001 2006 2012Vineyard Revenue$60 $61$21$82001 2006 2012 2012ABS EstimateTotal Revenue98008800780068005800480038005576Hectares <str<strong>on</strong>g>of</str<strong>on</strong>g> Vines7038400052232001 2006 2012 2012ABS Estimate Hectares <str<strong>on</strong>g>of</str<strong>on</strong>g> Vines 4
HectaresABS Core <strong>Employment</strong> Numbers<strong>Employment</strong>20151050<strong>Employment</strong>17.89.1 10.12001 2006 2012Hectares Per Worker8006004002000Total <strong>Employment</strong>56394561653091602001 2006 2012ABS (Full Time) Part Time 5
Milli<strong>on</strong>sMargins for Wineries$400$300$212 $297 $280Margin$200$100$0$262$156$2022001 2006 2012Wineries revenue Wineries Expenses26%28%12%2001 2006 20126
Milli<strong>on</strong>s$600$500$400$300$200$100$060%40%20%0%-20%$317<str<strong>on</strong>g>Ec<strong>on</strong>omic</str<strong>on</strong>g> <str<strong>on</strong>g>Impacts</str<strong>on</strong>g>$167$67$490$432$212 $205$121 $972001 2006 201235%21%45%Flow-<strong>on</strong> %Changes-14%-3%2001-2006 2006-2012-25%-40%Gross Output Value-Added H-Hold Income7
Milli<strong>on</strong>s$20$15$10The Industry's Flow-<strong>on</strong>SectorFlows$5$060%56%2001 2006 201247%31%50%Flow-<strong>on</strong> %Changes10%-40%2001-2006 2006-2012Other Business-17%Retail Trade-26% -25%Wholesale Trade-38%8Accommodati<strong>on</strong>, Cafes <str<strong>on</strong>g>and</str<strong>on</strong>g> Restaurants
Milli<strong>on</strong>sThe <str<strong>on</strong>g>Impacts</str<strong>on</strong>g> <str<strong>on</strong>g>of</str<strong>on</strong>g> the Aggregated Sectors$100$80$60$40$20$0Aggregated Flows70%50%30%10%2001-2006 2006-2012 2001-2012 -10%ManufacturingTrade <str<strong>on</strong>g>and</str<strong>on</strong>g> Accommodati<strong>on</strong> -30%Business Services50% 48%42%Flow-<strong>on</strong> %Changes2001-2006 2006-2012-24% -19%-28%9
<str<strong>on</strong>g>Impacts</str<strong>on</strong>g> <str<strong>on</strong>g>of</str<strong>on</strong>g> the Multipliers2001 2006 2012TOTALIMPACTSTOTALIMPACTSTOTALIMPACTSMULTIPLIERSGROSS OUTPUT<str<strong>on</strong>g>Viticulture</str<strong>on</strong>g> 1.442 1.543 1.895Wineries (net) 1.379 1.559 1.478TOTAL 1.395 1.556 1.508VALUE-ADDED<str<strong>on</strong>g>Viticulture</str<strong>on</strong>g> 0.851 0.807 0.682Wineries (net) 0.694 0.640 0.719TOTAL 0.735 0.672 0.716H-HOLD INCOME<str<strong>on</strong>g>Viticulture</str<strong>on</strong>g> 0.397 0.485 0.800Wineries (net) 0.259 0.359 0.302TOTAL 0.563 1.018 0.759EMPLOYMENT (no)<str<strong>on</strong>g>Viticulture</str<strong>on</strong>g> 13.7 14.8 16.1Wineries (net) 5.1 7.1 5.3TOTAL 7.3 8.6 6.110
Cheers11
<str<strong>on</strong>g>Impacts</str<strong>on</strong>g> <str<strong>on</strong>g>of</str<strong>on</strong>g> the Flow-<strong>on</strong> most BenefitedSectorsYears 2001 % 2006 % 2012 %/changeSector-Flow-<strong>on</strong> $'000 Change $'000 Change $'000 2001-12Other Business Services 6,942 56 15,914 -17 13,603 49Retail trade 7,670 47 14,525 -26 11,541 34Communicati<strong>on</strong> Services 4,764 57 11,153 -16 9,654 51Road Transport 4,351 59 10,585 -14 9,288 53Wholesale Trade 6,432 31 9,312 -38 6,757 5
Grapes Prices
Winery Revenuesyear cases total revenue total expenses pr<str<strong>on</strong>g>of</str<strong>on</strong>g>itin milli<strong>on</strong>s in milli<strong>on</strong>s in milli<strong>on</strong>s in milli<strong>on</strong>s2001 3.4 $212.2 $156.1 $56.12006 4.7 $297.1 $262.3 $34.62012 3.8 $279.8 $202.0 $77.7
The Aggregated Flow-<strong>on</strong> Comparis<strong>on</strong>
The Flow-<strong>on</strong> Decline in the Vineyards
Cheers