Analytical Methodology for Herbicide Orange. Volume II - Special ...
Analytical Methodology for Herbicide Orange. Volume II - Special ...
Analytical Methodology for Herbicide Orange. Volume II - Special ...

Create successful ePaper yourself
Turn your PDF publications into a flip-book with our unique Google optimized e-Paper software.
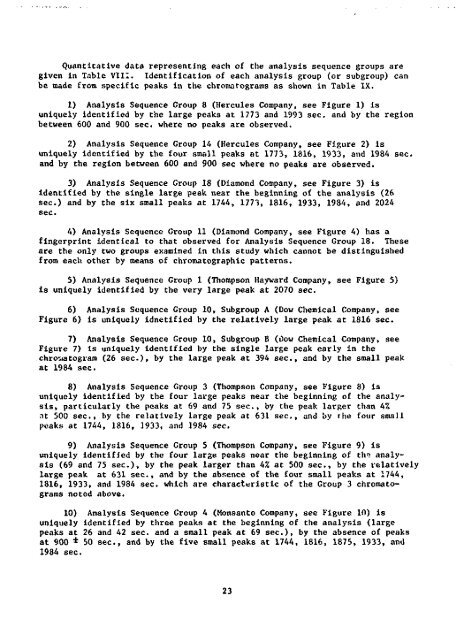
Quantitative data representing each of the analysis sequence groups aregiven in Table V<strong>II</strong>I. Identification of each analysis group (or subgroup) canbe made from specific peaks in the chromatograms as shown in Table IX.1) Analysis Sequence Group 8 (Hercules Company, see Figure 1) isuniquely identified by the large peaks at 1773 and 1993 sec. and by the regionbetween 600 and 900 sec. where no peaks are observed.2) Analysis Sequence Group 14 (Hercules Company, see Figure 2) isuniquely identified by the four small peaks at 1773, 1816, 1933, and 1984and by the region between 600 and 900 sec where no peaks are observed.sec.3) Analysis Sequence Group 18 (Diamond Company, see Figure 3) isidentified by the single large peak near the beginning of the analysis (26sec.) and by the six small peaks at 1744, 1773, 1816, 1933, 1984, and 2024sec.4) Analysis Sequence Group 11 (Diamond Company, see Figure 4) has afingerprint identical to that observed <strong>for</strong> Analysis Sequence Group 18. Theseare the only two groups examined in this study which cannot be distinguishedfrom each other by means of chromatographic patterns.5) Analysis Sequence Group 1 (Thompson Hayward Company, see Figure 5)is uniquely identified by the very large peak at 2070 sec.6) Analysis Sequence Group 10, Subgroup A (Dow Chemical Company, seeFigure 6) is uniquely idnetified by the relatively large peak at 1816 sec.7) Analysis Sequence Group 10, Subgroup B (iDow Chemical Company, seeFigure 7) is uniquely identified by the single large peak early in thechroraatograro (26 sec.), by the large peak at 394 sec., and by the small peakat 1984 sec.8) Analysis Sequence Group 3 (Thompson Company, see Figure 8) isuniquely identified by the four large peaks near the beginning of the analysis,particularly the peaks at 69 and 75 sec., by the peak larger than 4%at 500 sec., by the relatively large peak at 631 sec., and by rhe four smallpeaks at 1744, 1816, 1933, and 1984 sec.9) Analysis Sequence Group 5 (Thompson Company, see Figure 9) isuniquely identified by the four large peaks near the beginning of th=i analysis(69 and 75 sec.),, by the peak larger than 4% at 500 sec., by the relativelylarge peak at 631 sec., and by the absence of the four small peaks at 1744,1816, 1933, and 1984 sec. which are characteristic of the Group 3 chromatogramsnoted above.10) Analysis Sequence Group 4 (Monsanto Company, see Figure 10) isuniquely identified by three peaks at the beginning of the analysis (largepeaks at 26 and 42 sec. and a small peak at 69 sec.), by the absence of peaksat 900 * 50 sec., and by the five small peaks at 1744, 1816, 1875, 1933, and1984 sec.23