1. INTRODUCTION - Astro Pas Rochester
1. INTRODUCTION - Astro Pas Rochester
1. INTRODUCTION - Astro Pas Rochester

Create successful ePaper yourself
Turn your PDF publications into a flip-book with our unique Google optimized e-Paper software.
THE ASTRONOMICAL JOURNAL, 121:2095È2105, 2001 April( 200<strong>1.</strong> The American <strong>Astro</strong>nomical Society. All rights reserved. Printed in U.S.A.A COMPARISON BETWEEN Paa AND Ha EMISSION: THE RELATION BETWEEN MEAN H II REGIONREDDENING, LOCAL GAS DENSITY, AND METALLICITY1ALICE C. QUILLEN AND MIHOKO YUKITASteward Observatory, University of Arizona, 933 North Cherry Avenue, Tucson, AZ 85721-0065; aquillen=as.arizona.eduReceived 2000 August 28; accepted 2000 December 20ABSTRACTWe measure reddenings to H II regions in NGC 1512, 2903, 4449, and 6946, and M51 from HubbleSpace Telescope (HST )Paa and Ha images. Extinctions range from A D 5 to 0 depending upon thegalaxy. For the galaxies with HST images in both lines, NGC 1512, NGC V2903, and M51, the Paa andHa emission are almost identical in morphology, which implies that little emission from bright H IIregions is hidden from view by regions of comparatively high extinction. The scatter in the measuredextinctions in each galaxy is only ^0.5 mag. We compare the reddenings we measure in Ðve galaxiesusing the Paa-to-Ha ratios to those measured previously from the Balmer decrement in the Large MegallanicCloud and as a function of radius in M101 and M5<strong>1.</strong> We Ðnd that luminosity-weighted meanextinctions of these ensembles of H II regions are correlated with gas surface density and metallicity. Thecorrelation is consistent with the mean extinction depending on dust density, where the dust-to-gas massratio scales with the metallicity. This trend is expected if H II regions tend to be located near the midplaneof a gas disk and emerge from their parent molecular clouds soon after birth. In environmentswith gas densities below a few hundred solar masses per square parsec, star formation rates estimatedfrom integrated line Ñuxes and mean extinctions are likely to be fairly accurate.Key words: dust, extinction È galaxies: ISM È H II regions È infrared radiation<strong>1.</strong> <strong>INTRODUCTION</strong>It has long been suspected that H II regions tend toexhibit higher reddenings in higher metallicity environments.For example, in M101 and M51 a trend between H IIregion extinction and galactic radius was observed andinterpreted to be caused by the radial metallicity gradient inthese galaxies (Scowen, Dufour, & Hester 1992; Kennicutt& Garnett 1996; Scowen 1992). However, most studies havefound a large scatter between the extinction and metallicityin individual H II regions (McCall, Rybski, & Shields 1985;Zaritsky, Kennicutt, & Huchra 1994; Scowen et al. 1992;Kennicutt & Garnett 1996; Bresolin, Kennicutt, & Garnett1999). Even though the metallicity is fairly uniform acrossthe Large Magellanic Cloud (LMC), high values of theBalmer decrement are measured near 30 Doradus (Heydari-Mayaleri & Testor 1985; Caplan & Deharveng 1985), whichis located in a region of high gas density (Cohen et al. 1988;Luks & Rohlfs 1992). Scowen et al. (1992) discovered a fewH II regions in M101 with anomalously high extinctions atlarge galactic radii, which they attributed to higher local gasdensities in nearby spiral arms. Despite the large scatterintrinsic to ensembles of H II regions, previous studies havefound that the mean extinction of ensembles of H II regionsvaried between di†erent galaxy regions. Martin & Friedli(1999) attributed the cause of the higher mean extinctions inH II regions in barred galaxies compared with nonbarredgalaxies to the higher gas densities associated with barinducedshocks. Scowen et al. (1992) and Scowen (1992)found that mean H II region reddenings were higher at largegalactic radii than at smaller radii in both M101 and M5<strong>1.</strong>ÈÈÈÈÈÈÈÈÈÈÈÈÈÈÈ1 Based on observations with the NASA/ESA Hubble Space Telescopeobtained at the Space Telescope Science Institute, which is operated by theAssociation of Universities for Research in <strong>Astro</strong>nomy, Inc., under NASAcontract NAS 5-26555.2095If there is a trend for an ensemble of H II regions to bemore highly reddened in higher gas density or metal-richenvironments, then the star formation rate estimated from asum of recombination line (such as Ha; e.g., Kennicutt1998) Ñuxes would be underestimated in these environments.One way to quantify this e†ect is to measure extinctionstoward ensembles of H II regions in a variety ofgalactic environments. If mean H II region extinctionsdepend upon gas density and metallicity, then it might bepossible to formulate an empirical correction for the Ñux.This would allow star formation rates to be measured fromone recombination line in more heavily reddened regions. Ifsuch a trend exists, star formation rates could be more accuratelyestimated for galaxies at high redshift and observedline ratios would also yield constraints on the galaxy metallicityand gas surface density.By observing in the near-infrared it is possible to probeinto more heavily obscured regions because the nearinfraredis less a†ected by dust extinction than optical wavelengths(for examples of previous work on infraredrecombination lines, see Calzetti, Kinney, & Storchi-Bergmann 1996 and Beck, Beckwith, & Gatley 1984). Thehydrogen Paa recombination line at <strong>1.</strong>875 km is bright inthe vicinity of newly formed hot stars. It is difficult toobserve in nearby galaxies from the ground because ofstrong atmospheric absorption from water molecules. It isexpected to be about 1/8 as bright as Ha at temperaturesand densities typical of H II regions, but since it is 3 timesthe wavelength of Ha it should be less a†ected by extinction.For an H II region seen through a moderate foregrounddust screen with A D 3, Paa should be as bright as Ha.Previous studies of Paa Vimaging in galaxies include Bo ker etal. (1999) and Marconi et al. (2000).In this paper we measure Ha and Paa Ñuxes for H IIregions in the central regions of Ðve galaxies. We Ðnd thatthe scatter in A in each galaxy region is less than theV
2096 QUILLEN & YUKITAdi†erences in the mean values. Observations of distant galaxiesare restricted toward observing line emission over alarge region in the galaxy. Because of this we estimate acorrection for the Ha Ñux that is based upon summing overthe extinction-corrected Ñuxes of individual H II regions.This procedure is one way of averaging over the scatter inextinctions that have been observed in previous studies of HII regions. We then investigate the dependence of this meanextinction on local gas density and metallicity.2. OBSERVATIONSWe searched the Hubble Space Telescope (HST ) archivefor galaxies that have high-quality narrowband images inPaa and reveal a number of H II regions. The archivedimages are listed with their Ðlters in Table <strong>1.</strong> NGC 1512 andNGC 2903 have narrowband images taken by HST in bothPaa and Ha, revealing a large number of H II regions. M51also has both Paa and Ha images observed by HSTshowing numerous H II regions; however, these imagesoverlap only in a small region about 20A to the north and20A to the east of the nucleus. NGC 4449 and NGC 6946have high-quality Paa images containing numerous H IIregions but lack HST narrowband imaging in Ha. Forcomparison we used Ha Ñuxes for NGC 4449 measured byScowen (1992) and a calibrated ground-based Ha image forNGC 6946 provided by R. Kennicutt (2000, privatecommunication). NGC 2903, 4449, and 6946 were observedas part of the nearby galaxies snapshot survey (Bo ker et al.1999).The near-infrared camera and multiobject spectrometer(NICMOS) images were reduced with the NICRED datareduction software (McLeod 1997), using on-orbit darksand Ñats. The narrowband images required a pedestal correctionthat we assumed was an additional constant in eachquadrant of the chip (for more discussion on this, see Bo keret al. 1999). Wide Field Planetary Camera 2 (WFPC2)images were combined using the IRAF/STSDAS routineCOMBINE, which removed most of the cosmic-ray hits.We derived Ha and Paa line emission images by subtractingscaled continuum images from the narrowband images containingthe lines.WFPC2 images were calibrated using zero points listedin the HST Data Handbook. SpeciÐcally we used3.062 ] 10~15 and 2.941 ] 10~15 ergs cm~2 s~1/(DN s~1)for the continuum-subtracted F656N and F658N narrowbandimages, respectively, in the planetary camera ofWFPC2. The NICMOS continuum-subtracted narrowbandimages in the F187N Ðlter were calibrated using6.69 ] 10~16 and 8.27 ] 10~16 ergs cm~2 s~1/(DN s~1) forcamera 2 and camera 3, respectively, for the Paa line. TheNICMOS broadband images in the F160W Ðlter were calibratedusing 2.190 ] 10~6 and 2.776 ] 10~6 Jy/(DN s~1)for camera 2 and camera 3, respectively. The NICMOS Ñuxcalibration is 10.7% lower than that used by Bo ker et al.(1999) and is based on measurements of the standard starsP330-E and P172-D during the Servicing Mission ObservatoryVeriÐcation program and subsequent observations (M.Rieke 1999, private communication). The Ðlter widths listedin the NICMOS and WFPC2 instrument handbooks wereused to derive the calibration corrections. The location ofthe lines was near the region of maximum transmission inthe Ðlters in all cases, so no correction for Ðlter transmissionis required.To measure the Ñux of emission regions we used aperturephotometry. We identify individual regions from peaks inthe Paa line emission images. Aperture sizes were chosen tomatch the resolution of the Ha images or that of existing Haphotometry (for NGC 4449 to match that of Scowen 1992).For NGC 1512, NGC 2903, and M 51, because we hadHST imaging in both lines we were able to use very smallapertures. In all cases identical aperture positions and sizeswere used on both line emission images. Fluxes and identi-Ðed regions are listed in Tables 2È6. Positions are given withrespect to the nucleus as deÐned by the centroid at thebrightest spot in the NICMOS F160W images. The positionsof nuclei are listed in Tables 2È6. <strong>Astro</strong>metry was donewith the IRAF/STSDAS routine XY2RD from the F160Wimages and is that determined by the HST pointing.We use the Ha/Paa line ratios to estimate the extinctionto each region. We assume intrinsic Ñux ratios of F /F \ Ha Hb2.86, F /F \ 8.46 for case B recombination at a tem-Ha Paaperature of 104 K and a density of 100 cm~3 (line ratios aregiven in Osterbrock 1989) and for a Galactic extinction law(Mathis 1990). For NGC 2903 and M51 the [N II] 6584 Óline was not contained in the F656N Ðlter; however, it iscontained in the F658N image of NGC 1512. We correct forthe presence of this line in NGC 1512 and NGC 6946,assuming a Ha/(Ha ] [N II]) line ratio of 0.75 (followingthe procedure of Kennicutt 1983). We corrected for Galacticreddening using values from Schlegel, Finkbeiner, & Davis(1998).Fluxes and extinctions derived from Paa/Ha Ñux ratiosare listed in Tables 2È6. The variations in the intrinsic lineratios caused by temperature di†erences are unlikely toa†ect the measured extinctions signiÐcantly (lowering theelectron temperature by 5000 K results in a reduction ofTABLE 1HST ARCHIVAL IMAGESGalaxy Paa Continuum Ha ContinuumNGC 1512 ...... F187N/NIC2 F160W/NIC2 F658N F547MNGC 2903 ...... F187N/NIC3 F160W/NIC3 F656N F555WM51 ............. F187N/NIC3 F190N/NIC3 F656N F547MNGC 4449 ...... F187N/NIC3 F160W/NIC3 . . . . . .NGC 6946 ...... F187N/NIC3 F190N/NIC3 . . . . . .NOTES.ÈLine and continuum Ðlters on HST used to make the Paa and Ha lineemission maps shown in Figs. 1È3 and used to measure H II region intensities andline ratios listed in Tables 2È6. The near-infrared images were observed withNICMOS, and the Ðlter names are followed by the NICMOS camera used for theobservation. The pixel size for the NICMOS camera 2 (NIC2) is D0A.076 and for theNICMOS camera 3 (NIC3) is D0A.204.
TABLE 2H II REGIONS IN NGC 1512*R.A. *Decl.(J2000.0) (J2000.0) Flux Ha L Ha(arcsec) (arcsec) (10~16 ergs cm~2 s~1) F /F A (1037 ergs s~1)Paa Ha V(1) (2) (3) (4) (5) (6)<strong>1.</strong>29 ........ [6.16 36.97 0.32 <strong>1.</strong>62 13.603.65 ........ [5.79 10.83 0.40 <strong>1.</strong>98 5.223.88 ........ [5.24 18.68 0.31 <strong>1.</strong>54 6.445.42 ........ [5.09 10.21 0.41 2.01 5.025.42 ........ [4.67 14.85 0.30 <strong>1.</strong>49 4.925.93 ........ [4.71 6.67 0.52 2.42 4.467.51 ........ [<strong>1.</strong>92 2.61 0.79 3.07 2.868.28 ........ [<strong>1.</strong>54 5.41 0.36 <strong>1.</strong>82 2.317.30 ........ 2.58 4.39 0.33 <strong>1.</strong>66 <strong>1.</strong>666.76 ........ 3.22 5.35 0.39 <strong>1.</strong>92 2.465.40 ........ 4.51 12.24 0.17 0.57 2.034.72 ........ 4.41 <strong>1.</strong>75 0.55 2.51 <strong>1.</strong>253.81 ........ 4.94 3.41 0.43 2.09 <strong>1.</strong>782.48 ........ 5.40 2.53 0.90 3.28 3.27[6.47 ...... 3.95 5.92 0.52 2.41 3.93[6.76 ...... 3.57 8.11 0.63 2.70 6.75[7.52 ...... [<strong>1.</strong>59 <strong>1.</strong>46 0.88 3.25 <strong>1.</strong>84[6.61 ...... [3.26 6.48 0.75 2.99 6.70[6.58 ...... [3.27 6.27 0.79 3.07 6.89NOTES.ÈWe did aperture photometry in 0A.75 radius apertures. O†sets are given with respectto the position of the nucleus. R.A. \ 4h03m54s.131, decl. \[43¡20@56A.54 (J2000.0), as measuredfrom the HST pointing. Col. (1): O†set in R.A. from the nucleus. A positive o†set is east of thenucleus. Col. (2): O†sets in decl. from the nucleus. A positive o†set is north of the nucleus. Col.(3): Measured Ñux in Ha. Uncertainty in the sky value causes an error of about ^5% in thefaintest regions. Col. (4): Ratio of Ñux in Paa to Ha. Uncertainty in the sky value causes an errorof about ^13% in the measurement of the Paa Ñux in the faintest regions. Col. (5): A computedfrom the ratio. The distribution of extinctions is centered at A \ <strong>1.</strong>8 with a standard Vdeviationof 0.7. Col. (6): Luminosity in Ha, which has been corrected for Vextinction using A given in col.(5). We assume a distance of 9.5 Mpc (Tully 1988; H \ 75 km s~1 Mpc~1). V0TABLE 3H II REGIONS IN NGC 2903*R.A. *Decl.(J2000.0) (J2000.0) Flux Ha L Ha(arcsec) (arcsec) (10~14 ergs cm~2 s~1) F /F A (1038 ergs s~1)Paa Ha V(1) (2) (3) (4) (5) (6)[2.95 ...... 2.79 <strong>1.</strong>79 0.91 3.21 9.56[<strong>1.</strong>38 ...... 3.19 2.00 0.47 2.13 4.73[<strong>1.</strong>11 ...... 4.02 2.50 0.47 2.12 5.87[0.03 ...... 5.45 <strong>1.</strong>63 0.89 3.17 8.460.71 ........ 4.17 <strong>1.</strong>44 <strong>1.</strong>66 4.18 15.992.17 ........ 5.61 0.70 <strong>1.</strong>47 3.98 6.702.58 ........ 5.04 0.80 <strong>1.</strong>35 3.84 6.853.81 ........ 2.20 0.48 <strong>1.</strong>65 4.17 5.352.17 ........ 2.99 <strong>1.</strong>49 0.75 2.89 6.25<strong>1.</strong>97 ........ <strong>1.</strong>42 <strong>1.</strong>89 0.56 2.41 5.510.24 ........ [2.66 0.75 <strong>1.</strong>04 3.42 4.71[0.49 ...... [3.36 <strong>1.</strong>23 0.81 3.02 5.68[0.98 ...... [3.98 0.55 <strong>1.</strong>48 4.00 5.29NOTES.ÈWe did aperture photometry in 0A.469 radius apertures. O†sets are given withrespect to the position of the nucleus. R.A. \ 9h32m09s.98, decl. \]21¡30@0A.8 (2000.0), as measuredfrom the HST pointing. Col. (1): O†set in R.A. from the nucleus. A positive o†set is east ofthe nucleus. Col. (2): O†set in decl. from the nucleus. A positive o†set is north of the nucleus. Col.(3): Measured Ñux in Ha. Uncertainty in the sky value causes an error of about ^2% in thefaintest regions. Col. (4): Ratio of Ñux in Paa to Ha. Uncertainty in the sky value causes an errorof about ^4% in the measurement of the Paa Ñux in the faintest regions. Col. (5): A computedfrom the ratio. The distribution of extinctions is centered at A \ 3.3 with a standard Vdeviationof 0.7. Col. (6): Luminosity in Ha, which has been corrected for Vextinction using A given in col.(5). We assume a distance of 6.3 Mpc (Tully 1988; H \ 75 km s~1 Mpc~1). V0
2098 QUILLEN & YUKITA Vol. 121TABLE 4H II REGIONS IN NGC 4449R.A. Decl. Flux Paa L Ha(J2000.0) (J2000.0) (10~14 ergs cm~2 s~1) F Paa/F HaA V(1038 ergs s~1)(1) (2) (3) (4) (5) (6)12 28 12.08 ...... 44 05 5<strong>1.</strong>56 <strong>1.</strong>49 0.05 0.00 3.3912 28 1<strong>1.</strong>70 ...... 44 05 55.98 0.82 0.02 0.00 3.6712 28 1<strong>1.</strong>33 ...... 44 05 42.12 <strong>1.</strong>40 0.02 0.00 7.6412 28 1<strong>1.</strong>83 ...... 44 05 46.18 2.35 0.07 0.00 3.8812 28 12.93 ...... 44 05 3<strong>1.</strong>61 2.02 0.11 0.00 <strong>1.</strong>9812 28 13.68 ...... 44 05 42.98 <strong>1.</strong>18 0.07 0.00 <strong>1.</strong>9812 28 13.11 ...... 44 05 4<strong>1.</strong>44 5.28 0.29 <strong>1.</strong>43 6.0412 28 12.45 ...... 44 05 45.13 <strong>1.</strong>50 0.05 0.00 3.0912 28 13.74 ...... 44 06 10.35 2.18 0.12 0.07 2.0612 28 12.63 ...... 44 05 2<strong>1.</strong>34 <strong>1.</strong>75 0.10 0.00 2.0112 28 13.70 ...... 44 05 26.55 0.82 0.13 0.16 0.7912 28 1<strong>1.</strong>37 ...... 44 05 36.89 12.79 0.19 0.73 13.27NOTES.ÈUnits of right ascension are hours, minutes, and seconds, and units of declination aredegrees, arcminutes, and arcseconds. We did aperture photometry in 4A radius apertures to match theapertures used by Scowen (1992) to measure Ha Ñuxes. Col. (1): R.A. of emission peak as measured in thePaa image. Col. (2): Decl. of emission peak as measured in the Paa image. Col. (3): Measured Ñux in Paa.Uncertainty in the sky value causes an error of about ^11% in the measurement of the Paa Ñux in thefaintest regions. Col. (4): Ratio computed by using our Paa Ñux and the Ha Ñuxes measured by Scowen(1992) in the same region. Col. (5): A computed from the ratio. Col. (6): Luminosity in Ha, which hasbeen corrected for extinction by using VA given in col. (5). We assume a distance of 3.05 Mpc (Stewart etal. 2000).V15% in the Ha/Paa line ratio). The errors in the measuredline ratios are dominated by errors in the sky value causedby color variations that a†ect our continuum subtraction orthe uneven sky in the Paa images caused by the pedestale†ect. The photometric uncertainties are roughly estimatedin the table captions. There is an additional error in theabsolute calibration of about ^20%, which corresponds toan error of about ^0.2 in the derived A . Relative photo-Vmetric error between individual H II regions in a galaxy isabout ^0.1 mag in A for the faintest regions. The scatter,Vabout ^0.5, in A in each galaxy, is therefore likely to beVintrinsic and not caused by photometric uncertainty.When possible, we have compared our measured extinctionvalues with those reported in previous studies. Two ofthe H II regions in NGC 6946 were also studied by Hymanet al. (2000) with radio continuum and Ha observations.For the third and fourth H II region listed in Table 5 we ÐndA D 3.2, while Hyman et al. (2000) report A D 2.5 andV V3.4, respectively, in rough agreement with our estimates.Although Scowen (1992) measured a high extinction,A D 2, for many regions in NGC 4449 from his Ha and HbVnarrowband imaging, the Paa/Ha line ratios that wecompute from our Paa photometry and his Ha Ñuxessuggest that there is little internal extinction in this galaxy.However, our line ratios are consistent with the spectroscopicmeasurements of Kobulnicky, Kennicutt, & Pizagno(1999), who Ðnd Ha/Hb D 2.86, which means there is littleextinction. We suspect that there may have been an error inTABLE 5H II REGIONS IN NGC 6946*R.A. *Decl.(J2000.0) (J2000.0) Flux Paa L Ha(arcsec) (arcsec) (10~14 ergs cm~2 s~1) F /F A (1038 ergs s~1)Paa Ha V(1) (2) (3) (4) (5) (6)0.75 .......... [<strong>1.</strong>49 28.20 2.03 4.60 163.16[<strong>1.</strong>24 ....... [15.97 <strong>1.</strong>28 0.47 2.24 5.34[13.48 ...... [10.16 <strong>1.</strong>74 0.86 3.21 8.30[9.00 ....... [23.62 3.50 0.82 3.15 16.57[1<strong>1.</strong>60 ...... 2.28 2.65 0.85 3.20 12.6416.36 ........ [22.69 <strong>1.</strong>29 0.55 2.48 5.55NOTES.ÈWe did aperture photometry in 2A.7 radius apertures. O†sets are given with respect tothe position of the nucleus. R.A. \ 20h34m52s.33, decl. \]60¡09@14A.21 (J2000.0), as measuredfrom the HST pointing. Col. (1): O†set in R.A. from the nucleus. A positive o†set is east of thenucleus. Col. (2): O†set in decl. for the nucleus. A positive o†set is north of the nucleus. Col. (3):Measured Ñux in Paa. Uncertainty in the sky value causes an error of about ^11% in themeasurement of the Paa Ñux in the faintest region. Col. (4): Ratio of Ñux in Paa to Ha. Uncertaintyin the sky value causes an error of about ^15% in the measurement of the Ha Ñux in thefaintest region. Col. (5): A computed from the ratio. The distribution of extinctions is centered atA \ 2.8 with a standard Vdeviation of <strong>1.</strong>2. Col. (6): Luminosity in Ha, which has been correctedfor Vextinction by using A given in col. (5). We assume a distance of 5.5 Mpc (Tully 1988; H \ 75km s~1 Mpc~1). V 0
No. 4, 2001 Paa AND Ha EMISSION 2099TABLE 6H II REGIONS IN M51*R.A. *Decl.(J2000.0) (J2000.0) Flux Paa L Ha(arcsec) (arcsec) (10~15 ergs cm~2 s~1) F /F A (1037 ergs s~1)Paa Ha V(1) (2) (3) (4) (5) (6)0.00 ....... 0.00 12.85 0.30 <strong>1.</strong>51 5.233.29 ....... 0.39 4.99 0.51 2.38 3.88<strong>1.</strong>84 ....... [4.58 3.01 0.42 2.05 <strong>1.</strong>833.86 ....... [7.24 3.29 0.41 2.02 <strong>1.</strong>957.81 ....... [10.60 2.11 0.65 2.77 2.206.12 ....... [13.77 2.45 0.54 2.45 2.026.24 ....... [15.54 3.99 0.58 2.59 3.6212.04 ...... [26.23 3.27 0.45 2.18 2.1918.15 ...... [27.76 3.89 2.61 5.01 2<strong>1.</strong>9716.51 ...... [29.02 <strong>1.</strong>37 2.40 4.88 6.95NOTES.ÈWe did aperture photometry in 0A.41 radius apertures. O†sets are given withrespect to the Ðrst listed position. R.A. \ 13h29m54s.00, decl. \ 47¡12@11A.86 (J2000.0). Col. (1):O†set in R.A. from the Ðrst listed position. A positive o†set is east of the Ðrst position. Col. (2):O†set in decl. from the Ðrst position. A positive o†set is north of the Ðrst detected positionnucleus. Col. (3): Measured Ñux in Ha. Uncertainty in the sky value causes an error of about^4% in the measurement of the Ha Ñux in the faintest region. Col. (4): Ratio of Ñux in Paa toHa. Uncertainty in the sky value causes an error of about ^8% in the measurement of the HaÑux in the faintest region. Col. (5): A computed from the ratio. Col. (6): Luminosity in Ha,which has been corrected for extinction Vby using A given in column (5). The assumed distanceis 9.6 Mpc (Sandage & Tammann 1975). Vthe calibration of the Hb image by Scowen (1992). Ha Ñuxeslisted by Fuentes-Masip, Castan8 eda, & Mun8 oz-Tun8 o n 2000are consistent with those measured by Scowen (1992) so theHa Ñuxes measured by Scowen (1992) are sufficiently wellcalibrated. It is a concern that extinctions measured fromthe Balmer decrement might be biased by Hb absorptionpresent in the stellar component (e.g., Dufour et al. 1980).However, correcting for Hb absorption from the stellarcomponent caused no strong changes in the correlationplots Scowen (1992).2.<strong>1.</strong> Comparing Ha and Paa MorphologyIn Figures 1È3 we show the HST images for NGC 2903,NGC 1512, M 51, respectively, in both Paa and Ha lines.We found little correspondence between star clustersobserved in the broadband images and the line emissionmaps. This makes it difficult to constrain the ages of thecluster based on Paa equivalent widths. A number of starclusters were observed that were outside the region of lineemission and so could correspond to regions where radiationpressure, ionization fronts, winds, and supernovaehave cleared the clusters of gas. In NGC 1512 and NGC4449 the luminosities in Ha of the faintest regions areD1037 ergs s~1 and so similar in luminosity to the Orionnebula (Kennicutt 1984), which contains one O star. SinceH II regions cannot be much fainter than this, we suspectthat there are no deeply embedded H II regions in these twogalaxies. The faintest regions detected in NGC 2903 andM51 are an order of magnitude brighter and so couldcontain a few dozen O stars.In NGC 1512, NGC 2903, and M51, there are few qualitativedi†erences between the respective line emissionimages. In other words, almost all H II regions above thedetection limit in Paa were seen in both images. One regionstands out as an exception to the above statement. Thisregion in NGC 2903 is 0A.71 east and 4A.17 north of thenucleus (see Fig. 1) and is signiÐcantly brighter in Paa thanin Ha. From the line ratio we estimate A D 4. However, weVdid not see a peak in the Ha line image; instead the lineemission is di†use and may not be emitted from the samespatial region. Previous studies have measured large extinctionsin the nucleus of this galaxy (A D 15; Lebofsky &VRieke 1979), as well as high gas densities (Jackson et al.1991), so this region may be an example of an obscuredregion.Total Paa and Ha Ñuxes across our NGC 2903 imagesare 4.5 ] 10~13 and 5.3 ] 10~13 ergs cm~2 s~1, respectively.We can compare these values with the Bra and BrcÑuxes measured by Beck et al. (1984) in an 8A diameteraperture. We would predict Bra and Brc Ñuxes of<strong>1.</strong>53 ] 10~13 and 5.30 ] 10~14 ergs cm~2 s~1, respectively,using an A of 3.06, consistent with the Paa and Ha lineVratio across this aperture. Our estimated Bra and Brc Ñuxesare consistent with those measured by Beck et al. (1984),<strong>1.</strong>4 ^ 0.18 ] 10~13 and 3.5 ^ <strong>1.</strong>2 ] 10~14, respectively.The extinction we estimate, A D 3È4, is therefore consistentwith line Ñuxes and ratios Vmeasured by Beck et al.(1984) but substantially lower than that, A D 15, measuredfrom broad- and narrowband imaging near Vthe 10 km silicateabsorption feature (Lebofsky & Rieke 1979). Theregion identiÐed above is not bright enough (it is only 1/20the total) in Paa to dominate the total Paa emission in the8A nuclear region. Since the line ratios agree with A D 3È4,it is also unlikely that this region dominates the Bra Vemission.The total 10 km Ñux roughly corresponds to thatexpected if a moderate fraction (e.g., 1/2) of the total bolometricluminosity in the UV (needed to account for the lineemission) is reradiated by dust (Beck et al. 1984). The 10 kmemission is most likely to be emitted from the extendedregion we see in the line emission maps and not from asingle deeply embedded region. The most likely explanationfor the discrepancy between the extinctions we measure andthat estimated at 10 km is that the 10 km spectrum containsstructure from polycyclic aromatic hydrocarbon (PAH)emission that caused Lebofsky & Rieke (1979) to overestimatethe depth of the silicate absorption feature (see, for
2100 QUILLEN & YUKITAFIG. <strong>1.</strong>ÈHST images of the circumnuclear ring of NGC 2903. The Ha image was constructed from WFPC2 images. The Paa was observed withNICMOS camera 3 and constructed from F187N and F160W images. The V [H color map was constructed from the F555W and F160W images. Colorsfrom V [H \ 2.0 (white) to 3.5 (black) are shown. Axes are given in arcseconds from the nucleus. There is a bright source at 0A.71 east and 4A.17 north from thenucleus evident in the Paa image but not the Ha image.example, Siebenmorgen, Kru gel, & Zota 1999). The extinctionwe estimate near the nucleus of NGC 6946 (A D 4.6) is Valso signiÐcantly lower than that estimated by Lebofsky &Rieke (1979; A D 50). V3. COMPARISON BETWEEN GAS SURFACE DENSITY,METALLICITY, AND EXTINCTIONFor a distant galaxy we would like to derive star formationrates based on the emission-line Ñux. We thereforedesire a way to estimate the total emission in this line thatwould be emitted in the absence of extinction. In the comparisonbetween Ha and Paa images we found no evidencefor a population of bright H II regions that are extremelyred compared with the average. The scatter in A in eachgalaxy region (approximately ^0.5) is less than the Vdi†erencesin the mean values, which range from a mean A D3.3 to 0. Because the mean values span a large range, we Vareprompted to look for correlations between this value andenvironmental properties.To compare extinctions in di†erent galactic environmentswe must Ðrst compile information from the literatureon the metallicities and gas densities in the various regionsof these galaxies. These are listed in Table 7 with referencesto the literature from which they were taken. The gas densitiesare primarily taken from single-dish CO measurementswith similar aperture sizes. When necessary we havecorrected published values of CO so that we used the sameconversion factor of N(H ) \ (2.8 ] 1020 cm~2)I K km2 COs~1 (Scoville et al. 1987). The metallicities were primarilytaken from Zaritsky et al. (1994). We estimate that theuncertainties in the gas density (approximately a factor of 2)and metallicity measurements (approximately 0.3 dex) aresmaller than the variations between the measurements indi†erent galaxies and galaxy regions.We did not Ðnd a measured gas mass in NGC 1512, so weestimate the gas surface density based on the color mapmade from the broadband V (0.5 km) and H-band (<strong>1.</strong>6 km)images. We observed a change in color of *(V [H) D 0.4between the circumnuclear ring and the region interior andexterior to it. We assume that the dust is a foregroundscreen for half the light (for the bulge stars that are locatedbehind the gas). This is equivalent to assuming that thescale length of the gas is smaller than that of the stars. Thischange in color then corresponds to A D <strong>1.</strong>3 and a gassurface density in hydrogen of ; D 19 VM pc~2 [basedon the A to N(H) conversion and Hextinction _law of Mathis1990]. VWe did not Ðnd any optical spectroscopy for NGC 1512in the literature. However, we can use the correlationbetween absolute magnitude and central metallicity foundby Garnett et al. (1997) to estimate the metallicity in itscircumnuclear ring. This galaxy has an absolute magnitude
FIG. 2.ÈHST images of the circumnuclear ring of NGC 1512. The Ha image was constructed from WFPC2 images. The Paa was observed withNICMOS camera 2 and constructed from F187N and F160W images. The V [H color map was constructed from the F547M and F160W images. Colorsfrom V [H \ 2.5 (white) to 3.3 (black) are shown. Axes are given in arcseconds from the nucleus. We found no evidence for bright embedded H II regions.TABLE 7INTEGRATED PROPERTIES OF H II REGIONS, LOCAL GAS DENSITY, AND METALICITYM M H IH2Galaxy SA(Ha)T SA(Paa)T A (Ha) 12] log (O/H) (M pc~2) (M pc~2)total _ _(1) (2) (3) (4) (5) (6) (7)NGC 1512 ...... <strong>1.</strong>68 0.32 <strong>1.</strong>67 9.4 . . . 19NGC 2903 ...... 2.62 0.48 2.67 8.9 . . . 147NGC 4449 ...... 0.25 0.07 0.00 8.4 2.2 2.2NGC 6946 ...... 3.28 0.61 3.26 9.3 . . . 195M51 NE ........ 2.48 0.52 2.37 9.4 . . . 200LMC............ 0.45 . . . . . . 8.8 7 . . .NOTES.ÈValues for the mean extinctions SA(Ha)T and SA(Paa)T (deÐned in eq. [3]) were derived from thePaa Ñuxes and Paa/Ha Ñux ratios listed in Tables 2È6 for all galaxies except the LMC. This can be comparedwith the extinction estimated from the ratio of the total Paa and Ha Ñuxes, which we refer to as A (Ha). Thetotalvalue for SA(Ha)T for the LMC was estimated from the Ñuxes and Balmer decrements listed by Caplan &Deharveng (1985). Metalicities are estimated for the region covered by our images. For NGC 1512 the centralmetalicity was estimated based on its luminosity and a gas density corresponding to the extinction we observe inour color map (see text). Central metalicities for NGC 2903, M51, and NGC 6494 were estimated from gradientsand values listed by Zaritsky et al. (1994). The metalicity of NGC 4449 is that measured by Heckman et al. (1988).The gas density for the nucleus of NGC 2903 was estimated from the inclination-corrected value by Jackson et al.(1991). The gas density for NGC 6946 is that listed by Young et al. (1995) and is averaged over the NICMOScamera 3 Ðeld of view (D45A). The gas densities for NGC 4449 are estimated using an average of values listed inHunter & Thronson (1996). Gas densities for the LMC were taken from Luks & Rohlfs (1992) and Cohen et al.(1988). The molecular gas density for the northeastern position of M51 was taken from Kuno & Nakai (1997).When necessary we have corrected published values so that we used the same conversion factor, N(H )\ (2.8 ] 1020 cm~2)I Kkms~1 (Scoville et al. 1987).2CO
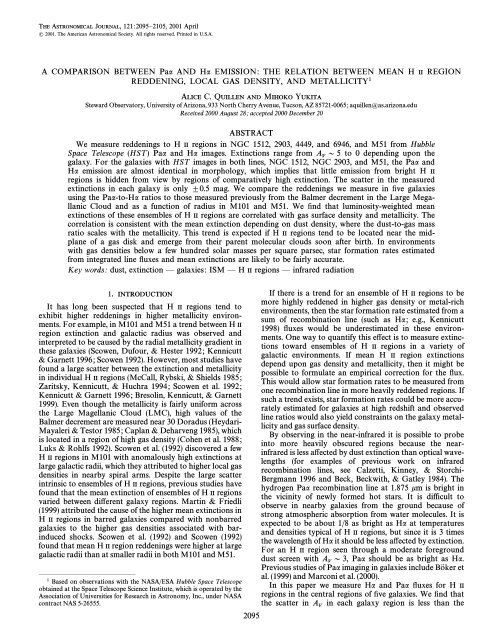
No. 4, 2001 Paa AND Ha EMISSION 210343N6946N6946N2903M51NEN2903M51NE2N1512N151210N4449LMC0.5 1 <strong>1.</strong>5 2 2.5LMCN4449N6946N6946N2903M51NEN2903M51NEN1512N1512LMCN4449LMCN4449FIG. 4.ÈTop left: Relation between the luminosity-weighted extinction and the azimuthal hydrogen gas density. NGC 1512, 2903, 4449, and 6946, theLMC, and the northeast position of M51 plotted by name. The M101 and M51 azimuthal averages are plotted as triangles and squares, respectively, in whicheach point represents an average at a di†erent radius. The dashed line shows the linear relation between A and half the gas column depth (assuming theVrelation between hydrogen column depth and extinction from Mathis 1990). We use half the gas column, assuming that the H II regions are embedded in thegas disk. The gas densities have been estimated with a CO conversion factor of N(H ) \ (2.8 ] 1020 cm~2)I K km s~1 (Scoville et al. 1987). Top right: Same2 COas top left except that we have corrected the hydrogen gas densities by using a CO conversion factor that depends on metallicity (see text for details). Bottomleft: Dependence of the luminosity-weighted extinction on metallicity only. We see this correlation in part because the regions with higher gas densitycorrespond to regions of higher metallicity. The dotted line shows the extinction predicted from a gas surface density of 10 M pc~2 and a dust-to-gas_fraction that depends on the carbon abundance. The metallicity alone is not sufficient to account for the variations in extinctions. Bottom right: Dependenceof the luminosity-weighted extinction (deÐned in eq. [3]) on estimated dust surface density. The dust surface density was estimated from the corrected gasdensities, shown in top right, by scaling with the carbon abundance (see text for details). The dashed line shows the linear relation between A and half thedust column depth. The dot-dashed line represents a two-component patchy dust model with an area Ðlling factor of 50% and an opacity ratio Vof 4. Thismodel illustrates that a patchy medium would have a lower mean extinction than that predicted directly from the dust density.estimate F . At the same time we sum the uncorrectedÑuxes to get Ha,corrF . From the ratio of F and F weestimate the correction Hafactor a that we Haneed to obtain Ha,corrtheHatrue or corrected emission from the observed total. This isconverted to a mean extinction at the wavelength of Ha bySA(H )T 4 [2.5 log a . (3)a HaA similar mean extinction can also be calculated for Paa.
2104 QUILLEN & YUKITA Vol. 121This can be compared with the extinction estimated fromthe ratio of the total Paa and Ha Ñuxes, which we refer to asA (Ha). totalWe calculate the luminosity-weighted mean extinction(deÐned above) by summing over the Paa and Ha Ñuxeslisted in Tables 2È6 for the nuclear regions of NGC 1512,2903, and 4449, M51, and NGC 6946. These mean extinctionsare listed in Table 7. We also perform these sums usingHa and Hb Ñuxes as a function of radius in M101 and M51,based on the Balmer decrement. The radial width overwhich we summed the properties of H II regions was 1 kpcfor M51 and <strong>1.</strong>5 kpc for M10<strong>1.</strong> For comparison with anadditional low-metallicity system we also derive a similarestimate for the LMC based on the Balmer decrement. Haand Hb Ñuxes for LMC H II regions were taken fromCaplan & Deharveng (1985), and we correct for Galacticextinction by using a value of A \ 0.324 (Schlegel et al.1998).BIn Table 7 we can compare SA(Ha)T with A (Ha). Thequantity SA(Ha)T allows us to correct the total totalobservedHa Ñux for reddening based on the reddenings to each H IIregion. We see a tendency for SA(Ha)T to be somewhathigher than that estimated from the line ratio of the integratedÑuxes [A (Ha)]. The di†erences are small becausetotalthe dispersion in the extinctions between individual H IIregions in each galaxy is low. A star formation rate estimatedfrom the total Ha line Ñux and corrected with anextinction based on the Ha/Paa line ratio is likely to bequite accurate.We plot our mean extinctions (deÐned in eq. [3]) versusgas density in Figure 4 (top left). As expected there is acorrelation between mean extinction and local gas density.However, some of the correlation may be due to the dependenceof the CO-to-H conversion factor on metallicity. To2take this dependence into account we correct the H by a 2factor that depends on the metallicity and display the correctedgas density in Figure 4 (top right). Our correctionassumes an increase in the conversion factor by 4.6 whenthe oxygen abundance drops by a factor of 10 (Wilson1995). Extending this relation toward metallicities largerthan solar is reasonable since galaxies with metallicitiesgreater than solar are expected to have lower conversionfactors (e.g., Nakai & Kuno 1995). The correlation betweengas density and mean extinction is not signiÐcantlychanged.It is difficult to distinguish between the role of gas densityand that of metallicity since the densest regions correspondto the most metal-rich. However, as we see in Figure 4(bottom left), metallicity alone is not sufficient to account forthe large variation in our mean extinctions.The dust density is the quantity most likely to a†ect thereddening so we desire a comparison between our extinctionvalues and the dust surface density. We can estimatethe dust surface density from the gas density using ametallicity-dependent gas-to-dust mass ratio. The gas-todustratio may correlate better with the carbon abundancethan with the oxygen abundance (Bohlin, Savage, & Drake1978; Martin, Maurice, & Lequeux 1989). To convertbetween oxygen abundance and carbon abundance we usethe relation measured by Garnett et al. [1995; log (C/O) B 0.54 log (O/H) ] <strong>1.</strong>6]. We assume that at solar metallicitythe gas-to-dust mass ratio is 120. To estimate the dustsurface density we multiply the solar dust-to-gas ratio bythe gas density and the ratio between the carbon abundancepredicted from the oxygen abundance and that at solar. Therelation between mean extinction and estimated dustdensity is shown in Figure 4 (bottom right). The dashed lineplotted in this panel corresponds to that predicted for auniform medium with the H II regions located in the middleof the dust distribution. We Ðnd that the correlations wehave seen between mean extinction, gas density, and metallicityare consistent with an approximately linear relationbetween the logarithm of the dust density and mean extinction.For the high dust densities, the mean extinctions expectedare somewhat higher than those observed. In Figure 4(bottom right) we plotted the extinction predicted if the H IIregions were in the midplane of a uniform disk. These deviationswould be predicted from a model that takes intoaccount the patchiness of the interstellar medium (ISM)(e.g., Calzetti et al. 1996). To illustrate this we have alsoplotted in the bottom right panel of Figure 4 a twocomponentpatchy dust model with an extinction ratio of 4and an area Ðlling factor of 0.5. However, such a modelwould result in a larger scatter (greater than ^0.75) in theextinctions toward individual regions than we measured. Amore realistic patchy dust model may match the extinctionand mean gas density. There could be nearby dense molecularclouds lacking H II regions that would have contributedto the mean gas density in the region but not to the H IIregion extinctions.4. SUMMARY AND DISCUSSIONIn this paper we have presented a comparative study ofPaa and Ha in the central regions of Ðve galaxies. For threegalaxies we have HST images in both lines, and the morphologiesof the respective line emission maps are remarkablysimilar. The dispersion in extinctions is about 1 magfor the H II regions in each galaxy and is smaller than thedi†erences between the mean extinctions. We Ðnd no evidencefor a population of bright heavily embedded H IIregions.Only one bright region, in NGC 2903, was detectedclearly in the Paa image and was faint or not seen in the Haimage. However this region does not dominate the Paa Ñuxof the nuclear star-forming region and is also unlikely todominate the Bra emission. This suggests that an estimateof the star formation rate based on a mean extinction andeither the Ha or Paa Ñux is likely to be fairly accurate. Wesuspect that some previous studies of the silicate absorptionfeature at 10 km may have overestimated the extinctiontoward the nuclei of NGC 2903 and NGC 6946 because ofcontamination by PAH features.We have compared mean extinctions as a function of gasdensity and metallicity and Ðnd correlations between thesequantities. The correlations between mean extinction, gasdensity, and metallicity are consistent with an approximatelylinear relation between the logarithm of the dustdensity and mean extinction. This trend is expected if theH II regions tend to be located near the midplane of a gasdisk and emerge from their parent molecular clouds soonafter birth. Radiation pressure and ionization fronts areexpected to clear a young star-forming region of dense gason a timescale of 105 yr (Ferland 1998), whereas H II regionsshould exist for a few times 106 yr. It would be unlikely todetect an H II region in a region with extinction signiÐcantlyhigher than the mean predicted from the local gas density.