Climate Action Plan - Binghamton University
Climate Action Plan - Binghamton University
Climate Action Plan - Binghamton University

You also want an ePaper? Increase the reach of your titles
YUMPU automatically turns print PDFs into web optimized ePapers that Google loves.
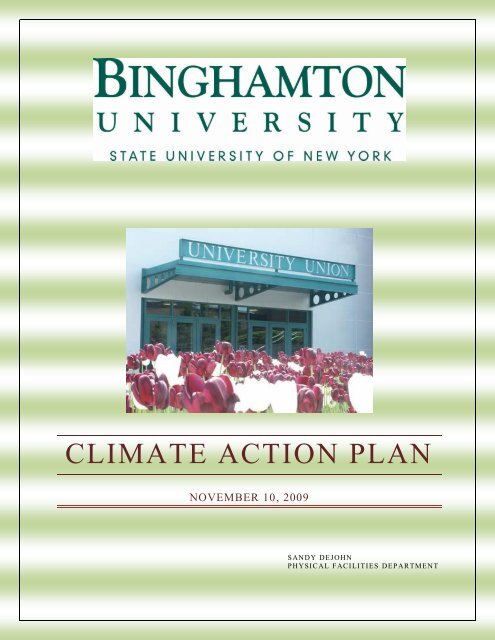
CLIMATE ACTION PLANNOVEMBER 10, 2009SANDY DEJOHNPHYSICAL FACILITIES DEPARTMENT
TABLE OF CONTENTSA Statement from President Lois B. DeFleur ................................................................................................. IAcknowledgements ...................................................................................................................................... IISection 1 – Executive Summary ..................................................................................................................... 1Section 2 – Introduction .................................................................................................................................. 5Section 3 - Campus Emissions Profile .......................................................................................................... 14Section 4 – Greenhouse Gas Mitigation Strategies ....................................................................................... 18Section 5 - Education, Research and Community Outreach ......................................................................... 25Section 6 - Financing .................................................................................................................................... 30Section 7 - Tracking Progress ....................................................................................................................... 31~ i ~
A STATEMENT FROM PRESIDENT LOIS B. DEFLEURAs a charter signatory inendorsing the AmericanCollege and <strong>University</strong>Presidents <strong>Climate</strong>Commitment, I believestrongly in working toachieve its goals. Ourentire campus isdedicated to improvingour environment andreducing our carbonfootprint. These effortsare a priority and wehave put into place anumber of initiatives toengage all of our campusconstituents – from thestudents in our residencehall to our maintenancecrews. Our successesreflect this commitmentto sustainability, and theunique role that highereducation institutions canplay in addressingsustainability issues. Wetake our responsibilityvery seriously.At <strong>Binghamton</strong><strong>University</strong>, green isn’tjust our school color, it’sa commitment to ourplanet and to futuregenerations.Lois B. DeFleurPresident~ I ~
ACKNOWLEDGEMENTSTo all the individuals who work tirelessly to keep <strong>Binghamton</strong> <strong>University</strong> moving toward a sustainablefuture, the <strong>University</strong> is already a better place because of you.Additionally, the author of this document wishes to extend her sincere gratitude to the following, and manyothers who helped shape and develop the information contained in this <strong>Climate</strong> <strong>Action</strong> <strong>Plan</strong>:(Names listed in alphabetical order)Juliet BerlingNatalie Blando-George and members of Creative WritingRick BorkowiczBonni BrennanDaniel ChambersJonathan CohenMartin CurtisSheila DoyleKatie EllisKaren FennieJoAnn NavarroSally OaksLawrence RomaMatthew SchofieldJames Van VoorstAnd members of the Task Force for Campus <strong>Climate</strong> Commitment~ II ~
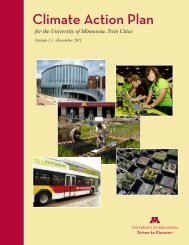
SECTION 1 – EXECUTIVE SUMMARYIn September 2007, President Lois B. DeFleur signed the American College and <strong>University</strong> Presidents<strong>Climate</strong> Commitment (ACUPCC), pledging to eliminate, over time, the greenhouse gas emissionsassociated with <strong>Binghamton</strong> <strong>University</strong>’s campus activities. Since then, a Task Force for Campus <strong>Climate</strong>Commitment was formed to identify and recommend strategies to accomplish the <strong>University</strong>’s ultimategoal: campus climate neutrality.In September 2008, <strong>Binghamton</strong> <strong>University</strong> completed and reported to ACUPCC a greenhouse gasemissions inventory to identify the emissions profile on campus. Based on the inventory results, variousoptions were explored to target major emission sources for effective reduction. This <strong>Climate</strong> <strong>Action</strong> <strong>Plan</strong> isintended to present a list of plausible options which will be developed in more depth going forward. Ouremission mitigation strategies will be shaped based on each option’s economic and technical viability aswell as educational and research values. ACUPCC recognizes that such long-term planning is subject tochanges and modifications over time. As part of our commitment, any material change to our greenhousegas mitigation strategies will be reported to ACUPCC.Our 2007-2008 greenhouse gas emissions inventory identified three significant emission contributors oncampus:· purchased electricity· on-campus heating fuels· campus commutes (students, faculty and staff)Directly Financed AirTravel1%Solid Waste4%T&D Losses3%Student Commuting10%Other On-CampusStationary39%Faculty / StaffCommuting9%Direct Transportation1%Purchased Electricity33%Refrigerants &Chemicals0%FIGURE 1 - 2007 CAMPUS EMISSIONS PROFILE~ 1 ~
This <strong>Climate</strong> <strong>Action</strong> <strong>Plan</strong> compiles our current strategies to target these large emission sources forthe most cost-effective solutions. In addition to identifying feasible options, this plan also setstarget dates for completing each project and an overall date of achieving campus climateneutrality. The target dates were set based on two primary factors:1. availability of funding for project implementation within the foreseeable planninghorizon, and2. technical and economic feasibility of each option.Table 1 below presents a list of strategies ranked based on their overall reduction potential.TargetEmissionSourceCampusHeatingPurchasedElectricityPurchasedElectricityPurchasedElectricityPurchasedElectricityCampusCommutePurchasedElectricityCampusHeatingTable 1 - Summary of proposed projectsProposed StrategiesExplore feasibility to convertcentral heating plant to 100 percentbiomass firing for either thermalproduction only, or to cogenerateelectricity.Enforce LEED silver or higherstandards on all new constructionand building renovation projects toachieve a minimum of 20 percentenergy efficiency improvement.Purchase required quantities ofrenewable energy credits forExecutive Order 111 compliance.Install 3,000 kW capacity of solarpower on campus.Continue with energy efficiencyprojects on campus includinglighting controls, variable speeddrives, low-flow fume hoods, highefficiency motors and consolidatedbuilding scheduling.Offer incentives for car pooling toreduce motor commute traffic by1,000 student vehicles and 200faculty and staff vehicles.Install 1,500 kW capacity of windgeneration on campus.Install solar thermal equipment forall domestic hot-water systems topreheat the make-up water supply.~ 2 ~CostEffectiveness($/MT eCO 2 )GHGReduction (%of Baseline)CompletionDate$150 to $170 32% to 42% 2020$4400 12% 2030$20 8% 2030$260 8% 2030$30 to $90 5% 2030$55 to $475 3% 2015$106 2% 2030$127 0.7% 2025Campus Lower high-temperature hot-water $110 0.3% 2015
We believe that the implementation of these proposed projects alone will not make emissionsreduction permanent. A fundamental change in human behavior and social values will be requiredto sustain these efforts beyond the target date. <strong>Binghamton</strong> <strong>University</strong> will strive to incorporateelements of education, research and community outreach into all these projects.~ 4 ~
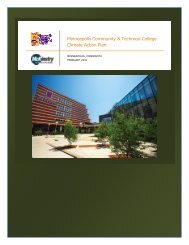
SECTION 2 – INTRODUCTIONHISTORY<strong>Binghamton</strong> <strong>University</strong> opened its doors as Triple Cities College in 1946 to serve the needs oflocal veterans returning from service in World War II. Originally located in Endicott, five mileswest of the present campus, the fledgling school was a branch of Syracuse <strong>University</strong>. Four yearslater, when the college was incorporated into the State <strong>University</strong> of New York, it was renamedHarpur College in honor of Robert Harpur, a Colonial teacher, patriot and pioneer who devotedhis later years to settling the area around <strong>Binghamton</strong>.Until 1953, Harpur College was oneof only two public liberal artscolleges in the state. In 1961, thecampus was moved across theSusquehanna River to Vestal.Growing enrollment and areputation for excellence soon led tothe selection of Harpur College asone of four doctorate-granting<strong>University</strong> Centers in the statesystem. In 1965, the campus wasformally designated the State<strong>University</strong> of New York (SUNY) at<strong>Binghamton</strong>. <strong>Binghamton</strong><strong>University</strong> was adopted as itsinformal name in 1992.CURRENT<strong>Binghamton</strong> <strong>University</strong> is located inthe Town of Vestal, N.Y., on thesouth side of the SusquehannaRiver. The campus perimeterencompasses almost 900 acres ofland, of which a large portion isFIGURE 3 - FLY-OVER VIEW OF THE MAIN CAMPUSundeveloped and in its natural state.The core of this undeveloped land isofficially designated the Nature Preserve which spans 182 acres and includes a 20-acre wetland.In 2008-2009, <strong>Binghamton</strong> <strong>University</strong> enrolled 14,898 undergraduate and graduate students andemployed approximately 2,200 full-time equivalent faculty and staff. There are 89 buildingstotaling over 5 million gross square feet of enclosed building space. The original constructiondates of the existing physical facilities range between 1958 and 2004.On-campus student housing is provided for approximately 6,700 residents. Additional students~ 5 ~
live in off-campus student housing – some 700 are within a half-mile of campus while others aremore distant. A 2009 survey conducted by the <strong>University</strong>’s Department of Geography found thatroughly 2 percent of the students are commuter students who travel as much as 160 miles eachway to the campus. The only mode of public transportation available around the tri-cities area isbus runs operated and managed by <strong>Binghamton</strong> students (Off Campus College Transport, OCCT)and by Broome County (B.C. Transit). A routing map published by the Broome CountyDepartment of <strong>Plan</strong>ning and Economic Development shows the availability of bus servicesaround the campus.<strong>Binghamton</strong><strong>University</strong>FIGURE 4 - BC TRANSIT BUS ROUTES - BROOME COUNTY DEPARTMENT OF PLANNING ANDECONOMIC DEVELOPMENTCAMPUS ENERGY USAGE PROFILEOperation of our campus requires a large amount of energy in such current forms as electricity,natural gas, propane (as a back-up fuel), wood chips and coal. A central heating plant provideshigh-temperature hot water for heating and limited cooling requirements to roughly 50 percent ofthe building space on campus. The remaining 50 percent of the buildings are equipped withnatural gas-fired boilers. The central heating plant houses four (4) stoker-type high-temperaturehot-water generators which are capable of burning wood, coal, natural gas and air propane. Thediversity of the fuel capabilities provides the campus with a unique advantage to hedge againstany single fuel price hike.~ 6 ~
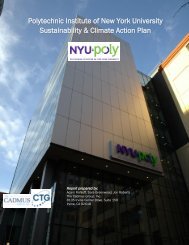
Figure 5 shows the energy consumptionprofile (on a BTU equivalent basis) for the2008-2009 fiscal year. This profile does notinclude fuels used by faculty, staff andstudents for campus commute. Because thecampus is located in the northeastern part ofthe United States, heating fuels represent asignificant portion of the energyrequirement.BU Energy Usage ProfileCoal32%Propane0%Wood6%Electric35%STATE-MANDATED ENERGY ANDENVIRONMENTAL CONSERVATION EFFORTS<strong>Binghamton</strong> <strong>University</strong>, as part of the State<strong>University</strong> of New York, is subject torequirements imposed on state agencies bythe governor and legislature. Over the years,there have been numerous executive ordersconcerning energy efficiency and preservation of the environment. Some of the key executiveorders are summarized as follows:Executive Order 111In 2001, Governor George Pataki issued Executive Order No. 111, which requires allstate agencies to:implement energy-efficiency practices for operation and maintenance of all buildings.achieve at least a 20 percent improvement in energy-efficiency performance for allnew constructions and substantial building renovation projects relative to levelsrequired by the state’s Energy Conservation Construction Code, as amended.purchase required quantities of renewable energy generated from wind, solar thermal,photovoltaic, sustainably managed biomass, tidal, geothermal, methane waste andfuel cells.enforce procurement practices for energy-efficient products with EPA’s Energy Starlabels or meeting NYSERDA’s (New York State Energy Research and DevelopmentAuthority) target energy-efficiency levels.comply with alternate-fuel vehicle requirements by replacing 100 percent gasoline- ordiesel-fueled vehicles with alternate-fuel vehicles.Executive Order 142In 2005, Governor Pataki issued Executive Order 142, mandating all state agencies toincrease the use of ethanol, bio-diesel and bio-based heating oil per compliance schedulesas established in the Order. Specifically, EO 142 requires that the total blendedequivalent consumption of bio-diesel used in state agencies and public fleets shallrepresent at least 10 percent of total diesel usage by 2012. Similarly, a minimum of 5percent bio-based heating fuels shall be used by 2012.~ 7 ~Gas27%FIGURE 5 - CAMPUS 2008-2009 ENERGY USAGEPROFILE
Building Space (Thousands of Sq. Ft)Population CountExecutive Order 4In 2008, Governor David Paterson issued Executive Order 4 to establish ―GreenProcurement‖ procedures and to specify product standards to meet all environmental andsustainability requirements as set forth in this order. Among many other requirements,EO 4 requires that, as of July 1, 2008, all copy paper, janitorial paper and other papersupplies purchased by each state agency or authority shall be composed of 100 percentpost-consumer recycled content and that all state agency and authority publications shallbe printed on 100 percent post-consumer recycled content paper.Executive Order 24In 2009, Governor Paterson issued Executive Order 24 to establish a goal to reduce statewidegreenhouse gas emissions by 80 percent of the 1990 level by the year 2050 and toestablish a <strong>Climate</strong> <strong>Action</strong> Council to prepare a <strong>Climate</strong> <strong>Action</strong> <strong>Plan</strong> for the state. Thisexecutive order by far sets the most aggressive goal to transform New York State’senergy profile.<strong>Binghamton</strong> <strong>University</strong> participates in the compliance programs for all of the executive ordersthrough the State <strong>University</strong> of New York. It is evident that many of the efforts have resulted inthe reduction of the campus’s energy consumption and solid-waste stream. Even with thecontinuing growth of the campus, both in population and building space, the <strong>University</strong> has beenable to maintain and even reduce its total energy consumption below the year 2000 level.1,000,000<strong>Binghamton</strong> <strong>University</strong> Energy Trend (mmBtu per Year)<strong>Binghamton</strong> <strong>University</strong> Growth Trend900,000800,000700,0004500400018,00017,00016,000600,000500,000400,000300,000200,000100,00002000 2003 2006On-Campus Stationary Direct Transportation Purchased Electricity Commuting35003000250020002001 2002 2003 2004 2005 2006 2007YearBuilding Space (Thousands of Sq. Ft) No. of Students Total Campus Population15,00014,00013,00012,00011,00010,000FIGURE 6 - 2000-2008 ENERGY TRENDFIGURE 7 - CAMPUS GROWTH TRENDOverall, the <strong>University</strong> has been able to negate the climate impact of its increasing campuspopulation and building space with energy-efficiency measures, the improvement of publictransportation and the introduction of renewable energy resources. To achieve the ultimate goalof climate neutrality, however, will require fundamental changes to our energy profile frombuilding operations to transportation needs.~ 8 ~
Thousand Btu / Operating $0.310.290.270.250.230.21Energy used per operatingdollar decreased from 0.30 to0.19 Btu/$ since 2000.0.190.170.152000 2002 2004 2006 2008kBtu / $kBtu / $FIGURE 6 - ENERGY USE PER OPERATING BUDGETMMBtu / Community Member Per Year4.84.64.44.24Energy used per person peryear decreased from 4.8 to 3.8million Btu since 2000.3.83.63.43.232000 2002 2004 2006 2008FIGURE 7 - ENERGY USE PER PERSONEnergy Use Per Building Square Foot (kBtu/SF)1716151413Energy used per buildingspace decreased from 16.5 to11.7 thousand Btu per squarefoot since 2000.1211102000 2002 2004 2006 2008FIGURE 8- ENERGY USE PER BUILDING SPACE~ 9 ~
CLIMATE CHANGERecent scientific studies, particularly fromthe Intergovernmental Panel on <strong>Climate</strong>Change (IPCC), have raised the awarenessof global warming due to man-made―greenhouse gases‖ which are gases in anatmosphere that absorb and emit radiationwithin the thermal infrared range. Thisprocess traps the heat within our atmosphereand is the fundamental cause of climatechange.Through the baseline emissions inventoryexercise performed in 2008, the <strong>University</strong>recognizes that the most significantgreenhouse gases generated from campusactivities are carbon dioxide (CO2),methane (CH4), nitrous oxide (N2O), hydrofluorocarbon -134a (CFC-134a), hydrochlorofluorocarbon -22 (CHFC-22) andhydro fluorocarbon -404a (CFC-404a).Their global warming potentials (GWP) ascompared to one unit of carbon dioxide(CO2) are:FIGURE 9 - TEMPERATURE AND SEA LEVELTRENDS FROM IPCC AR4 SYNTHESIS REPORT· carbon dioxide (CO2) = 1 GWP· methane (CH4) = 23 GWP· nitrous oxide (N2O) = 296 GWP· hydro fluorocarbon -134a (CFC-134a), refrigerant = 1300 GWP· hydro chlorofluorocarbon -22 (CHFC-22), refrigerant = 1700 GWP· hydro fluorocarbon -404a (CFC-404a) refrigerant = 3260 GWPOur 2007 inventory indicates that, based on operationalboundary, the campus’s gross emissions are attributable to:2007‣ Scope 1 - direct emissions from stationary combustion(boilers), campus fleet and fugitive emissions (40percent of total),‣ Scope 2 - indirect emissions from purchasedelectricity (33 percent), and‣ Scope 3 - other indirect emissions not owned orcontrolled by the <strong>University</strong> such as campus commute,air travel and solid waste (27 percent).Scope 3Scope 2Scope 1~ 10 ~FIGURE 10 - 2007 EMISSIONS BYSCOPE
ACUPCCPrompted by the clear evidence of climate change and the urgent call by the scientificcommunity to take action, President DeFleur endorsed the American College and <strong>University</strong>Presidents <strong>Climate</strong> Commitment (ACUPCC) in September 2007, pledging to eliminate, overtime, the greenhouse gas emissions associated with <strong>Binghamton</strong>’s campus activities.Shortly after signing the Commitment, President DeFleur assembled a Task Force for Campus<strong>Climate</strong> Commitment (TFCCC) comprised of members representing all parts of the campus. Shecharged each task force member with responsibilities to identify actionable items, deviseimplementation strategies, recommend the most cost-effective options, implement solutions andreport progress to her on a regular basis. The sitting members of this Task Force for the 2009-2010 year are: Chair, VP for Administration President of Student Association Deputy to the President Utility Manager, Physical Facilities <strong>University</strong> Archivist Assoc. VP for External Affairs Assoc. VP for Research Assoc. Prof. Geology/Environmental Studies Assoc. VP – Student Affairs President of Graduate Student Association Vice Provost—Academic Affairs Assoc. VP for Administrative ServicesJames VanVoorstAdam AmitTerry DeakSandy DeJohnYvonne DeligatoSheila DoyleStephen GiljeJoe GraneyLloyd HoweCagri IdimanMichael McGoffJoAnn NavarroEnergyEducationResearchTransportationStudent LifeCommunityOutreachResourceManagementDiningServices~ 11 ~
Since the formation of the TFCCC, there has been a renewed focus on many efforts that havelong been a part of the <strong>University</strong>’s culture and practice, such as: commitment to preservation of forest and native species on <strong>University</strong> property, energy-efficiency initiatives, recycling and composting efforts, promoting environmental awareness through education and community outreach, encouraging critical thinking and practical application by incorporating a ―climatecommitment‖ theme in many student projects, engaging students’ participation in energy conservation by holding an annualcontest to reduce electricity consumption, devoting research resources to renewable energy, practical applications such asflexible media for photovoltaic technologies and battery storage, ensuring that all new buildings and major renovation projects will meet the LEED(Leadership in Energy and Environmental Design) Silver or higher standard, and continuing to improve public transportation opportunities for campus commuters.TFCCC has fostered increasing inter-departmental communication and cooperation onsustainability issues by setting a common goal and assigning shared responsibilities. PresidentDeFleur has a strong belief in utilizing the skills and creativity of faculty and staff to take on allchallenges that face the <strong>University</strong>. Rather than outsourcing the sustainability efforts, membersof the TFCCC will bring forth ideas and recommendations to the Chair for approval. Approvedprojects will then be assigned to appropriate departments for implementation.Many examples of our ―green initiatives‖ can be found on our website:http://www2.binghamton.edu/campus-climate-task-forceFIGURE 11 - NATURE PRESERVE ON CAMPUSFIGURE 12 - 2009 WATSON SCHOOLSTUDENT WINDMILL PROJECT~ 12 ~
FIGURE 13 - 2009 EARTH DAY COMPOSTDISPLAYFIGURE 15 - WOOD CHIPS USED IN THECENTRAL HEATING PLANTFIGURE 14 - 2008 ENERGY-EFFICIENT LIGHTBULB EXCHANGE PROGRAMFIGURE 16 - LEED SILVER CERTIFIEDUNIVERSITY DOWNTOWN CENTERFIGURE 19 - SOLAR HOT WATER PROJECT FORSTUDENT APARTMENTSFIGURE 20 - ITC RESEARCH FACILITIES FORSOLAR TECHNOLOGIES~ 13 ~
CALCULATION TOOLSSECTION 3 - CAMPUS EMISSIONS PROFILEUsing the Clean Air - Cool <strong>Plan</strong>et (CACP) Campus Carbon Calculator© and available inputdata, the staff at <strong>Binghamton</strong> <strong>University</strong> established the emissions profile which dates back tofiscal year of 2000 –2001. All the utility billing data have been archived in the Physical FacilitiesDepartment and were used for the Scope 1 and Scope 2 inputs. The greatest challenge ingathering data was to accurately estimate the amount of campus commute among students,faculty and staff. Two surveys conducted in 2008 and 2009 by the Physical Facilities andGeological Sciences departments were used to produce the input data for the Scope 3 emissions.The 2008 survey produced a roughly 5 percent feedback rate and the 2009 survey yielded an 8percent response as compared to the entire campus population. Greater survey participation isdesirable in the future to improvethe data quality.Our 2007 greenhouse emissionsinventory identified the threelargest contributors of the<strong>University</strong>’s carbon footprint:purchased electricity, oncampusstationary (centralheating plant and other packageboilers) and campus commute(transportation).1,000,000900,000800,000700,000600,000500,000400,000300,000200,000100,000<strong>Binghamton</strong> <strong>University</strong> Energy Trend (mmBtu per Year)PURCHASED ELECTRICITYThe campus currently receives allof its electricity supply fromNew York’s power grid. UpstateNew York’s electricity supply isrelatively ―low carbon‖ due tothe amount of hydro and nuclearelectricity generation capacity.Even with the below-nationalaveragecarbon emission factors,the campus’s carbon footprintdue to electricity consumptionstill accounts for roughly onethird(1/3) of the eCO2emission.02000 2003 2006On-Campus Stationary Direct Transportation Purchased Electricity CommutingFIGURE 18 - CAMPUS ENERGY TREND 2000-2008Coal13%New York Power Grid Fuel SourcesNet Imported12%BiofuelsPetroleum Wind2%4%0%Hydro18%Nuclear26%Natural Gas25%FIGURE 17 – NEW YORK POWER MIX – DATA SOURCE: NYSERDA~ 14 ~
Cooling Degree Days (65F Base)STATIONARY COMBUSTIONApproximately 53 percent of the building space on campus is heated with thermal energysupplied by the high-temperature hot water (HTHW) produced at the Central Heating <strong>Plan</strong>t. Thisfacility traditionally used coal during higher demand periods (seven months of the year) andnatural gas when demand is low. The <strong>University</strong> recognized that coal is a significant emitter ofgreenhouse gases and started incorporating wood chips in the fuel mix in 2007 whenever solidfuel is used. Other stationary combustion sources are the natural gas-fired package boilers whichsupply building heat and hot water for the remaining parts of the campus.CAMPUS COMMUTEIn 2008-2009, the campus community included over 14,000 FTE students and roughly 2,500faculty and staff. On-campus housing, public transportation and restricted parking availabilityhelp to reduce some automobile traffic to and from the campus. Our survey results indicate thatmore than 60 percent of the campus commute is still via personal vehicles. Car-pooling hasbecome increasingly popular due to limited parking spaces available on campus. Biking andwalking will also be made easier due to the New York Greenway project to expandbicycle/pedestrian paths to develop commuting routes along the Susquehanna River and theChenango River.DECLINING EMISSIONS TRENDSince FY 2000-2001, <strong>Binghamton</strong> <strong>University</strong> hasmaintained and even reduced the total amount ofgreenhouse gas emissions associated with itscampus activities as shown in the updated graph(to include 2008 emissions) to the right.It is worth noting that in 2001-2002, the campuscarbon emissions were lower due to a warmerthan normal winter and also a much coolersummer.8000750070006500HDD and CDD Trend for <strong>Binghamton</strong>, NY65060055050045040076,00074,00072,00070,00068,00066,00064,00062,00060,00058,00056,00054,000Total Emissions (Metric TonseCO2)2000 2002 2004 2006 2008Total emissions eCO2FIGURE 19 – BU GHG EMISSIONTREND 2000-20086000550050001999 2000 2001 2002 2003 2004 2005 2006 2007 2008HDDCDD350300250200Lower heating and coolingdegree days in 2001.FIGURE 20 - HISTORIC WEATHER TREND~ 15 ~
Total Emissions per square foot (kg eCO2 / ft^2 )Total Emissions per Person ( eCO2 /Community)Emissions per Operating $ (Grams eCO2 / $)Total Emissions per Student (eCO2 / FTE)Additionally, the Central Heating <strong>Plan</strong>t used significantly more natural gas than coal that year totake advantage of the unusually low gas prices.The CACP calculator also generated the campus emission trends on a per-unit basis based onoperating budget, building space, student population and campus population. The followinggraphs show that, since 2000, the campus has reduced its ―emission factors‖ as indexed tovarious demographic bases. This was accomplished through energy conservation efforts as wellas the recent introduction of biomass fuels in the heating plant.Metric Tons eCO2 / Community membersGrams eCO2 / Operating $53304.83104.64.44.243.83.63.43.232000 2002 2004 2006 2008FIGURE 22 - EMISSIONS PER COMMUNITYMEMBER 2000-20082902702502302101901701502000 2002 2004 2006 2008FIGURE 21 - EMISSIONS PER OPERATING BUDGET2000-20081716kg eCO2 / Square Foot Building Space65.8Metric Tons eCO2 / Student Full Time Equivalent1514131211102000 2002 2004 2006 2008FIGURE 24 - EMISSIONS PER BUILDING SPACE2000-20085.65.45.254.84.64.44.242000 2002 2004 2006 2008FIGURE 23 - EMISSIONS PER STUDENT 2000-2008Since 2005, the senior Administration has been fully supportive of investing surplus utility fundsin cost-effective energy savings projects such as: installing variable speed drives for large motors on chillers, fans and pumps, changing out incandescent light fixtures with more efficient fluorescent light fixtures(T8s and T5s) throughout the campus,~ 16 ~
utilizing an automated energy management system to monitor and control buildingtemperatures based on occupancy schedule, installing occupancy and photo sensors throughout campus buildings to automaticallyturn off lights when they are not in use, and replacing old and inefficient motors with premium efficiency motors.The <strong>University</strong> also sponsors, in cooperation withstudent and community groups such as the New YorkPublic Interest Research Group (NYPIRG), an annualEnergy Conservation Contest to challenge the campusresidential communities to reduce their energyconsumption. The winning community receives aprize donated by the <strong>University</strong> as an incentive for itsefforts. This has proven to be an effective educationaltool by which students learn to change their energyusage habits and apply the experience well beyondthe end of each contest.FIGURE 25 - 2009 ENERGY CONTESTPOSTER~ 17 ~
SECTION 4 – GREENHOUSE GAS MITIGATION STRATEGIESPHILOSOPHY<strong>Binghamton</strong> <strong>University</strong> has been successful in capping and gradually reducing its greenhouse gasemissions over the past decade. To achieve climate neutrality, however, will require afundamental change in the energy sources it utilizes as well as in human behavior. To maintainaccountability for our own actions, the <strong>University</strong> reserves the option of purchasing carbonoffsets or renewable energy credits (RECs) beyond what is required under Executive Order 111.President DeFleur maintains the philosophy that, in order for the greenhouse gas reduction tobecome permanent, it is critical for the campus community to participate in this effort.Cost-effectiveness is also a key factor in determining the feasibility of emission-reductionstrategies. After picking most of the ―low-hanging fruit‖ that have less than five years ofeconomic payback period, there will be a diminishing return on remaining energy conservationand renewable energy projects. If and when the proposed cap-and-trade greenhouse emissionsmarket structure is implemented at the federal level, a value can be assigned to each ton of GHGreduced, therefore improving the project return.Finally, ACUPCC urges colleges and universities to achieve the end goal while adhering to foursustainability principals by:1. eliminating our contribution to systematic increases in concentration of substances from theearth's crust in natural systems (such as fossilized carbon, scarce metals like mercury, etc.);2. eliminating our contribution to systematic increases in concentration of substances producedby society in natural systems (such as toxic chemicals, CFCs, etc.);3. eliminating our contribution to systematic degradation of natural systems by physical means(such as deforestation, erosion, flooding, etc.); and4. eliminating our contribution to the systematic undermining of people's capacity to meet theirneeds worldwide (such as supporting companies with unfair labor practices, perpetuatingpolicies that create barriers to escaping poverty, etc.).SETTING A TARGET DATE FOR CAMPUS CLIMATE NEUTRALITYThe Intergovernmental Panel for <strong>Climate</strong> Change (IPCC) projects that global GHG emissionsneed to be reduced 50 percent to 85 percent below the 2000 level by 2050 to avoid (a highprobability of) catastrophic impacts due to global warming. President DeFleur believes that thisis a critical target date toward which the <strong>University</strong> must work to achieve climate neutrality.Intermediate target dates are also established in this <strong>Climate</strong> <strong>Action</strong> <strong>Plan</strong> to monitor projectspecific progress.MITIGATION STRATEGIESOur solutions are focused on our already identified three largest greenhouse gas contributors:purchased electricity, on-campus boilers burning fossil fuels, and campus commute.~ 18 ~
MWhElectricityEnergy Efficiency Projects- We will continue to investin energy-efficiency projectsto further reduce campuselectricity consumption.Noticeable progress hasbeen made (see graph to theright). The scope of thisproject will range fromequipment-specific upgradesto capital projects such asbuilding renovations andnew construction thatexceed New York State’sEnergy Conservation Codeby at least 20 percent.56,00055,00054,00053,00052,00051,00050,000Main Campus 12-Month Rolling Total Electricity ConsumptionStart date: 2001Target completion date:2030FIGURE 26 - ROLLING ANNUAL TOTAL ELECTRICITYCONSUMPTION TRENDRenewable Energy Credits (RECs) - We will comply with Executive Order 111 topurchase and/or produce required renewable energy credits that are generated from wind,solar thermal, photovoltaics, sustainably managed biomass, tidal, geothermal, methanewaste and fuel cells. The post-2010 compliance level is 20 percent of total electricityconsumption.Target date: based on EO 111 requirementOn-Campus Electricity Generation with Renewable Energy - A capital project isunderway to study the feasibility of a biomass cogeneration project to produce up to 50percent of the total campus electricity needs. This project will be evaluated based on theavailability of fuel(s) and economic payback which includes the generation of carbonoffsets. The primary source of wood chip supply to the campus is the byproduct of locallumber sawing operations. While this supply is currently adequate, it is not unlimited.In 2008, ten (10) Northeast and Mid-Atlantic states adopted the Regional GreenhouseGas Initiative, or RGGI, to cap carbon dioxide (CO2) emissions among power plants.Since then, there has been an increasing demand on wood chips as fuel to offset the useof coal by utility boilers. It is essential that if the <strong>University</strong> decides to proceed with thebiomass cogeneration project that we maintain vigilance in tracking our impact onregional forest management practices.Other technologies such as wind- and solar-electric generation will also be installed on~ 19 ~
campus in small increments. The cost-effectiveness of these technologies is directlycorrelated to the availability of these renewable resources. The Southern Tierunfortunately does not have the geographic advantage to effectively harvest wind andsolar energy. A wind map produced by NYSERDA (see below) illustrates the diversity inwind distribution around New York state. On a scale of 1 to 7, the <strong>Binghamton</strong> area fallsbelow 2 in wind density. Similarly for photovoltaic technologies, NYSERDA’s costestimate shows a near 80-year payback period for a commercial solar installation in thisarea. Therefore, these renewable energy projects should not be evaluated purely based ontheir economic merits but also for their values in education and research.FIGURE 27 - WIND INTSITY MAPPING, NEW YORK STATEA logical first step would be to incorporate a number of renewable energy features in allnew and renovated buildings. As efficiencies improve over time with the advancement ofvarious renewable energy technologies, the <strong>University</strong> will implement dedicatedrenewable energy projects until all campus electric demand is met without the use offossil fuels.Start date: 200950 percent mark: 2035~ 20 ~
Target completion date: 2050On-Campus Boilers100 Percent Biomass in Central Heating <strong>Plan</strong>t - The campus will continue to increasethe amount of wood chips in the heating plant to offset the use of coal. One of the optionsbeing evaluated is to convert all the boilers to be able to burn 100 percent wood chipsyear round for thermal demands. This option may be expanded to construction of abiomass cogeneration plant to produce electricity and utilize the waste heat for improvedefficiency. This option alone will offset between 31 and 42 percent of the total campusGHG emissions. Again, it is crucial to avoid causing undesirable consequences such asdeforestation with this project. Therefore, the <strong>University</strong> is taking careful steps to balancethe need for greenhouse gas reduction and eco-sustainability. To sustain long-termviability of this option, we will need to explore other renewable fuel sources that arecompatible with the type of equipment in the heating plant.Start date: 2008Intermediate project evaluation date: 2012If fuel sources are sustainable, target completion date: 2030Solar Thermal - Currently, a small-scale solar thermal system is being tested on campusto evaluate the effectiveness of the technology for domestic hot water preheating. Solarthermal technology transfers heat from the glycol solution that is heated by the sun to atank of cold water to increase the water temperature. Since heat transfer works the mosteffectively with larger temperature differential between the hot and cold fluids, thistechnology is more appropriate for heating up make-up water (nominally at 60˚F) fordomestic hot water supply rather than for building hydronic heating systems (nominallyat 125˚F return temperature). This option will not completely replace the existing naturalgas-fired boilers but can offset up to 5 percent of the total gas requirement.Start date: 200950 percent mark: 2018Target completion date: 2025Campus CommuteCar-Pool Incentive - The <strong>University</strong> Parking Services office is devising various incentiveprograms to encourage students, faculty and staff to share rides to and from campuswhenever possible. One incentive currently being offered is reserved preferred parkingspaces for multi-passenger vehicles whose program participants save on parking fees andare guaranteed premium parking locations on campus. More information on the programis available at http://parking.binghamton.edu/hov-carpool-program.htm.The <strong>University</strong> is also pursuing a contract with a company for car-sharing services. The~ 21 ~
Summaryintent is to have rental cars available on campus for hourly hires to provide car-poolersvehicles for short trips to conduct errands if so desired. Studies have shown that carsharers reduce their vehicle miles traveled and CO2 emissions by as much as 44percent. Schools utilizing car-sharing programs have also reduced the amount of trafficaround the campus. This not only benefits the campus but also the surroundingcommunities. Other less-popular options include raising the fees to park on campus andreducing the available parking space to discourage people from driving to campus ifalternate modes of transportation are available.The goal is to reduce the campus commute traffic by 1,000 student vehicles and 200faculty/staff vehicles.Start date: 2009Target completion date: 2020Installing More Bicycle Racks on Campus - Bicycle racks have been installed atstrategic locations on campus but showering facilities are not currently available in allbuildings to accommodate biking commuters’ needs. Through pursuing the LEEDcertifications on all new construction projects, additional bike shelters and showeringfacilities will be provided.Start date: 2009Target completion date: 2030Public Transportation - <strong>Binghamton</strong> <strong>University</strong> contracts with Broome County Transit(BCT) as well as Off Campus Community Transport (OCCT) for bus services. BCT hasrecently added five hybrid buses to its fleet. In addition, the <strong>University</strong> has submitted agrant proposal through the Federal Transportation Reauthorization Act for four hybridbuses for the OCCT fleet at a total cost of $2.4 million. These hybrid buses would replace30 percent of the current diesel engine fleet. The transition of our fleet from diesel tohybrid is a positive step toward achieving climate neutrality.The <strong>University</strong> has also recently conducted a survey of off-campus students to learn moreabout their travel patterns and reasons for choosing certain modes of transportation. Thestudy also allowed us to map out where each student lives off campus. This informationwill help us to redesign transportation services to provide more efficient, cost-effectiveservice that will be attractive to our off-campus students.Figure 28 shows the implementation schedule and the effect of emissions reduction of eachproject:~ 22 ~
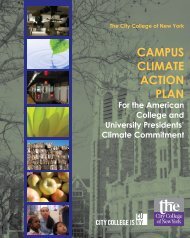
$ / MT eCO2 reduced (negative values are costs)<strong>Binghamton</strong> <strong>University</strong> GHG Projection80000700006000050000Emissions After All ReductionsReductions - Projects with Negative NPV2008EmissionReductions - Projects with Positive NPV80% Below 2000 Emissions40000300002000010000-RECs perEO111LightingControl /Upgrades100%Biomassin Heating<strong>Plan</strong>t (IfFeasible)SolarThermal,ElectricFleetSolar &WindPower2000 2010 2020 2030 2040 2050(10000)FIGURE 29 –GHG EMISSION PROJECTION WITH MITIGATION STRATEGIESCarbonOffsetsFigure 29 compares the cost-effectiveness of the projects proposed in this <strong>Climate</strong> <strong>Action</strong> <strong>Plan</strong> through2050. The X-axis represents the amount of eCO2 reduction and the Y-axis indicates the cost per metricton of eCO2 reduced. Note that certain projects such as car-pooling and building renovations will result inmany other benefits which are not captured in this cost evaluation.$500$0($500)($1,000)Replace Coal and Gas with Wood Chips in Heating <strong>Plan</strong>tRenewable Energy CertificatesBus Garage Lighting ReplacementReplace Old M otors with Energy Efficienct UnitsImpreove Boiler Efficiency On Campus by Tube Cleaning / Boiler Replacement, etc.($1,500)Car Pool Incentive for Faculty & StaffInstall Occupancy Sensors in Remaining Buildings($2,000)Outdoor Lighting ReplacementOn Campus Wind Power($2,500)Lowering HTHW Temerpature Output from Heating <strong>Plan</strong>tSolar Thermal for Domestic Hot Water Preheating($3,000)Increase Compost RateReplacement of All Light Duty Vehicles with Plug-in Electric($3,500)On Campus Solar Electric (Phtovoltaics)Car Pool Incentive for Students($4,000)($4,500)Campus Wide Building Renovation to M eet LEED Silver or Higher StandardsOffset Price: $2080% Below 2000 Emissions($5,000)0 Width of Bar = Annual Reductions (MT eCO2)25000FIGURE 28 - MITIGATION STRATEGIES COST-EFFECTIVENESS COMPARISON~ 23 ~
Table 2 summarizes the costs and effectiveness of all the mitigation strategies listed in this<strong>Climate</strong> <strong>Action</strong> <strong>Plan</strong>:TABLE 2- MITIGATION STRATEGIES PROJECT SUMMARYProject NameYearDuration(years)UnitsTotal CapitalCostAnnualReductions(MT eCO2)TotalLifetimeReductions(MT eCO2)% of StartYearEmissionsDiscountedCost perReductionRankReplace Coal and Gas with WoodChips in Heating <strong>Plan</strong>t2021 30 1 ($6,017,416) (15,735.2) (472,055.7) 33.42% $8.71 2Replace Outdoor Lighting 2015 15 290 ($145,000) (63.0) (944.5) 0.13% ($171.35) 18Replace Bus Garage Lighting 2010 20 46 ($11,500) (26.7) (533.9) 0.06% ($38.74) 7Install Occupancy Sensors inRemaining Buildings2015 15 3000 ($900,000) (748.2) (11,223.2) 1.60% ($133.71) 17Lower HTHW TemperatureOutput from Heating <strong>Plan</strong>t2015 15 1 - (136.9) (2,053.3) 0.29% $15.16 1Replace Old Motors with Energy-Efficient Units2015 15 33 ($59,400) (54.2) (812.6) 0.12% ($91.11) 12Car Pool Incentive for Students 2021 30 1000 - (807.6) (24,228.4) 1.72% ($475.86) 22Car Pool Incentive for Faculty andStaff2021 30 200 - (557.3) (16,717.6) 1.18% ($55.17) 10Increase Compost Rate 2015 15 1 - (192.4) (2,885.6) 0.41% ($179.86) 19Renewable Energy Certificates 2010 20 1E+07 - (3,730.8) (74,616.3) 8.01% ($33.40) 6Replace All Light-Duty Vehicleswith Plug-in ElectricImprove Boiler Efficiency OnCampus by Tube Cleaning / BoilerReplacement, etc.Campus-Wide BuildingRenovation to Meet LEED Silveror Higher Standards2025 30 141 ($705,000) (597.8) (17,935.1) 1.26% ($244.72) 202021 30 60 - (68.8) (2,063.4) 0.15% ($45.90) 92030 30 3E+06 ($750,000,000) (5,725.0) (171,750.1) 12.05% ($4,426.10) 23On-Campus Wind Power 2030 30 3 ($3,000,000) (980.5) (29,413.8) 2.06% ($105.86) 13On-Campus Solar Electric(Photovoltaics)2030 30 3 ($30,000,000) (3,921.8) (117,655.1) 8.26% ($258.85) 21Solar Thermal for Domestic HotWater Preheating2025 30 1 ($1,000,000) (343.9) (10,317.1) 0.73% ($127.31) 15Purchase Carbon Offsets 2050 30 15000 - (15,000.0) (450,000.0) 30.95% ($5.54) 3~ 24 ~
SECTION 5 - EDUCATION, RESEARCH AND COMMUNITYOUTREACH<strong>Binghamton</strong> <strong>University</strong> students have infinite opportunities to explore sustainability as theystudy alongside faculty who are difference-makers in the community and the world. Whilestrongly influenced by discoveries in science and engineering classrooms, sustainability is aninterdisciplinary topic not relegated to a single school, major or class. Avenues for sustainableliving and learning exist throughout the <strong>University</strong>.In the ClassroomStudent interest in the environment is growing rapidly and the Environmental StudiesProgram provides an outlet for those interested in environmental policy, environmentallaw, environmental economics, and environment and people, as well as in ecosystems,environmental chemistry and environmental earth sciences. The Department ofGeological Sciences and Environmental Studies has a separate specialization inenvironmental geology. Curriculum fosters an understanding of the relationships betweenhumans and the world around us. Critical issues examined are: global warming species extinction water contamination soil erosionThe Department of Geography touts programs in environmental and resourcemanagement and urban and regional planning, but also allows students to combine tracksof study to achieve an interdisciplinary approach to sustainability. Local projects provideopportunities for students to understand and measure the potential environmental impactsof different types of development and how to avoid or mitigate them. Topics of discoveryinclude: urban decay physical resource development environmental resource management economic sustainabilityStudents in the Thomas J. Watson School of Engineering and Applied Science haveshown such exceptional enthusiasm for sustainability that the administration is workingto implement a sustainability engineering minor to meet the students’ educational needs.Practical ApplicationsInvaluable learning also takes place in many natural learning environments. Ecologicalagriculture students use the compost organic garden as a field lab, while urban planning studentsinspect streets, buildings and homes in local neighborhoods.Our research centers — including the Center for Autonomous Solar Power (CASP), the Centerfor Integrated Watershed Studies (CIWS) and the Center for Advanced Microelectronics~ 25 ~
Manufacturing (CAMM) — are cutting edge. Whether it’s flexible solar cells, supercapacitorsfor storing solar energy, renewable energy or hydrological and geochemical examinations, ourfaculty and students are at the forefront of sustainability research.Thomas J. Watson School of Engineering and Applied Science students are putting theirsustainability ideas into action in national competitions. In 2008, they took fourth place for theirsuper-mileage car, which gets more than 1,300 miles per gallon, in a competition sponsored bythe Society of Automotive Engineers.Computer science students are getting in on the action, too. They recently teamed up with localbusinesses, taking first place by tackling issues such as geothermal heating and chemical wasteminimization as part of a national Federal Aviation Administration design competition.RESEARCHOur current research focuses on solar technology conversion efficiency, storage capabilities andpower-system cost reduction; watersheds and the human impact on them; and a 182-acre NaturePreserve that serves as our largest research laboratory.WaterEnergyAt <strong>Binghamton</strong>, we know that water is a precious resource. Our Center for IntegratedWatershed Studies conducts research on our watersheds – the regions through whichstreams and rivers flow. Whether from a biological, geological, geographic, economic orsocietal standpoint, humans and the decisions they make have a profound impact on ourwatersheds. We bring together people from all these fields to help in watershedmanagement.Our Nature Preserve underscores the <strong>University</strong>’s commitment to preserving ourwatersheds and the environment. The 182-acre site includes a 20-acre wetland andprovides hands-on opportunities as a teaching lab to faculty, students and the community.Geologists and biologists conduct research on groundwater tables, amphibians andecosystems in the Nature Preserve year round.Our researchers are on the cutting edge of fuel-cell technology, as well as breakingground in technologies to harness solar power.Fuel cells with platinum ambition - C.J. Zhong is leading a search for a platinum-basedcatalyst that could be at the heart of next-generation fuel cells. These hydrogen-poweredfuel cells work something like a conventional battery, but they never run out. The catalystplatinum turns out to be the best at speeding up the chemical reaction within hydrogenpoweredfuel cells. But platinum’s superior ability to catalyze the combination of theoxygen from the atmosphere with hydrogen is offset by economics and chemistry. SoZhong’s research has several goals: besides reducing the amount of platinum used in thecatalyst, he’s exploring how to increase its activity and stability.~ 26 ~
Batteries for the new electric economy - Energy storage is a crucial issue for thedevelopment of hybrid and electric vehicles as well as more efficient use of electricalpower sources. The <strong>University</strong>, a world leader in research on advanced batteries based onlithium, will play a key role in the development of new energy storage devices. M.Stanley Whittingham’s research focuses on developing batteries that combine highenergydensity with high charge- and discharge-rate capability.Taming computers’ need for power - <strong>Binghamton</strong>’s low-power computing group isdesigning new computer chips that use 40 to 60 percent less energy than current industrystandards, and could save millions annually in utility costs. Kanad Ghose’s research inhigh-performance computing and computer architecture has resulted in breakthroughdesigns in processor architecture, power-aware systems and high-performance computinginfrastructures. Qinru Qiu’s new work on low-power computing and dynamic powermanagement could lead to smaller computers that function more efficiently and use lessenergy. This research comes at an opportune time: Power demands have risenexponentially in the last couple of decades.Squeezing juice from the sun - The new Center for Autonomous Solar Power will helpto address the national energy crisis and lead to the establishment of companies that willcreate jobs upstate. The center, led by Seshu Desu, focuses on tapping into the sun’simmense supply of renewable energy and making it easily accessible as a flexible, largeareaand low-cost power source. The latest addition to the <strong>University</strong>’s New York StateCenter of Excellence in Small Scale Systems Integration and Packaging (S3IP), CASPwill develop thin-film solar modules. This technology mimics nature’s own energyconversionprocesses.Key to a new industrial revolution - The Center for Advanced MicroelectronicsManufacturing helps demonstrate the feasibility of roll-to-roll (R2R) electronicsmanufacturing by establishing processes that produce low-volume test-bed products.Research at the center will result in flexible, rugged, lightweight electronic componentsand innovative products that will be critical to next-generation applications in areas suchas military and homeland security, lighting, energy and power generation, displays andproduct identification and tracking. The R2R process is itself more environmentallyfriendly than traditional manufacturing methods; it also will enable numerous energyefficienttechnologies.Cool consideration of a hot issue - The Integrated Electronics Engineering Center, partof the <strong>University</strong>’s New York State Center of Excellence, is leading the way in findingnew techniques to optimize the energy efficiency of data centers. Data centers, also calledservers, process and protect vital information related to areas as diverse as financialmarkets and military institutions. This research, led by Bahgat Sammakia, will result innew designs for data centers that can be employed around the world.Going forward, <strong>Binghamton</strong> <strong>University</strong> will engage companies that are directly involved in therenewable energy technologies together with our faculty, graduate students and researchers toexplore the area of joint interest in renewable energy research. This collaboration will allow the~ 27 ~
fruits of the research efforts to be deployed much more effectively for commercial applications.COMMUNITY OUTREACH<strong>Binghamton</strong> <strong>University</strong> engages the community members on sustainability issues at variouslevels. Prominent speakers, meetings and forums are just some of many forms of our communityoutreach efforts. The following examples are other types of activities regularly taking place oncampus:Earth Day is the only event celebrated simultaneously around the globe by more thanone-billion people. Each April, it’s commemorated by an outdoor event hosted by theStudent Environmental Awareness Coalition (SEAC), offering displays and educationalactivities for the campus and community.The Go Green Institute invites the Southern Tier’s brightest seventh-graders for a 10-day, hands-on learning experience focused on a greener living environment. Studentsexplore science, math and engineering as they relate to sustainability in labs, the NaturePreserve and by visiting local organizations including BAE Systems and the BroomeCounty Landfill.Grassroots groups pair campus members with the greater community to broaden theirsustainability efforts. There are several environmental student groups including: The Student Environmental Awareness Coalition (SEAC) which sponsors eventson campus – including Earth Day – hosts speakers and movies, and provideslearning opportunities at local elementary schools and the local Discovery Center. The <strong>Binghamton</strong> Food Co-op began in the 1970s as an alternative to dining halls.This nonprofit, student-run organization offers healthy, low-cost organic produce,ingredients and personal care products for anyone interested. The student-driven Compost Organic Garden Demonstration Project aims topromote composting and organic gardening through active demonstrations. Sierra Club’s local chapter is also very active in raising awareness of allenvironmental issues, particularly in the area of global warming.Other active efforts include:The <strong>Binghamton</strong> Regional Sustainability Coalition - a source for sustainability trainingand education and a center for advocacy networking and coordination. The BRSCsponsors the Harpur Dean’s Workshop on Sustainability and is collaborating with theDepartment of Geological Sciences and Environmental Studies on a new course:Sustainability and Social Movement.<strong>Binghamton</strong> <strong>University</strong> students, faculty, staff and community members make upFriends of the Nature Preserve. This group dedicates itself to trail upkeep, habitatenhancement, guiding walks and education hikes.<strong>Binghamton</strong> <strong>University</strong> continues to develop sustainability programs that encompass the entire<strong>University</strong> and reach out to the local community. In October 2008, the <strong>University</strong> received $4~ 28 ~
million in federal funding for the Center for Autonomous Solar Power, which aims to harnessenergy from the sun and make it an easily accessible, low-cost power source. This is beingundertaken in collaboration with partners from several industries.Events such as Earth Day, Campus Clean-Up, Recyclemania, the annual residence hall energyconservation contest and more engage students in sustainability efforts, while promotion andmedia coverage of these events educates area residents.The <strong>University</strong> has also become a ―green‖ leader in Greater <strong>Binghamton</strong>, the Southern Tier andNew York state through initiatives such as transforming 85,000+ square feet of formerly pavedareas on campus into green space; installing solar-powered parking meters, low-flow plumbingfixtures and occupancy sensors throughout campus; composting thousands of pounds of wasteand recycling 90 percent of dining hall service ware; and by becoming the first SUNY institutionto install a solar hot-water system to reduce reliance on natural gas.Additionally, the <strong>University</strong> has set an example within the community and throughout the SUNYsystem by earning LEED certification for the energy-efficient design, construction and operationof two of our residence halls. These were the first SUNY residence halls and Greater<strong>Binghamton</strong> buildings to achieve this high standard. We have made a further commitment thatall new building or major renovation projects will be built to at least LEED Silver standards orthe equivalent, and our <strong>University</strong> Downtown Center, opened in August 2007, has recently beenawarded LEED Silver status.Going forward, <strong>Binghamton</strong> <strong>University</strong> will continue to bring in various experts from across thenation to present information on green efforts, sustainability, climate change and more. Theseprograms are open to students and most are also open to the general public.~ 29 ~
SECTION 6 - FINANCINGFinancing of the proposed projects will come from several sources:Capital Projects - The <strong>University</strong> will continue to advocate to the State <strong>University</strong> of NewYork for capital investment in building renovation to improve energy efficiency. The capitalinvestment will not only aid in reducing the campus’s energy consumption, it will also fuelthe local and state economies.Performance Contracts - Many large companies offer ―performance-based‖ contracts forenergy efficiency, renewable energy and cogeneration type projects. This type of financingstructure will transfer the capital burden and system performance risk to the contractors. Thecustomer will in turn make installments based on calculated savings generated with theproject.Energy Efficiency Projects - The <strong>University</strong> will continue to support using surplus utilityfunds to invest in energy-efficiency projects. This is a revolving process and as more andmore energy-efficiency improvement projects are completed, more savings will be realizedfor future investments.Renewable Energy Credits - RECs will be included in the utility budget as it is a statemandatedcost.NYSERDA Incentive Programs - the New York State Energy Research and DevelopmentAuthority (NYSERDA) collects a ―System Benefit Charge‖, part of all utility bills, whichfunds energy-efficiency and renewable-energy projects. The <strong>University</strong> is an activeparticipant in many incentive programs.Research Grants - Federal, state and other grants will be sought for our research efforts.~ 30 ~
SECTION 7 - TRACKING PROGRESSProgress will be tracked on both tangible and intangible results. The <strong>University</strong> has selected2000 as our emissions baseline since earlier records and data are scarce. All changes will becompared against the baseline year.TANGIBLE RESULTSThe following billing data and actual measurements will be used to track tangible results: purchased electricity renewable energy credits natural gas solid fuel (coal and wood chips) propane water sewer solid-waste disposal tonnage collected compost weightsTo maintain consistency of the emission data sources used in our calculations, we will continueto rely on surveys to produce campus commute data. We will conduct electronic surveys toreduce the need for paper waste.In addition to tracking total campus emissions, the Physical Facilities Department also collectssub-metering data of electricity and gas usage at individual building levels. This information isalready in EPA’s EnergyStar Portfolio Manager reporting system and has helped us understandand improve energy usage profiles of various types of buildings on campus.INTANGIBLE RESULTSProgress made in areas of education, research and community outreach will also be reported andrecorded during the Task Force meetings. The Association for the Advancement of Sustainabilityin Higher Education (AASHE) has recently launched a Sustainability Tracking, Assessment &Rating System (STARS) as a voluntary self-reporting program. STARS is designed to:‣ provide a guide for advancing sustainability in all sectors of higher education.‣ enable meaningful comparisons over time and across institutions by establishing acommon standard of measurement for sustainability in higher education.‣ create incentives for continual improvement toward sustainability.‣ facilitate information sharing about higher education sustainability practices andperformance.‣ build a stronger, more diverse campus sustainability community.The <strong>University</strong> is currently considering the level of participation in this program. With thesubstantial amount of details required for the STARS reporting system, re-allocation of existing~ 31 ~
staffing resources will be necessary in order to adequately maintain the reporting efforts. As aminimum, the <strong>University</strong> will adopt the framework of the STARS system as a measuringguideline.~ 32 ~