Climate Action Plan - Binghamton University
Climate Action Plan - Binghamton University
Climate Action Plan - Binghamton University

You also want an ePaper? Increase the reach of your titles
YUMPU automatically turns print PDFs into web optimized ePapers that Google loves.
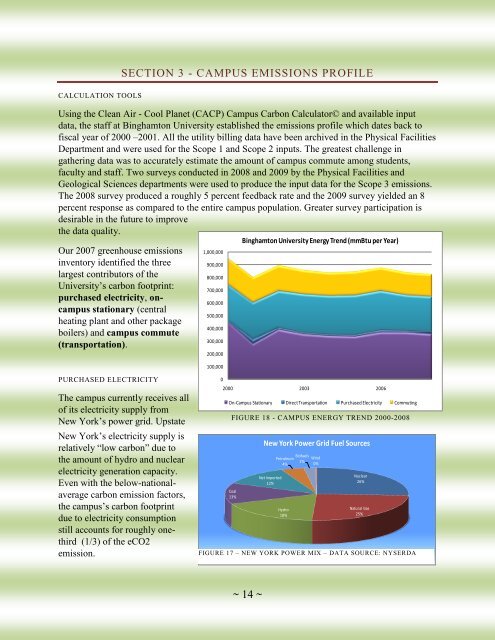
CALCULATION TOOLSSECTION 3 - CAMPUS EMISSIONS PROFILEUsing the Clean Air - Cool <strong>Plan</strong>et (CACP) Campus Carbon Calculator© and available inputdata, the staff at <strong>Binghamton</strong> <strong>University</strong> established the emissions profile which dates back tofiscal year of 2000 –2001. All the utility billing data have been archived in the Physical FacilitiesDepartment and were used for the Scope 1 and Scope 2 inputs. The greatest challenge ingathering data was to accurately estimate the amount of campus commute among students,faculty and staff. Two surveys conducted in 2008 and 2009 by the Physical Facilities andGeological Sciences departments were used to produce the input data for the Scope 3 emissions.The 2008 survey produced a roughly 5 percent feedback rate and the 2009 survey yielded an 8percent response as compared to the entire campus population. Greater survey participation isdesirable in the future to improvethe data quality.Our 2007 greenhouse emissionsinventory identified the threelargest contributors of the<strong>University</strong>’s carbon footprint:purchased electricity, oncampusstationary (centralheating plant and other packageboilers) and campus commute(transportation).1,000,000900,000800,000700,000600,000500,000400,000300,000200,000100,000<strong>Binghamton</strong> <strong>University</strong> Energy Trend (mmBtu per Year)PURCHASED ELECTRICITYThe campus currently receives allof its electricity supply fromNew York’s power grid. UpstateNew York’s electricity supply isrelatively ―low carbon‖ due tothe amount of hydro and nuclearelectricity generation capacity.Even with the below-nationalaveragecarbon emission factors,the campus’s carbon footprintdue to electricity consumptionstill accounts for roughly onethird(1/3) of the eCO2emission.02000 2003 2006On-Campus Stationary Direct Transportation Purchased Electricity CommutingFIGURE 18 - CAMPUS ENERGY TREND 2000-2008Coal13%New York Power Grid Fuel SourcesNet Imported12%BiofuelsPetroleum Wind2%4%0%Hydro18%Nuclear26%Natural Gas25%FIGURE 17 – NEW YORK POWER MIX – DATA SOURCE: NYSERDA~ 14 ~