4.Area-Wide Mating Disruption of Codling Moth in New York
4.Area-Wide Mating Disruption of Codling Moth in New York
4.Area-Wide Mating Disruption of Codling Moth in New York

You also want an ePaper? Increase the reach of your titles
YUMPU automatically turns print PDFs into web optimized ePapers that Google loves.
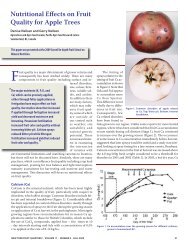
tion flight start<strong>in</strong>g on Aug 4, peak<strong>in</strong>g onAug 25. Based on trap activity <strong>in</strong> the area,us<strong>in</strong>g the trap threshold <strong>of</strong> 5 moths accumulatedper trap, we would recommendDelegate or Rynaxypyr (Altacor or VoliamXpress) for the second generation. Weneeded to <strong>in</strong>tegrate the control <strong>of</strong> otherpests <strong>in</strong>clud<strong>in</strong>g leafrollers and apple maggotlater <strong>in</strong> the season.Other pests were controlled as neededus<strong>in</strong>g other <strong>in</strong>secticides <strong>in</strong>clud<strong>in</strong>g chlorpyrifospre-bloom, Proclaim, and pyrethroids.In 2010, to prevent economicdamage from apple maggot with reduced<strong>in</strong>secticide use, we hung maggot traps<strong>in</strong> early July around the perimeter <strong>of</strong> orchards<strong>in</strong> areas <strong>of</strong> high risk.Fruit Evaluations: Fruit damage assessmentswere made <strong>in</strong> July to evaluatecontrol <strong>of</strong> the first generation. Fruit damagewas evaluated at harvest by pick<strong>in</strong>g 50apples from the top and 50 from the bottomfrom each <strong>of</strong> 5 trees scattered acrossthe <strong>in</strong>dividual blocks <strong>of</strong> fruit by variety.We evaluated 15,000 to 18,000 apples eachyear for damage from various <strong>in</strong>sect pests.ResultsTrap Counts: Tables 1 and 2 summarizethe seasonal total CM and OFM adultscaught per trap for 2008-2010 for variouslure types. In 2008, seasonal total <strong>of</strong>150 CM were caught per trap. Trap shutdown <strong>in</strong> 2009 was significantly improvedcompared to 2008. The comparable lure,CM 10X, caught only 11 moths for the seasonalper trap total compared to 150 theprevious year – a 92% reduction. The nonmat<strong>in</strong>gdisruption counts were reducedfrom 2008 levels by only 58%. There wasalso a reduction <strong>in</strong> the total moth catch<strong>in</strong> the non-mat<strong>in</strong>g disruption sites dueto the plume effect downw<strong>in</strong>d. Researchreported by Casado (2010) at UC-Berkeleyshowed suppression <strong>of</strong> CM male capturesdownw<strong>in</strong>d <strong>in</strong> a plume 250 ft. wide by 900feet long from a s<strong>in</strong>gle Puffer.Table 2 illustrates the relatively lowpressure <strong>of</strong> OFM <strong>in</strong> the disrupted areabut it rema<strong>in</strong>s a significant pest wherenot disrupted. As OFM pheromone was<strong>in</strong>corporated <strong>in</strong> the whole disrupted area<strong>in</strong> 2010, OFM trap catch was essentiallyshut down us<strong>in</strong>g mat<strong>in</strong>g disruption asillustrated <strong>in</strong> Figure 5. In 2008-09, onlythe 10-20 acres <strong>of</strong> Long View S/Hilltopmoths per trap <strong>in</strong>cluded OFM pheromone for mat<strong>in</strong>g disruption.The CM trap data plotted <strong>in</strong> Figure 6 us<strong>in</strong>g CM10X lures illustratesthe poor trap shutdown us<strong>in</strong>g the sprayable pheromones.Trap counts us<strong>in</strong>g CM10X lures clearly exceeded the 5 CM perFigure 5. 2010 OFM trap catch is essentially elim<strong>in</strong>ated under mat<strong>in</strong>g disruption.# <strong>Moth</strong>s per Trap60.050.040.030.020.010.00.08-May15-May22-May29-MayFigure 6. 2008 CM weekly trap catch us<strong>in</strong>g CM10X lures and sprayable pheromones.moths per trap 7.0 6.0 5.0 4.0 3.0 2.0 1.0 0.0 4.5 4 3.5 3 2.5 2 1.5 1 0.5 0 26-‐Apr 3-‐May 10-‐May 16-‐Apr 23-‐Apr 30-‐Apr Average RME OFM Trap Catch 2010 17-‐May 24-‐May 31-‐May 7-‐Jun 14-‐Jun 21-‐Jun Figure 6. Average CM Trap Catch, 2008NEW YORK FRUIT QUARTERLY . VOLUME 18 . NUMBER 4 . WINTER 2010 215-JunFigure 7. 2010 trap data for CM us<strong>in</strong>g CM-DA Combo lures.12-Jun19-Jun7-‐May 14-‐May 21-‐May 28-‐May 4-‐Jun 11-‐Jun 26-Jun3-JulFigure 7. CM DA Trap Catch 2010 10-Jul17-Jul24-Jul31-Jul7-AugOverall Avg OFM Apple Hill OFM Longview OFM HillTop Fruit Farm OFM McKeon's Fruit Farm 28-‐Jun 5-‐Jul 12-‐Jul 19-‐Jul 26-‐Jul 2-‐Aug 9-‐Aug 16-‐Aug 23-‐Aug 30-‐Aug 6-‐Sep 13-‐Sep 14-AugApple Hill - CM10XLong View N - CM10XLong View S - CM10XMcKeon Fruit Farm - CM10XCheck NW - no MD, std CM lureCheck E - no MD, std CM lureCheck NE - no MD, std CM luretrap threshold for 9-11 weeks dur<strong>in</strong>g the grow<strong>in</strong>g season <strong>in</strong> 2008us<strong>in</strong>g sprayable pheromones. These growers only applied a total<strong>of</strong> 4 or 5 Checkmate CM-F sprays for the season leav<strong>in</strong>g longperiods without saturat<strong>in</strong>g the orchard with pheromone <strong>in</strong> 2008.21-Aug28-Aug4-Sep20-‐Sep 27-‐Sep 4-‐Oct 11-‐Oct 11-SepApple Hill CM-‐DA Longview CM-‐DA HillTop CM-‐DA McKeon's Fruit Farm CM-‐DA 18-Sep18-‐Jun 25-‐Jun 2-‐Jul 9-‐Jul 16-‐Jul 23-‐Jul 30-‐Jul 6-‐Aug 13-‐Aug 20-‐Aug 27-‐Aug 3-‐Sep 10-‐Sep 17-‐Sep 24-‐Sep 1-‐Oct 8-‐Oct
But after implement<strong>in</strong>gmore stable saturation<strong>of</strong> the area us<strong>in</strong>g Puffers <strong>in</strong>2009 and 2010, the scale <strong>of</strong>Figure 7 was significantlyreduced from a peak flight<strong>of</strong> 38 moths <strong>in</strong> early August<strong>of</strong> 2008 to 4 <strong>in</strong> August <strong>of</strong>2010 us<strong>in</strong>g CM-DA Combolures. Trap counts <strong>in</strong> 2010never exceeded the threshold.However, we cont<strong>in</strong>uedto see 3 dist<strong>in</strong>ct flight peakseven under low pressure:the “A” and “B” peaks <strong>of</strong> themoth emergence from theoverw<strong>in</strong>tere<strong>in</strong>g larvae andthe second generation flight<strong>in</strong> August. The “B” peak(Breth, 2009) is the mostcommon area <strong>of</strong> weakness<strong>in</strong> control programs lead<strong>in</strong>gto fruit damage.Insecticide Use andCost: Table 4 shows thecost <strong>of</strong> pheromones and <strong>in</strong>secticidesper acre target<strong>in</strong>g<strong>in</strong>ternal lep pests. Table 5shows the number <strong>of</strong> <strong>in</strong>secticideapplications target<strong>in</strong>g<strong>in</strong>ternal leps. In 2008, pheromonesadded $100-120 peracre and still required 5-6<strong>in</strong>secticides the first seasonFigure 8. St<strong>in</strong>g damage from <strong>in</strong>ternal lep, less than1/8 <strong>in</strong>ch deep, either newly hatched larva orlarva died after penetrat<strong>in</strong>g sk<strong>in</strong>.Table 3.<strong>in</strong> this heavy pressure site. In 2008, growers spent nearly $300/acre manag<strong>in</strong>g CM and OFM. The <strong>in</strong>secticide choices <strong>in</strong> 2008were changed from organophosphates (OPs) and pyrethroidsused <strong>in</strong> 2007, to more costly neonicot<strong>in</strong>oids and Delegate.In 2009, growers reduced <strong>in</strong>secticide applications to 3-4,reduc<strong>in</strong>g material costs to control CM to $216-250 per acre. Thecosts were not reduced significantly s<strong>in</strong>ce new classes <strong>of</strong> <strong>in</strong>secticidesare more expensive than older OP’s and pyrethroids, butmore effective. In 2010, growers were able to reduce the number<strong>of</strong> <strong>in</strong>secticides target<strong>in</strong>g codl<strong>in</strong>g moth to one per generation.Fruit Damage Evaluation: Table 3 shows the overall fruitdamage caused by <strong>in</strong>ternal lep pests as the sum <strong>of</strong> % deep andst<strong>in</strong>g damage and the % <strong>of</strong> apples with larvae detected. In 2008,there was 0.7% deep feed<strong>in</strong>g, 1.8% st<strong>in</strong>g damage, and 0.3% worms<strong>in</strong> fruit compared to >12% damage and 5% larvae <strong>in</strong> fruit <strong>in</strong> 2007.In 2009, there was essentially no deep feed<strong>in</strong>g detected, 0.1% st<strong>in</strong>gdamage, and <strong>in</strong> all <strong>of</strong> the 18,000 apples, one worm was detectedand identified as OFM (which was not under pheromone disruption).The pressure <strong>in</strong> 2009 was not as high as 2008 due to thecool, wet weather <strong>in</strong>terfer<strong>in</strong>g with CM mat<strong>in</strong>g activity, howevera sprayed orchard without mat<strong>in</strong>g disruption <strong>in</strong> the region had12% lep damage and 2.6% worms detected <strong>in</strong>dicat<strong>in</strong>g sufficientpressure requir<strong>in</strong>g control measures. The conditions for CMactivity were excellent <strong>in</strong> 2010; the unsprayed orchard had 29%fruit damage and 13% fruit were <strong>in</strong>fested with larvae at harvest.Economic Risk: An Excel Workbook was developed toTotal % <strong>in</strong>ternal lep damage (deep and st<strong>in</strong>gs) and % fruit with larvae.Figure 9. Deep feed<strong>in</strong>g penetrat<strong>in</strong>g more than 1/8 <strong>in</strong>chdeep <strong>of</strong>ten reach<strong>in</strong>g the seed cavity <strong>in</strong>dicat<strong>in</strong>gsuccessful larval development.2008 2009 2010Treatment Farm % Damage % Worms % Damage % Worms % Damage % Worms<strong>Mat<strong>in</strong>g</strong> Apple Hill 2.7 0.38 0.2 0.02 0.2 0.09<strong>Disruption</strong> LongView N 1.4 0.04 0 0 0.2 0.12Lonview S/Hilltop 2.5 0.27 0.1 0 0.1 0McKeon 2.9 0.33 0 0 0 0Non-Disrupted South East 0.8 0 0 0 0 0North East 1.6 0 0 0 nd ndNorth 19 8 3.6 0 0.6 0Non-Disrupted Unsprayed nd nd nd nd 29 13.4assess the economic risks and benefits <strong>of</strong> us<strong>in</strong>g mat<strong>in</strong>g disruptionus<strong>in</strong>g partial budget analysis. Us<strong>in</strong>g mat<strong>in</strong>g disruption toimprove control <strong>of</strong> <strong>in</strong>ternal lep pests <strong>in</strong>creased cash <strong>in</strong>flow dueto <strong>in</strong>creased fruit value, <strong>in</strong>creased cash outflow with the cost <strong>of</strong>additional pheromones, and decreased cash outflow by limit<strong>in</strong>gthe time and energy used to manage wormy truckloads <strong>of</strong>fruit. Partial Budget Analysis showed that mat<strong>in</strong>g disruption isan economically feasible solution for growers who divert 5-10%<strong>of</strong> fruit from juice grade to regular and premium grade appleson 50 acres <strong>of</strong> premium varieties at $12.5-13 per cwt. In thiscircumstance, the grower <strong>in</strong>creased available cash to a 50-acreoperation <strong>in</strong> the range <strong>of</strong> $319-17,500 for a s<strong>in</strong>gle year <strong>of</strong> mat<strong>in</strong>gdisruption plus proper <strong>in</strong>secticide choice and tim<strong>in</strong>g. <strong>Mat<strong>in</strong>g</strong>disruption is economically feasible if:• implemented <strong>in</strong> moderate to high pressure orchards thattypically susta<strong>in</strong> 5-10% damage.• used <strong>in</strong> orchards with moderate to high yield <strong>of</strong> 750-1200bushels per acre.• used <strong>in</strong> orchards with high value apples with a regularvs. premium price <strong>of</strong> $12.50-13.00 per cwt (100 lbs.).This partial budget analysis predicts that if apple prices areless than $11 per cwt, the high <strong>in</strong>secticide plus pheromone costs<strong>in</strong> the first year to clean up the population will not break even orresult <strong>in</strong> more cash available. In order to be economically feasibleafter the first year, the cost <strong>of</strong> the pheromone and <strong>in</strong>secticidesmust decrease <strong>in</strong> order to break even s<strong>in</strong>ce the biggest <strong>in</strong>crease22 NEW YORK STATE HORTICULTURAL SOCIETY
<strong>in</strong> returns due tothe improvement<strong>in</strong> fruit qualityand value will onlybe significant <strong>in</strong>the first season.However, growersmight considerthe <strong>in</strong>crease <strong>in</strong>fruit value derivedfrom the first seasonas a resourceavailable to carrythe cost <strong>of</strong> pheromonesthroughsubsequent seasonsuntil the problem isrectified.Table 4.Pheromone plus <strong>in</strong>secticide costsSpray costs 2008 2009 2010Apple Hill 290 217 182Long View 253 217 172Hilltop FF --- --- 163McKeon FF 290 217 178Table 5. Insecticide applications target<strong>in</strong>gcodl<strong>in</strong>g moth*Orchard 2008 2009 2010Apple Hill 6 3 2Long View 6 3 2Hilltop FF --- --- 2McKeon FF 6 3 2*some sprays are not <strong>in</strong>cluded <strong>in</strong> this evaluations<strong>in</strong>ce they were target<strong>in</strong>g other pests <strong>in</strong>clud<strong>in</strong>g PC,OBLR, WAA, and Apple Maggot.This project has demonstrated that if mat<strong>in</strong>g disruption isimplemented on a multi-year basis, <strong>in</strong>secticides target<strong>in</strong>g forCM can be applied at tim<strong>in</strong>gs recommended for “low” pressureorchards with one spray per generation. This project and othertrials have demonstrated that pheromone application rates canbe reduced by 25% <strong>in</strong> some cases. The <strong>in</strong>secticide <strong>in</strong>puts shouldonly be reduced if there was no damage to fruit detected dur<strong>in</strong>gthe previous harvest, and no damage is detected from the firstgeneration as determ<strong>in</strong>ed by monitor<strong>in</strong>g <strong>of</strong> fruit damage <strong>in</strong> July.Monitor<strong>in</strong>g moth activity with traps is still critical <strong>in</strong> decid<strong>in</strong>gthe <strong>in</strong>tensity <strong>of</strong> <strong>in</strong>secticide applications for these pests.ConclusionsLabor availability and pest pressure are the biggest factors <strong>in</strong>choos<strong>in</strong>g a pheromone dispenser type. In our project, traps werenot zeroed for most <strong>of</strong> the 2008 season due to: 1) <strong>in</strong>consistentsaturation <strong>of</strong> the orchards with pheromone, 2) the tendency <strong>of</strong>growers to wait until they detected significant CM flight beforethey applied pheromones, and 3) the delay <strong>in</strong> wait<strong>in</strong>g until an<strong>in</strong>secticide was scheduled. Growers also experienced ra<strong>in</strong>fall remov<strong>in</strong>gthe sprayable pheromone residue. Sprayable pheromoneshave been successful <strong>in</strong> other areas with more frequent applicationbut require much more management to achieve control <strong>of</strong> thispest complex. Better control <strong>of</strong> CM activity was obta<strong>in</strong>ed us<strong>in</strong>gmore stable dispenser types <strong>of</strong> pheromone <strong>in</strong>clud<strong>in</strong>g the Puffertechnology and the hand applied dispensers such as Isomate TTCM/OFM.This project has been successful <strong>in</strong> reduc<strong>in</strong>g trap catch signify<strong>in</strong>greduced moth activity. When pheromones are used <strong>in</strong> comb<strong>in</strong>ationwith effective <strong>in</strong>secticides and the proper spray tim<strong>in</strong>g, wehave shown a significant reduction <strong>in</strong> pest damage. Overall, us<strong>in</strong>gmat<strong>in</strong>g disruption <strong>in</strong> theory will result <strong>in</strong> less mat<strong>in</strong>g, fewer eggs,and fewer eggs hatch<strong>in</strong>g prevent<strong>in</strong>g the st<strong>in</strong>g and deep damage.S<strong>in</strong>ce this pest builds from generation to generation, from year toyear <strong>in</strong> the orchard, control strategies will need to be <strong>in</strong>tensifiedas the problem exceeds an economic threshold. But as the pestdamage is reduced to a very low level, these pests likely can betreated as a background pest with less <strong>in</strong>tensive management andcost required. The value <strong>of</strong> mat<strong>in</strong>g disruption is clear <strong>in</strong> clean<strong>in</strong>gup high pressure orchards that susta<strong>in</strong> more than 5% fruit damageus<strong>in</strong>g a comb<strong>in</strong>ation <strong>of</strong> mat<strong>in</strong>g disruption and well-timed<strong>in</strong>secticide applications.It is difficult to measure the economic value <strong>of</strong> a grower’sreputation for wormy apples, and how that might impact hisability to ma<strong>in</strong>ta<strong>in</strong> a market for fruit. It is also difficult to measurethe management time <strong>in</strong> pick<strong>in</strong>g around worm-damaged applesat harvest to avoid fruit rejections or downgrad<strong>in</strong>g quality. Onlytime will tell if mat<strong>in</strong>g disruption pheromones will cont<strong>in</strong>ue to beused for the pest management. Under high pest pressure, and withthe potential <strong>of</strong> <strong>in</strong>secticide resistance to new <strong>in</strong>secticides, mat<strong>in</strong>gdisruption is a very effective tool to manage <strong>in</strong>ternal lep pests.Literature CitedAgnello, A.M. and Reissig, W.H. 2009. Mechanically AppliedPheromone Products for <strong>Mat<strong>in</strong>g</strong> <strong>Disruption</strong> <strong>of</strong> <strong>Codl<strong>in</strong>g</strong><strong>Moth</strong> and Oriental Fruit <strong>Moth</strong> <strong>in</strong> Apples. <strong>New</strong> <strong>York</strong> FruitQuarterly 17:1.Breth, D.I. 2009. Test<strong>in</strong>g the “PETE” Insect Development PredictionModel to Limit the Resurgence <strong>of</strong> <strong>Codl<strong>in</strong>g</strong> <strong>Moth</strong> <strong>in</strong>Apples. <strong>New</strong> <strong>York</strong> Fruit Quarterly 17:2.Breth, D.I. 2010. Clean<strong>in</strong>g up <strong>in</strong>ternal leps <strong>in</strong> area-wide mat<strong>in</strong>gdisruption project. Abstract <strong>in</strong> 2010 Empire State Fruit andVegetable EXPO Page 4-6.Casado, D. et.al. 2010. Understand<strong>in</strong>g <strong>Mat<strong>in</strong>g</strong> disruption byaerosol puffers: trap suppression, mat<strong>in</strong>g delay, and matef<strong>in</strong>d<strong>in</strong>g. Abstracts <strong>of</strong> the 84 th Annual Western Orchard Pestand Disease management Conference Page 31.AcknowledgementsWe gratefully acknowledge the technical help <strong>of</strong> Elizabeth Teeand Ron Faro, Program Assistants for CCE-Lake Ontario FruitTeam and Michael Burlee, Crop Protection Services. We alsoacknowledge the support <strong>of</strong> the participat<strong>in</strong>g growers and <strong>of</strong> ArtAgnello, Pr<strong>of</strong>essor, Department <strong>of</strong> Entomology, Cornell Universityand Matt Wells, Dr. Pepper Snapple Group, Mott’s. Thisproject was supported by USDA/NIFA under Award Number2007-49200-03888.Debbie Breth is a senior extension associate and team leader<strong>of</strong> the Lake Ontario Fruit Program <strong>of</strong> Cornell CooperativeExtension who specializes <strong>in</strong> <strong>in</strong>tegrated pest management.Alison DeMarree is a an extension educator with the LakeOntario Fruit Program <strong>of</strong> Cornell Cooperative Extension whospecializes <strong>in</strong> Economics and Farm Bus<strong>in</strong>ess Management.Art Agnello is a research and extension pr<strong>of</strong>essor <strong>in</strong> theDept. <strong>of</strong> Entomology at Geneva who leads Cornell’s applepest management program. Liz Tee is a extension programassistant who works with Debbie Breth.NEW YORK FRUIT QUARTERLY . VOLUME 18 . NUMBER 4 . WINTER 2010 23
Refrigerated andVentilated Systems forYour Fruit and VegetableStorages• COMMERCIAL REFRIGERATION• DESIGN, SALES AND SERVICE• SERVING AGRICULTURE FOR OVER 30 YEARSFree Consultation and QuoteCall Mike Mager at 585-343-267875YearsS<strong>in</strong>ce 1932TheBestBerryPlants• Strawberries, raspberries, blueberries,blackberries, gooseberries and more!• Where the pros go for plans and plants.• Call for a free catalog andplasticulture guide!REFRIGERATION CO. OF BATAVIA26 Cedar Street, Batavia, NY 14020www.arcticrefrigeration.com41 River RoadSouth DeerfieldMassachusetts 01373www.noursefarms.com 413.665.265824 NEW YORK STATE HORTICULTURAL SOCIETY