Homelessness in Minnesota 2009 - Amherst H. Wilder Foundation
Homelessness in Minnesota 2009 - Amherst H. Wilder Foundation
Homelessness in Minnesota 2009 - Amherst H. Wilder Foundation

Create successful ePaper yourself
Turn your PDF publications into a flip-book with our unique Google optimized e-Paper software.
<strong>Homelessness</strong> <strong>in</strong>M<strong>in</strong>nesota <strong>2009</strong>Results of the <strong>Wilder</strong> statewide surveyO C T O B E R 2 0 1 0
<strong>Homelessness</strong> <strong>in</strong> M<strong>in</strong>nesota <strong>2009</strong>Results of the <strong>Wilder</strong> statewide surveyOctober 2010Prepared by:<strong>Wilder</strong> Research451 Lex<strong>in</strong>gton Parkway NorthSa<strong>in</strong>t Paul, M<strong>in</strong>nesota 55104651-280-2700www.wilderresearch.org
adult respondents had a total of 2,211 children with them, and 607 of them were also with aspouse or partner on the date of the study.The youth section of this report describes the characteristics of homeless unaccompaniedm<strong>in</strong>ors ages 17 and under, as well as young adults ages 18 through 21. We conducted<strong>in</strong>terviews with 133 unaccompanied m<strong>in</strong>ors ages 17 and under, <strong>in</strong>clud<strong>in</strong>g 56 <strong>in</strong> temporaryhous<strong>in</strong>g programs and 77 <strong>in</strong> non-shelter locations. These m<strong>in</strong>ors had a total of 17 childrenand 11 partners with them. In addition, we conducted <strong>in</strong>terviews with 684 young adultsages 18 through 21, <strong>in</strong>clud<strong>in</strong>g 363 <strong>in</strong> temporary hous<strong>in</strong>g programs and 321 <strong>in</strong> non-shelterlocations. Young adult respondents had a total of 270 children with them and 143 spousesand partners. (These young adults are also <strong>in</strong>cluded <strong>in</strong> the adult numbers mentioned above.)Weight<strong>in</strong>g frequencies and percentagesSurvey results have been statistically adjusted to reflect the actual adult populationsresid<strong>in</strong>g <strong>in</strong> emergency shelters, battered women's shelters, and transitional hous<strong>in</strong>gprograms (2,154 men and 2,219 women) on the day of the survey.We do not weight the data collected from persons <strong>in</strong>terviewed <strong>in</strong> non-shelter locations,because we do not know the actual numbers of people who were on the streets or <strong>in</strong> othernon-shelter locations on the day of the survey.We do not weight the data <strong>in</strong> the youth section. This is because most homeless youth donot use shelter and we do not want to over-represent the backgrounds and experiences ofthe small proportion of those us<strong>in</strong>g shelter dur<strong>in</strong>g the one-night snapshot. However, whenadult characteristics are reported, those 18 and older are <strong>in</strong>cluded with the rest of the adultpopulation. In those sections of the report, their responses are weighted <strong>in</strong> the same wayas those of the rest of the adult population.Additional notesThe total number of responses is not always the total number of people. Not all questionswere asked of every respondent (for example, questions about children were not asked ofthose who have no children). Not all respondents answered every question.The <strong>2009</strong> study found a significantly larger number of homeless people than <strong>in</strong> the 2006study. Most results are reported as percents of a specific homeless population (for example,homeless adults, or youth, or parents). Because of the larger numbers, even whenpercentages have decreased between 2006 and <strong>2009</strong>, the absolute numbers <strong>in</strong> questionmay still be larger.<strong>Homelessness</strong> <strong>in</strong> M<strong>in</strong>nesota <strong>2009</strong> v <strong>Wilder</strong> Research, October 2010
ContentsHighlights ........................................................................................................................... 1Key f<strong>in</strong>d<strong>in</strong>gs <strong>in</strong> the <strong>2009</strong> survey ................................................................................... 1How many homeless M<strong>in</strong>nesotans? .............................................................................. 6Who was homeless <strong>in</strong> M<strong>in</strong>nesota <strong>in</strong> <strong>2009</strong>? ................................................................. 12Section I: Characteristics of homeless adults overall ..................................................... 15Employment and <strong>in</strong>come ............................................................................................ 15Health concerns ........................................................................................................... 19Violence and abuse ..................................................................................................... 25Services ....................................................................................................................... 27Affordable hous<strong>in</strong>g ..................................................................................................... 30Barriers to stable hous<strong>in</strong>g............................................................................................ 33Th<strong>in</strong>gs look different <strong>in</strong> greater M<strong>in</strong>nesota ................................................................ 38Section II: Children and youth ........................................................................................ 42Children with their parents.......................................................................................... 42Youth on their own ..................................................................................................... 45Section III: Specific groups ............................................................................................. 55Long-term homelessness ............................................................................................. 55Homeless veterans ...................................................................................................... 60People not us<strong>in</strong>g the shelter system ............................................................................ 64Older adults ................................................................................................................. 70Homeless ex-offenders................................................................................................ 72<strong>Homelessness</strong> <strong>in</strong> M<strong>in</strong>nesota <strong>2009</strong> <strong>Wilder</strong> Research, October 2010
HighlightsKey f<strong>in</strong>d<strong>in</strong>gs <strong>in</strong> the <strong>2009</strong> surveyAfter level<strong>in</strong>g off <strong>in</strong> the mid-2000s the number of homeless people <strong>in</strong> M<strong>in</strong>nesota hasrisen sharply. Study results from <strong>2009</strong> clearly reflect the tough economic climate of thepast few years, <strong>in</strong>clud<strong>in</strong>g fewer jobs and less <strong>in</strong>come for those experienc<strong>in</strong>g homelessness.<strong>Wilder</strong>'s study counted 9,654 homeless adults, youth and children – a 25 percent <strong>in</strong>creaseover the 2006 study. In addition, us<strong>in</strong>g a formula based on counts compiled by the U.S.Department of Hous<strong>in</strong>g and Urban Development and other <strong>in</strong>dependent studies, <strong>Wilder</strong>estimates the overall number of homeless people <strong>in</strong> M<strong>in</strong>nesota to be at least 13,100 onany given night. Consistent with f<strong>in</strong>d<strong>in</strong>gs from the 2006 study, survey results show an<strong>in</strong>creas<strong>in</strong>g level of distress among the homeless, with high rates of mental illness, physicaldisabilities and recent <strong>in</strong>carceration.What’s new?Fewer jobs, less <strong>in</strong>come, and <strong>in</strong>creased food needsThe significant <strong>in</strong>crease <strong>in</strong> the number of homeless came after a period of level<strong>in</strong>g off. In<strong>2009</strong>, 40 percent of homeless adults reported a job loss or reduced hours as a reason theylost their last hous<strong>in</strong>g. Other notable f<strong>in</strong>d<strong>in</strong>gs reflect<strong>in</strong>g substantial differences fromresults found <strong>in</strong> 2006 are shown below:• 52% of all homeless adults have been homeless for a least one year (up from 47% <strong>in</strong> 2006)• 48% of all homeless adults have been jobless for more than a year (up from 38% <strong>in</strong> 2006)• 6% of homeless adults reported full-time employment (down from 12% <strong>in</strong> <strong>2009</strong>)• 21% of unemployed homeless adults identify “lack of employment opportunities” asone of their ma<strong>in</strong> reasons for not work<strong>in</strong>g (up from 8% <strong>in</strong> 2006)• Median monthly <strong>in</strong>come of homeless adults from all sources was $300 <strong>in</strong> <strong>2009</strong> (downfrom $400 <strong>in</strong> 2006)• 63% of homeless adults report us<strong>in</strong>g food stamps dur<strong>in</strong>g the month of October <strong>2009</strong>(up from 51% <strong>in</strong> 2006)<strong>Homelessness</strong> <strong>in</strong> M<strong>in</strong>nesota <strong>2009</strong> 1 <strong>Wilder</strong> Research, October 2010
Greater distress among long-term homelessWhile the proportion of adults homeless for a least one year has been <strong>in</strong>creas<strong>in</strong>g s<strong>in</strong>ce thefirst study <strong>in</strong> 1991, the proportion who have been homeless for less than one month cont<strong>in</strong>uesto decl<strong>in</strong>e. Adults who are homeless for a least one year are significantly more likely toexperience serious barriers to stable hous<strong>in</strong>g <strong>in</strong>clud<strong>in</strong>g the follow<strong>in</strong>g:• 59% of adults who are homeless for a least a year have a serious mental illness(compared to 46% of those homeless less than one month)• 49% of adults who are homeless for a least a year report a chronic health condition(compared to 37% of those homeless less than one month)• 38% of adults who are homeless for a least a year report a cognitive disability(compared to 21% of those who are homeless less than one month)• 35% of adults who are homeless for a least a year report symptoms of traumatic bra<strong>in</strong><strong>in</strong>jury (compared to 24% of those homeless for less than one month)• 27% of adults who are homeless for at least one year have a drug or alcohol abusedisorder diagnosis (compared to 16% of those homeless less than one month)Increase <strong>in</strong> homelessness largest among youthThe s<strong>in</strong>gle night count of homeless youth aged 12 to 21 (1,268) represents a 46 percent<strong>in</strong>crease from 2006. This pattern is cause for concern because the largest <strong>in</strong>crease <strong>in</strong>turnaways from shelters was also among youth. In addition, the number of youth shelterbeds, particularly for those 17 and under, has rema<strong>in</strong>ed flat s<strong>in</strong>ce 2003.Although the numbers are up, the difficulties faced by homeless youth are occurr<strong>in</strong>g atsimilar rates or slightly lower rates than <strong>in</strong> 2006, as shown below:• 24% of youth slept outside at least one night <strong>in</strong> October <strong>2009</strong> (compared to 29% <strong>in</strong> 2006)• 46% report a serious mental illness (compared to 49% <strong>in</strong> 2006)• 45% have been physically or sexually mistreated (compared to 51% <strong>in</strong> 2006)• 64% experienced a placement such as a foster home, group home, detention facility,or treatment center (compared to 70% <strong>in</strong> 2006)• 20% of youth left some type of social service placement <strong>in</strong> the previous 12 months(compared to 22% <strong>in</strong> 2006)<strong>Homelessness</strong> <strong>in</strong> M<strong>in</strong>nesota <strong>2009</strong> 2 <strong>Wilder</strong> Research, October 2010
What persists?Racial disparitiesBlack and American Indian people rema<strong>in</strong> significantly overrepresented among thehomeless. Together, African-American and African born people make up about 4 percentof the adult M<strong>in</strong>nesota population, while they account for 41 percent of M<strong>in</strong>nesota'shomeless adult population. American Indian disparities are particularly large amonghomeless youth and <strong>in</strong> greater M<strong>in</strong>nesota. About one-fifth of both groups are AmericanIndian compared to 1 percent of the overall M<strong>in</strong>nesota population.Domestic violence among women and childrenTwenty-n<strong>in</strong>e percent of adult homeless women are flee<strong>in</strong>g domestic violence and58 percent of those women have children under 18 liv<strong>in</strong>g with them. About 600 childrenunder 18 were liv<strong>in</strong>g with women flee<strong>in</strong>g abuse on the night of the study. Nearly half(48%) of all homeless women report that they have stayed <strong>in</strong> an abusive situation becausethey did not have any other hous<strong>in</strong>g options. Among female homeless youth (age 12 to21) 36 percent report that they have stayed <strong>in</strong> an abusive situation because they did nothave other hous<strong>in</strong>g options.Childhood traumaA history of abuse is unusually common among homeless adults and youth. While thisstudy cannot directly l<strong>in</strong>k childhood maltreatment and neglect as a cause for homelessness,both the adult and youth homeless populations reflect high rates of childhood physicalabuse, sexual abuse, and neglect. The levels seen <strong>in</strong> the <strong>2009</strong> study are consistent withresults seen <strong>in</strong> 2000 and 2003. Across all ages, more than 40 percent have been physicallyor sexually abused <strong>in</strong> childhood.Multiple health issuesThree fourths (74%) of homeless adults reported at least one of three major health issues:mental illness, substance abuse disorder, or a chronic physical health condition. Fortypercent have more than one.Other major health issues <strong>in</strong>clude:• 41% of homeless adults report conditions that limit the k<strong>in</strong>d or amount of work theycan do• 33% of homeless adults report cognitive disabilities<strong>Homelessness</strong> <strong>in</strong> M<strong>in</strong>nesota <strong>2009</strong> 3 <strong>Wilder</strong> Research, October 2010
• 32% of homeless adults report likely traumatic bra<strong>in</strong> <strong>in</strong>juries• 44% of the 669 homeless veterans <strong>in</strong> the study report a service-related health problemBarriers to obta<strong>in</strong><strong>in</strong>g and ma<strong>in</strong>ta<strong>in</strong><strong>in</strong>g hous<strong>in</strong>gOne-half (51%) of homeless adults report that lack of a job or <strong>in</strong>come (43%) or lack ofaffordable hous<strong>in</strong>g (24%) is currently prevent<strong>in</strong>g them from gett<strong>in</strong>g hous<strong>in</strong>g. Otherbarriers <strong>in</strong>clude:• Crim<strong>in</strong>al background (16%)• Credit problems (16%)• Court eviction or bad rental history (9%)• Cost of application fees (8%)• No local rental history (7%)One-third (32%) of homeless adults report they left their last permanent hous<strong>in</strong>g becausethey were evicted, 8 percent because a place they were rent<strong>in</strong>g was foreclosed on, and 4percent because a home they owned went <strong>in</strong>to foreclosure. These barriers, together with thelow monthly <strong>in</strong>comes of homeless adults, are <strong>in</strong> stark contrast to typical costs for hous<strong>in</strong>g.In <strong>2009</strong>, accord<strong>in</strong>g to HUD, the fair market rent for a one bedroom apartment is $719 <strong>in</strong> theTw<strong>in</strong> Cities metro area and $520 <strong>in</strong> greater M<strong>in</strong>nesota – far higher than median <strong>in</strong>comes ofhomeless adults, which were $280 <strong>in</strong> the metro area and $300 <strong>in</strong> greater M<strong>in</strong>nesota. Even forhomeless people who are employed, fair market rents are greater than the total median<strong>in</strong>comes of $713 <strong>in</strong> the seven metro counties and $650 <strong>in</strong> greater M<strong>in</strong>nesota.What to watchChildren cont<strong>in</strong>ue to make up a large component of the homelesspopulationChildren with their parents make up 34 percent of the total homeless population <strong>in</strong>M<strong>in</strong>nesota. The one-night count identified 3,251 children who were with their parentsand an additional 227 m<strong>in</strong>ors (12 to 17) who were on their own. Nearly half (47%) of allchildren are age 5 or younger. The majority of homeless children (67%) are part of afamily with a mother only. However, 19 percent of children are <strong>in</strong> two-parent familiesand 5 percent of children are with their father only. N<strong>in</strong>e percent of all homeless childrenare not accompanied by any parent.<strong>Homelessness</strong> <strong>in</strong> M<strong>in</strong>nesota <strong>2009</strong> 4 <strong>Wilder</strong> Research, October 2010
The majority of homeless children are liv<strong>in</strong>g <strong>in</strong> transitional hous<strong>in</strong>g programs (59%).The rema<strong>in</strong><strong>in</strong>g children are <strong>in</strong> emergency shelters (19%), battered women's shelters (9%)or <strong>in</strong>formal arrangements (12%). One percent of all homeless children were unshelteredon the night of the survey. Eleven percent of all parents report that one or more of theirchildren have trouble go<strong>in</strong>g to school because of their hous<strong>in</strong>g situation. This was mostcommon among parents <strong>in</strong> <strong>in</strong>formal (and often less stable) arrangements. This factor alsolikely affected the decl<strong>in</strong>e <strong>in</strong> the percent of parents who reported that all of their schoolage children had attended school on the day of the survey (84% <strong>in</strong> <strong>2009</strong>, down from 90%<strong>in</strong> 2006).Cont<strong>in</strong>ued rise <strong>in</strong> the number of homeless adults previously<strong>in</strong>carceratedAlthough the proportions of homeless ex-offenders have leveled off after a decade of<strong>in</strong>creases, the actual number of homeless adults ever <strong>in</strong>carcerated <strong>in</strong>creased 24 percentfrom the number reported <strong>in</strong> 2006. In all, the <strong>2009</strong> study identified 2,800 homeless adultex-offenders who had previously spent time <strong>in</strong> prison, county jail or juvenile detention(compared to 2,264 <strong>in</strong> 2006). In all, 63 percent of all homeless adult men and 28 percentof all homeless adult women have been <strong>in</strong>carcerated at some time <strong>in</strong> their lives.Compared to non-offenders <strong>in</strong> the homeless population, ex-offenders were more likely tohave been <strong>in</strong> foster care and more likely to have received special education services while<strong>in</strong> school. In addition, homeless ex-offenders were more than twice as likely as nonoffendersto have alcohol or chemical dependency disorders and almost three times aslikely to have lived <strong>in</strong> a drug or alcohol treatment facility at some time. Ex-offenderswere more than twice as likely as other adults <strong>in</strong> the homeless population to have takenillegal drugs <strong>in</strong> the previous 30 days.One <strong>in</strong> five homeless men are military veteransThe <strong>2009</strong> study identified 669 homeless veterans <strong>in</strong>clud<strong>in</strong>g 605 men and 64 women, numbersvery similar to those found <strong>in</strong> the 2006 study. One-third of homeless veterans had served<strong>in</strong> a combat zone. In all, 19 percent of homeless men served <strong>in</strong> the military at some timecompared to 21 percent of all M<strong>in</strong>nesota men who have ever served <strong>in</strong> the military.Homeless male veterans are more likely than other homeless males to have consideredsuicide or attempted suicide. They are also more likely to have a mental illness orchemical dependency problem or some other type of chronic health problem. Homelessveterans (especially combat veterans) are also much more likely to experience posttraumaticstress disorder (PTSD). Homeless male veterans have similar hous<strong>in</strong>g barriersas other homeless men but are somewhat more likely to cite credit problems, bad rentalhistory (<strong>in</strong>clud<strong>in</strong>g eviction), and mental illness as current barriers to hous<strong>in</strong>g.<strong>Homelessness</strong> <strong>in</strong> M<strong>in</strong>nesota <strong>2009</strong> 5 <strong>Wilder</strong> Research, October 2010
Numbers that are estimatedResearch done elsewhere provides a basis for estimat<strong>in</strong>g the total number of M<strong>in</strong>nesotanswho are likely to have been without permanent shelter on the date of the survey, <strong>in</strong>clud<strong>in</strong>gthose not liv<strong>in</strong>g <strong>in</strong> a formal shelter program who were not identified <strong>in</strong> the study.Unaccompanied m<strong>in</strong>ors (age 12-17). Based on the proportions found <strong>in</strong> a 1989 U.S.General Account<strong>in</strong>g Office report, we estimate that about 400 to 500 m<strong>in</strong>ors werehomeless on their own (not with their parents), and were not served by formal shelterprograms. Add<strong>in</strong>g <strong>in</strong> the number we counted <strong>in</strong> formal shelter, we estimate that about550 m<strong>in</strong>ors 17 and under were homeless and unaccompanied on the date of the study.The GAO study is now more than 20 years old. There are no newer studies that allow adirect estimation of one-night homelessness among unaccompanied youth. However, it islikely that the patterns of homelessness are now very different. As an alternative estimate,we have used a more recent study by the Research Triangle Institute (1998) us<strong>in</strong>g datafrom the National Health Interview Study of the proportion of youth who are homeless <strong>in</strong>a given year, and used that estimate to compute a likely number for any given night. Thisestimate, which we consider likely to be more accurate, is that about 2,000 youth m<strong>in</strong>ors(age 17 and under) are homeless and not with their parents on any given night <strong>in</strong> M<strong>in</strong>nesota.Because we have not used this method of estimation <strong>in</strong> prior studies, it is not directlycomparable to estimates for prior years and we have not used it <strong>in</strong> our estimate of thetotal numbers of homelessness on October 22, <strong>2009</strong>.Young adults (age 18-21). We have not found any studies that allow us to directly estimatethe number of unsheltered young adults <strong>in</strong> this age group. We believe that the pattern of shelteruse vs. unsheltered homelessness for this age group is closer to patterns for unaccompaniedm<strong>in</strong>ors (ages 17 and younger) rather than those for the overall adult population. This wasevident <strong>in</strong> <strong>2009</strong> because the low end of the estimate used <strong>in</strong> previous <strong>Wilder</strong> studies wasexceeded by the actual count of homeless young adults found on the night of the study(1,041 18-21 year olds). Therefore, our estimates were derived us<strong>in</strong>g the ranges found <strong>in</strong> theResearch Triangle Institute study (above) that estimate between 2.8 and 5 percent of youthare homeless at least once dur<strong>in</strong>g the year. Based on the length of time our survey respondentshad been homeless, it is likely that the number homeless on any given night is slightly over11 percent of this annual number. For our one-night estimate for this group of young adults,we average the number derived from these calculations with the number we obta<strong>in</strong> us<strong>in</strong>g thesame method described below for adults age 22 and older. In all, we estimate that 1,950young adults age 18-21 were homeless on the date of the study, of whom 1,041 were counted<strong>in</strong> the study.<strong>Homelessness</strong> <strong>in</strong> M<strong>in</strong>nesota <strong>2009</strong> 7 <strong>Wilder</strong> Research, October 2010
Adults (age 22 and older). Our estimate for adults is based on July <strong>2009</strong> report issued bythe U.S. Department of Hous<strong>in</strong>g and Urban Development (HUD), which compiled onenightpo<strong>in</strong>t-<strong>in</strong>-time counts of homeless <strong>in</strong>dividuals <strong>in</strong> January 2008 from Cont<strong>in</strong>uum ofCare regions nationwide. These found that roughly half of homeless <strong>in</strong>dividuals were <strong>in</strong>shelters and half <strong>in</strong> unsheltered sett<strong>in</strong>gs, while 27 percent of homeless persons <strong>in</strong> familieswere <strong>in</strong> unsheltered sett<strong>in</strong>gs. Apply<strong>in</strong>g these proportions to our <strong>2009</strong> M<strong>in</strong>nesota surveyf<strong>in</strong>d<strong>in</strong>gs, we estimate that 6,700 adults were homeless on the date of the study, of whom5,111 were counted <strong>in</strong> the study.Children (age 0-17) with their parents. Based on the same <strong>2009</strong> HUD report, and thenumbers of children found <strong>in</strong> sheltered situations <strong>in</strong> our <strong>2009</strong> study, we estimate thatthere were 3,924 homeless m<strong>in</strong>or children with parents on the date of the study, of whom3,251 were counted <strong>in</strong> the study.Statewide one-night estimateAdd<strong>in</strong>g all of these together, we estimate that there were about 13,100 total homelessM<strong>in</strong>nesotans on any given night <strong>in</strong> <strong>2009</strong>, or about 3,850 more than was estimated <strong>in</strong>2006. This number does not <strong>in</strong>clude people on Indian Reservations, which are reportedseparately based on a companion survey.ESTIMATED NUMBER OF PERSONS HOMELESS ON ANY GIVEN NIGHT IN MINNESOTA, <strong>2009</strong>Count ofnumber <strong>in</strong>sheltersCount ofnumber not<strong>in</strong> sheltersEstimate ofadditionalunshelteredpersonsEstimatedtotal *Unaccompanied m<strong>in</strong>or youth under 18 143 84 323 (a) 550Young adults 18-21 666 375 909 1,950Adults 22 and older 3,707 1,404 1,589 6,700Children with their parents 2,857 394 649 3,900TOTAL(source of number)7,373(count)2,257(<strong>in</strong>terviews)3,470(estimate)13,100(sum)* Based on a more recent study, the number of additional unaccompanied m<strong>in</strong>or youth is likely to be significantly higher thanthe number shown here (estimated at 1,223 persons not counted, for a total of 2,000 m<strong>in</strong>or youth on a given night). If thisestimate were used, the estimated total for all ages for a s<strong>in</strong>gle night would be 14,550.<strong>Homelessness</strong> <strong>in</strong> M<strong>in</strong>nesota <strong>2009</strong> 8 <strong>Wilder</strong> Research, October 2010
How does the number of homeless people compare to 2006?Between 2006 and <strong>2009</strong>, accord<strong>in</strong>g to reports filed by each Cont<strong>in</strong>uum of Care region withthe federal Department of Hous<strong>in</strong>g and Urban Development (HUD), the total bed capacityof emergency shelters, battered women’s shelters, and transitional hous<strong>in</strong>g programs fell byabout 2 percent, while the total bed capacity <strong>in</strong> permanent supportive hous<strong>in</strong>g programs forformerly homeless people rose by 27 percent. While the capacity <strong>in</strong> emergency andtransitional programs rema<strong>in</strong>ed almost unchanged, the survey-night census of actualoccupancy shows a significant rise over the same time period, with a 23 percent <strong>in</strong>crease <strong>in</strong>the numbers <strong>in</strong> emergency shelter and battered women’s shelters, and a 14 percent <strong>in</strong>crease<strong>in</strong> the numbers <strong>in</strong> transitional hous<strong>in</strong>g. On the date of the survey, the count of people <strong>in</strong>shelters actually exceeded the stated capacity of the state’s shelter system.Adults (age 22 or older)The number of homeless adults <strong>in</strong> emergency shelters was up by 16 percent from 2006,and the number <strong>in</strong> transitional hous<strong>in</strong>g was up by 9 percent. As a result of a strong outreacheffort, the number of unsheltered homeless adults who were <strong>in</strong>terviewed was 31 percenthigher than <strong>in</strong> 2006, which had also been a very successful year for outreach. There ismixed evidence concern<strong>in</strong>g whether there were more homeless adults outside of the sheltersystem <strong>in</strong> <strong>2009</strong>, or if the study simply was more successful <strong>in</strong> locat<strong>in</strong>g such people.Among those who were surveyed, 10 percent more reported that they had been turnedaway from shelter <strong>in</strong> the previous three months due to a lack of beds. However, fewer ofthose who were turned away reported sleep<strong>in</strong>g <strong>in</strong> unsheltered locations as a result of be<strong>in</strong>gturned away. Based on the national figures compiled by HUD, we estimate that the <strong>2009</strong>numbers <strong>in</strong> M<strong>in</strong>nesota are about 2,200 higher than those <strong>in</strong> 2006.Unaccompanied youth (age 21 or younger and on their own)The picture is different for unaccompanied youth. About the same number of youth m<strong>in</strong>ors(ages 17 or younger and on their own) were <strong>in</strong> shelter programs on the night of the surveyas <strong>in</strong> 2006. The number of young adults (ages 18-21) <strong>in</strong> shelters was almost doubled (up93%) s<strong>in</strong>ce 2006. The system’s bed capacity specifically for youth – whose needs aredifferent from those of s<strong>in</strong>gle adults and families – has rema<strong>in</strong>ed level s<strong>in</strong>ce 2003, so mostof this <strong>in</strong>crease among sheltered youth has been <strong>in</strong> the shelters designed for all adults. Thisis not an option for most youth m<strong>in</strong>ors, however, and among those age 17 or less, 51 percentmore report hav<strong>in</strong>g been turned away from shelter dur<strong>in</strong>g the past three months due to lackof capacity. Fortunately, most of those turned away were able to f<strong>in</strong>d alternate shelter andfew were obliged to sleep <strong>in</strong> unsheltered situations as a result of be<strong>in</strong>g turned away. Theestimated number of homeless youth m<strong>in</strong>ors <strong>in</strong> <strong>2009</strong> is the same as <strong>in</strong> 2006. The estimatednumber of homeless young adults is 650 higher than <strong>in</strong> 2006.<strong>Homelessness</strong> <strong>in</strong> M<strong>in</strong>nesota <strong>2009</strong> 9 <strong>Wilder</strong> Research, October 2010
Children (age 0-17) with their parentsThe number of homeless children with their parents, after decl<strong>in</strong><strong>in</strong>g slightly for two studyperiods, has now <strong>in</strong>creased aga<strong>in</strong>. On the night of the <strong>2009</strong> survey, 3,251 children werecounted <strong>in</strong> shelters, transitional hous<strong>in</strong>g, or outside of shelter programs with their families,compared to 875 children when this research began <strong>in</strong> 1991. Our estimate for the actualnumbers on a s<strong>in</strong>gle night is about 1,100 higher than <strong>in</strong> 2006. The <strong>in</strong>crease was greatest<strong>in</strong> emergency shelters, where the number of children was up 33 percent, compared to a 7percent <strong>in</strong>crease <strong>in</strong> transitional hous<strong>in</strong>g programs. Although parents were equally likelyas other adults to have been turned away from shelter due to a lack of capacity, they weremuch less likely than other adults to report that they had had to sleep outside as a result.Annual estimateMany of the people found <strong>in</strong> the one-night study experience homelessness for only ashort time. Our October 22 study could not count people homeless for a s<strong>in</strong>gle week <strong>in</strong>early October, or for six months from February through July. By count<strong>in</strong>g the number ofpeople <strong>in</strong> our study who were homeless for shorter periods of time, and comput<strong>in</strong>g howmany more such people would become newly homeless dur<strong>in</strong>g comparable periods oftime throughout the full year, we can estimate the number of people homeless over thecourse of the full year.Us<strong>in</strong>g these methods, we estimate that at least 46,400 M<strong>in</strong>nesotans experiencehomelessness at least once over the course of a full year. This <strong>in</strong>cludes:• 18,300 adults age 22+• 14,120 children with their homeless parents• 7,680 young adults ages 18-21 on their own• 4,800 m<strong>in</strong>or youth (ages 12-17) on their ownIn addition, we estimate that over a full year, there are between 29,000 and 34,800 childrenwith parents and unaccompanied youth who stay <strong>in</strong> temporary, doubled-up arrangementsthat are def<strong>in</strong>ed as “homeless” under the McK<strong>in</strong>ney-Vento Act as it applies to educationalservices. Therefore, we believe that our estimates for the number of unaccompaniedyouth over the course of the year are low and should be <strong>in</strong>terpreted with caution.This estimate also does not <strong>in</strong>clude homeless persons liv<strong>in</strong>g on the Indian Reservations <strong>in</strong>the state.<strong>Homelessness</strong> <strong>in</strong> M<strong>in</strong>nesota <strong>2009</strong> 10 <strong>Wilder</strong> Research, October 2010
Difference between one-night and annual characteristicsThe survey shows some differences <strong>in</strong> characteristics between people who have beenhomeless for a long time and those who have been homeless for a shorter time. Our s<strong>in</strong>glenightstudy is most likely to f<strong>in</strong>d people who have been homeless for a longer time, and isleast well suited to represent all the additional people who are only homeless for a shortperiod of time. As a result, the characteristics described <strong>in</strong> this report are not necessarily anaccurate description of the full annual population of people experienc<strong>in</strong>g homelessness.Us<strong>in</strong>g the same estimat<strong>in</strong>g techniques employed <strong>in</strong> calculat<strong>in</strong>g approximate annualnumbers of homeless people, we can also estimate other characteristics of the homelesspopulation on an annual basis. Four items that are particularly affected by the differencebetween one-night and annual profiles are the follow<strong>in</strong>g:• On a s<strong>in</strong>gle night, 59 percent of the adults fit M<strong>in</strong>nesota’s def<strong>in</strong>ition of long-termhomeless (they had been homeless at least one year, or had been homeless at least fourtimes <strong>in</strong> the previous three years). However, over the course of a full year, we estimatethe total percentage of homeless adults fitt<strong>in</strong>g this def<strong>in</strong>ition is only 33 percent.• While 47 percent of adults who were homeless on the s<strong>in</strong>gle night of the survey werewomen, we estimate that 56 percent of homeless adults over the course of a full yearare women.• While 68 percent of homeless adults were <strong>in</strong> the 7-county metro area on the night ofthe survey, we estimate that only 58 percent are <strong>in</strong> the metro area over the full year.Not all differences are this large. For other characteristics, the difference between onenightpercentages and estimated annual percentages are relatively small. For example:• For serious mental illness, the annual estimate is 51 percent, compared to 55 percent<strong>in</strong> the s<strong>in</strong>gle-night f<strong>in</strong>d<strong>in</strong>gs.• Adults <strong>in</strong> unsheltered sett<strong>in</strong>gs are estimated at 10 percent of the annual population,the same as for the one-night population.• The percent who left their last hous<strong>in</strong>g due to foreclosure is also the same, 10 percentannually as well as on a s<strong>in</strong>gle night.• We estimate that 35 percent of adults over the course of the full year have childrenwith them, compared to 30 percent of adults on a s<strong>in</strong>gle night.<strong>Homelessness</strong> <strong>in</strong> M<strong>in</strong>nesota <strong>2009</strong> 11 <strong>Wilder</strong> Research, October 2010
numbers of homeless families not us<strong>in</strong>g shelter or hous<strong>in</strong>g programs (215 <strong>in</strong> <strong>2009</strong>,compared to 133 <strong>in</strong> 2006 and 72 <strong>in</strong> 2003). Some of the <strong>2009</strong> <strong>in</strong>crease may also reflectthe foreclosure trends of the year and a half prior to the survey. Homeless parents withchildren, and especially those not <strong>in</strong> formal shelter programs, were significantly morelikely than other respondents to report that they had lost their previous hous<strong>in</strong>g due toeviction (43% of parents <strong>in</strong> non-shelter situations – and 50% of those homeless for lessthan a year – compared to 32% of all homeless adults) or foreclosure of a place they hadbeen rent<strong>in</strong>g (12% of parents <strong>in</strong> non-shelter situations, compared to 8% of all adults).Nearly two-thirds of homeless adults (63%) had never been married, 20 percent weredivorced, 9 percent were separated, 5 percent were currently married, and 2 percent werewidowed.EducationOne out of four homeless adults (25%) had no high school diploma. Just under half(46%) had a high school education but no more, and almost 3 <strong>in</strong> 10 (29%) had at leastsome higher education. Just over one-quarter (27%) reported that they had receivedspecial education services while <strong>in</strong> school.Length of residence <strong>in</strong> M<strong>in</strong>nesotaThe percentage of homeless people who have lived <strong>in</strong> M<strong>in</strong>nesota for two years or less isthe same as <strong>in</strong> 2006, and is the lowest it has been s<strong>in</strong>ce the first statewide homelesssurvey <strong>in</strong> 1991. As <strong>in</strong> the 2006 survey, 23 percent of adults had lived <strong>in</strong> M<strong>in</strong>nesota forless than 2 years. This is down from 39 percent <strong>in</strong> 1991 and 1994, 28 percent <strong>in</strong> 1997and 2000, and 27 percent <strong>in</strong> 2003. Three out of five homeless adults (60%) have lived <strong>in</strong>M<strong>in</strong>nesota for more than 10 years, and slightly over two-thirds (69%) have lived heremore than five years. Of those <strong>in</strong> M<strong>in</strong>nesota for two years or less, more than one-third(37%) had lived <strong>in</strong> M<strong>in</strong>nesota before.Six percent were born outside of the United States, a proportion almost exactly the sameas <strong>in</strong> the full statewide population (6.6%) accord<strong>in</strong>g to the U.S. Census’s AmericanCommunity Survey (2006-2008 estimates). Of this group, about half, or approximately 150respondents (with approximately 125 children), had entered the U.S. with refugee status.<strong>Homelessness</strong> <strong>in</strong> M<strong>in</strong>nesota <strong>2009</strong> 13 <strong>Wilder</strong> Research, October 2010
Race and ethnicityBlack, American Indian, and Hispanic people comprise a much larger proportion of thehomeless population than of the overall state population. The disparities, which hadleveled off for adults from 2003 to 2006 – and even improved slightly for youth – haveaga<strong>in</strong> become worse <strong>in</strong> <strong>2009</strong>.RACE AND ETHNICITY OF HOMELESS YOUTH AND ADULTS IN <strong>2009</strong>Percent ofhomeless youth(unaccompanied,age 12-17)Percent of allM<strong>in</strong>nesotayouth(age 12-17)Percent ofhomelessyoung adults(age 18-21)Percent of allM<strong>in</strong>nesotayoung adults(age 18-21)Percent ofhomelessadults(age 22+)Percent ofallM<strong>in</strong>nesotaadults(age 22+)American Indian 20% 1% 15% 1% 11% 1%Asian American 2% 4% 1% 4% 1% 3%Black 43% 6% 37% 6% 41% 4%White 24% 85% 35% 86% 40% 90%Other, <strong>in</strong>clud<strong>in</strong>gmulti-racialHispanic (may beof any race)11% 4% 11% 3% 7% 2%11% 5% 11% 4% 7% 3%Sources:Note:<strong>Wilder</strong> Research Center survey of homelessness and U.S. Census Bureau 2008 American Community SurveyColumn totals are more than 100% because Hispanic ethnicity is asked <strong>in</strong>dependent of race.<strong>Homelessness</strong> <strong>in</strong> M<strong>in</strong>nesota <strong>2009</strong> 14 <strong>Wilder</strong> Research, October 2010
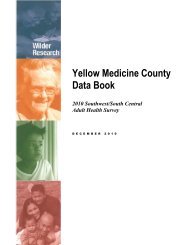
Section I: Characteristics of homeless adultsoverallEmployment and <strong>in</strong>comeAfter 10 years of <strong>in</strong>creases dur<strong>in</strong>g the 1990s, employment among the homelesshas dropped significantly dur<strong>in</strong>g the last decade.41%26%34%26%30%28%18%9%15%20%13% 12%20%Employed (FTor PT)6%Full-time employment1991 1994 1997 2000 2003 2006 <strong>2009</strong>Who was work<strong>in</strong>gTwenty percent of homeless adults were work<strong>in</strong>g <strong>in</strong> <strong>2009</strong>, a significant decl<strong>in</strong>e from the28 percent <strong>in</strong> 2006, and an even steeper drop from the high of 41 percent <strong>in</strong> 2000. In the<strong>2009</strong> study, 6 percent were work<strong>in</strong>g full-time, half the proportion of 2006 (12%) and lessthan one-quarter of the high of 26 percent <strong>in</strong> 2000.As <strong>in</strong> 2006, a slightly higher percentage of women (23%) than men (17%) were work<strong>in</strong>g.Homeless parents (26%) were more likely to be employed than homeless adults withoutchildren (17%), and parents were also slightly more likely (8%) than other adults (5%) tobe work<strong>in</strong>g full-time. Adults <strong>in</strong> transitional hous<strong>in</strong>g were more likely to be work<strong>in</strong>g(28%) than adults <strong>in</strong> other types of shelters (18% <strong>in</strong> battered women’s shelters and 14%<strong>in</strong> emergency shelters). Non-shelter-us<strong>in</strong>g adults liv<strong>in</strong>g primarily <strong>in</strong> unsheltered locations(7%) were less likely to be work<strong>in</strong>g than adults <strong>in</strong> shelters (21%). However, those whohad spent much of October <strong>in</strong> <strong>in</strong>formal shelter arrangements were about as likely to bework<strong>in</strong>g as the general adult homeless population (20%). All of these patterns are similarto those seen <strong>in</strong> 2006, but at lower employment levels.<strong>Homelessness</strong> <strong>in</strong> M<strong>in</strong>nesota <strong>2009</strong> 15 <strong>Wilder</strong> Research, October 2010
N<strong>in</strong>eteen percent of unemployed homeless adults had been laid off with<strong>in</strong> the previous sixmonths. This is up from 12 percent <strong>in</strong> 2006. For those who were unemployed, the mediantime s<strong>in</strong>ce they last held a job was 1 year and 17 weeks. This more than four monthslonger than the median of 1 year <strong>in</strong> 2006. Only 6 percent of those who were laid offreported receiv<strong>in</strong>g any unemployment benefits – also a decrease, from 10 percent <strong>in</strong> 2006.WagesFor those who were employed full-time, wages were higher <strong>in</strong> <strong>2009</strong> than <strong>in</strong> 2006 and2003. Of homeless adults work<strong>in</strong>g full-time <strong>in</strong> <strong>2009</strong>:• 50% earned less than $10 an hour (compared to 64% <strong>in</strong> 2006)• 18% earned less than $8 an hour (compared to 32% <strong>in</strong> 2006)Barriers to employmentThere was some change <strong>in</strong> the barriers unemployed homeless adults report s<strong>in</strong>ce 2006.Most strik<strong>in</strong>g is a surge <strong>in</strong> “lack of employment opportunities,” which was not among thetop ten three years ago but ranked third <strong>in</strong> <strong>2009</strong>. Unemployed homeless adults mostcommonly reported the follow<strong>in</strong>g as the ma<strong>in</strong> problems they faced <strong>in</strong> try<strong>in</strong>g to get a job:• Lack of transportation (26%, compared to 34% <strong>in</strong> 2006)• Physical health problems (22%, compared to 26% <strong>in</strong> 2006)• Lack of employment opportunities (21%, compared to 8% <strong>in</strong> 2006)• Lack of hous<strong>in</strong>g (13%, compared to 27% <strong>in</strong> 2006 )• Mental health problems (16%, compared to 24% <strong>in</strong> 2006)• Crim<strong>in</strong>al history (13%, compared to 14% <strong>in</strong> 2006)• Job experience or history (14%, compared to 13% <strong>in</strong> 2006)• Education (12%, compared to 11% <strong>in</strong> 2006)• Lack of child care (8% of all unemployed homeless adults, and 17% of unemployedwomen (compared to 10% of all adults and 21% of women <strong>in</strong> 2006)<strong>Homelessness</strong> <strong>in</strong> M<strong>in</strong>nesota <strong>2009</strong> 16 <strong>Wilder</strong> Research, October 2010
In addition, from answers to other questions, we know that unemployed adults areaffected by the follow<strong>in</strong>g potential barriers to employment:• Mental health problems (reported by 58% of unemployed adults, although notnecessarily mentioned as a significant job barrier) (essentially unchanged from the57% <strong>in</strong> 2006)• Long-term unemployment of a year or more (60%, up from 53% <strong>in</strong> 2006)• A physical, mental, or other health condition that limits the work they can do(46%, slightly up from 51% <strong>in</strong> 2006)• Chemical dependency problems (44%, slightly up from 41% <strong>in</strong> 2006)• Lack of a high school diploma (26%, about equal to the 28% <strong>in</strong> 2006)• A history of any <strong>in</strong>carceration (50%, the same as <strong>in</strong> 2006)In the <strong>2009</strong> study, 13 percent of homeless adults reported no <strong>in</strong>come for the month ofOctober, the same as <strong>in</strong> 2006. Among those with any <strong>in</strong>come the most commonlymentioned sources were steady employment and/or day labor, General Assistance, andMFIP (M<strong>in</strong>nesota’s family welfare program). Other sources of <strong>in</strong>come for some were twoSocial Security programs for people with serious and persistent disabilities: SSDI, for peoplewho have had to leave employment due to disabilities, and SSI, which does not require aprevious employment history. As the proportions with <strong>in</strong>come from employment has fallens<strong>in</strong>ce <strong>2009</strong>, the proportions rely<strong>in</strong>g on General Assistance and MFIP have <strong>in</strong>creased. Theproportions for other sources has rema<strong>in</strong>ed steady between 2006 and <strong>2009</strong>.The table below shows the most common <strong>in</strong>come sources and those most often mentionedas the ma<strong>in</strong> source of <strong>in</strong>come <strong>in</strong> October.SOURCES OF INCOME, FOR HOMELESS ADULTS WITH ANY INCOMEA source of any<strong>in</strong>come <strong>in</strong> OctoberMa<strong>in</strong> source of<strong>in</strong>come <strong>in</strong> OctoberSteady employment 19% 15%General Assistance 33% 26%MFIP, M<strong>in</strong>nesota’s family welfare program22% of adults39% of women16% of adults29% of womenDay or temporary labor 12% 5%Friends or relatives 13% 4%Supplemental Security Income (SSI) 11% 8%Ask<strong>in</strong>g for money on the streets 10% 3%Social Security Disability Insurance (SSDI) 9% 7%<strong>Homelessness</strong> <strong>in</strong> M<strong>in</strong>nesota <strong>2009</strong> 17 <strong>Wilder</strong> Research, October 2010
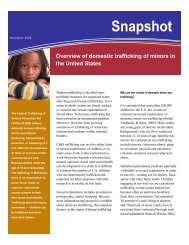
Health concernsHomeless people report high needs for basic health care, dental care, prescriptionmedic<strong>in</strong>es, mental health treatment, and substance abuse treatment.Physical healthForty-six percent of homeless adults reported at least one chronic health problem(comparable to the 44% found <strong>in</strong> the 2006 study). This <strong>in</strong>cludes:• 24% with asthma or another chronic lung or respiratory problem, <strong>in</strong>clud<strong>in</strong>gtuberculosis• 24% with high blood pressure• 8% with diabetes• 8% with chronic heart or circulatory problems• 4% with hepatitis• 1% with HIV or AIDS• 3% with a sexually transmitted disease (other than HIV/AIDS)The percentage report<strong>in</strong>g problems with asthma or other chronic respiratory conditionswas slightly lower than reported <strong>in</strong> 2006 (24%, down from 28%). All other percentagesare with<strong>in</strong> three po<strong>in</strong>ts of those reported <strong>in</strong> 2006, which could be due to no more thanrandom year to year variation.Mental healthMental illness has steadily risen over the last 12 years and is aga<strong>in</strong> higher <strong>in</strong> the <strong>2009</strong>survey. Over half (55%) of homeless adults had a serious mental illness, compared to20 percent <strong>in</strong> 1994, 32 percent <strong>in</strong> 1997, 36 percent <strong>in</strong> 2000, 47 percent <strong>in</strong> 2003, and52 percent <strong>in</strong> 2006. In the past two years, 39 percent of homeless adults receivedoutpatient care from a counselor, psychologist, or mental health worker because ofnervousness, depression, or mental health problems, and 11 percent had been <strong>in</strong> aresidential mental health treatment facility.<strong>Homelessness</strong> <strong>in</strong> M<strong>in</strong>nesota <strong>2009</strong> 19 <strong>Wilder</strong> Research, October 2010
STEADY RISE IN PROPORTION OF HOMELESS ADULTS WITH SERIOUS MENTAL ILLNESS47%52%55%32%36%20%1991 1994 1997 2000 2003 2006 <strong>2009</strong>Homeless adults reported that they had been told by a doctor or nurse, <strong>in</strong> the past twoyears, that they had the follow<strong>in</strong>g diagnoses:• 38% with major depression• 21% with manic episodes or manic depression, also called bipolar disorder• 22% with Post-Traumatic Stress Disorder (PTSD)• 15% with anti-social personality, obsessive-compulsive personality, or any othersevere personality disorder• 6% with schizophrenia• 7% with a paranoid or delusional disorder other than schizophreniaThe rates for schizophrenia and other delusional disorders rema<strong>in</strong>ed constant from 2006 to<strong>2009</strong>. The rates for each of the other disorders <strong>in</strong>creased was with<strong>in</strong> one to three po<strong>in</strong>tsabove those observed <strong>in</strong> 2006 – not a significant <strong>in</strong>crease taken one by one, but the fact thatall of the change is <strong>in</strong> the same direction is likely not a result of random variation.Compared to 2006, overall rates of mental illness rose with<strong>in</strong> each of the shelter types,and especially with<strong>in</strong> battered women’s shelters. However, the rates fell among respondents<strong>in</strong>terviewed <strong>in</strong> outreach locations, and especially among those <strong>in</strong> the metro area who spent ahigher proportion of their month sleep<strong>in</strong>g outside or <strong>in</strong> other unsheltered sett<strong>in</strong>gs. This isconsistent with efforts <strong>in</strong> the Head<strong>in</strong>g Home plans to reach out to <strong>in</strong>dividuals experienc<strong>in</strong>glong-term homelessness and mental illness and help them enter <strong>in</strong>to and ma<strong>in</strong>ta<strong>in</strong> supportive<strong>Homelessness</strong> <strong>in</strong> M<strong>in</strong>nesota <strong>2009</strong> 20 <strong>Wilder</strong> Research, October 2010
hous<strong>in</strong>g. It is also consistent with a decrease <strong>in</strong> the ability or <strong>in</strong>cl<strong>in</strong>ation of homelesspersons to access mental health services, which could result <strong>in</strong> a decrease <strong>in</strong> the numberreport<strong>in</strong>g a recent diagnosis or treatment.Substance abuseUnlike the trends for mental illness, rates for substance use have rema<strong>in</strong>ed relativelysteady s<strong>in</strong>ce the first survey <strong>in</strong> 1991, with year-to-year fluctuations rema<strong>in</strong><strong>in</strong>g with<strong>in</strong> thesame general range. On every measure <strong>in</strong> the survey, substance abuse rates fell slightly<strong>in</strong> <strong>2009</strong> compared to 2006.• 19% of homeless adults had recently been told they had an alcohol abuse disorder(compared to 21% <strong>in</strong> 2006). The proportion was higher for homeless men (24%) thanfor homeless women (13%). In comparison, 10% of all M<strong>in</strong>nesota adults were estimatedto have an alcohol dependence or abuse with a one-year period. 2• 14% of homeless adults had been diagnosed with drug abuse disorder, down from19% <strong>in</strong> 2006. Aga<strong>in</strong>, the proportion was higher for men (16%) than for women(12%). In comparison, the 12-month prevalence of drug dependence or abuse amongall M<strong>in</strong>nesota adults was estimated at 2.6% (8% for those age 18-25, and less than 2%for those age 26 or older). 2• 23% of all homeless adults had at least one of those two disorders (28% of men, 18%of women).• 36% of men and 22% of women considered themselves alcoholics or chemicallydependent.• 45% of homeless men and 25% of homeless women had been <strong>in</strong> an <strong>in</strong>-patient drug oralcohol treatment facility (and 22% of men and 13% of women had done so with<strong>in</strong>the past two years).• 16% of homeless adults had received outpatient alcohol or drug treatment <strong>in</strong> the lasttwo years.• 26% of homeless adults had been admitted to a detox center at least once <strong>in</strong> their life.• 17% had both a mental illness and a substance abuse disorder2U.S. Department of Health and Human Services, Substance Abuse and Mental Health ServicesAdm<strong>in</strong>istration, Office of Applied Statistics (2010). State estimates of substance use from the 2007-2008 National Surveys on Drug Use and Health. Wash<strong>in</strong>gton, D.C.: Author. Accessed June 14, 2010,from http://http://www.oas.samhsa.gov/2k7State/M<strong>in</strong>nesota.htm.<strong>Homelessness</strong> <strong>in</strong> M<strong>in</strong>nesota <strong>2009</strong> 21 <strong>Wilder</strong> Research, October 2010
Other disabilities• 41% reported that they had a physical, mental, or other health condition that limitedthe k<strong>in</strong>d or amount of work they could do.• 13% had a condition that makes it hard to engage <strong>in</strong> activities of daily liv<strong>in</strong>g (such asbath<strong>in</strong>g, eat<strong>in</strong>g, gett<strong>in</strong>g dressed, gett<strong>in</strong>g <strong>in</strong> or out of a bed or chair, or gett<strong>in</strong>g aroundby themselves).• 33% often feel confused, have trouble remember<strong>in</strong>g th<strong>in</strong>gs, or have problems mak<strong>in</strong>gdecisions, to the po<strong>in</strong>t that it <strong>in</strong>terferes with daily activities.• 32% had received a blow to the head hard enough to knock them out or make themsee stars, followed by problems with headache, concentration or memory, understand<strong>in</strong>g,excessive worry, sleep<strong>in</strong>g, or gett<strong>in</strong>g along with people (an <strong>in</strong>dication of a possibletraumatic bra<strong>in</strong> <strong>in</strong>jury). For over half of homeless adults who had suffered such ahead <strong>in</strong>jury with subsequent symptoms (55%), the <strong>in</strong>jury occurred before their firstexperience of homelessness. For another 8 percent, the <strong>in</strong>jury occurred dur<strong>in</strong>g thesame year (and is thus not clearly either before or after homelessness began). For38 percent, the <strong>in</strong>jury occurred after they had already become homeless.Each of these is with<strong>in</strong> two percentage po<strong>in</strong>ts of the rates reported <strong>in</strong> 2006, not asignificant difference.Disabilities occur together more often than aloneMost homeless adults suffer from more than just a s<strong>in</strong>gle disability. For this reason, asimple list<strong>in</strong>g of disabilities and their frequencies does not fully represent the challenges<strong>in</strong> liv<strong>in</strong>g with or overcom<strong>in</strong>g these disabilities. The diagram below shows the extent towhich the three most common disabilities – chronic health conditions, mental illness, andsubstance abuse disorders – pile up on each other.<strong>Homelessness</strong> <strong>in</strong> M<strong>in</strong>nesota <strong>2009</strong> 22 <strong>Wilder</strong> Research, October 2010
INCIDENCE AND CO-OCCURRENCE OF DISABILITIES AMONG HOMELESS ADULTSTotal homeless adults surveyed:5,957 (100%)Proportion with none of these three disabilities:1,557 (26%)Serious mentalillness (MI)3,250 (55%)CH & MI1,146 (19%)Chronic healthconditions (CH)2,761 (46%)MI ONLY1,017 (17%)CH ONLY852 (14%)CH & MI & SA630 (11%)SA & MI457 (8%)SA ONLY165 (3%)SA & CH133 (2%)Substance abusedisorder (SA)1,385 (23%)In addition to these three most common disabilities:• 41% of homeless adults (2,390) report conditions that limit the k<strong>in</strong>d or amount ofwork they can do• 33% of homeless adults (1,930) report cognitive disabilities• 32% of homeless adults (1,886) report likely traumatic bra<strong>in</strong> <strong>in</strong>juriesOnly 1,171 homeless adults (20%) report none of these six disabilities, and only 20 percentreport only one. More than 2,500 homeless adults (2,559, or 43% of all) report hav<strong>in</strong>gthree or more of the identified disabilities.<strong>Homelessness</strong> <strong>in</strong> M<strong>in</strong>nesota <strong>2009</strong> 23 <strong>Wilder</strong> Research, October 2010
Health careIn the area of health care:• 37% of homeless adults said they needed to see a doctor for a physical health problem(s<strong>in</strong>ce 2000 this figure has fluctuated between 35% and 43%).• 38% said they needed to see a health professional for a mental health problem (upfrom 30% <strong>in</strong> 2000 and similar to the percentages <strong>in</strong> 2003 and 2006).• 52% had current dental problems need<strong>in</strong>g attention (down from 59% <strong>in</strong> 2003 and56% <strong>in</strong> 2006).• 42% had visited an emergency room, an average of 2.5 times, <strong>in</strong> the past 6 months(similar to 37% and 2.5 times <strong>in</strong> 2003).• Of those who had used the emergency room, over one-third (37%) reported that atleast one visit had resulted <strong>in</strong> a hospital admission.• 19% had medication prescribed <strong>in</strong> the past year that they were not tak<strong>in</strong>g – 45% ofthem for a physical problem, 73% for a mental health problem, and 5% for a substanceabuse problem. The total proportion not tak<strong>in</strong>g needed medication was about thesame as <strong>in</strong> 2003 and 2006, but the number not tak<strong>in</strong>g needed mental health medicationshas <strong>in</strong>creased <strong>in</strong> each of the last two study periods (up from 56% <strong>in</strong> 2003 and 67%<strong>in</strong> 2006).• 76% had medical coverage dur<strong>in</strong>g the month of October 2006, up from the 69% whoreported such coverage <strong>in</strong> 2006. People who receive public medical benefits often areunable accurately to state which program provides the coverage. Answer<strong>in</strong>g to thebest of their knowledge, homeless adults reported the follow<strong>in</strong>g sources of theirmedical coverage: Medical Assistance (36%), General Assistance Medical Care(13%), M<strong>in</strong>nesotaCare (9%), Medicare (9%), veterans’ medical coverage (2%),employer-sponsored <strong>in</strong>surance (1%), and other or unknown sources (3%).<strong>Homelessness</strong> <strong>in</strong> M<strong>in</strong>nesota <strong>2009</strong> 24 <strong>Wilder</strong> Research, October 2010
Violence and abuseBoth as a cause and an effect of homelessness, violence and abuse are commonthreads <strong>in</strong> the lives of homeless adults.Domestic violenceSlightly under one-third (29%) of homeless women was homeless at least <strong>in</strong> part becauseof domestic abuse. This proportion is consistent with previous studies, and as <strong>in</strong> previousyears, it was higher <strong>in</strong> greater M<strong>in</strong>nesota (32%) than <strong>in</strong> the Tw<strong>in</strong> Cities area (27%).In addition, 23 percent of homeless adults (35% of women and 12% of men) had been <strong>in</strong>an abusive relationship <strong>in</strong> the past 12 months. This is one <strong>in</strong> which the partner had hitthem, slapped them, pushed them around, or threatened to do so. Moreover, 34 percentof homeless adults (48% of women and 22% of men) reported that they had stayed <strong>in</strong> anabusive relationship because they had nowhere else to live. These proportions areessentially the same as <strong>in</strong> 2006.Women flee<strong>in</strong>g abuse were <strong>in</strong> all types of shelter arrangements:• 34% were <strong>in</strong> battered women’s shelters• 38% were <strong>in</strong> transitional hous<strong>in</strong>g• 13% were <strong>in</strong> emergency shelters• 11% were stay<strong>in</strong>g outside of formal shelter programs, and had spent much of October<strong>in</strong> <strong>in</strong>formal shelter• 4% were liv<strong>in</strong>g <strong>in</strong> unsheltered locationsHistory of childhood abuse and neglectA history of abuse or neglect dur<strong>in</strong>g childhood is unusually common among homelessadults. In <strong>2009</strong>:• Just over one-third (36%) homeless adults had been physically abused as a child. As<strong>in</strong> previous surveys, the proportion was higher for women (45%) than for men (28%).• 1 out of 4 homeless adults (26%) had been sexually abused as a child. On thismeasure as well, the rates for women (41%) were higher than those for men (12%).<strong>Homelessness</strong> <strong>in</strong> M<strong>in</strong>nesota <strong>2009</strong> 25 <strong>Wilder</strong> Research, October 2010
• More than 1 out of 5 homeless adults (22%) had been neglected as a child (27% ofwomen and 17% of men).The <strong>2009</strong> rates are similar to those observed <strong>in</strong> the 2003 and 2006 surveys.Community violenceIn the <strong>2009</strong> survey, as <strong>in</strong> 2006, violence <strong>in</strong> the neighborhood was a factor for 11 percentof homeless adults leav<strong>in</strong>g their previous hous<strong>in</strong>g.Violence while homelessThe lack of stable hous<strong>in</strong>g puts people at higher risk for violence:• 20% of homeless adults had been physically or sexually assaulted while homeless(27% of women and 15% of men).• 12% of homeless adults had to seek health care because of an <strong>in</strong>jury or illnessresult<strong>in</strong>g from violence <strong>in</strong> the past year (15% of women and 10% of men).• 11% of homeless adults reported a head <strong>in</strong>jury followed by symptoms of likelytraumatic bra<strong>in</strong> <strong>in</strong>jury, that occurred after they had become homeless for the first time(12% of women and 11% of men).These rates are similar to those reported <strong>in</strong> 2006.<strong>Homelessness</strong> <strong>in</strong> M<strong>in</strong>nesota <strong>2009</strong> 26 <strong>Wilder</strong> Research, October 2010
ServicesOver 90 percent of homeless adults received at least one of the services listed <strong>in</strong>the survey dur<strong>in</strong>g the month of October 2010.Many of the services that are important to homeless adults are ma<strong>in</strong>stream services availableto a broader range of people, and <strong>in</strong>tended to support and <strong>in</strong>crease self-sufficiency. Comparedto other homeless adults, residents of transitional hous<strong>in</strong>g and battered women’s shelters aremore likely to use such services (which <strong>in</strong>clude Food Stamps, WIC, job tra<strong>in</strong><strong>in</strong>g, and help tof<strong>in</strong>d a job). Other services more specifically targeted to homeless people (such as drop-<strong>in</strong>centers, hot meal programs, and outreach services) are more frequently used by residents ofemergency shelters and people not us<strong>in</strong>g shelter or hous<strong>in</strong>g programs.The services most commonly received were:SERVICES RECEIVED BY HOMELESS ADULTS DURING OCTOBER <strong>2009</strong>ALLADULTSN=5,957Batteredwomen’ssheltern=273Emergencysheltern=1,876Transitionalhous<strong>in</strong>gn=2,224Informalsheltern=967Unshelteredn=617Food Stamps 63% 74% 67% 64% 55% 50%Free or almost free clothes 43% 51% 50% 36% 41% 44%Transportation assistance 42% 61% 47% 47% 28% 26%Hot meal program 33% 5% 50% 13% 37% 62%Food shelves 30% 13% 26% 28% 41% 38%Emergency room 26% 34% 29% 24% 24% 26%Drop-<strong>in</strong> centers 26% 4% 33% 11% 34% 50%Help f<strong>in</strong>d<strong>in</strong>g a job 22% 26% 25% 23% 19% 13%Help with public benefits 20% 30% 21% 21% 20% 12%Free medical cl<strong>in</strong>ic 20% 17% 29% 14% 17% 16%Outreach services 15% 5% 17% 10% 20% 27%Help with legal issues 13% 29% 11% 13% 12% 9%WIC (Women, Infant, and Children foodprogram) 12% 18% 6% 21% 10% 1%Job tra<strong>in</strong><strong>in</strong>g 11% 16% 10% 14% 8% 4%Free mental health cl<strong>in</strong>ic 11% 9% 14% 9% 10% 10%Free dental cl<strong>in</strong>ic 8% 5% 11% 7% 7% 8%Community voice mail 7% 8% 12% 5% 3% 4%State or federal veterans benefits 3% 2% 4% 3% 2% 2%At least one of the above 93% 95% 96% 92% 91% 90%More than one of the above 83% 87% 88% 79% 83% 81%Average number received 4.0 4.0 4.6 3.6 3.9 4.0<strong>Homelessness</strong> <strong>in</strong> M<strong>in</strong>nesota <strong>2009</strong> 27 <strong>Wilder</strong> Research, October 2010
Most helpful servicesFor those who received them, the follow<strong>in</strong>g services were most often mentioned amongthe three services that homeless adults considered the most helpful:• Food stamps (71% of those who received them)• WIC (62%)• State or federal veterans’ benefits (58%)• Hot meal program (53%)• Transportation assistance or bus cards (52%)These top services, and the percentages report<strong>in</strong>g them as helpful, were very similar tothose reported <strong>in</strong> the 2006 study.Public services and loss of benefits• 76% of adults had received public medical benefits dur<strong>in</strong>g the previous 12 months(86% of women, 67% of men). Of these, 11% had lost them dur<strong>in</strong>g that time orbecome unable to afford them.• 70% of homeless adults had received Food Stamps dur<strong>in</strong>g the previous 12 months(80% of women, 62% of men). Of these, 12% had lost them.• 42% of women had received MFIP dur<strong>in</strong>g the previous 12 months. Of these, 21%reported they had lost it dur<strong>in</strong>g that time period.• 29% of homeless women had received services through the Women, Infant, & Childrenfood program (WIC) <strong>in</strong> the previous 12 months. Of these, 4% had lost them.• 20% of homeless women had received child care assistance <strong>in</strong> the previous 12months; of these, 14% had lost them or become unable to afford them.• 12% of homeless adults had received SSI (either for themselves or for a child) <strong>in</strong> theprevious 12 months, of whom 7% reported hav<strong>in</strong>g lost SSI benefits dur<strong>in</strong>g that period.<strong>Homelessness</strong> <strong>in</strong> M<strong>in</strong>nesota <strong>2009</strong> 28 <strong>Wilder</strong> Research, October 2010
For most of these benefits, the proportions receiv<strong>in</strong>g them were similar to the proportions<strong>in</strong> 2006. The exceptions are public medical benefits, which was received by a slightlylarger proportion of homeless adults <strong>in</strong> the 12 months before the <strong>2009</strong> survey (76% vs.71%), and Food Stamps, which was received by a substantially higher proportion <strong>in</strong> <strong>2009</strong>(70% vs. 59%).For three of the k<strong>in</strong>ds of benefits, similar proportions reported hav<strong>in</strong>g lost benefits dur<strong>in</strong>gthe previous year. Compared to the 2006 survey, a slightly smaller proportion of <strong>2009</strong>respondents reported los<strong>in</strong>g public medical benefits (11% vs. 15%), Food Stamps (12%vs. 19%), and WIC (4% vs. 9%).<strong>Homelessness</strong> <strong>in</strong> M<strong>in</strong>nesota <strong>2009</strong> 29 <strong>Wilder</strong> Research, October 2010
Affordable hous<strong>in</strong>g<strong>Homelessness</strong> <strong>in</strong>volves many factors beyond the purely f<strong>in</strong>ancial. However, thecost of hous<strong>in</strong>g plays an important role <strong>in</strong> homelessness, and one that affects morepeople <strong>in</strong> <strong>2009</strong> than <strong>in</strong> 2006.What’s an affordable rent?A rule of thumb for hous<strong>in</strong>g affordability, particularly for lower-<strong>in</strong>comehouseholds, is that hous<strong>in</strong>g should cost no more than 30% of monthly<strong>in</strong>come. Hous<strong>in</strong>g that costs 50% or more of monthly <strong>in</strong>come is considered asevere hous<strong>in</strong>g cost burden.At the time of the survey, “fair market rent” (an amount, determ<strong>in</strong>ed annuallyby the federal government, that makes 40 to 50 percent of local apartmentsavailable to a renter) was $719 per month for a one-bedroom apartment <strong>in</strong>the Tw<strong>in</strong> Cities metropolitan area, and averaged $528 per month <strong>in</strong> the other80 counties of greater M<strong>in</strong>nesota.Employment and affordabilityThe median <strong>in</strong>come for all homeless adults <strong>in</strong> the Tw<strong>in</strong> Cities metropolitan area was$280. In greater M<strong>in</strong>nesota, it was $300. These are substantially below the median<strong>in</strong>come <strong>in</strong> 2006, which was $400 both <strong>in</strong> the Tw<strong>in</strong> Cities metropolitan area and <strong>in</strong> greaterM<strong>in</strong>nesota. For those who were employed, the median <strong>in</strong>come was $713 <strong>in</strong> the metropolitanarea and $650 <strong>in</strong> greater M<strong>in</strong>nesota. These <strong>in</strong>come levels are also significantly belowthose found <strong>in</strong> the 2006 study (which were $800 <strong>in</strong> the metro area and $680 <strong>in</strong> greaterM<strong>in</strong>nesota).In the metropolitan area, 68 percent of homeless adults say that they would need a onebedroomapartment or less, while <strong>in</strong> greater M<strong>in</strong>nesota 62 percent would need hous<strong>in</strong>gwith one bedroom or less (similar proportions as <strong>in</strong> 2006).Based on fair market rents and monthly <strong>in</strong>comes of employed homeless adults at the timeof the survey, the rent for a one-bedroom apartment is more than twice the median monthly<strong>in</strong>come for homeless adults <strong>in</strong> the seven-county metro area, and one and three-quarterstimes the monthly <strong>in</strong>come for those <strong>in</strong> greater M<strong>in</strong>nesota.<strong>Homelessness</strong> <strong>in</strong> M<strong>in</strong>nesota <strong>2009</strong> 30 <strong>Wilder</strong> Research, October 2010
At the wages earned by homeless adults, even full-time work is not enough to affordhous<strong>in</strong>g.• More than one-third (34%) of homeless work<strong>in</strong>g adults <strong>in</strong> the metro area earn lessthan $8 per hour. At this rate, a full-time worker would spend more than half (52% ormore) of his or her gross <strong>in</strong>come for a one-bedroom apartment.• Forty-one percent of homeless work<strong>in</strong>g adults <strong>in</strong> greater M<strong>in</strong>nesota earn less than $8per hour. At this rate, a full-time worker would spend more than 38 percent of his orher gross <strong>in</strong>come for a one-bedroom apartment.• Less than one-third (29%) of homeless workers <strong>in</strong> the metro area earn $8.00 to $9.99per hour. At this rate, a full-time worker would spend 41 percent to 52 percent of hisor her gross <strong>in</strong>come for a one-bedroom apartment.• One-third (33%) of homeless workers <strong>in</strong> greater M<strong>in</strong>nesota earn $8.00 to $9.99 perhour. At this rate, a full-time worker would spend 30 percent to 38 percent of his orher gross <strong>in</strong>come for a one-bedroom apartment.COMPARISON OF HOMELESS ADULTS’ MEDIAN INCOMES AND FAIR MARKET RENTSMetro areaGreaterM<strong>in</strong>nesotaMedian <strong>in</strong>come, all homeless adults $280 $300Median <strong>in</strong>come, employed homeless adults $713 $650Fair Market Rent, one-bedroom apartment $719 $528Fair Market Rent, two-bedroom apartment $873 $661Percent who need one bedroom or less 68% 62%1-BR rent as % of median monthly <strong>in</strong>come of those employed 101% 81%2-BR rent as % of median monthly <strong>in</strong>come of those employed 122% 102%Of those who were employed:Percent earn<strong>in</strong>g less than $8 per hour 34% 41%Percent of full-time <strong>in</strong>come at that wage needed for onebedroomapartment 52% or more 38% or morePercent earn<strong>in</strong>g $8 - $9.99 per hour 29% 33%Percent of full-time <strong>in</strong>come at that wage needed for onebedroomapartment 42 - 52% 30 - 38%Percent of full-time <strong>in</strong>come at that wage needed for twobedroomapartment 50 - 63% 38 - 48%<strong>Homelessness</strong> <strong>in</strong> M<strong>in</strong>nesota <strong>2009</strong> 31 <strong>Wilder</strong> Research, October 2010
Evidence of the role of affordability <strong>in</strong> homelessnessThe ability to pay for hous<strong>in</strong>g costs varies greatly between homeless adults who areemployed and those without employment.• 31% of unemployed homeless adults report be<strong>in</strong>g unable to afford any hous<strong>in</strong>g costs.17% report they could pay at least $500 a month.• 8% of those employed part-time could not afford to pay anyth<strong>in</strong>g; 26% report theycould pay at least $500 a month.• 1% of those employed full-time could not afford to pay anyth<strong>in</strong>g; 64% report theycould pay at least $500 a month.The average amount employed homeless adults report be<strong>in</strong>g able to afford each monthfor rent and utilities also differs greatly compared to unemployed homeless adults. Theseaverages were:• $546 per month for those employed full-time• $335 per month for those employed part-time• $220 for those not employedThe amounts that homeless adults say they would be able to pay for hous<strong>in</strong>g are verysimilar to those reported <strong>in</strong> 2006, compar<strong>in</strong>g people with the same employment status.However, s<strong>in</strong>ce fewer people were employed <strong>in</strong> <strong>2009</strong> than <strong>in</strong> 2006, the affordability ofhous<strong>in</strong>g is a somewhat larger problem <strong>in</strong> <strong>2009</strong>. Sixty percent of homeless adults <strong>in</strong> <strong>2009</strong>reported that the lack of a job or <strong>in</strong>come or lack of affordable hous<strong>in</strong>g was currentlyprevent<strong>in</strong>g them from gett<strong>in</strong>g hous<strong>in</strong>g, slightly up (from 57%) compared to 2006.<strong>Homelessness</strong> <strong>in</strong> M<strong>in</strong>nesota <strong>2009</strong> 32 <strong>Wilder</strong> Research, October 2010
Barriers to stable hous<strong>in</strong>gUnemployment, mental health issues, and crim<strong>in</strong>al records are common barriersto stable hous<strong>in</strong>g. Loss of jobs and <strong>in</strong>ability to afford rent were problems formore people <strong>in</strong> <strong>2009</strong> than <strong>in</strong> 2006.Ma<strong>in</strong> reasons for leav<strong>in</strong>g previous hous<strong>in</strong>g• Unable to afford rent (43%, up from 39% <strong>in</strong> 2006 and 33% <strong>in</strong> 2003)• Lost job or had hours cut (40%, up from 31% <strong>in</strong> 2006)• Eviction (32%)• Breakup with spouse or partner (25%) or other relationship problem (23%)• Dr<strong>in</strong>k<strong>in</strong>g or drug problem (19%)• Be<strong>in</strong>g abused (16%)• Entered jail or treatment (16%)• Dr<strong>in</strong>k<strong>in</strong>g or drug problem of someone else who was liv<strong>in</strong>g there (15%)• Substandard or unsafe hous<strong>in</strong>g (13%)• A behavior problem of a visitor or guest (12%)• Violence <strong>in</strong> the neighborhood (11%)• Home (apartment or own house) was foreclosed on (10%)The <strong>in</strong>ability to afford rent and the loss of a job were both up significantly from 2006rates. Other reasons for los<strong>in</strong>g hous<strong>in</strong>g were similar to the rates reported <strong>in</strong> 2006 (with<strong>in</strong>2 to 3 percentage po<strong>in</strong>ts). The frequency of foreclosure cannot be compared to 2006because the survey did not <strong>in</strong>clude the same question that year.Potential barriers to stable hous<strong>in</strong>gN<strong>in</strong>ety-eight percent of homeless adults have at least one of the follow<strong>in</strong>g ten barriers,and 93 percent have more than one. The most common barriers:• 80% are not currently employed (up from 71% <strong>in</strong> 2006).• 72% have been homeless before (up from 67%).<strong>Homelessness</strong> <strong>in</strong> M<strong>in</strong>nesota <strong>2009</strong> 33 <strong>Wilder</strong> Research, October 2010
• 55% have a serious mental health problem (slightly up from 52%).• 52% have been homeless for more than one year (up from 47%).• At least 39%, and likely as many as 50%, could pay less than $200 per month forrent 3 (up from 34% to 42%).Each of these five most common barriers to hous<strong>in</strong>g was reported by a higher proportionof homeless adults <strong>in</strong> <strong>2009</strong> than <strong>in</strong> 2006.• 29% consider themselves alcoholic or chemically dependent (33% <strong>in</strong> 2006).• 23% have a substance abuse diagnosis (down from 27% <strong>in</strong> 2006).As observed with many other <strong>in</strong>dicators related to substance abuse <strong>in</strong> the <strong>2009</strong> study,both of these barriers were reported less frequently <strong>in</strong> <strong>2009</strong> than <strong>in</strong> 2006, although thedifference for the first (consider themselves alcoholic or chemically dependent) is smallenough to be considered the same <strong>in</strong> both years.• 28% have been <strong>in</strong> jail or prison with<strong>in</strong> the past two years, or mention a crim<strong>in</strong>alrecord as a barrier to hous<strong>in</strong>g (27% <strong>in</strong> 2006).• 16% have credit problems (17% <strong>in</strong> 2006).• 13% need more than two bedrooms (15% <strong>in</strong> 2006).• 8% report that a health problem or physical disability has kept them from gett<strong>in</strong>g orkeep<strong>in</strong>g hous<strong>in</strong>g (10% <strong>in</strong> 2006).• 9% have an eviction or other rental problems on their record (9% <strong>in</strong> 2006).• 7% have no local rental history (6% <strong>in</strong> 2006).Each of these last six barriers was reported at essentially the same rate <strong>in</strong> <strong>2009</strong> as <strong>in</strong> 2006.Slightly fewer respondents reported none or only one of these barriers <strong>in</strong> <strong>2009</strong> (7% comparedto 11% <strong>in</strong> 2006). The average number of these barriers is 4 per person (3.8 overall, 4.0for men, and 3.7 for women).319% of respondents did not report data regard<strong>in</strong>g their ability to pay for hous<strong>in</strong>g, most of whomanswered “don’t know.” The lower number (39%) assumes all of these respondents could pay morethan $200 a month, and is therefore our lowest estimate. Assum<strong>in</strong>g non-responders were distributedmore similarly to those who did provide answers, the proportion of homeless adults who cannot pay$200 for rent and utilities is likely around 50%.<strong>Homelessness</strong> <strong>in</strong> M<strong>in</strong>nesota <strong>2009</strong> 34 <strong>Wilder</strong> Research, October 2010
Prior history of <strong>in</strong>stitutional liv<strong>in</strong>gAbout two-thirds of homeless adults (69%) have prior experience liv<strong>in</strong>g <strong>in</strong> <strong>in</strong>stitutionalarrangements, <strong>in</strong>clud<strong>in</strong>g:• 47% have lived <strong>in</strong> a jail, prison, or juvenile detention center (17% with<strong>in</strong> the last two years).• 36% have lived <strong>in</strong> a drug or alcohol treatment facility (18% with<strong>in</strong> the last two years).• 23% have lived <strong>in</strong> some type of halfway house (11% with<strong>in</strong> the last two years).• 20% have lived <strong>in</strong> a facility for persons with emotional, behavioral, or mental healthproblems (11% with<strong>in</strong> the last two years).• 22% have lived <strong>in</strong> a foster home (2% with<strong>in</strong> the last two years).These proportions are essentially the same as <strong>in</strong> the 2006 survey.Sixty-seven percent of homeless adults who left correctional facilities <strong>in</strong> the past yearreported that they did not have a stable place to live when they left. This proportion is upfrom 65 percent <strong>in</strong> 2006 and 58 percent <strong>in</strong> 2003. Fifty-one percent of those leav<strong>in</strong>g socialservice placements <strong>in</strong> the past year reported they did not have a stable place to stay at thetime of release. This proportion is down from 57 percent <strong>in</strong> 2006 and about the same asthe 50 percent <strong>in</strong> 2003.The follow<strong>in</strong>g shows the most common k<strong>in</strong>ds of <strong>in</strong>stitutions from which homeless adultshad been discharged with<strong>in</strong> the past 12 months, and the percent for each who lacked astable place to live at the time of discharge:• County jails or workhouses (69%, essentially the same as 70% <strong>in</strong> 2006)• State or federal prisons (63%, up from 53%)• Group homes (43%, down from 49%)• Foster homes (42%, down from 50%)The proportion of people leav<strong>in</strong>g correctional facilities without a stable place to live hasrisen s<strong>in</strong>ce 2003, from 58 percent to 65 percent to 67 percent. The proportion of peopleleav<strong>in</strong>g other k<strong>in</strong>ds of <strong>in</strong>stitutions without a stable place to live is the same as when firstasked <strong>in</strong> 2003, after ris<strong>in</strong>g somewhat <strong>in</strong> 2006.<strong>Homelessness</strong> <strong>in</strong> M<strong>in</strong>nesota <strong>2009</strong> 35 <strong>Wilder</strong> Research, October 2010
Many adults who are homeless follow<strong>in</strong>g time <strong>in</strong> a residential facility were also homelessbefore they entered it. However, survey responses suggest that spend<strong>in</strong>g time <strong>in</strong> treatment andsocial service placements generally improve residents’ chances of secur<strong>in</strong>g stable hous<strong>in</strong>g,while spend<strong>in</strong>g time <strong>in</strong> correctional facilities tends to decrease later hous<strong>in</strong>g stability.Twelve percent of homeless adults had left correctional facilities <strong>in</strong> the previous 12 months(the same proportion as <strong>in</strong> 2006). Of this group:• 64% were homeless at the time of <strong>in</strong>carceration (up from 57% <strong>in</strong> 2006)• 13% were homeless when <strong>in</strong>carcerated but had stable hous<strong>in</strong>g at release (essentiallythe same as 11% <strong>in</strong> 2006)• 15% were housed when <strong>in</strong>carcerated but did not have stable hous<strong>in</strong>g at release (slightlydown from 19% <strong>in</strong> 2006)• 26% reported that they received help to try to f<strong>in</strong>d stable hous<strong>in</strong>g at the time of theirrelease (slightly above the 24% <strong>in</strong> 2006 and 2003)Sixteen percent of homeless adults had left non-corrections <strong>in</strong>stitutional facilities <strong>in</strong> theprevious 12 months, <strong>in</strong>clud<strong>in</strong>g group homes, halfway houses, mental health treatment, ordrug/alcohol treatment (essentially the same as the 17% <strong>in</strong> 2006). Of this group:• 69% were homeless at the time of entry (about the same as 72% <strong>in</strong> 2006)• 29% were homeless at entry but had stable hous<strong>in</strong>g at release (about the same as27% <strong>in</strong> 2006)• 10% were housed at entry but lacked stable hous<strong>in</strong>g at release (about the same as12% <strong>in</strong> 2006)• 45% reported that they received help to try to f<strong>in</strong>d stable hous<strong>in</strong>g at the time of theirrelease (slightly up from 40% <strong>in</strong> 2003 and 42% <strong>in</strong> 2006)Prior experiences of homelessness• 74% of homeless adults report that they have been homeless at least one other time <strong>in</strong>their lives (similar to the 71% <strong>in</strong> 2006).• 58% of homeless adults have been homeless more than once <strong>in</strong> the past three years(up from 53% <strong>in</strong> 2006).<strong>Homelessness</strong> <strong>in</strong> M<strong>in</strong>nesota <strong>2009</strong> 36 <strong>Wilder</strong> Research, October 2010
• In their current episode, 8% of homeless adults have been homeless for less than a month(essentially the same as the 9% <strong>in</strong> 2006). Forty percent have been homeless betweenone month and one year; and 52% have been homeless for a year or longer. Thisrepresents a slight shift toward longer episodes (compared to 44% homeless betweenone month and one year <strong>in</strong> the 2006 study, and 47% homeless for a year or longer).• 11% of homeless adults report that they were <strong>in</strong> any homeless shelter or program as achild. This under-represents actual experiences of homelessness dur<strong>in</strong>g childhood,because 26% say that they were 17 or younger “the very first time [they] were homeless,either with or without [their] parents.” These proportions are similar to those <strong>in</strong> 2006,although slightly higher.The <strong>2009</strong> survey shows a small but consistent trend toward <strong>in</strong>creased homelessness alongmany different dimensions: More people homeless on the date of the study, more whohave been homeless more than once, longer episodes of homelessness, and more adultswho report a first experience of homelessness as a child.<strong>Homelessness</strong> <strong>in</strong> M<strong>in</strong>nesota <strong>2009</strong> 37 <strong>Wilder</strong> Research, October 2010
Th<strong>in</strong>gs look different <strong>in</strong> greater M<strong>in</strong>nesotaHomeless adults <strong>in</strong> greater M<strong>in</strong>nesota were less likely to be us<strong>in</strong>g formal shelterprograms than those <strong>in</strong> the metro area.About one-third (32%) of all homeless adults counted <strong>in</strong> the study, and the same proportion(32%) of children with their parents, were liv<strong>in</strong>g outside the seven-county Tw<strong>in</strong> Citiesmetropolitan area <strong>in</strong> <strong>2009</strong>. The proportion of homeless people found by the study <strong>in</strong>greater M<strong>in</strong>nesota is grow<strong>in</strong>g. In 1991, only one out of five (20%) homeless personswere found <strong>in</strong> greater M<strong>in</strong>nesota, compared to the 32 percent <strong>in</strong> <strong>2009</strong>. It is not clearwhether the observed <strong>in</strong>crease <strong>in</strong> greater M<strong>in</strong>nesota homelessness represents actualgrowth <strong>in</strong> numbers or improved outreach efforts. Outside of metropolitan areas,homeless people are more <strong>in</strong>visible because there are fewer shelters to serve them.PERCENT OF HOMELESS ADULTS IN THE TWIN CITIES METRO AREA AND GREATER MINNESOTA80% 80% 79% 76%72% 70% 68%Tw<strong>in</strong> Cities Metro20% 20% 21% 24%28% 30%32%Greater M<strong>in</strong>nesota1991 1994 1997 2000 2003 2006 <strong>2009</strong>With people further apart from each other and fewer services, patterns of homelessnessare different <strong>in</strong> greater M<strong>in</strong>nesota. Homeless adults are similar across the state on manymeasures, <strong>in</strong>clud<strong>in</strong>g education levels, how long they have lived <strong>in</strong> M<strong>in</strong>nesota, and whetheror not they have children with them. On other measures, however, patterns <strong>in</strong> greaterM<strong>in</strong>nesota are different. For <strong>in</strong>stance, the <strong>2009</strong> survey shows that <strong>in</strong> greater M<strong>in</strong>nesota:• Homeless adults were slightly younger on average (35, compared to 38 <strong>in</strong> the metro area)• 58% of homeless adults were White (30% <strong>in</strong> the metro region)<strong>Homelessness</strong> <strong>in</strong> M<strong>in</strong>nesota <strong>2009</strong> 38 <strong>Wilder</strong> Research, October 2010
• 19% of homeless adults were American Indian (more than twice as high as the 8% <strong>in</strong>the metro area)• More homeless adults derived their <strong>in</strong>come (if they had any) ma<strong>in</strong>ly from employment(25%, compared to 17% <strong>in</strong> the metro area), and fewer from General Assistance (18%,compared to 30%)• 51% of homeless adults fit the def<strong>in</strong>ition of long-term homeless (63% <strong>in</strong> the metro area)• Fewer children were <strong>in</strong> transitional hous<strong>in</strong>g programs (51%, compared to 64% <strong>in</strong> themetro area) or emergency shelters (12% vs. 22%)• More children were <strong>in</strong> unsheltered situations (4% vs. less than 0.5%) and <strong>in</strong>formalarrangements (24% vs. 4%)• 42% of homeless adults had a chronic health condition (48% <strong>in</strong> the metro area)• 32% of homeless women were flee<strong>in</strong>g abuse (27% <strong>in</strong> the metro area)While the exact percentages have changed some s<strong>in</strong>ce 2006, the difference between themetro area and greater M<strong>in</strong>nesota has stayed the same on each of these measures.Compared to 2006, <strong>in</strong> <strong>2009</strong> fewer men <strong>in</strong> greater M<strong>in</strong>nesota were military veterans.Figures for greater M<strong>in</strong>nesota this year are less precise estimates than <strong>in</strong> the past, due the<strong>in</strong>ability of one major veterans program to participate <strong>in</strong> the <strong>2009</strong> study. However, thedecrease <strong>in</strong> greater M<strong>in</strong>nesota is large, from 28 percent of homeless men <strong>in</strong> 2006 toapproximately 17 percent <strong>in</strong> <strong>2009</strong> (compared to a decrease from 22% to 20% <strong>in</strong> the metroarea). Given the overall <strong>in</strong>crease <strong>in</strong> the number of homeless adults, the large decrease <strong>in</strong>the percentage of veterans <strong>in</strong> greater M<strong>in</strong>nesota represents only a small decrease <strong>in</strong> theoverall number of veterans.With regard to use of services, homeless adults <strong>in</strong> greater M<strong>in</strong>nesota were substantiallymore likely than those <strong>in</strong> the metro area to use food shelves or receive assistance to getconnected to f<strong>in</strong>ancial or other public benefits. They were less likely to use transportationassistance, drop-<strong>in</strong> centers, free cl<strong>in</strong>ics or community voice mail. These and otherdifferences are shown below.<strong>Homelessness</strong> <strong>in</strong> M<strong>in</strong>nesota <strong>2009</strong> 39 <strong>Wilder</strong> Research, October 2010
SERVICES USED OR RECEIVED DURING OCTOBERGreater M<strong>in</strong>nesota Metro areaFood stamps 64% 62%Free or almost free clothes 45% 42%Food shelves 37% 27%Hot meal program 32% 34%Transportation assistance 32% 47%Help with public benefits 25% 18%Emergency room 25% 27%Help f<strong>in</strong>d<strong>in</strong>g a job 21% 22%Drop <strong>in</strong> centers 21% 28%Outreach services 17% 14%Help with legal issues 14% 12%WIC (Women, Infants, and Children food program) 14% 11%Free medical cl<strong>in</strong>ic 13% 23%Job tra<strong>in</strong><strong>in</strong>g 10% 12%Free mental health cl<strong>in</strong>ic 7% 12%Free dental cl<strong>in</strong>ic 5% 10%State or federal veterans benefits 3% 3%Community voice mail 2% 9%Homeless adults <strong>in</strong> greater M<strong>in</strong>nesota were less likely to be us<strong>in</strong>g formal shelter programs(55%, compared to 82% <strong>in</strong> the metro area). They were about equally likely to have spenta considerable time <strong>in</strong> October <strong>in</strong> unsheltered situations (12%, compared to 10% <strong>in</strong> themetro area). They were much more likely to have spent considerable time dur<strong>in</strong>g October <strong>in</strong><strong>in</strong>formal shelter arrangements such as paid motel rooms or mov<strong>in</strong>g around for short stayswith friends or relatives (33%, compared to 8% <strong>in</strong> the metro area). They were less likelyto report that they had been turned away from a shelter <strong>in</strong> the last three months due to alack of bed spaces (19%, compared to 23% <strong>in</strong> the metro area).<strong>Homelessness</strong> <strong>in</strong> M<strong>in</strong>nesota <strong>2009</strong> 40 <strong>Wilder</strong> Research, October 2010
PERCENT OF HOMELESS ADULTS AND UNACCOMPANIED MINORS (12-17) BY SHELTER TYPE ANDREGION (<strong>2009</strong>)Greater M<strong>in</strong>nesotaTw<strong>in</strong> Cities metroM<strong>in</strong>ors Adults M<strong>in</strong>ors AdultsBattered women’s shelters 8% 5% 4% 4%Emergency shelters 25% 17% 21% 37%Transitional hous<strong>in</strong>g 34% 30% 33% 39%Unsheltered 0% 13% 3% 10%Informal arrangements 33% 35% 39% 9%<strong>Homelessness</strong> <strong>in</strong> M<strong>in</strong>nesota <strong>2009</strong> 41 <strong>Wilder</strong> Research, October 2010
Section II: Children and youthChildren with their parentsHalf of homeless children who are with their parents are 5 or younger. Homelesschildren whose parents were not <strong>in</strong> official shelters fare the worst on manymeasures of well-be<strong>in</strong>g.Many children experience homelessnessA total of 3,251 children were homeless with their parents on October 22, <strong>2009</strong> and weredocumented <strong>in</strong> the study, a 19 percent <strong>in</strong>crease <strong>in</strong> numbers from 2006. The number <strong>in</strong>shelter programs was also higher than <strong>in</strong> previous studies (2,857, compared to 2,501 <strong>in</strong>2006), while the <strong>in</strong>creased outreach effort <strong>in</strong> <strong>2009</strong> also counted more homeless childrennot <strong>in</strong> formal shelters (394, compared to 225 <strong>in</strong> 2006). Includ<strong>in</strong>g unaccompanied youth,children were 36 percent of all homeless <strong>in</strong>dividuals <strong>in</strong> <strong>2009</strong>.Be<strong>in</strong>g homeless as a child puts children at risk for a variety of negative experiences andreduces opportunities to thrive. In the <strong>2009</strong> study, 26 percent of adults reported that theyhad first experienced homelessness as a child (17 or younger). This is an <strong>in</strong>crease fromthe 22 percent found <strong>in</strong> the 2006 study. Among parents who had children with them, thepercentage was higher, at 34 percent.Besides the children who were homeless with their parents, another 2,189 were affectedby a parent’s homelessness but were not with that parent.Ages of homeless childrenOf the homeless children who were with their parents:• 52% were age 5 or younger (<strong>in</strong>clud<strong>in</strong>g 12 children of unaccompanied homeless youth)• 33% were 6 – 12 years old• 16% were 13 – 17 years oldNote: The age <strong>in</strong>formation above is based on the 2,075 children whose parents were <strong>in</strong>terviewed, and not on the2,857 children reflected <strong>in</strong> the shelter census figures for the night of the survey.<strong>Homelessness</strong> <strong>in</strong> M<strong>in</strong>nesota <strong>2009</strong> 42 <strong>Wilder</strong> Research, October 2010
Most homeless families did not have a father present• Most children were with their mother or female caretaker only (74%).• 67% of homeless women had children age 17 or younger, and 54% had at least onechild with them.• 33% of homeless men had m<strong>in</strong>or children, and 7% had at least one child with them.Average ages and family composition are essentially the same as <strong>in</strong> 2006.Children’s health, nutrition, and mental healthAmong parents whose children were with them:• 21% said that at least one of their children had an emotional or behavioral problem,about three times the rate for the overall population.• 12% could not get needed dental care for at least one child <strong>in</strong> the past year.• 13% had at least one child with a chronic or severe physical health problem.• 8% said their children skipped meals <strong>in</strong> the previous month because there was notenough money to buy food.• 8% had been unable to obta<strong>in</strong> needed health care for at least one child <strong>in</strong> the past year.• 3% had been unable to get needed mental health care for at least one child <strong>in</strong> the past year.These measures are similar to those found <strong>in</strong> 2006 overall. However, <strong>in</strong> <strong>2009</strong> we observed agreater level of difficulty for children with parents who had made more use of <strong>in</strong>formalshelter arrangements. Among this group of families, 27 percent of parents reported an<strong>in</strong>ability to secure needed dental care for their children, 19 percent said their children hadhad to skip meals <strong>in</strong> the past month, and 14 percent reported they had been unable toobta<strong>in</strong> needed health care for children <strong>in</strong> the past year.<strong>Homelessness</strong> <strong>in</strong> M<strong>in</strong>nesota <strong>2009</strong> 43 <strong>Wilder</strong> Research, October 2010
EducationAmong parents who had school-age children:• 19% had a child who had repeated a grade (the same as <strong>in</strong> 2006).• 38% had at least one school-age child with learn<strong>in</strong>g difficulties or other schoolrelatedproblems (essentially the same as <strong>in</strong> 2006).• 84% reported that all their school-age children attended school on the day of thesurvey. This is a decrease from the 90% reported <strong>in</strong> 2006. However, the studyoccurred at a time when many schools were report<strong>in</strong>g unusually high absence ratesdue to <strong>in</strong>fectious diseases (<strong>in</strong>clud<strong>in</strong>g the H1N1 flu), which may expla<strong>in</strong> all or most ofthe decrease. Attendance was lowest among children whose parents used more <strong>in</strong>formalarrangements (only 73% of whom reported all children had attended school on theday of the survey).• 11% said their children had trouble go<strong>in</strong>g to school because of their hous<strong>in</strong>g situation.This was a greater problem <strong>in</strong> emergency shelters (17%), battered women’s shelters(9%), and for those who had spent more time <strong>in</strong> <strong>in</strong>formal shelter (36%) than for those<strong>in</strong> transitional hous<strong>in</strong>g (4%). Only n<strong>in</strong>e adults liv<strong>in</strong>g <strong>in</strong> unsheltered locations hadchildren with them; of these, six reported that their hous<strong>in</strong>g situation <strong>in</strong>terfered withtheir children’s school attendance.The parents report<strong>in</strong>g their children had the most difficulty attend<strong>in</strong>g school were those whohad made most use of <strong>in</strong>formal shelter arrangements (doubl<strong>in</strong>g up with friends or familiesfor short stays <strong>in</strong> between shelter stays). This group was also the only one for whom thedifficulty <strong>in</strong> attend<strong>in</strong>g school was significantly higher <strong>in</strong> <strong>2009</strong> compared to 2006.To the extent that families are encouraged or obliged to double up due to a shortage ofemergency shelters, this appears to be caus<strong>in</strong>g serious disruptions <strong>in</strong> the education formany children. Shelters typically make arrangements to help children cont<strong>in</strong>ue to attendtheir orig<strong>in</strong>al schools, and have provisions for bus service and sometimes other schoolrelatedsupports. Private families who allow friends or relatives to stay with themtemporarily are less likely to be able to make such arrangements on their behalf.<strong>Homelessness</strong> <strong>in</strong> M<strong>in</strong>nesota <strong>2009</strong> 44 <strong>Wilder</strong> Research, October 2010
Youth on their ownYouth age 21 and under who are on their own are the fastest grow<strong>in</strong>g homelesspopulation <strong>in</strong> our study.How many youth are homeless?The number of homeless youth on their own has significantly <strong>in</strong>creased s<strong>in</strong>ce 2006. OnOctober 22, <strong>2009</strong>, the study counted 1,268 youth on their own (up from 867 counted <strong>in</strong>2006); 227 were age 17 and younger; 1,041 were 18 through 21. This is an <strong>in</strong>crease of46% over the 2006 study.On any given night, an estimated 2,500 M<strong>in</strong>nesota youth experience homelessness. This<strong>in</strong>cludes an estimated 550 m<strong>in</strong>or youth ages 17 and under; and 1,950 young adults age 18through 21. These numbers are conservative estimates; the number of unaccompaniedyouth is likely considerably higher.More youth were identified <strong>in</strong> <strong>2009</strong> than <strong>in</strong> any previous study – however, the patternsvaried by age group.• This <strong>in</strong>crease was seen particularly <strong>in</strong> the number of young adults, ages 18 through 21– up 57 percent over the previous study.• The number of youth m<strong>in</strong>ors, ages 17 and under, who were counted <strong>in</strong> sheltersdecreased by 9 percent over the previous study. However, the number of youthm<strong>in</strong>ors who were not stay<strong>in</strong>g <strong>in</strong> shelters <strong>in</strong>creased by 75 percent.These patterns are particularly alarm<strong>in</strong>g given that the largest <strong>in</strong>crease <strong>in</strong> turnaways fromshelters was among youth, and the number of youth shelter beds, particularly for youth 17and under, has rema<strong>in</strong>ed flat s<strong>in</strong>ce 2003.On October 22, <strong>2009</strong>, we <strong>in</strong>terviewed 817 youth <strong>in</strong> shelters, other temporary hous<strong>in</strong>gprograms, and places not <strong>in</strong>tended as hous<strong>in</strong>g. This was more <strong>in</strong>terviews conducted withthis population than ever before. This is <strong>in</strong> large part due to the efforts of outreach workers.Youth who are homeless and on their own tend to be some of the most difficult to f<strong>in</strong>d ofthose experienc<strong>in</strong>g homelessness. Homeless youth are less likely than adults to stay <strong>in</strong>shelters, more often stay<strong>in</strong>g temporarily with friends or <strong>in</strong> places not <strong>in</strong>tended for habitation.Thus they are less likely to be found <strong>in</strong> a one-night survey. Compared to homeless adultsand families, homeless youth have fewer shelters available and fewer legal provisions forhous<strong>in</strong>g and other basic needs.<strong>Homelessness</strong> <strong>in</strong> M<strong>in</strong>nesota <strong>2009</strong> 45 <strong>Wilder</strong> Research, October 2010
Who we talked withWe talked with youth who were on their own – without their parents. For the purposes ofthis study and to fit with recent changes <strong>in</strong> legislations, we describe three segments ofhomeless persons age 21 and younger.• Youth m<strong>in</strong>ors age 17 and under and not with their parents.• Young adults age 18 through 21.• Youth comb<strong>in</strong>es both groups to describe all homeless persons ages 21 and under andon their own.Data from this study support the observations, made by people who work with homelessm<strong>in</strong>ors (under age 18) and young adults (18-21), that both groups have similar characteristicsand needs. Where differences were found, we describe them <strong>in</strong> the f<strong>in</strong>d<strong>in</strong>gs. However,where there were similarities <strong>in</strong> the responses of youth m<strong>in</strong>ors and young adults, we comb<strong>in</strong>ethe responses of all “youth” we <strong>in</strong>terviewed (both youth m<strong>in</strong>ors and young adults).Demographic characteristicsThe average age for youth m<strong>in</strong>ors on their own was 16 (19½ for young adults). Theyoungest <strong>in</strong>terviewed <strong>in</strong> <strong>2009</strong> was 12. Six out of 10 (61%) homeless youth are girls,while <strong>in</strong> the overall homeless adult population 47 percent are female. National studiesshow that girls are more likely to seek shelter and other services and thus be <strong>in</strong>cluded <strong>in</strong> aone-night snapshot.The number of homeless youth of color is disproportionately high compared to theirprevalence <strong>in</strong> the general population of M<strong>in</strong>nesota youth. Two-thirds of homeless youth(67%) were Black, American Indian, Asian, Hispanic, or of mixed race, compared to just18 percent of all M<strong>in</strong>nesota youth (US Census, 2008 American Community Survey microdata).In the metro area, 80 percent were youth of color; <strong>in</strong> greater M<strong>in</strong>nesota, youth of colorcomprised 48 percent of the youth homeless population found on the day of the survey.<strong>Homelessness</strong> <strong>in</strong> M<strong>in</strong>nesota <strong>2009</strong> 46 <strong>Wilder</strong> Research, October 2010
RACIAL OR ETHNIC BACKGROUND OF UNACCOMPANIED HOMELESS YOUTH (AGE 12-21)Total Metro Greater M<strong>in</strong>nesotaAfrican American 37% 52% 15%African Native 1% 1% 2%American Indian 16% 12% 23%Asian 1% 1% 2%Hispanic – may be of any race 11% 12% 9%White 33% 20% 52%Other/More than one 11% 13% 8%For homeless youth on their own:• The average age they first left home was 16.• Overall, 34 percent of youth had children of their own (17% of youth m<strong>in</strong>ors and 37%of young adults). For females, 25 percent of youth m<strong>in</strong>ors and 50 percent of youngadults had children. These are higher rates for youth m<strong>in</strong>ors than <strong>in</strong> 2006 (when theproportions were 13% overall and 19% of females).• The vast majority of homeless youth grew up <strong>in</strong> M<strong>in</strong>nesota (69% of youth overall;77% of youth m<strong>in</strong>ors and 68% of young adults). Compared to 2006, this proportionhas rema<strong>in</strong>ed consistent for young adults, but decreased for youth m<strong>in</strong>ors (87% to77%).• One-third of homeless youth (34%) were last housed <strong>in</strong> greater M<strong>in</strong>nesota (outsidethe Tw<strong>in</strong> Cities metro). This is the same proportion as <strong>in</strong> 2006.• Most homeless youth grew up liv<strong>in</strong>g with biological parents (65%). Others livedma<strong>in</strong>ly <strong>in</strong> a blended family (10%), with grandparents or other relatives (10%), <strong>in</strong> afoster family (6%), or <strong>in</strong> an adoptive family (4%). These proportions are similar tothose <strong>in</strong> 2006.• 9% of homeless youth had lived <strong>in</strong> an adoptive home at some po<strong>in</strong>t <strong>in</strong> their lives (5% ofyouth m<strong>in</strong>ors and 10% of young adults).• Four <strong>in</strong> 10 (40%) youth identified by the study as homeless were found outside of theTw<strong>in</strong> Cities <strong>in</strong> greater M<strong>in</strong>nesota (52% of youth m<strong>in</strong>ors and 37% of young adults).These are about the same proportions as <strong>in</strong> 2006.<strong>Homelessness</strong> <strong>in</strong> M<strong>in</strong>nesota <strong>2009</strong> 47 <strong>Wilder</strong> Research, October 2010
• 12% of youth identified themselves as lesbian, gay, bisexual or were unsure abouttheir sexual orientation. Five youth (less than 1%) identified themselves astransgender.Youth’s experiences with homelessness• Three-quarters of youth (74%) had been homeless before (similar to the 71% <strong>in</strong> 2006).• One-quarter slept outside at least one night <strong>in</strong> October <strong>2009</strong> (24%, similar to the 29%on a slightly later date <strong>in</strong> the month <strong>in</strong> 2006).• More than one-third were “doubled up” at least one night <strong>in</strong> October <strong>2009</strong> (39%,down from 51% <strong>in</strong> 2006).• Three <strong>in</strong> 10 (30%) had stayed <strong>in</strong> an abusive situation because they did not have otherhous<strong>in</strong>g options.• 22 percent had been attacked or beaten while they were homeless.Youth <strong>in</strong>terviewed for this study had been homeless longer than those <strong>in</strong>terviewed <strong>in</strong>2006. Over half (52%) were liv<strong>in</strong>g <strong>in</strong> situations that fit the def<strong>in</strong>ition of long-termhomeless as def<strong>in</strong>ed by the State of M<strong>in</strong>nesota. This is up from 46 percent <strong>in</strong> 2006.Thirteen percent had been homeless less than a month compared to 18 percent <strong>in</strong> 2006.Nearly half (49%) had been homeless between one month and a year compared to 52 percent<strong>in</strong> 2006. Over a third (38%) had no regular place to live for more than a year compared to31 percent <strong>in</strong> 2006. Because the study takes place on a s<strong>in</strong>gle day, people who are homelessfor longer periods of time have a greater chance of be<strong>in</strong>g <strong>in</strong>terviewed compared to peoplewho are homeless for only a short time, so these figures under-represent the number ofyouth who are homeless for only a short period of time.Many homeless youth come from troubled backgrounds and facemultiple challenges• Nearly 1 <strong>in</strong> 2 homeless youth (46%) report some type of significant mental healthproblem. The percentage of youth with mental health problems dropped for the youthm<strong>in</strong>ors (age 17 and younger) from 54 percent <strong>in</strong> 2006 to 42 percent <strong>in</strong> <strong>2009</strong>; itrema<strong>in</strong>ed constant for the young adults ages 18 through 21 (47%).• One-third of homeless youth have considered suicide (31%) and 20% have attemptedsuicide (proportions similar to those <strong>in</strong> 2006).<strong>Homelessness</strong> <strong>in</strong> M<strong>in</strong>nesota <strong>2009</strong> 48 <strong>Wilder</strong> Research, October 2010
• Nearly 1 out of 2 homeless youth (45%) have been physically or sexually mistreated.Forty-two percent have been physically abused (38% of youth m<strong>in</strong>ors and 43% ofyoung adults). Twenty-seven percent have been sexually abused (20% of youth m<strong>in</strong>orsand 28% of young adults). About four times as many girls as boys have been sexuallyabused (39% of girls and 9% of boys). These abuse rates are lower than <strong>in</strong> 2006,especially physical abuse experienced by youth m<strong>in</strong>ors (38% vs. 52%) and sexualabuse experienced by boys (9% vs. 16%).• 1 <strong>in</strong> 3 homeless youth had experienced parental neglect (34%). This percentage hasrema<strong>in</strong>ed constant s<strong>in</strong>ce 2006.• Over a third of homeless youth (36%) had a history of del<strong>in</strong>quency that resulted <strong>in</strong> acorrectional placement, down from 42% <strong>in</strong> 2006, with the decrease entirely amongyoung adults).• Eighteen percent of homeless youth had been <strong>in</strong> alcohol or drug treatment, down from25 percent <strong>in</strong> 2006.• 49% of homeless youth had been pregnant or made someone pregnant (29% of youthm<strong>in</strong>ors, and 54% of young adults).• 1 out of 5 youth (18%) had problems follow<strong>in</strong>g a head <strong>in</strong>jury (11% of youth m<strong>in</strong>orsand 19% of young adults). These proportions are lower than <strong>in</strong> 2006, especially amongyouth m<strong>in</strong>ors (11% vs. 17%).• 1 <strong>in</strong> 6 youth (16%) had traded sex for shelter, food, cloth<strong>in</strong>g, or other essentials. Theproportion was slightly lower for youth m<strong>in</strong>ors (11% overall; 13% of girls and 9% of boys),and slightly higher for young adults (16% overall; 17% of females and 16% of males).The differences from 2006 are complicated and may be due to chance variation (down form<strong>in</strong>or girls and up for m<strong>in</strong>or boys, but up for older females and down for older males).The overall rate of 16 percent is not significantly different from the 14 percent <strong>in</strong> 2006.SELECTED LIFE EXPERIENCES OF HOMELESS YOUTH MINORS 17 AND UNDER, 1991-<strong>2009</strong>1991 1994 1997 2000 2003 2006 <strong>2009</strong>Physically abused 47% 54% 42% 47% 38% 53% 38%Consider self chemically dependent 10% 19% 15% 13% 12% 11% 12%Told by a medical professional <strong>in</strong> the past2 years that they have a significant mentalhealth problemNotavailableNotavailable23% 31% 29% 36% 25%Have children 16% 18% 17% 8% 16% 13% 17%Sexual relationship that resulted <strong>in</strong> pregnancy 32% 33% 31% 21% 26% 26% 29%<strong>Homelessness</strong> <strong>in</strong> M<strong>in</strong>nesota <strong>2009</strong> 49 <strong>Wilder</strong> Research, October 2010
An analysis was done to determ<strong>in</strong>e the percentage of youth who had multiple risk factors– <strong>in</strong>clud<strong>in</strong>g mental health issues, abuse, and chemical dependency. In <strong>2009</strong>, 63 percentof youth had at least one of these risk factors. This is down significantly from 72 percent<strong>in</strong> 2006.MULTIPLE RISK FACTORS OF HOMELESS YOUTHTotal homeless youth surveyed:817 (100%)Mental healthissues (MI)376 (46%) totalMI only113 (14%)MI & abuse184 (23%)All 355 (7%)Abuse only123 (15%)Physical orsexual abuse (Abuse)371 (45%) totalMI & CD24 (3%)CD only10 (1%)CD &Abuse9 (1%)Chemicaldependency (CD)98 (12%) totalMI, CD, or Abuse(ANY)None of these three299 (37%)<strong>Homelessness</strong> <strong>in</strong> M<strong>in</strong>nesota <strong>2009</strong> 50 <strong>Wilder</strong> Research, October 2010
Homeless youth had high rates of previous out-of-homeplacements• 64% of homeless youth had experienced a placement <strong>in</strong> a foster home, group home,detention facility, or treatment center (down from 70% <strong>in</strong> 2006). The proportionswere 61 percent among youth m<strong>in</strong>ors and 65 percent among young adults.• 37% of youth had lived <strong>in</strong> a foster home (34% of youth m<strong>in</strong>ors and 37% of young adults).• Nearly one-fifth (18%) had lived <strong>in</strong> a facility for persons with emotional, behavioral,or mental health problems (20% of youth and 18% of young adults, down from 22%and 24%, respectively, <strong>in</strong> 2006).• 1 <strong>in</strong> 4 had lived <strong>in</strong> a group home (25% overall; 19% of youth m<strong>in</strong>ors and 26% ofyoung adults, down from 33% for each group <strong>in</strong> 2006).• Over 1 <strong>in</strong> 3 (37%) had been held more than a week <strong>in</strong> a corrections facility (36% ofyouth and 37% of young adults). These are similar to rates <strong>in</strong> 2006.• 1 <strong>in</strong> 4 (28%) had run away from a placement (26% of youth and 28% of young adults,down from 32% and 31%, respectively, <strong>in</strong> 2006).• 12% of homeless young adults, ages 18 through 21, had to leave a foster home orother placement because they were too old to stay there.• In the 12 months prior to the study, 17 percent of youth left some type of socialservice placement (compared to 22% <strong>in</strong> 2006). This <strong>in</strong>cludes 5 percent who hadrecently left a foster home or group home (compared to 10% <strong>in</strong> 2006).HISTORY OF PLACEMENTS AMONG HOMELESS YOUTH 17 AND UNDER, 1991-<strong>2009</strong>SELECTED LIFE EXPERIENCES OF HOMELESS YOUTH MINORS 17 AND UNDER, 1991-<strong>2009</strong>1991 1994 1997 2000 2003 2006 <strong>2009</strong>Foster care 38% 36% 38% 41% 53% 40% 34%Group home 22% 33% 29% 27% 29% 33% 19%Drug or alcohol treatment facility 15% 10% 19% 13% 13% 14% 16%Detention center or correctional facility 31% 34% 36% 46% 35% 34% 36%Any <strong>in</strong>stitutionNotavailable61% 70% 67% 71% 70% 62%<strong>Homelessness</strong> <strong>in</strong> M<strong>in</strong>nesota <strong>2009</strong> 51 <strong>Wilder</strong> Research, October 2010
Youth’s perceptions of ma<strong>in</strong> factors that led to their homelessnessThe data show that homeless youth have troubled backgrounds and life experiences<strong>in</strong>clud<strong>in</strong>g high rates of placement, abuse, and mental health issues. To understand moreabout youth perceptions of factors that led to their homelessness, homeless youth ages 21and younger were asked about a list of 18 different items and whether each item waseither not a cause, part of the cause, or a ma<strong>in</strong> cause that led to their homelessness. Ofthe items listed <strong>in</strong> the follow<strong>in</strong>g table, 69 percent of homeless youth report at least one asa ma<strong>in</strong> cause that led to their homelessness. Causes related to family hous<strong>in</strong>g (too smallfor everyone, or loss of family’s hous<strong>in</strong>g) were both higher compared to 2006. A smallerproportion of youth reported leav<strong>in</strong>g because of someone <strong>in</strong> the home they could notstand to be around, and a smaller proportion reported be<strong>in</strong>g homeless due to their owndel<strong>in</strong>quent activities.YOUTH’S VIEWS OF FACTORS THAT LED TO THEIR HOMELESSNESSPart of the cause ora ma<strong>in</strong> cause A ma<strong>in</strong> causeFight<strong>in</strong>g frequently with parents or guardians 60% 30%Told to leave or locked out 56% 29%Someone <strong>in</strong> home they couldn’t stand to be around 54% 27%Not will<strong>in</strong>g to live by parents’ rules 48% 16%Neglect or parents not attend<strong>in</strong>g to basic needs 35% 16%Parents’ use of drugs or alcohol 31% 12%Home was too small for everyone to live there 30% 11%Del<strong>in</strong>quent activities by the youth 30% 8%Family lost their hous<strong>in</strong>g 26% 15%Didn’t feel safe because of violence <strong>in</strong> the house 25% 12%A parent or guardian had mental health problems 22% 8%Physical or sexual abuse by someone <strong>in</strong> the household 21% 10%Youth’s own drug or alcohol use 21% 8%Left foster care or another group placement without apermanent place to live 19% 9%Crim<strong>in</strong>al activities by someone else <strong>in</strong> the household 18% 7%Became pregnant or made someone pregnant 17% 7%Lack of tolerance of the youth’s sexual orientation orgender identity* 8% 3%* Of the 12% of youth who identify as gay, lesbian, bisexual, or transgender, 46% identify lack of tolerance as at least partof the cause, <strong>in</strong>clud<strong>in</strong>g 17% who identify it as a ma<strong>in</strong> cause.<strong>Homelessness</strong> <strong>in</strong> M<strong>in</strong>nesota <strong>2009</strong> 52 <strong>Wilder</strong> Research, October 2010
Sixty-three percent of youth m<strong>in</strong>ors and 46% of young adults believe that they would beallowed to return home, if they wanted to – a smaller proportion of both groups comparedto 2006. Nearly half of youth ages 17 and under (44%), but only 20% of young adultsages 18 to 21, felt that there was a chance they would live with their family aga<strong>in</strong>. This isa smaller proportion of youth m<strong>in</strong>ors, but a slightly higher proportion of young adultscompared to 2006.A grow<strong>in</strong>g proportion of homeless m<strong>in</strong>ors 17 and younger areenrolled <strong>in</strong> school, although many did not attend the day of thesurveyA grow<strong>in</strong>g percentage of homeless m<strong>in</strong>ors 17 and younger are enrolled <strong>in</strong> school, ris<strong>in</strong>gfrom 52 percent <strong>in</strong> 1994, to 73 percent <strong>in</strong> 1997 and 2000, to 84 percent <strong>in</strong> 2003, to 89percent <strong>in</strong> 2006, and to 90 percent <strong>in</strong> <strong>2009</strong>. One-third of homeless m<strong>in</strong>ors report receiv<strong>in</strong>gspecial education services (34%, essentially the same as <strong>in</strong> 2006). This rate is evenhigher among the young adult population – 42 percent of 18 to 21 year olds report thatthey received special educational services while <strong>in</strong> school.Just over half of homeless m<strong>in</strong>ors surveyed attended school the day of the survey (55% ofthose who had not yet graduated or received their GED, down from the 2006 rate). Theserates are lower than the rates for children who are with their homeless parents (84% ofparents surveyed said that all of their children attended school that day).Fifty-five percent of homeless young adults (ages 18-21) had graduated or received theirGED. Graduation or GED completion rates were lowest for 18 year olds (32%); but most(72%) of 18-year-olds who had not yet graduated were enrolled <strong>in</strong> school at the time ofthe survey.Five m<strong>in</strong>ors (ages 17 and under) had graduated or received their GED.GRADUATION OR GED COMPLETION RATES OF HOMELESS YOUTH BY AGE GROUPGraduated Received GED TotalAge 17 and under 3% 1% 4%Age 18 27% 6% 33%Age 19 45% 4% 49%Age 20 57% 11% 68%Age 21 61% 8% 68%Ages 18-21 comb<strong>in</strong>ed 48% 7% 55%<strong>Homelessness</strong> <strong>in</strong> M<strong>in</strong>nesota <strong>2009</strong> 53 <strong>Wilder</strong> Research, October 2010
Homeless youth were more likely to be employed than the homeless adult population <strong>in</strong>general. Twenty-seven percent of youth were employed, compared to 18 percent ofhomeless adults age 22 and over. However, the percentage of youth employed is downslightly from 31 percent <strong>in</strong> 2006; and those employed full-time was down from 10 percent<strong>in</strong> 2006 to 6 percent <strong>in</strong> <strong>2009</strong>.“Most helpful” services for homeless youth and young adultsAmong homeless youth who received services, the follow<strong>in</strong>g services helped them most:• Food Stamps (77% of those who received them)• WIC (58%)• Transportation assistance (58%)• Drop-<strong>in</strong> centers (54%)• Hot meal program (52%)• Outreach services (49%)• Free medical cl<strong>in</strong>ic (43%)• Food shelves (40%)Eight out of 10 homeless youth (84%) report that they have regular contact with a trustedadult.<strong>Homelessness</strong> <strong>in</strong> M<strong>in</strong>nesota <strong>2009</strong> 54 <strong>Wilder</strong> Research, October 2010
Section III: Specific groupsLong-term homelessnessLong-term homelessness has <strong>in</strong>creased <strong>in</strong> overall numbers and as a proportion ofthe overall homeless population. Long-term homeless adults have high rates ofdisabilities and health issues.In M<strong>in</strong>nesota, people are considered to be experienc<strong>in</strong>g long-term homelessness if theyhave been homeless for at least one year, or have experienced four or more episodes ofhomelessness <strong>in</strong> the last three years.Look<strong>in</strong>g first at the length of current homelessness, the <strong>2009</strong> results show that 52 percentof the adult homeless population <strong>in</strong> <strong>2009</strong> (3,024 adults) had been homeless for a year orlonger. Add<strong>in</strong>g the second part of the def<strong>in</strong>ition, the <strong>2009</strong> study f<strong>in</strong>ds that another 8 percent(473 adults) had been homeless less than one year currently, but had been homeless fouror more times <strong>in</strong> the past three years. Added together, 59 percent of homeless adults(3,497 people) fit the M<strong>in</strong>nesota def<strong>in</strong>ition of long-term homeless. This number <strong>in</strong>cludes: 4• 493 young adults age 18 to 21 (54% of this age group for whom this <strong>in</strong>formationis known)• 3,004 adults age 22 or older (59% of this age group)• 2,710 adults age 22 through 54 (59 % of this age group)• 294 adults age 55 or older (61% of this age group)Numbers are less def<strong>in</strong>ite for m<strong>in</strong>or children with their parents and for unaccompaniedyouth, where <strong>in</strong>terviews are not weighted to a known population. The best estimates are:• Of the 133 unaccompanied youth age 17 or younger who were <strong>in</strong>terviewed, 56 (or 42%)were long-term homeless.• Of the m<strong>in</strong>or children with their parents, based on those whose parents were<strong>in</strong>terviewed (<strong>in</strong>clud<strong>in</strong>g parents who were m<strong>in</strong>ors themselves), we estimateapproximately 1,704 were long-term homeless (which is 48% of the 3,535 childrenwhose parents were <strong>in</strong>terviewed).4Note: these numbers are from the weighted survey responses.<strong>Homelessness</strong> <strong>in</strong> M<strong>in</strong>nesota <strong>2009</strong> 55 <strong>Wilder</strong> Research, October 2010
At the end of this section we provide a detailed table show<strong>in</strong>g the distribution of M<strong>in</strong>nesotansexperienc<strong>in</strong>g long-term homelessness by age group, gender, and shelter type, with furthernotes on how the numbers were estimated.Overall, more people (35% <strong>in</strong>crease), and a higher proportion (59% to 54%) of total homeless,were long-term homeless <strong>in</strong> <strong>2009</strong> compared to 2006.LONG-TERM HOMELESSNESS AMONG ADULTS2006N=4,781<strong>2009</strong>N=5,957Number Percent Number PercentAdults homeless one year or longer 2,230 47% 3,024 51%Adults homeless less than a year currently, but 4 ormore times <strong>in</strong> the last 3 years 356 7% 473 8%Long-term homeless adults 2,586 54% 3,497 59%Characteristics of long-term homeless adults <strong>in</strong> <strong>2009</strong>Consider<strong>in</strong>g only adults age 18 or older <strong>in</strong> the <strong>2009</strong> study, three-quarters (73%) of thoseexperienc<strong>in</strong>g long-term homelessness were <strong>in</strong> shelters or transitional hous<strong>in</strong>g programs,and one-quarter (27%) were not us<strong>in</strong>g formal shelter programs. Almost one-half of thosenot us<strong>in</strong>g formal programs had spent much of October sleep<strong>in</strong>g outdoors or <strong>in</strong> vehicles orabandoned build<strong>in</strong>gs, and just over one-half had spent considerable amounts of time <strong>in</strong>unstable temporary hous<strong>in</strong>g. Almost three-quarters of children who were with long-termhomeless parents (1,220 of 1,695) were <strong>in</strong> transitional hous<strong>in</strong>g.TYPE OF SHELTER ON DAY OF SURVEY - LONG-TERM HOMELESS ADULTSLong-termN=3,496All othersN=2,461In emergency or battered women’s shelters 32% 42%In transitional hous<strong>in</strong>g programs 41% 32%Informal shelter 15% 19%Unsheltered 12% 7%One-third (33%) of long-term homeless adults spent at least one night <strong>in</strong> Octobersleep<strong>in</strong>g outdoors or <strong>in</strong> places not meant for human habitation, compared to about onefifth(22%) of other homeless adults. Long-term homeless adults averaged 3.1 nightsoutdoors <strong>in</strong> October, compared to 1.7 nights for other homeless adults.<strong>Homelessness</strong> <strong>in</strong> M<strong>in</strong>nesota <strong>2009</strong> 56 <strong>Wilder</strong> Research, October 2010
Compared to other homeless adults, the long-term homeless are slightly older on averageand more likely to be male. The long-term homeless are less likely to be parents or havechildren with them. American Indians, while a small proportion of this group, areoverrepresented here compared to other homeless adults.A higher proportion of the long-term homeless did not f<strong>in</strong>ish high school, and morereceived special education while <strong>in</strong> school.DEMOGRAPHICS - LONG-TERM HOMELESS ADULTSLong-termN=3,496All othersN=2,461Average age (age 18-83) 38 35Men 58% 46%Have lived <strong>in</strong> M<strong>in</strong>nesota for more than 2 years 81% 71%Has any children age 17 or younger (% of thoseparents who have a child with them) 46% (55%) 56% (65%)Accompanied by any children (% of women) 25% (53%) 36% (57%)American Indian 13% 9%Black (African American or African born) 42% 38%Asian or Pacific Islander 1% 1%Hispanic or Lat<strong>in</strong>o 7% 8%White or Caucasian 37% 43%Did not complete high school 27% 20%Received special education services while <strong>in</strong> school 29% 24%Adults experienc<strong>in</strong>g long-term homelessness are more likely to be unemployed currently,and considerably more likely to have been unemployed for at least one year. Theirmedian monthly <strong>in</strong>come from all sources is substantially less than other homeless adults.General Assistance is the most common source of <strong>in</strong>come for the long-term homeless, andthey are more likely than other homeless adults to receive <strong>in</strong>come from General Assistance.EMPLOYMENT AND INCOME - LONG-TERM HOMELESS ADULTSLong-termN=3,496All othersN=2,461Employed (full-time) 17% (5%) 23% (7%)Unemployed for at least one year 57% 36%Work hours/week (average for those employed) 27 26Wages of less than $8/hour 39% 35%Median monthly <strong>in</strong>come (from all sources) $220 $396Income from General Assistance (ma<strong>in</strong> source) 33% (30%) 23% (19%)<strong>Homelessness</strong> <strong>in</strong> M<strong>in</strong>nesota <strong>2009</strong> 57 <strong>Wilder</strong> Research, October 2010
Long-Term homeless adults report significantly higher <strong>in</strong>cidences of virtually all types ofdisabilities compared to other homeless adults. They are also more likely to report hav<strong>in</strong>gcurrent health care coverage, but are also more likely to report hav<strong>in</strong>g a current need to seea medical professional. Issues with the highest <strong>in</strong>cidence among the long-term homelessare serious mental illness, need<strong>in</strong>g to see a dentist, and chronic health conditions.HEALTH AND WELLNESS – LONG-TERM HOMELESS ADULTSLong-termN=3,496All othersN=2,461Chronic health condition 50% 41%Serious mental illness 60% 47%Substance abuse diagnosis 28% 17%Dual diagnosis (mental illness and substance abuse disorder) 20% 12%Conditions that limit work 47% 33%Cognitive disabilities 38% 25%Symptoms of bra<strong>in</strong> <strong>in</strong>jury 36% 26%Need to see a doctor about: …a physical health problem 40% 33%…a mental health problem 43% 32%…an alcohol or drug problem 12% 7%Need to see a dentist 55% 47%Had medical coverage dur<strong>in</strong>g October 78% 72%The long-term homeless are more likely than other homeless adults to have beenmaltreated as children, and to have lived <strong>in</strong> some type of <strong>in</strong>stitutional sett<strong>in</strong>g. They arealso more likely to have been the victim of violence while be<strong>in</strong>g homeless.Equal proportion of long-term homeless men and other homeless men are military veterans,but more of the long-term homeless veterans have service-related health problems.<strong>Homelessness</strong> <strong>in</strong> M<strong>in</strong>nesota <strong>2009</strong> 58 <strong>Wilder</strong> Research, October 2010
PLACEMENTS AND HISTORY – LONG-TERM HOMELESS ADULTSLong-termN=3,496All othersN=2,461Lived <strong>in</strong> foster home or group home as child 28% 23%Ever <strong>in</strong> a drug or alcohol treatment facility 42% 27%Ever had any social service placement 64% 49%Ever <strong>in</strong>carcerated 53% 39%Military veterans (% of men) 12% (19%) 10% (19%)Percent of vets serv<strong>in</strong>g <strong>in</strong> a combat zone 21% 34%Percent of vets with a service-related health problem 46% 40%Percent of women flee<strong>in</strong>g domestic violence 28% 29%Physically mistreated as a child (% of women) 39% (50%) 33% (40%)Sexually mistreated as a child (% of women) 27% (45%) 24% (36%)Physically or sexually attacked while homeless (% of women) 25% (35%) 14% (17%)Long-term homeless adults use many of the same general and specialized services, but aremore likely to report recent use of hot meal programs, drop-<strong>in</strong> centers, and outreachservices, and more likely to cite these as the most helpful services. Long-term homelessare slightly less likely to have received help to f<strong>in</strong>d a job and help gett<strong>in</strong>g f<strong>in</strong>ancial orother benefits.TOP SERVICES USED DURING OCTOBER – LONG-TERM HOMELESS ADULTSLong-termN=3,496All othersN=2,461Food stamps 61% 65%Cloth<strong>in</strong>g shelves 42% 43%Transportation assistance 42% 43%Hot meal program 37% 28%Food shelves 30% 29%Drop-<strong>in</strong> centers 30% 19%Emergency room 27% 26%Free medical cl<strong>in</strong>ic 21% 19%Help to f<strong>in</strong>d a job 20% 25%Help gett<strong>in</strong>g f<strong>in</strong>ancial or other benefits 18% 24%Outreach services 18% 12%Free mental health cl<strong>in</strong>ic 12% 9%Help with legal issues 12% 14%Note:Table shows top 12 services out of 19 services provided.<strong>Homelessness</strong> <strong>in</strong> M<strong>in</strong>nesota <strong>2009</strong> 59 <strong>Wilder</strong> Research, October 2010
Homeless veterans1 <strong>in</strong> 5 homeless men are military veterans, and one-fourth of homeless veteransserved <strong>in</strong> a combat zone. Veterans have significantly higher rates of Post-Traumatic Stress Disorder (PTSD).The <strong>2009</strong> study identified 669 homeless veterans, <strong>in</strong>clud<strong>in</strong>g 605 men and 64 women.Overall, 1 <strong>in</strong> 10 homeless adults (11%), and 1 <strong>in</strong> 5 homeless men (19%), served <strong>in</strong> themilitary at some time. For comparison, accord<strong>in</strong>g to the 2008 American CommunitySurvey, 19 percent of M<strong>in</strong>nesota men overall have ever served <strong>in</strong> the military – the sameproportion to that found among homeless men. One-third (26%) of homeless veteranshad served <strong>in</strong> a combat zone.Comparisons to 2006 should be made with caution, because one major veterans programthat participated <strong>in</strong> the 2006 study was unable to participate <strong>in</strong> <strong>2009</strong>. Exam<strong>in</strong>ation ofweighted survey results suggest that the overall statewide results for <strong>2009</strong> are reliable andcan support year-to-year comparisons with only a slightly expanded marg<strong>in</strong> of sampl<strong>in</strong>gerror. The number of veterans identified <strong>in</strong> <strong>2009</strong> is 7 percent higher than <strong>in</strong> 2006 (up by45 people). However, the number and proportion of homeless women veterans has<strong>in</strong>creased greatly, more than doubl<strong>in</strong>g from 29 <strong>in</strong> 2006 to 64 <strong>in</strong> <strong>2009</strong>.Who are homeless veterans?Despite the <strong>in</strong>crease <strong>in</strong> women veterans, the overwhelm<strong>in</strong>g majority (90%) of homelessveterans are men. While veterans <strong>in</strong>clude 19 percent of homeless men, only 2 percent ofhomeless women had served <strong>in</strong> the military (1% <strong>in</strong> 2006). Unless otherwise stated, thedescriptions given below apply only to the male veterans.<strong>Homelessness</strong> <strong>in</strong> M<strong>in</strong>nesota <strong>2009</strong> 60 <strong>Wilder</strong> Research, October 2010
HOMELESS MALE VETERANS COMPARED TO OTHER HOMELESS MENMaleveteransN=605Other homelessmenN=2,534Average (mean) age 48 39Age 34 or younger 8% 37%Located <strong>in</strong> Tw<strong>in</strong> Cities metro area 74% 69%At least a HS diploma or GED 95% 72%Some college 51% 22%Racial or ethnic m<strong>in</strong>ority 49% 62%Ever <strong>in</strong>carcerated 62% 64%Ever homeless before 74% 74%Homeless a year or longer now 59% 56%Employed 18% 16%Work<strong>in</strong>g full-time (35+ hr/wk) 6% 5%Average hours worked per week (of those employed) 28 25Homeless veterans reported childhood experiences that were less traumatic, on average,than those of non-veterans who were homeless. Compared to other homeless adults,fewer veterans had ever lived <strong>in</strong> an out-of-home placement or <strong>in</strong>stitution as a child.However, approximately equal proportions reported they had been physically or sexuallyabused as children. First experiences with homelessness generally occurred at a later agefor homeless veterans.HOMELESS MALE VETERANS COMPARED TO OTHER HOMELESS MEN – CHILDHOOD TRAUMA ANDPLACEMENTSMaleveteransN=605Other homelessmenN=2,534Spent a week (or more) <strong>in</strong> a juvenile detention center 14% 27%Foster care (as child) 11% 18%Group home (as child) 7% 13%Drug treatment facility (as child) 4% 7%Physically or sexually abused (as child) 33% 30%First experienced homelessness before age 18 13% 22%First experienced homelessness before age 26 32% 51%<strong>Homelessness</strong> <strong>in</strong> M<strong>in</strong>nesota <strong>2009</strong> 61 <strong>Wilder</strong> Research, October 2010
Physical and mental healthHomeless male veterans are more likely than other homeless men to have consideredsuicide or attempted suicide. They are also more likely to have a mental illness and/orchemical dependency problem, or have a chronic health condition. Homeless veterans(especially combat veterans) are also much more likely to experience Post-TraumaticStress Disorder (PTSD).HOMELESS MALE VETERANS COMPARED TO OTHER HOMELESS MEN – HEALTHMaleveteransN=605Other homelessmenN=2,534Service-related health problem (% of combat vets) 44% (61%) (n.a.)Chronic health condition 58% 45%Post-Traumatic Stress Disorder (PTSD) (% of combat vets) 28% (42%) 15% (n.a.)Major depression 38% 33%Serious mental illness 55% 49%Ever considered suicide 37% 33%Ever attempted suicide 21% 18%Alcohol abuse disorder 28% 23%Drug abuse disorder 17% 16%Dual diagnosis (mental health and substance abuse disorder) 22% 18%Barriers to hous<strong>in</strong>g and employmentHomeless male veterans report hous<strong>in</strong>g barriers similar to those reported by otherhomeless men. Veterans are somewhat more likely to cite credit problems, bad rentalhistory (<strong>in</strong>clud<strong>in</strong>g eviction), and mental illness as current barriers to hous<strong>in</strong>g.Other possible hous<strong>in</strong>g barriers that are evident from the <strong>in</strong>terviews <strong>in</strong>clude lack of a job,previous homelessness, mental illness, current homelessness that has lasted a year orlonger, substance abuse, and a prior history of <strong>in</strong>carceration.Compared to other homeless men, veterans are approximately equally likely to beemployed, and about the same proportion are work<strong>in</strong>g full-time (35 hours or more aweek). The barriers to employment that unemployed veterans most often identify aregenerally similar to those identified by other homeless men (physical health problems,lack of transportation, mental health problems, and lack of hous<strong>in</strong>g), although veteransmore often mention age as a barrier to employment.<strong>Homelessness</strong> <strong>in</strong> M<strong>in</strong>nesota <strong>2009</strong> 62 <strong>Wilder</strong> Research, October 2010
From other <strong>in</strong>formation <strong>in</strong> the <strong>in</strong>terviews we can identify other potential job barriers thatthey did not themselves mention, <strong>in</strong>clud<strong>in</strong>g long-term unemployment of a year or longer.Some of these differences may be attributable to the fact that homeless male veterans aren<strong>in</strong>e years older than other homeless men, on average.HOMELESS MALE VETERANS COMPARED TO OTHER HOMELESS MENMaleveteransN=605Otherhomeless menN=2,534Cites credit problems as a current hous<strong>in</strong>g barrier 30% 21%Cites crim<strong>in</strong>al history as a current hous<strong>in</strong>g barrier 31% 33%Cites bad rental history as a current hous<strong>in</strong>g barrier 9% 4%Cites mental health as a current hous<strong>in</strong>g barrier 5% 6%Cites physical health as job barrier* 34% 22%Cites transportation as job barrier* 20% 26%Cites mental health as job barrier* 18% 15%Cites lack of hous<strong>in</strong>g as job barrier* 10% 12%Cites age as a job barrier* 13% 5%Cites crim<strong>in</strong>al history as job barrier* 14% 17%Mental illness as potential job barrier* 56% 51%Long-term unemployment as potential job barrier* 65% 63%Alcohol or drug problem as potential job barrier* 63% 51%Lack of education as potential job barrier 5% 29%* Indicates numbers shown as percent of the unemployed.<strong>Homelessness</strong> <strong>in</strong> M<strong>in</strong>nesota <strong>2009</strong> 63 <strong>Wilder</strong> Research, October 2010
People not us<strong>in</strong>g the shelter systemIn greater M<strong>in</strong>nesota, fewer homeless adults are receiv<strong>in</strong>g shelter services.Adults not us<strong>in</strong>g formal shelter on the date of the studyIn the <strong>2009</strong> study, 1,584 homeless adults were <strong>in</strong>terviewed who were not stay<strong>in</strong>g <strong>in</strong> anyformal shelter or hous<strong>in</strong>g program (446 more than <strong>in</strong> 2006). All of them fit the federaldef<strong>in</strong>ition of homelessness on the night of the study. Based on answers to several differentquestions <strong>in</strong> the <strong>in</strong>terview, we were able to determ<strong>in</strong>e that 967 had stayed for a considerablenumber of nights <strong>in</strong> October <strong>in</strong> temporary, <strong>in</strong>formal shelter, and that the other 617 hadstayed for a considerable number of nights <strong>in</strong> unsheltered situations. These numbersare both <strong>in</strong>creases from 2006, but the <strong>in</strong>crease among those stay<strong>in</strong>g more <strong>in</strong> <strong>in</strong>formalarrangements was steeper (400 more than <strong>in</strong> 2006, compared to 46 more for the groupstay<strong>in</strong>g more <strong>in</strong> unsheltered places).People <strong>in</strong> either of these circumstances are less often <strong>in</strong>cluded <strong>in</strong> surveys of the homeless,because with less connection to services they are harder to locate. With considerableplann<strong>in</strong>g and outreach efforts from partners across the state, and build<strong>in</strong>g on successfuloutreach efforts <strong>in</strong> 2006, this year the statewide survey was aga<strong>in</strong> able to <strong>in</strong>clude more ofthese “hidden homeless” <strong>in</strong> the study. It is hard to say how much of the <strong>in</strong>crease is due tomore effective outreach efforts and how much to an <strong>in</strong>crease <strong>in</strong> the actual number ofhomeless persons outside of the formal shelter system. The evidence suggests that bothof these considerations contributed to the <strong>in</strong>crease <strong>in</strong> <strong>2009</strong>.Of those not receiv<strong>in</strong>g shelter services, over half (864) were <strong>in</strong>terviewed <strong>in</strong> greaterM<strong>in</strong>nesota, where they were nearly half (45%) of all homeless people identified. Bycontrast, <strong>in</strong> the seven-county metropolitan area where shelter services are more available,the 720 non-shelter-us<strong>in</strong>g adults who were <strong>in</strong>terviewed were just over 1 <strong>in</strong> 6 (18%) ofhomeless people identified (the same proportion as <strong>in</strong> 2006).People who had spent more time <strong>in</strong> <strong>in</strong>formal shelter arrangementsIn the <strong>2009</strong> study, of the homeless people who were not us<strong>in</strong>g shelter facilities, about 3 <strong>in</strong>5 (967, or 16% of all those identified as homeless <strong>in</strong> the study) had spent considerabletime <strong>in</strong> October stay<strong>in</strong>g <strong>in</strong> “<strong>in</strong>formal shelter” arrangements – <strong>in</strong> hous<strong>in</strong>g lack<strong>in</strong>g heat,light, or runn<strong>in</strong>g water; <strong>in</strong> their own homes but about to be evicted and with nowhere togo; or stay<strong>in</strong>g for short periods of time with family or friends but unable to rema<strong>in</strong> andwith nowhere else to go. People <strong>in</strong> this group were disproportionately from greater<strong>Homelessness</strong> <strong>in</strong> M<strong>in</strong>nesota <strong>2009</strong> 64 <strong>Wilder</strong> Research, October 2010
M<strong>in</strong>nesota and smaller towns. Compared to other homeless adults, more were currentlymarried or liv<strong>in</strong>g with a partner. They were younger on average.People who had spent considerable time <strong>in</strong> <strong>in</strong>formal shelter arrangements had higher ratesof <strong>in</strong>carceration and use of illegal drugs. Compared to other homeless adults, fewerhomeless adults <strong>in</strong> this group had ever completed high school, and more had receivedspecial education services while <strong>in</strong> school. More had spent time dur<strong>in</strong>g childhood <strong>in</strong> fostercare, and more had left a correctional facility <strong>in</strong> the previous 12 months. More had beenhomeless for only a short time currently, but more of them had been homeless repeatedly.They were as likely as other homeless adults to be employed, but more of them earnedunder $8 an hour, and slightly more had been laid off with<strong>in</strong> the past six months.FREQUENT INFORMAL SHELTER USERS COMPARED TO OTHER HOMELESS ADULTSInformalshelter usersN=967All othersN=4,990Interviewed <strong>in</strong> the metro area 34% 74%Last hous<strong>in</strong>g <strong>in</strong> a town with population less than 25,000 30% 18%Currently married or liv<strong>in</strong>g with a partner 17% 11%Average age 34 37At least high school education 71% 76%Received special education services while <strong>in</strong> school 33% 26%Ever <strong>in</strong> foster care 27% 21%Ever <strong>in</strong>carcerated (local, state, federal, or juvenile) 53% 46%Released from a correctional facility <strong>in</strong> the past year 17% 11%Homeless less than 4 months currently 35% 23%Homeless 3 or more times <strong>in</strong> the past 3 years 47% 38%Employed 20% 20%Of employed adults, earn less than $8/hour 44% 36%Of unemployed, laid off <strong>in</strong> past 6 months 22% 19%Serious mental illness 52% 55%Chronic health condition 40% 48%Symptoms of bra<strong>in</strong> <strong>in</strong>jury 32% 32%Health condition that limits work 36% 42%Cognitive disabilities 32% 33%Medical coverage <strong>in</strong> October 68% 77%Any barriers to medical care 32% 27%<strong>Homelessness</strong> <strong>in</strong> M<strong>in</strong>nesota <strong>2009</strong> 65 <strong>Wilder</strong> Research, October 2010
Some of the specific proportions are different than <strong>in</strong> 2006, but the comparativedifferences between <strong>in</strong>formal shelter users and other homeless adults rema<strong>in</strong>ed the same.The only exception is chronic health conditions, which decreased among <strong>in</strong>formal shelterusers but <strong>in</strong>creased among other homeless adults.Homeless adults who had spent considerable time <strong>in</strong> <strong>in</strong>formal arrangements had about thesame or slightly lower levels of most disabilities compared to other homeless adults.However, they reported lower rates of medical coverage and more barriers to the receiptof health care. They were much more likely to report hav<strong>in</strong>g used any illegal drug with<strong>in</strong>the past 30 days, most commonly marijuana. They were also more likely than otherhomeless adults to have used tobacco products and alcohol <strong>in</strong> the previous 30 days.Fewer had any children under 17. Among those with any children, more reported thattheir children were not with them. They were much more likely to report that any of theirchildren had learn<strong>in</strong>g or school problems or trouble attend<strong>in</strong>g school because of theirhous<strong>in</strong>g situation, and the proportion so report<strong>in</strong>g <strong>in</strong> <strong>2009</strong> (36%) is also much higher thanthe proportion of <strong>in</strong>formal shelter users <strong>in</strong> 2006 (11%).FREQUENT INFORMAL SHELTER USERS COMPARED TO OTHER HOMELESS ADULTS (CONTINUED)Informalshelter usersN=967All othersN=4,990Used tobacco, last month 76% 69%Used alcohol, last month 43% 30%Used marijuana, last month 24% 13%Any illegal drug, last month 25% 15%Has any children 17 or younger 44% 51%Has any children with them 21% 32%Open child protection case (% of parents) 10% 9%Any child with learn<strong>in</strong>g or school problems (% of parents) 42% 38%Any child has trouble attend<strong>in</strong>g school because of hous<strong>in</strong>gsituation (% of parents) 36% 8%<strong>Homelessness</strong> <strong>in</strong> M<strong>in</strong>nesota <strong>2009</strong> 66 <strong>Wilder</strong> Research, October 2010
People spend<strong>in</strong>g more time <strong>in</strong> unsheltered locationsOn the date of the study, 617 adults who were <strong>in</strong>terviewed <strong>in</strong> non-shelter locations<strong>in</strong>dicated that they had spent considerable time dur<strong>in</strong>g October stay<strong>in</strong>g <strong>in</strong> unshelteredlocations. More than three-quarters (78%) were men. Their average age of 41 washigher than the overall adult average age of 37. They were least likely of all the groupsto report that they had any children, and among those with children, most likely to reportthat their children were not with them.UNSHELTERED ADULTS COMPARED TO OTHER HOMELESS ADULTS: DEMOGRAPHICSUnshelteredN=617All othersN=5,340Men 78% 50%Average (mean) age 41 36Has any m<strong>in</strong>or children 31% 52%Any children are with them (% of parents) 13% 62%People who frequently stayed <strong>in</strong> unsheltered locations were more likely than otherhomeless adults to have experienced a number of k<strong>in</strong>ds of <strong>in</strong>stitutionalization, <strong>in</strong>clud<strong>in</strong>gfoster care, group homes, <strong>in</strong>patient drug treatment, halfway houses, and correctionalfacilities. They had experienced longer, and more frequent, experiences of homelessness.Compared to 2006, fewer of the unsheltered reported prior experience <strong>in</strong> halfway housesor <strong>in</strong>patient drug or alcohol treatment facilities. It is possible that this might reflect improveddischarge plann<strong>in</strong>g by these k<strong>in</strong>ds of facilities, but further exam<strong>in</strong>ation will be needed todeterm<strong>in</strong>e whether this is the cause of the change.UNSHELTERED ADULTS COMPARED TO OTHER HOMELESS ADULTS: EXPERIENCE IN FACILITIES ANDHOMELESSNESSUnshelteredN=617All othersN=5,340Ever lived <strong>in</strong> a foster home 24% 21%Ever lived <strong>in</strong> a group home 20% 19%Ever <strong>in</strong>patient drug or alcohol treatment 41% 35%Ever <strong>in</strong> halfway house 25% 23%Ever <strong>in</strong>carcerated 63% 45%Homeless 5 years or longer 19% 11%Homeless 8+ times <strong>in</strong> life 38% 21%First homeless at age 17 or younger 26% 26%<strong>Homelessness</strong> <strong>in</strong> M<strong>in</strong>nesota <strong>2009</strong> 67 <strong>Wilder</strong> Research, October 2010
People who frequently stayed <strong>in</strong> unsheltered locations were more likely than otherhomeless adults to suffer from many of the k<strong>in</strong>ds of disabilities covered <strong>in</strong> the survey,<strong>in</strong>clud<strong>in</strong>g conditions limit<strong>in</strong>g work, cognitive disabilities, and bra<strong>in</strong> <strong>in</strong>jury. However,while disability rates for serious mental illness rose among homeless adults overall <strong>in</strong><strong>2009</strong>, they decl<strong>in</strong>ed slightly among those who had stayed <strong>in</strong> unsheltered locations.Further exam<strong>in</strong>ation will be needed to determ<strong>in</strong>e if this might reflect <strong>in</strong>terventions to helplong-term unsheltered homeless <strong>in</strong>dividuals to access supportive hous<strong>in</strong>g.Unsheltered adults are also more likely than others to report alcohol use and abuse, althoughtheir rates of drug abuse disorders is not different from that of homeless adults overall.UNSHELTERED ADULTS COMPARED TO OTHER HOMELESS ADULTS: DISABILITIESUnshelteredN=617All othersN=5,340Health condition limits work 48% 40%Health condition limits activities of daily liv<strong>in</strong>g 15% 13%Cognitive disabilities 40% 32%Symptoms of bra<strong>in</strong> <strong>in</strong>jury 40% 31%Serious mental illness 53% 55%Diagnosed alcohol abuse disorder 28% 18%Diagnosed drug abuse disorder 15% 14%Used alcohol, last 30 days 59% 29%Considers self alcoholic or chemically dependent 39% 28%Drug and alcohol use and treatmentAlcohol use and abuse are higher among the unsheltered homeless. Compared to shelteredhomeless adults, they are more likely ever to have had treatment, but less likely to havehad recent treatment.Higher rates of alcohol use, and a history of alcohol treatment, is a common threadamong both of the groups not us<strong>in</strong>g the shelter system. The table below compares drugor alcohol treatment history of the unsheltered homeless with those of the <strong>in</strong>formallysheltered homeless as well as with homeless adults us<strong>in</strong>g shelter services.• 59% of the unsheltered homeless had consumed alcohol <strong>in</strong> the last 30 days (comparedto 43% of those who had stayed more <strong>in</strong> <strong>in</strong>formal shelter and 26% of those <strong>in</strong> shelteredsituations). Notably, while the percentages decreased from 2006 to <strong>2009</strong> for theunsheltered and the sheltered homeless, they <strong>in</strong>creased for those us<strong>in</strong>g <strong>in</strong>formal shelter.<strong>Homelessness</strong> <strong>in</strong> M<strong>in</strong>nesota <strong>2009</strong> 68 <strong>Wilder</strong> Research, October 2010
• 39% of the unsheltered homeless consider themselves alcoholic or chemicallydependent (compared to 34% of those who had stayed more <strong>in</strong> <strong>in</strong>formal shelter and27% of those <strong>in</strong> shelter situations). Aga<strong>in</strong>, these percentages decreased <strong>in</strong> <strong>2009</strong> forthe unsheltered and the sheltered homeless, but they stayed essentially the sameamong those <strong>in</strong> <strong>in</strong>formal shelter.DRUG OR ALCOHOL TREATMENTUnsheltered Informal ShelteredEver had outpatient treatment 41% 40% 32%Of those, percent <strong>in</strong> last two years 35% 51% 49%Ever had <strong>in</strong>patient treatment 41% 40% 34%Of those, percent <strong>in</strong> last two years 40% 55% 55%Consider themselves alcoholic or chemicallydependent 39% 34% 27%Unsheltered women and their childrenUnsheltered women are more likely to have children who are not with them, even thoughthey are less likely to have children at all.• 42% of unsheltered women had any children age 17 or younger (compared to 55% ofthose who more often used <strong>in</strong>formal shelter and 72% of those <strong>in</strong> sheltered situations)These rates are essentially the same as <strong>in</strong> the 2006 study.• 69% of unsheltered women with children had at least one child that was not withthem (compared with 43% of those who more often used <strong>in</strong>formal shelter and 31% ofthose <strong>in</strong> sheltered situations). For both of the outreach groups, these proportions aresmaller than <strong>in</strong> 2006, although the rates among those <strong>in</strong> shelter are the same.• Overall, 27% of unsheltered women had at least one child that was not with them(compared with 23% of those who more often used <strong>in</strong>formal shelter 22% of those <strong>in</strong>sheltered situations).<strong>Homelessness</strong> <strong>in</strong> M<strong>in</strong>nesota <strong>2009</strong> 69 <strong>Wilder</strong> Research, October 2010
Older adultsS<strong>in</strong>ce 1997, the study has found a grow<strong>in</strong>g number of homeless adults age 55 orolder.Based on the sample of sheltered and unsheltered people <strong>in</strong>terviewed, approximately 482homeless adults <strong>in</strong> <strong>2009</strong> were age 55 or older. This is a 29 percent <strong>in</strong>crease from the 378older adults identified <strong>in</strong> the 2006 study and the fourth consecutive study period that hasreflected an <strong>in</strong>crease <strong>in</strong> the number of older persons experienc<strong>in</strong>g homelessness.However, this number <strong>in</strong> <strong>2009</strong> reflects the larger number of homeless persons <strong>in</strong> thestudy, and the overall proportion of homeless older adults held steady at 8 percent.STEADY GROWTH IN NUMBERS OF HOMELESS OLDER ADULTS (AGE 55 OR OLDER)Number of homeless older adults60050040030020010008% 8%7%4825%4%3443781971051997 2000 2003 2006 <strong>2009</strong>9%8%7%6%5%4%3%2%1%0%Older adults as percentage of allhomeless adultsNumber of older adults% of all adultsThe majority of older homeless adults are men. Most are white or African American. Themen <strong>in</strong> this over-55-age cohort have are more than twice as likely to have served <strong>in</strong> the military.The older homeless adults are considerably more likely to be receiv<strong>in</strong>g <strong>in</strong>come from GeneralAssistance, Social Security old age benefits or Social Security disability <strong>in</strong>surance, orSupplemental Security Income (SSI), although the proportion receiv<strong>in</strong>g any of these SocialSecurity program benefits is lower than <strong>in</strong> 2006. Unlike <strong>in</strong> the 2006 study, their median<strong>in</strong>comes are lower than those of younger homeless adults. This group is also less likely tobe work<strong>in</strong>g compared to younger homeless adults.<strong>Homelessness</strong> <strong>in</strong> M<strong>in</strong>nesota <strong>2009</strong> 70 <strong>Wilder</strong> Research, October 2010
OLDER HOMELESS ADULTS COMPARED TO OTHER HOMELESS ADULTS: DEMOGRAPHICS AND INCOMEAdults 55+N=482Adults 54and underN=5,475Men 79% 51%White or Caucasian 53% 38%African American 32% 40%Veterans (% of men) 29% (36%) 10% (17%)Any <strong>in</strong>come from General Assistance <strong>in</strong> October <strong>2009</strong> 44% 27%Any <strong>in</strong>come from Social Security old age benefits <strong>in</strong> October 13% 2%Any <strong>in</strong>come from Social Security Disability Insurance <strong>in</strong> Oct. 16% 7%Any <strong>in</strong>come from Supplemental Security Income (SSI) <strong>in</strong> Oct. 12% 9%Median <strong>in</strong>come <strong>in</strong> October $203 $300Employed 15% 20%Older homeless adults are more likely than other homeless adults to use drop-<strong>in</strong> centersand hot meal programs and slightly more likely to report chronic alcoholism. They arealso more likely to report chronic health conditions that limit daily activities.More than half of this group has been homeless for a year or longer, although the proportionis lower than <strong>in</strong> 2006 (55% compared to 60%). Compared to younger homeless adults,more were stay<strong>in</strong>g <strong>in</strong> emergency shelters and fewer <strong>in</strong> transitional hous<strong>in</strong>g.OLDER HOMELESS ADULTS COMPARED TO OTHER HOMELESS ADULTS: SERVICE USE AND NEEDSAdults 55+N=482Adults 54and underN=5,475Used drop-<strong>in</strong> centers <strong>in</strong> October 34% 25%Used hot meal program <strong>in</strong> October 46% 32%Diagnosed alcohol abuse disorder 23% 19%Consider self alcoholic or chemically dependent 35% 29%Health condition limits activities of daily liv<strong>in</strong>g 20% 13%Homeless 1 year or longer 55% 51%In emergency shelter 47% 30%In transitional hous<strong>in</strong>g 26% 38%<strong>Homelessness</strong> <strong>in</strong> M<strong>in</strong>nesota <strong>2009</strong> 71 <strong>Wilder</strong> Research, October 2010
Homeless ex-offendersThe proportions of homeless ex-offenders have leveled off after a decade of<strong>in</strong>creases. However, the actual number of homeless adults ever <strong>in</strong>carceratedcont<strong>in</strong>ues to <strong>in</strong>crease, up 24 percent from 2006.Numbers of homeless ex-offendersThe <strong>2009</strong> study identified 2,800 homeless adult ex-offenders who had previously spenttime <strong>in</strong> a prison, county jail, or juvenile detention facility (up from 2,264 <strong>in</strong> 2006). This<strong>in</strong>cluded 63 percent of men and 28 percent of women. Although there cont<strong>in</strong>ues to be anoverall <strong>in</strong>crease <strong>in</strong> the number of homeless ex-offenders, the proportion of homeless exoffendershas leveled off for the first time s<strong>in</strong>ce the late n<strong>in</strong>eties. The percent of exoffenders<strong>in</strong> M<strong>in</strong>nesota’s homeless population has <strong>in</strong>creased s<strong>in</strong>ce the first statewidehomeless study <strong>in</strong> 1991, with all of the growth occurr<strong>in</strong>g between 1997 and 2006.RECENT RISE IN PROPORTION OF EX-OFFENDERS IN THE ADULT HOMELESS POPULATION36%42%47% 47%Adults ever <strong>in</strong>corrections facilities28% 27% 27%11% 10% 10% 10%13%17% 17%Adults released<strong>in</strong> last two years1991 1994 1997 2000 2003 2006 <strong>2009</strong>Who are homeless ex-offenders?In <strong>2009</strong>, 47 percent of all homeless adults, <strong>in</strong>clud<strong>in</strong>g 63 percent of men and 28 percent ofwomen, have been <strong>in</strong>carcerated at some time <strong>in</strong> their life. Seventy-one percent of allhomeless ex-offenders are male, about the same as <strong>in</strong> 2006. The average age for an exoffenderis 39 years old compared to 35 for homeless adults who have never been <strong>in</strong>corrections facilities. The racial and ethnic distribution of ex-offenders is very similar tothe overall homeless population.<strong>Homelessness</strong> <strong>in</strong> M<strong>in</strong>nesota <strong>2009</strong> 72 <strong>Wilder</strong> Research, October 2010
Compared to homeless non-offenders, ex-offenders were more likely to have been <strong>in</strong>foster care at some time, more likely to have served <strong>in</strong> the military, and more likely tohave received special education services while <strong>in</strong> school. Furthermore, homeless exoffenderson average spent about twice as many nights <strong>in</strong> October outside or <strong>in</strong> places not<strong>in</strong>tended for habitation (unsheltered).The population of ex-offenders varies among different types of shelter arrangements and<strong>in</strong>cludes:• 63% of homeless adults liv<strong>in</strong>g <strong>in</strong> unsheltered locations• 53% of adults us<strong>in</strong>g <strong>in</strong>formal shelter• 52% of adults <strong>in</strong> emergency shelters• 38% of adults <strong>in</strong> transitional hous<strong>in</strong>g• 27% of adults <strong>in</strong> battered women’s sheltersHomeless ex-offenders were less likely to be employed and averaged less <strong>in</strong>come <strong>in</strong> themonth of October than homeless non-offenders. Ex-offenders were about half as likely asnon-offenders to have a child or children with them. Ex-offenders were also more likely tohave lived <strong>in</strong> M<strong>in</strong>nesota for more than two years.HOMELESS EX-OFFENDERS COMPARED TO NEVER-INCARCERATED HOMELESS ADULTSEx-offendersN=2,800Never<strong>in</strong>carceratedN=3,157Men 71% 36%White or Caucasian 40% 39%African American 38% 40%Employed 15% 23%Special education services while <strong>in</strong> school 31% 24%Military veteran 14% 9%New to M<strong>in</strong>nesota <strong>in</strong> the last 2 years 21% 25%Has lived <strong>in</strong> a foster home 28% 16%Average monthly <strong>in</strong>come <strong>in</strong> October (median) $380 ($203) $497 ($415)Average nights unsheltered <strong>in</strong> October 3.3 1.7Have a child or children are with them (of parents) 17% (38%) 41% (75%)<strong>Homelessness</strong> <strong>in</strong> M<strong>in</strong>nesota <strong>2009</strong> 73 <strong>Wilder</strong> Research, October 2010
Barriers among homeless ex-offendersHomeless ex-offenders were more than twice as likely as non-offenders to have alcoholor chemical dependency disorders and almost three times as likely to have lived <strong>in</strong> a drugor alcohol treatment facility at some time. Ex-offenders were also more than twice aslikely to have taken illegal drugs <strong>in</strong> the previous 30 days. However, chemically dependentex-offenders were slightly less likely to have received <strong>in</strong>-patient or out-patient substanceabuse treatment <strong>in</strong> the previous two years.Homeless ex-offenders were more likely than non-offenders to have significant mentalillness and more likely to have ever received <strong>in</strong>-patient mental health care. However, exoffenderswith mental health disorders were somewhat less likely than non-offenderswith mental illness to have received <strong>in</strong>-patient or out-patient treatment <strong>in</strong> the last twoyears for their condition.Ex-offenders also have significantly higher rates of cognitive disabilities and symptomsof likely traumatic bra<strong>in</strong> <strong>in</strong>jury.HOMELESS EX-OFFENDERS COMPARED TO NEVER-INCARCERATED HOMELESS ADULTSEx-offendersN=2,800Never<strong>in</strong>carceratedN=3,157Possible traumatic bra<strong>in</strong> <strong>in</strong>jury 40% 24%Cognitive disabilities 39% 27%Serious or persistent mental illness 60% 49%Ever received <strong>in</strong>-patient mental health care 26% 15%In- or out-patient mental health treatment <strong>in</strong> last two years (ofthose with mental illness) 72% 78%Diagnosed alcohol or chemical abuse disorder 36% 12%Ever lived <strong>in</strong> drug or alcohol treatment facility 54% 19%Took illegal drugs <strong>in</strong> the last 30 days 25% 10%In- or out-patient drug or alcohol treatment <strong>in</strong> last two years (ofthose with diagnosed substance abuse disorder) 67% 71%<strong>Homelessness</strong> <strong>in</strong> M<strong>in</strong>nesota <strong>2009</strong> 74 <strong>Wilder</strong> Research, October 2010
Recently released ex-offendersTwelve percent of homeless adults (26% of all ex-offenders) had been released fromcorrections facilities <strong>in</strong> the last year. Of those, most (77%) were released from countyjails. Slightly more than 1 <strong>in</strong> 5 (22%) were released from state or federal prison, and 2percent were released from juvenile facilities. While the overall proportion was the sameas <strong>in</strong> 2006, a higher proportion <strong>in</strong> <strong>2009</strong> had been released from jails, and a smallerproportion from juvenile facilities.Almost two-thirds of recently released adults had been homeless when they entered thecorrectional facility. One-third had a stable place to live when they came out, and onequarterhad received help to f<strong>in</strong>d hous<strong>in</strong>g. These proportions were very differentdepend<strong>in</strong>g on whether the person had left a juvenile detention center, county jail orworkhouse, or a state or federal prison.PROFILE OF RECENTLY RELEASED HOMELESS EX-OFFENDERSOverallN=657PrisonN=143JailN=500JuvenileN=14Homeless when enter<strong>in</strong>g facility 64% 58% 66% 34%Stable place to live at release 33% 37% 31% 73%Received help f<strong>in</strong>d<strong>in</strong>g stable hous<strong>in</strong>g at release 26% 36% 22% 33%Under supervision of a probation or parole officer atrelease 59% 65% 58% 68%<strong>Homelessness</strong> <strong>in</strong> M<strong>in</strong>nesota <strong>2009</strong> 75 <strong>Wilder</strong> Research, October 2010
NUMBER OF PEOPLE COUNTED IN MINNESOTA’S HOMELESS SHELTERS, TRANSITIONAL HOUSING PROGRAMS,AND IN NON-SHELTER LOCATIONS ON OCTOBER 22, <strong>2009</strong>Source:Note:<strong>Wilder</strong> Research; data from shelter providers and homeless persons <strong>in</strong>terviewed <strong>in</strong> non-shelter locations.“Youth age < 17” refers to those who are on their own (not with their families).For more detail on numbers of homeless persons by age group and family status, region,and type of shelter, see the report “Statewide and region counts of homeless people”posted on the <strong>Wilder</strong> Research web site (http://www.wilderresearch.org/).<strong>Homelessness</strong> <strong>in</strong> M<strong>in</strong>nesota <strong>2009</strong> 76 <strong>Wilder</strong> Research, October 2010
NUMBER OF PEOPLE IN METRO AREA HOMELESS SHELTERS, TRANSITIONAL HOUSING PROGRAMS, AND INNON-SHELTER LOCATIONS ON OCTOBER 22, <strong>2009</strong>107 adults age 22+38 young adults age 18-217 youth age < 17134 children with parents286 total2,252 adults age 22+371 young adults age 18-2156 youth age