2008-2009 Annual Report - Chandler Police Department
2008-2009 Annual Report - Chandler Police Department
2008-2009 Annual Report - Chandler Police Department
- No tags were found...

You also want an ePaper? Increase the reach of your titles
YUMPU automatically turns print PDFs into web optimized ePapers that Google loves.
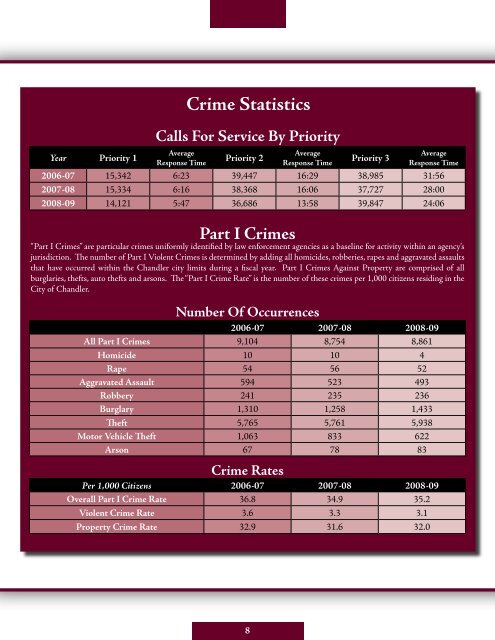
Year Priority 1Crime StatisticsCalls For Service By PriorityAverageResponse TimePriority 2Part I CrimesAverageResponse TimePriority 3AverageResponse Time2006-07 15,342 6:23 39,447 16:29 38,985 31:562007-08 15,334 6:16 38,368 16:06 37,727 28:00<strong>2008</strong>-09 14,121 5:47 36,686 13:58 39,847 24:06“Part I Crimes” are particular crimes uniformly identified by law enforcement agencies as a baseline for activity within an agency’sjurisdiction. The number of Part I Violent Crimes is determined by adding all homicides, robberies, rapes and aggravated assaultsthat have occurred within the <strong>Chandler</strong> city limits during a fiscal year. Part I Crimes Against Property are comprised of allburglaries, thefts, auto thefts and arsons. The “Part I Crime Rate” is the number of these crimes per 1,000 citizens residing in theCity of <strong>Chandler</strong>.Number Of Occurrences2006-07 2007-08 <strong>2008</strong>-09All Part I Crimes 9,104 8,754 8,861Homicide 10 10 4Rape 54 56 52Aggravated Assault 594 523 493Robbery 241 235 236Burglary 1,310 1,258 1,433Theft 5,765 5,761 5,938Motor Vehicle Theft 1,063 833 622Arson 67 78 83Crime RatesPer 1,000 Citizens 2006-07 2007-08 <strong>2008</strong>-09Overall Part I Crime Rate 36.8 34.9 35.2Violent Crime Rate 3.6 3.3 3.1Property Crime Rate 32.9 31.6 32.0