- Page 2 and 3:
The Art of Doing Science and Engine
- Page 4 and 5:
This edition published in the Taylo
- Page 6 and 7:
23 Mathematics 16324 Quantum Mechan
- Page 8 and 9:
The year 2020 seems a convenient da
- Page 10 and 11:
1OrientationThe purpose of this cou
- Page 12 and 13:
ORIENTATION 3Telephone Laboratories
- Page 14 and 15:
they arise so you will not be left
- Page 16 and 17:
ORIENTATION 7One of the main tasks
- Page 18 and 19:
2Foundations of the Digital (Discre
- Page 20 and 21:
FOUNDATIONS OF THE DIGITAL (DISCRET
- Page 22 and 23:
FOUNDATIONS OF THE DIGITAL (DISCRET
- Page 24 and 25:
FOUNDATIONS OF THE DIGITAL (DISCRET
- Page 26 and 27:
3History of Computers— HarwareThe
- Page 28 and 29:
HISTORY OF COMPUTERS—HARDWARE 19b
- Page 30 and 31:
HISTORY OF COMPUTERS—HARDWARE 21T
- Page 32 and 33:
HISTORY OF COMPUTERS—HARDWARE 23B
- Page 34 and 35:
HISTORY OF COMPUTERS—SOFTWARE 25(
- Page 36 and 37:
HISTORY OF COMPUTERS—SOFTWARE 27A
- Page 38 and 39:
HISTORY OF COMPUTERS—SOFTWARE 29F
- Page 40 and 41:
HISTORY OF COMPUTERS—SOFTWARE 31b
- Page 42 and 43:
5History of Computer ApplicationAs
- Page 44 and 45:
HISTORY OF COMPUTER APPLICATIONS 35
- Page 46 and 47:
HISTORY OF COMPUTER APPLICATIONS 37
- Page 48 and 49:
HISTORY OF COMPUTER APPLICATIONS 39
- Page 50 and 51:
asic understanding of when the meth
- Page 52 and 53:
ARTIFICIAL INTELLIGENCE—I 43chang
- Page 54 and 55:
ARTIFICIAL INTELLIGENCE—I 45Early
- Page 56 and 57:
7Artificial Intelligence—IIIn thi
- Page 58 and 59:
ARTIFICIAL INTELLIGENCE—II 49mome
- Page 60 and 61:
ARTIFICIAL INTELLIGENCE—II 51have
- Page 62 and 63:
ARTIFICIAL INTELLIGENCE—II 53can
- Page 64 and 65:
8Artificial Intelligenc—IIII sugg
- Page 66 and 67:
9n-Dimensional spaceWhen I became a
- Page 68 and 69:
N-DIMENSIONAL SPACE 59Figure 9. IIl
- Page 70 and 71:
N-DIMENSIONAL SPACE 61and hence the
- Page 72 and 73:
N-DIMENSIONAL SPACE 63where X and Y
- Page 74 and 75:
N-DIMENSIONAL SPACE 653. D(x,y)=D(y
- Page 76 and 77:
10Coding Theory—IHaving looked at
- Page 78 and 79:
CODING THEORY—I 69is uniquely dec
- Page 80 and 81:
CODING THEORY—I 71Figure 10.IVFig
- Page 82 and 83:
CODING THEORY—I 73I feel it neces
- Page 84 and 85:
CODING THEORY—II 75Figure 11.IFig
- Page 86 and 87:
CODING THEORY—II 77Figure 11.VThi
- Page 88 and 89:
CODING THEORY—II 79in this scheme
- Page 90 and 91:
12Error Correcting CodesThere are t
- Page 92 and 93:
ERROR CORRECTING CODES 83Figure 12.
- Page 94 and 95:
ERROR CORRECTING CODES 85old syndro
- Page 96 and 97:
ERROR CORRECTING CODES 87mention it
- Page 98 and 99:
13Information TheoryInformation The
- Page 100 and 101:
INFORMATION THEORY 91Figure 13.IThi
- Page 102 and 103:
INFORMATION THEORY 93Figure 13.IIIc
- Page 104 and 105:
INFORMATION THEORY 95Let us critiqu
- Page 106 and 107:
14Digital Filters—INow that we ha
- Page 108 and 109:
DIGITAL FILTERS—I 99for any other
- Page 110 and 111:
DIGITAL FILTERS—I 101Figure 14.IT
- Page 112 and 113:
DIGITAL FILTERS—I 103Figure 14.II
- Page 114 and 115:
DIGITAL FILTERS—I 105Figure 14.IV
- Page 116 and 117:
15Digital Filters— IIWhen digital
- Page 118 and 119:
DIGITAL FILTERS—II 109Let us run
- Page 120 and 121:
DIGITAL FILTERS—II 111Figure 15.I
- Page 122 and 123:
DIGITAL FILTERS—II 113At x=0 this
- Page 124 and 125:
16Digital Filters—IIIWe are now r
- Page 126 and 127:
DIGITAL FILTERS—III 117Figure 16.
- Page 128 and 129:
DIGITAL FILTERS—III 119We next tu
- Page 130 and 131:
DIGITAL FILTERS—III 121Figure 16.
- Page 132 and 133:
17Digital Filters—IVWe now turn t
- Page 134 and 135:
DIGITAL FILTERS—IV 125These recur
- Page 136 and 137:
DIGITAL FILTERS—IV 127Figure 17.I
- Page 138 and 139:
SIMULATION—I 129Figure 18.IThe fi
- Page 140 and 141:
SIMULATION—I 131(though they had
- Page 142 and 143:
SIMULATION—I 133Figure 18.IIIinte
- Page 144 and 145:
19Simulation—IIWe now take up the
- Page 146 and 147:
SIMULATION—II 137The major part o
- Page 148 and 149: SIMULATION—II 139energy or angula
- Page 150 and 151: 20Simulation—IIII will continue t
- Page 152 and 153: SIMULATION—III 143Figure 20.IVFig
- Page 154 and 155: SIMULATION—III 145Figure 20.VIdow
- Page 156 and 157: SIMULATION—III 147Figure 20.VIIIW
- Page 158 and 159: SIMULATION—III 149Now to the next
- Page 160 and 161: 21Fiber OpticsOne of the reasons fo
- Page 162 and 163: FIBER OPTICS 153Figure 21.IIII did
- Page 164 and 165: FIBER OPTICS 155Figure 21.IVFigure
- Page 166 and 167: 22Computer Aided Instruction—CAIB
- Page 168 and 169: COMPUTER AIDED INSTRUCTION—CAI 15
- Page 170 and 171: and they all knew immediately it wa
- Page 172 and 173: 23MathematicsAs you live your life
- Page 174 and 175: MATHEMATICS 165Figure 23.IFigure 23
- Page 176 and 177: MATHEMATICS 167illustrates my attit
- Page 178 and 179: MATHEMATICS 169can use the same for
- Page 180 and 181: 24Quantum MechanicsMost physicists
- Page 182 and 183: taught QM, no one has found a widel
- Page 184 and 185: QUANTUM MECHANICS 175I do not prete
- Page 186 and 187: CREATIVITY 177I hope the above has
- Page 188 and 189: CREATIVITY 179“memorizing the mat
- Page 190 and 191: 26ExpertsAs remarked in an earlier
- Page 192 and 193: EXPERTS 183Figure 26.ILaboratories
- Page 194 and 195: EXPERTS 185Figure 26.IIthe final an
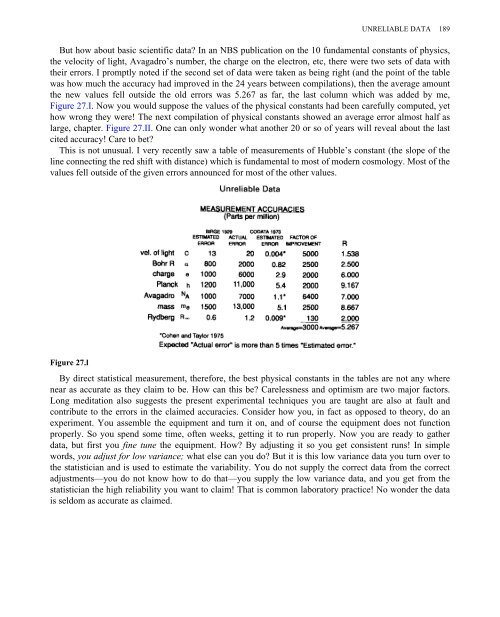
- Page 196 and 197: 27Unreliable DataIt has been my exp
- Page 200 and 201: UNRELIABLE DATA 191country might ge
- Page 202 and 203: UNRELIABLE DATA 193collection of qu
- Page 204 and 205: 28Systems EngineeringParables are o
- Page 206 and 207: SYSTEMS ENGINEERING 197Cramming is
- Page 208 and 209: of traffic performance degrades imm
- Page 210 and 211: SYSTEMS ENGINEERING 201of the natur
- Page 212 and 213: YOU GET WHAT YOU MEASURE 203Figure
- Page 214 and 215: YOU GET WHAT YOU MEASURE 205still o
- Page 216 and 217: YOU GET WHAT YOU MEASURE 207whole o
- Page 218 and 219: 30You and Your ResearchI have given
- Page 220 and 221: YOU AND YOUR RESEARCH 211Confidence
- Page 222 and 223: YOU AND YOUR RESEARCH 213know where
- Page 224 and 225: YOU AND YOUR RESEARCH 215believe, i
- Page 226 and 227: INDEX 217Godel’s theorem, 280grow