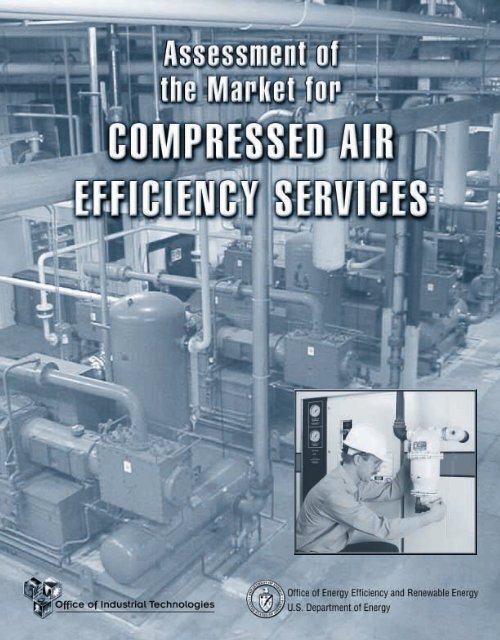
Assessment of the Market for Compressed Air Efficiency Services
Assessment of the Market for Compressed Air Efficiency Services
Assessment of the Market for Compressed Air Efficiency Services
- No tags were found...

Create successful ePaper yourself
Turn your PDF publications into a flip-book with our unique Google optimized e-Paper software.
Prepared <strong>for</strong>Oak Ridge National Laboratory andLawrence Berkeley National Laboratoryby XENERGY, Inc.Burlington, Massachusetts
<strong>Compressed</strong> <strong>Air</strong> <strong>Market</strong> <strong>Assessment</strong>ACKNOWLEDGMENTSThe U.S. Department <strong>of</strong> Energy and <strong>the</strong> authors wouldlike to thank <strong>the</strong> <strong>Compressed</strong> <strong>Air</strong> Challenge ® Ad HocEvaluation Committee <strong>for</strong> <strong>the</strong>ir technical support andassistance in structuring <strong>the</strong> research and reviewingdrafts <strong>of</strong> <strong>the</strong> report. The members <strong>of</strong> <strong>the</strong> Ad HocEvaluation Committee are:Blair Collins,Northwest Energy <strong>Efficiency</strong> AllianceTed Jones,Consortium <strong>for</strong> Energy <strong>Efficiency</strong>Ed McGlynn,NSTAR <strong>Services</strong> CompanyAimee McKane,Lawrence Berkeley National Laboratory, ChairMac Mottley,Mottley <strong>Air</strong> PowerHale Powell,National Grid, <strong>for</strong>merly NEESCover photo courtesy <strong>of</strong> Sou<strong>the</strong>ast Container CorporationInset photo courtesy <strong>of</strong> Gardner Denver, Inc.iiU.S. DEPARTMENT OF ENERGY
TABLE OF CONTENTSEXECUTIVE SUMMARYOverview 1<strong>Compressed</strong> <strong>Air</strong> System Energy Use and<strong>the</strong> Benefits <strong>of</strong> Increased <strong>Efficiency</strong> 1<strong>Compressed</strong> <strong>Air</strong> System Electric Use 1Benefits <strong>of</strong> <strong>Compressed</strong> <strong>Air</strong> System <strong>Efficiency</strong> 1Overview <strong>of</strong> <strong>the</strong> Project and Report 2Objectives 2Research Activities 2Key Findings 3Demand-Side Findings 3Supply-Side Findings 4SECTION 1: INTRODUCTIONOverview 7<strong>Compressed</strong> <strong>Air</strong> System Energy Use and<strong>the</strong> Benefits <strong>of</strong> Increased <strong>Efficiency</strong> 7<strong>Compressed</strong> <strong>Air</strong> System Electric Use 7Benefits <strong>of</strong> <strong>Compressed</strong> <strong>Air</strong> System <strong>Efficiency</strong> 9Overview <strong>of</strong> <strong>the</strong> Project and Report 11Objectives 11Research Activities 11Structure <strong>of</strong> this Report 12SECTION 2: THE DEMAND SIDE OF THE MARKETIntroduction 13Methods: The <strong>Compressed</strong> <strong>Air</strong> <strong>Market</strong> <strong>Assessment</strong> 13Objectives 13Research Activities 13Implementation 14Findings 14Characteristics <strong>of</strong> Customers 14Characteristics <strong>of</strong> <strong>Compressed</strong> <strong>Air</strong> Systems 14<strong>Compressed</strong> <strong>Air</strong> System Management 17Customer Knowledge <strong>of</strong> <strong>Compressed</strong> <strong>Air</strong> SystemEnergy Use and <strong>Efficiency</strong> Opportunities 18Current System Management and Maintenance Practices 21Purchase <strong>of</strong> System Maintenance <strong>Services</strong> 24Awareness and Use <strong>of</strong> <strong>Compressed</strong> <strong>Air</strong> System<strong>Efficiency</strong> <strong>Services</strong> 24Barriers to <strong>the</strong> Purchase <strong>of</strong> <strong>Compressed</strong> <strong>Air</strong> System<strong>Efficiency</strong> <strong>Services</strong> 28U.S. DEPARTMENT OF ENERGYiii
<strong>Compressed</strong> <strong>Air</strong> <strong>Market</strong> <strong>Assessment</strong>SECTION 3: THE SUPPLY SIDE OF THE MARKETIntroduction 31Methods 31Objectives 31Selection <strong>of</strong> Interviewees 31<strong>Assessment</strong> Implementation 32Findings 32Characteristics <strong>of</strong> Vendors 32<strong>Efficiency</strong> Service Offerings 33Barriers and Motivations to Sales <strong>of</strong> <strong>Compressed</strong><strong>Air</strong> <strong>Efficiency</strong> <strong>Services</strong> 36APPENDICESAppendix A: End-User <strong>Assessment</strong> A-1<strong>Compressed</strong> <strong>Air</strong> <strong>Efficiency</strong> <strong>Services</strong> BaselineEnd-User <strong>Assessment</strong> A-1Appendix B: Expert <strong>Assessment</strong> B-1<strong>Market</strong> <strong>for</strong> <strong>Compressed</strong> <strong>Air</strong> System <strong>Efficiency</strong> <strong>Services</strong> B-1ivU.S. DEPARTMENT OF ENERGY
TABLESTABLES1-1: <strong>Compressed</strong> <strong>Air</strong> System Use by Industry Group 81-2: Percent <strong>of</strong> Manufacturing Facilities Using<strong>Compressed</strong> <strong>Air</strong> Equipment 91-3: <strong>Compressed</strong> <strong>Air</strong> System Improvement Applicabilityand Savings 102-1: Distribution <strong>of</strong> Interviewed Customers by SIC 152-2: Distribution by SIC and Number <strong>of</strong> Employees 152-3: Number <strong>of</strong> Compressors in Customer Facilities 162-4: Distribution by SIC and Total Horsepower<strong>of</strong> Compressors 162-5: Hours <strong>of</strong> <strong>Compressed</strong> <strong>Air</strong> System Operations 162-6: Customers Screened Out by SIC 182-7: Position <strong>of</strong> Person with Responsibility<strong>for</strong> CA System Management 192-8: Objectives <strong>of</strong> CA System Management 192-9: Reported Problems in <strong>Compressed</strong> <strong>Air</strong> Systems 202-10: Regularly Scheduled Maintenance Activities 202-11: Number <strong>of</strong> Maintenance Proceduresby Compressor Size 202-12: Leak Prevention Activities 222-13: Quantities Measured 232-14: Reported Improvements in Two Years Priorto <strong>the</strong> 1998 Motor <strong>Market</strong> <strong>Assessment</strong> 232-15: <strong>Services</strong> Provided under CA System Service Contract(Percent <strong>of</strong> those with Contracts) 252-16: Number <strong>of</strong> Operating Problems by ServiceContract Group 252-17: Activities Included in <strong>Efficiency</strong> Service Offers 262-18: Main Reason <strong>for</strong> Not Purchasing <strong>Efficiency</strong> <strong>Services</strong> 262-19: Sources <strong>of</strong> <strong>Compressed</strong> <strong>Air</strong> System <strong>Efficiency</strong>Study <strong>Services</strong> 262-20: Activities Included in <strong>the</strong> <strong>Efficiency</strong> Study 282-21: Measures Implemented from <strong>Efficiency</strong> Study 283-1: Reported Sources <strong>of</strong> Business Revenues 333-2: <strong>Efficiency</strong> <strong>Services</strong> Offered 343-3: Dates When <strong>Efficiency</strong> <strong>Services</strong> Were First Offered 343-4: Frequency <strong>of</strong> <strong>Compressed</strong> <strong>Air</strong> Needs <strong>Assessment</strong>sas Part <strong>of</strong> Equipment Sales Ef<strong>for</strong>ts 343-5: Customer Objections to <strong>Efficiency</strong> Service Offers 34U.S. DEPARTMENT OF ENERGYv
<strong>Compressed</strong> <strong>Air</strong> <strong>Market</strong> <strong>Assessment</strong>viU.S. DEPARTMENT OF ENERGY
EXECUTIVE SUMMARYOVERVIEWThe <strong>Assessment</strong> <strong>of</strong> <strong>the</strong> <strong>Market</strong> <strong>for</strong> <strong>Compressed</strong> <strong>Air</strong> <strong>Efficiency</strong> <strong>Services</strong>,hereafter referred to as <strong>the</strong> <strong>Compressed</strong> <strong>Air</strong> <strong>Market</strong> <strong>Assessment</strong>, wascommissioned by <strong>the</strong> U.S. Department <strong>of</strong> Energy with technical supportprovided by <strong>the</strong> <strong>Compressed</strong> <strong>Air</strong> Challenge ® (CAC). The CAC is a voluntarycollaboration <strong>of</strong> manufacturers, distributors and <strong>the</strong>ir associations;industrial users; facility operating personnel and <strong>the</strong>ir associations; consultants;state research and development agencies; energy efficiency organizations;and utilities. The mission <strong>of</strong> <strong>the</strong> CAC is to develop and provideresources that educate industry on <strong>the</strong> opportunities to increase netpr<strong>of</strong>its through compressed air system optimization.The objective <strong>of</strong> this report is to provide a comprehensive and balancedview <strong>of</strong> <strong>the</strong> market <strong>for</strong> engineering and consulting services to improve <strong>the</strong>energy efficiency <strong>of</strong> plant compressed air systems. These servicesinclude plant assessments or audits to identify opportunities to improvecompressed air system operations, preventive maintenance services,such as leak detection and repair that are aimed at reducing energy use,and redesign <strong>of</strong> controls and o<strong>the</strong>r system components to reduce energyuse. The report is intended <strong>for</strong> use by <strong>the</strong> CAC and o<strong>the</strong>r industrial energyefficiency program operators in developing strategies to encourage <strong>the</strong>growth <strong>of</strong> <strong>the</strong> compressed air system efficiency industry and enhance<strong>the</strong> quality <strong>of</strong> <strong>the</strong> services it <strong>of</strong>fers. <strong>Compressed</strong> air system vendorsand designers may also find it useful in charting <strong>the</strong>ir own approach toproviding energy efficiency services.COMPRESSED AIR SYSTEM ENERGY USE ANDTHE BENEFITS OF INCREASED EFFICIENCY<strong>Compressed</strong> <strong>Air</strong> System Electric Use<strong>Compressed</strong> air systems account <strong>for</strong> 10% <strong>of</strong> all electricity and roughly16% <strong>of</strong> all motor system energy use in U.S. manufacturing industries. 1Seventy percent <strong>of</strong> all manufacturing facilities in <strong>the</strong> United States havesome <strong>for</strong>m <strong>of</strong> compressed air system. Most <strong>of</strong> <strong>the</strong>se systems providecompressed air to drive a variety <strong>of</strong> equipment within a given plant,including machine tools, painting booths, materials separation, andmaterials handling.Benefits <strong>of</strong> <strong>Compressed</strong> <strong>Air</strong> System <strong>Efficiency</strong>Recent experience in a variety <strong>of</strong> “system optimization programs,” aswell as <strong>the</strong> experience <strong>of</strong> consultants in <strong>the</strong> field, suggests that over50% <strong>of</strong> industrial plant air systems harbor opportunities <strong>for</strong> largeenergy savings with relatively low project costs. <strong>Compressed</strong> air systemmeasures identified in energy audits <strong>of</strong> small- to medium-sized industrialfacilities by <strong>the</strong> Industrial <strong>Assessment</strong> Centers had average projected1 Unless o<strong>the</strong>rwise noted, in<strong>for</strong>mation in this section is taken from XENERGY, Inc. (1998) United States Industrial Electric MotorSystems <strong>Market</strong> Opportunities <strong>Assessment</strong>. Washington, D.C.: U.S. Department <strong>of</strong> Energy, Office <strong>of</strong> Industrial Technologies,and Oak Ridge National Laboratory. The study is hereafter referred to as <strong>the</strong> Motor <strong>Market</strong> <strong>Assessment</strong>.U.S. DEPARTMENT OF ENERGY1
<strong>Compressed</strong> <strong>Air</strong> <strong>Market</strong> <strong>Assessment</strong>savings <strong>of</strong> 15% <strong>of</strong> compressed air system usage with simple paybacksin less than 2 years. Many case studies conducted <strong>for</strong> system optimizationprograms have identified savings in <strong>the</strong> range <strong>of</strong> 30 to 60% <strong>of</strong> initialsystem usage. The United States Industrial Electric Motor Systems <strong>Market</strong>Opportunities <strong>Assessment</strong> (Motor <strong>Market</strong> <strong>Assessment</strong>) estimated that compressedair system energy use in <strong>the</strong> typical manufacturing facility could bereduced by 17% through measures with simple paybacks <strong>of</strong> 3 years orless. In addition to energy benefits, optimization <strong>of</strong> compressed air systemsfrequently results in corresponding improvements in system reliability,product quality, and overall productivity.OVERVIEW OF THE PROJECT AND REPORTSeventy percent <strong>of</strong>all manufacturingfacilities in <strong>the</strong>United Stateshave some <strong>for</strong>m<strong>of</strong> compressedair system.This market assessment was designed and carried out in consultationwith <strong>the</strong> Ad Hoc Evaluation Committee <strong>of</strong> <strong>the</strong> <strong>Compressed</strong> <strong>Air</strong>Challenge ® . The Committee reviewed <strong>the</strong> research plan, <strong>the</strong> assessmentinterviewing approaches, draft questionnaires, and drafts <strong>of</strong> <strong>the</strong>various sections <strong>of</strong> this report.ObjectivesThe project was designed to answer a number <strong>of</strong> key questions concerning<strong>the</strong> demand and supply sides <strong>of</strong> <strong>the</strong> market <strong>for</strong> compressed airefficiency services. Among <strong>the</strong> key research questions to be addressedon <strong>the</strong> demand side <strong>of</strong> <strong>the</strong> market were <strong>the</strong> following:• What extent are customers in key end-use sectors aware <strong>of</strong> compressedair usage, costs, and savings opportunities?• What practices do <strong>the</strong>se customers follow to monitor, maintain, andenhance <strong>the</strong> efficiency <strong>of</strong> compressed air systems?• What, if any, services do <strong>the</strong>se customers purchase to maintain orenhance <strong>the</strong> efficiency <strong>of</strong> compressed air systems?• What barriers do customers experience in purchasing such services?The key research questions on <strong>the</strong> supply side <strong>of</strong> <strong>the</strong> market wereas follows:• What efficiency services do compressed air distributors, installers,and consultants currently <strong>of</strong>fer?• What is <strong>the</strong> current volume <strong>of</strong> sales <strong>for</strong> <strong>the</strong>se services (number <strong>of</strong>customers, number <strong>of</strong> projects, dollar volumes)? How has volumechanged over <strong>the</strong> past few years? What are vendors’ expectationsregarding growth?• What role do <strong>the</strong>se services play in <strong>the</strong> overall business strategy <strong>of</strong>manufacturers, distributors, and consultants?• What barriers do <strong>the</strong>se businesses face in developing and sellingcompressed air system efficiency services?Research ActivitiesThe report is based on a combination <strong>of</strong> primary and secondary research,including:2U.S. DEPARTMENT OF ENERGY
EXECUTIVE SUMMARY• An assessment <strong>of</strong> 91 compressed air equipment distributors. Weconcentrated our ef<strong>for</strong>ts to characterize <strong>the</strong> supply side on distributors,since <strong>the</strong>se companies have established commercial andservice relationships with end users, and are in <strong>the</strong> best positionto serve as a channel <strong>for</strong> delivering system efficiency services.• An assessment <strong>of</strong> 222 industrial end users who have compressedair systems.• Interviews with 5 veteran compressed air efficiency consultants,designed to capture <strong>the</strong>ir perceptions <strong>of</strong> <strong>the</strong> current state andrecent changes in both <strong>the</strong> demand and supply side <strong>of</strong> <strong>the</strong> market<strong>for</strong> compressed air system efficiency services.• Reanalysis <strong>of</strong> data on compressed air use and maintenancepractices collected in 1997 as part <strong>of</strong> <strong>the</strong> field inventory <strong>for</strong> <strong>the</strong>Motor <strong>Market</strong> <strong>Assessment</strong>.• Review <strong>of</strong> regional studies <strong>of</strong> <strong>the</strong> market <strong>for</strong> compressed air systemefficiency services. 2KEY FINDINGSDemand-Side Findings• Customer awareness <strong>of</strong> and concern <strong>for</strong> compressed airefficiency is low. Only 9% <strong>of</strong> customers interviewed <strong>for</strong> <strong>the</strong>program identified controlling energy costs as <strong>the</strong> primary objectivein compressed air system maintenance and management. Only17% mentioned efficiency at all as a system management objective.This low level <strong>of</strong> interest and knowledge was echoed in findingsfrom <strong>the</strong> regional studies and interviews with compressed air systemefficiency consultants.• Maintenance <strong>of</strong> consistent, reliable compressed air supply is <strong>the</strong>principal objective <strong>of</strong> system management. Seventy-one percent<strong>of</strong> customers reported that ensuring adequate air supply is <strong>the</strong>irprimary objective in system management. According to consultantsinterviewed <strong>for</strong> this project, concern about operating consistencyprovides an effective route to selling efficiency-oriented services.• A large portion <strong>of</strong> customers report serious problems in compressedair system operation and maintenance. Thirty-five percent<strong>of</strong> those interviewed reported that <strong>the</strong>y had experienced unscheduledshutdowns <strong>of</strong> <strong>the</strong>ir compressed air systems during <strong>the</strong> previous12 months. For 60% <strong>of</strong> <strong>the</strong>se establishments, or 21% <strong>of</strong> all establishments,<strong>the</strong> shutdown had lasted 2 days or more.Two-thirds <strong>of</strong> <strong>the</strong> customers reported experiencing potentially seriousoperating problems in <strong>the</strong>ir compressed air systems. Excessmoisture and inadequate air pressure were <strong>the</strong> most frequentlyreported problems.• A significant portion <strong>of</strong> customers report having service contracts<strong>for</strong> <strong>the</strong>ir compressed air systems, but few <strong>of</strong> <strong>the</strong>se contracts...energy use in <strong>the</strong>typical manufacturingfacility could bereduced by 17%through measureswith simple paybacks<strong>of</strong> 3 years or less.2 Including Aspen Systems Corporation, The <strong>Compressed</strong> <strong>Air</strong> Systems <strong>Market</strong> <strong>Assessment</strong> <strong>for</strong> New England, <strong>Compressed</strong> <strong>Air</strong> BaselineStudy Group, April 2000; and Customer Opinion Research, <strong>Compressed</strong> <strong>Air</strong> <strong>Market</strong> Trans<strong>for</strong>mation: Quantitative Baseline Research,prepared <strong>for</strong> Pacific Gas & Electric, 1999.U.S. DEPARTMENT OF ENERGY3
<strong>Compressed</strong> <strong>Air</strong> <strong>Market</strong> <strong>Assessment</strong>Seventy-five percent<strong>of</strong> operators <strong>of</strong> <strong>the</strong>systems installed hadhad no <strong>for</strong>mal trainingin compressed airsystem efficiency.address system efficiency. Thirty percent <strong>of</strong> customers reportedthat <strong>the</strong>y had service contracts <strong>for</strong> <strong>the</strong>ir compressed air systems.However, only one-third <strong>of</strong> <strong>the</strong>se (or 10% <strong>of</strong> all participants) reportedthat efficiency-oriented services such as leak detection, energy-usemonitoring, or assessment <strong>of</strong> control strategies were included in <strong>the</strong>service contract. There was no difference in <strong>the</strong> incidence <strong>of</strong>unscheduled system shutdowns or operating problems betweencustomers with service contracts and those without such contracts.• Thirty-five percent <strong>of</strong> customers interviewed reported that <strong>the</strong>yconducted leak prevention programs.• Reported implementation <strong>of</strong> compressed air efficiency measuresis very low. The 1998 Motor <strong>Market</strong> <strong>Assessment</strong> found that 57% <strong>of</strong>manufacturing plants had taken no action to improve compressedair system efficiency—including repairing leaks—over <strong>the</strong> 2 yearsprior to <strong>the</strong> survey. A 1999 survey <strong>of</strong> 270 large industrial usersserved by Pacific Gas & Electric (PG&E) obtained a similar finding. 3• Seventy-five percent <strong>of</strong> operators <strong>of</strong> <strong>the</strong> systems installed hadhad no <strong>for</strong>mal training in compressed air system efficiency.• Seventeen percent <strong>of</strong> customers reported that <strong>the</strong>y had undertakena compressed air system audit over <strong>the</strong> past 7 years. 4Most <strong>of</strong> <strong>the</strong> audits had been conducted in <strong>the</strong> past 6 years; and 6were underway at <strong>the</strong> time <strong>of</strong> <strong>the</strong> interview. While most <strong>of</strong> <strong>the</strong> auditsincluded estimates <strong>of</strong> energy use and identified potential energysavingmeasures, fewer than half included estimated savings andcosts <strong>for</strong> recommended measures. Two-thirds <strong>of</strong> <strong>the</strong> customers whoconducted system audits reported that <strong>the</strong>y had implemented atleast one <strong>of</strong> <strong>the</strong> recommended measures.• One-third <strong>of</strong> <strong>the</strong> customers reported that vendors selling“services specifically designed to reduce energy costs in...compressed air systems” had approached <strong>the</strong>m. The nature <strong>of</strong><strong>the</strong>se services varied widely. The most frequently mentioned werepreventive maintenance <strong>for</strong> compressors, assessment <strong>of</strong> controlstrategies, and identification <strong>of</strong> energy-saving measures. No oneservice was mentioned by more than 46% <strong>of</strong> those interviewed. Thisresult reflects <strong>the</strong> <strong>for</strong>mative state <strong>of</strong> <strong>the</strong> market <strong>for</strong> compressed airsystem efficiency services. Vendors have not defined <strong>the</strong> nature <strong>of</strong>such services consistently.Only 3% <strong>of</strong> customers reported that <strong>the</strong>y had purchased compressedair efficiency services in response to <strong>the</strong>se sales approaches. Themost frequent objections to <strong>the</strong>se services were high cost and<strong>the</strong> customers’ view that <strong>the</strong>y could undertake such activities within-house staff.Supply-Side Findings• A large portion <strong>of</strong> distributors report that <strong>the</strong>y <strong>of</strong>fer compressedair efficiency services. Over three-quarters <strong>of</strong>fer system-efficiencymeasures, while over one-half <strong>of</strong>fer end-use analyses and leakservices.4U.S. DEPARTMENT OF ENERGY3 Customer Opinion Research, <strong>Compressed</strong> <strong>Air</strong> <strong>Market</strong> Trans<strong>for</strong>mation: Quantitative Baseline Research, prepared <strong>for</strong> Pacific Gas &Electric, 1999.4 <strong>Compressed</strong> air system audit was defined in <strong>the</strong> questionnaire as “a study <strong>of</strong> how to make your compressed air system as a whole moreenergy efficient.” Field experience <strong>of</strong> CAC Committee members suggests that audit methods are not uni<strong>for</strong>m and are seldomcomprehensive.
EXECUTIVE SUMMARY• However, efficiency services are a very minor portion <strong>of</strong>distributor revenues. An estimated 4% <strong>of</strong> total revenues arederived from compressed air efficiency services.• Over one-half <strong>of</strong> vendors feel that <strong>the</strong> demand <strong>for</strong> efficiencyservices has increased over <strong>the</strong> last year.• Most distributors that <strong>of</strong>fer efficiency-related services haveentered <strong>the</strong> market within <strong>the</strong> past 10 years; one-third haveentered in <strong>the</strong> past 4 years.• Most distributors interviewed consider efficiency servicesessential to <strong>the</strong>ir competitive positions. Sixty-seven percent <strong>of</strong>distributors rate efficiency services as being important to <strong>the</strong>ircompetitive position. Their major motivation to enter <strong>the</strong> market iscustomer retention. With <strong>the</strong> number <strong>of</strong> firms that <strong>of</strong>fer efficiencyservices increasing, vendors believed that <strong>the</strong>y needed to reply inkind to maintain satisfaction among <strong>the</strong>ir equipment purchasers.Access to additional revenue streams from consulting was notmentioned at all as a motivating factor.• Most distributors identified customers’ lack <strong>of</strong> understanding<strong>of</strong> <strong>the</strong> benefits <strong>of</strong> compressed air efficiency measures as <strong>the</strong>major barrier to <strong>the</strong>ir increased sale. These findings mirror <strong>the</strong>experience <strong>of</strong> compressed air efficiency consultants. Forty-five percent<strong>of</strong> <strong>the</strong> vendors identified customer perceptions that compressedair efficiency services were already being provided by in-house staffas an objection to sales ef<strong>for</strong>ts. This finding, combined with <strong>the</strong>reported low incidence <strong>of</strong> specific measure implementation, fur<strong>the</strong>rrein<strong>for</strong>ces <strong>the</strong> consultants’ observation that customers are largely in<strong>the</strong> dark about <strong>the</strong> nature <strong>of</strong> compressed air system efficiency measuresand maintenance practices.Most distributorsidentified customers’lack <strong>of</strong> understanding<strong>of</strong> <strong>the</strong> benefits <strong>of</strong>compressed airefficiency measuresas <strong>the</strong> major barrierto <strong>the</strong>ir increased sale.U.S. DEPARTMENT OF ENERGY5
<strong>Compressed</strong> <strong>Air</strong> <strong>Market</strong> <strong>Assessment</strong>6U.S. DEPARTMENT OF ENERGY
SECTION 1: INTRODUCTIONOVERVIEWThe <strong>Compressed</strong> <strong>Air</strong> (CA) <strong>Market</strong> <strong>Assessment</strong> was commissioned by<strong>the</strong> United States Department <strong>of</strong> Energy with technical support providedby <strong>the</strong> <strong>Compressed</strong> <strong>Air</strong> Challenge ® (CAC). The CAC is a voluntary collaboration<strong>of</strong> manufacturers, distributors and <strong>the</strong>ir associations; industrialusers; facility operating personnel and <strong>the</strong>ir associations; consultants;state research and development agencies; energy efficiency organizations;and utilities. The mission <strong>of</strong> <strong>the</strong> CAC is to develop and provideresources that educate industry on <strong>the</strong> opportunities to increase netpr<strong>of</strong>its through compressed air system optimization. To date, <strong>the</strong> primaryactivity <strong>of</strong> <strong>the</strong> CAC has been to develop, promote, and present trainingprograms in compressed air system efficiency targeted to equipmentvendors and end users. As <strong>of</strong> December 2000, 2,882 individuals hadattended <strong>the</strong> CAC “Fundamentals <strong>of</strong> <strong>Compressed</strong> <strong>Air</strong> Training” and 843individuals had attended “Advanced Management <strong>of</strong> <strong>Compressed</strong> <strong>Air</strong>Systems.” O<strong>the</strong>r program activities include a sourcebook, a Web site(www.compressedairchallenge.org), technical support through <strong>the</strong> DOEClearinghouse, technical articles, and conference presentations.The objective <strong>of</strong> this report is to provide a comprehensive and balancedview <strong>of</strong> <strong>the</strong> market <strong>for</strong> engineering and consulting services to improve<strong>the</strong> energy efficiency <strong>of</strong> plant compressed air systems. These servicesinclude plant assessments or audits to identify opportunities to improvecompressed air system operations, preventive maintenance services,such as leak detection and repair that are aimed at reducing energy use,and redesign <strong>of</strong> controls and o<strong>the</strong>r system components to reduce energyuse. The report is intended <strong>for</strong> use by <strong>the</strong> CAC and o<strong>the</strong>r industrial energyefficiency program operators in developing strategies to encourage <strong>the</strong>growth <strong>of</strong> <strong>the</strong> compressed air system efficiency industry and enhance<strong>the</strong> quality <strong>of</strong> <strong>the</strong> services it <strong>of</strong>fers. <strong>Compressed</strong> air system vendorsand designers may also find it useful in charting <strong>the</strong>ir own approach toproviding energy efficiency services.COMPRESSED AIR SYSTEM ENERGY USE ANDTHE BENEFITS OF INCREASED EFFICIENCY<strong>Compressed</strong> <strong>Air</strong> System Electric Use<strong>Compressed</strong> air systems account <strong>for</strong> 10% <strong>of</strong> all electricity and roughly16% <strong>of</strong> all motor system energy use in U.S. manufacturing industries. 1Most <strong>of</strong> <strong>the</strong>se systems provide compressed air to drive a variety <strong>of</strong>equipment within a given plant, including machine tools, painting booths,materials separation, and materials handling. Table 1-1 shows <strong>the</strong>amount <strong>of</strong> electricity used to drive compressed air systems by majormanufacturing industry, as well as <strong>the</strong> percentage <strong>of</strong> total electricityconsumption accounted <strong>for</strong> by those systems.1 Unless o<strong>the</strong>rwise noted, in<strong>for</strong>mation in this section is taken from XENERGY, Inc. (1998) United States Industrial Electric MotorSystems <strong>Market</strong> Opportunities <strong>Assessment</strong>. Washington, D.C.: U.S. Department <strong>of</strong> Energy, Office <strong>of</strong> Industrial Technologies,and Oak Ridge National Laboratory. The study is hereafter referred to as <strong>the</strong> Motor <strong>Market</strong> <strong>Assessment</strong>.U.S. DEPARTMENT OF ENERGY7
TABLE 1-1: <strong>Compressed</strong> <strong>Air</strong> System Use by Industry Group<strong>Compressed</strong> <strong>Air</strong> <strong>Market</strong> <strong>Assessment</strong>SIC Industry Group <strong>Compressed</strong> <strong>Air</strong> Total Motor Comp. <strong>Air</strong> as % <strong>of</strong> Comp. <strong>Air</strong> as % <strong>of</strong>System GWh/Year System GWh/Year Motor System UseTotal Electric Use28 Chemicals and Allied Products 39,960 144,362 27.7% 20.1%33 Primary Metal Industries 12,609 87,935 14.3% 8.3%29 Petroleum and Coal Products 7,930 51,938 15.3% 15.9%37 Transportation Equipment 5,519 29,549 18.7% 14.0%30 Rubber and Miscellaneous Plastics Products 4,767 36,610 13.0% 10.9%26 Paper and Allied Products 4,533 99,594 4.6% 3.7%36 Electronic and O<strong>the</strong>r Electric Equipment 3,008 13,243 22.7% 9.1%20 Food and Kindred Products 2,898 37,797 7.7% 4.5%22 Textile Mill Products 2,392 16,750 14.3% 7.2%24 Lumber and Wood Products 1,901 22,946 8.3% 8.7%34 Fabricated Metal Products 1,777 7,296 24.4% 5.2%35 Industrial Machinery and Equipment 1,172 7,378 15.9% 3.6%38 Instruments and Related Products 721 6,487 11.1% 4.9%32 Stone, Clay, and Glass Products 566 2,231 25.4% 1.6%25 Furniture and Fixtures 460 3,694 12.5% 6.9%27 Printing and Publishing 437 5,961 7.3% 2.5%23 Apparel and O<strong>the</strong>r Textile Products 398 1,168 34.1% 5.1%31 Lea<strong>the</strong>r and Lea<strong>the</strong>r Products 1 491 0.3% 0.2%20-39 Overall Manufacturing 91,050 575,428 15.8% 10.0%Table 1-1 suggests that electricity used to drive air compressors isheavily concentrated in three manufacturing groups: chemicals, primarymetals, and petroleum manufacturing. Particularly in chemicals andpetroleum refining, compressed air or o<strong>the</strong>r gases are used as feedstocksor are o<strong>the</strong>rwise delivered directly to <strong>the</strong> production processwithout going through a plantwide air system. In o<strong>the</strong>r industries, suchas transportation equipment, air compressors are used almost exclusivelyto power plantwide systems. We are not aware <strong>of</strong> any sourcesthat disaggregate energy compressed air usage by plant versus standalonesystems. The energy estimates in this section cover all types <strong>of</strong>air compressors, not just those used to run plantwide systems. Thispoint is important because <strong>the</strong> kinds <strong>of</strong> efficiency services assessedin this report, as well as estimates <strong>of</strong> energy savings from various kinds<strong>of</strong> measures, are particular to plant air systems.8U.S. DEPARTMENT OF ENERGYTable 1-2 shows <strong>the</strong> percentage <strong>of</strong> manufacturing facilities that haveand use compressed air equipment. Across all manufacturing industries,70% <strong>of</strong> facilities have compressed air systems that account <strong>for</strong> more
INTRODUCTIONTABLE 1-2: Percent <strong>of</strong> Manufacturing Facilities Using <strong>Compressed</strong> <strong>Air</strong> EquipmentSIC INDUSTRY GROUP PERCENT OF TOTAL ESTABLISHMENTS WITHthan 5% <strong>of</strong> total motor system energy use. Eighteen percent have nocompressed air systems at all. The figures in Table 1-2 are derived from<strong>the</strong> results <strong>of</strong> roughly 2,000 screening interviews conducted toconstruct <strong>the</strong> sample <strong>for</strong> <strong>the</strong> Motor <strong>Market</strong> <strong>Assessment</strong>. For some SICcategories, <strong>the</strong> number <strong>of</strong> screening interviews were small, and smallsample sizes may have led to unrepresentative results. For example,results <strong>of</strong> <strong>the</strong> vendor interviews reported in Section 3 suggest that <strong>the</strong>portion <strong>of</strong> printing facilities with plant compressed air systems issignificantly higher than <strong>the</strong> 5% identified in <strong>the</strong> screening interviews.Benefits <strong>of</strong> <strong>Compressed</strong> <strong>Air</strong> System <strong>Efficiency</strong>No CA Small CA Full CASystem System* System20 Food and Kindred Products 13% 34% 53%22 Textile Mill Products 0% 24% 76%23 Apparel and O<strong>the</strong>r Textile Products 9% 0% 91%24 Lumber and Wood Products 8% 10% 82%25 Furniture and Fixtures 0% 0% 100%26 Paper and Allied Products 19% 21% 61%27 Printing and Publishing 95% 0% 5%28 Chemicals and Allied Products 8% 7% 84%29 Petroleum and Coal Products 0% 16% 84%30 Rubber and Miscellaneous Plastics Products 0% 12% 88%32 Stone, Clay, and Glass Products 0% 0% 100%33 Primary Metal Industries 5% 13% 82%34 Fabricated Metal Products 8% 61% 31%35 Industrial Machinery and Equipment 1% 0% 99%36 Electronic and O<strong>the</strong>r Electric Equipment 9% 0% 91%37 Transportation Equipment 0% 8% 92%38 Instruments and Related Products 11% 0% 89%20-39 Overall Manufacturing 18% 12% 70%* CA system accounts <strong>for</strong> less than 5 percent <strong>of</strong> motor system energy. Source: <strong>Market</strong> <strong>Assessment</strong> data; XENERGY, Inc., analysis.Recent experience in a variety <strong>of</strong> “system optimization programs,” aswell as <strong>the</strong> experience <strong>of</strong> consultants in <strong>the</strong> field, suggests that manyindustrial plant air systems harbor opportunities <strong>for</strong> large energy savingswith relatively low project costs. <strong>Compressed</strong> air system measuresidentified in energy audits <strong>of</strong> small- to medium-sized industrial facilities byU.S. DEPARTMENT OF ENERGY9
TABLE 1-3: <strong>Compressed</strong> <strong>Air</strong> System Improvement Applicability and Savings<strong>Compressed</strong> <strong>Air</strong> <strong>Market</strong> <strong>Assessment</strong>Measure Applicability Savings NetLow Midrange High Fraction SavingsReduce Overall System Requirements 20% 30% 40% 20% 6.0%Match Compressor Size to Load 5% 10% 15% 3% 0.3%Improve Compressor Controls 15% 25% 40% 10% 2.5%Improve Compressor Components 5% 15% 20% 5% 0.8%Operation and Maintenance 50% 75% 85% 10% 7.5%Overall Savings 17.1%<strong>the</strong> Industrial <strong>Assessment</strong> Centers had average projected savings <strong>of</strong> 15%<strong>of</strong> compressed air systems with simple paybacks in less than 2 years.Many case studies conducted <strong>for</strong> system optimization programs haveidentified savings in <strong>the</strong> range <strong>of</strong> 30 to 60% <strong>of</strong> initial system usage.Many case studiesconducted <strong>for</strong>system optimizationprograms haveidentified savingsin <strong>the</strong> range <strong>of</strong>30 to 60% <strong>of</strong> initialsystem usage.In developing estimates <strong>of</strong> energy savings potential <strong>for</strong> <strong>the</strong> Motor <strong>Market</strong><strong>Assessment</strong>, XENERGY, Inc., interviewed a number <strong>of</strong> compressed airsystem efficiency experts to estimate <strong>the</strong> average level <strong>of</strong> energy savingsavailable in plant air systems. We asked <strong>the</strong>se experts to identify <strong>the</strong> mostcommonly available energy efficiency measures, estimate <strong>the</strong> percentage<strong>of</strong> installed systems in which <strong>the</strong>y would be applicable (i.e., be technicallyfeasible and achieve a payback <strong>of</strong> 3 years or less), and <strong>the</strong> level <strong>of</strong> energysavings <strong>the</strong>y generally achieve, expressed as a percentage <strong>of</strong> initialsystem energy. Table 1-3 summarizes <strong>the</strong> findings from this research.A recent study commissioned by utilities in <strong>the</strong> Nor<strong>the</strong>ast estimatedpotential savings <strong>of</strong> 30% <strong>of</strong> compressed air system electric use if <strong>the</strong>3-year payback criterion is relaxed. 2 This larger technical potential issignificant in areas where utility incentives are available. 3The figures in Table 1-3 suggest that, on average, compressed air systemusage can be reduced by 17.1% through measures that yield maximumpayback <strong>of</strong> 3 years. Based on conversations with compressed air systemconsultants, <strong>the</strong>se projects can generally be executed at capital costranging from $10,000 to $100,000, with a typical range <strong>of</strong> $20,000 to$50,000. If all <strong>of</strong> <strong>the</strong>se projects were implemented, energy savingswould total 15,670 GWh per year, or $747 million at current industrialelectric rates.In addition to <strong>the</strong>se attractive energy savings, improvements to <strong>the</strong> energyefficiency <strong>of</strong> compressed air systems also yield o<strong>the</strong>r important benefitsto <strong>the</strong> end user. Because many <strong>of</strong> <strong>the</strong> measures shown in Table 1-3require significant levels <strong>of</strong> system monitoring and maintenance <strong>for</strong> properimplementation, one <strong>of</strong> <strong>the</strong>ir by-products is improved system operation.This in turn leads to reductions in unscheduled downtime and wastedinputs, as well as to improved control over product quality. In manycases, <strong>the</strong>se benefits have value greater than <strong>the</strong> energy savings.10U.S. DEPARTMENT OF ENERGY2 XENERGY, Inc. (1998) United States Industrial Electric Motor Systems <strong>Market</strong> Opportunities <strong>Assessment</strong>. Washington, D. C.:U. S. Department <strong>of</strong> Energy, Office <strong>of</strong> Industrial Technology, and Oak Ridge National Laboratory, page 61.3 Aspen Systems Corporation. The <strong>Compressed</strong> <strong>Air</strong> Systems <strong>Market</strong> <strong>Assessment</strong> <strong>for</strong> New England, <strong>Compressed</strong> <strong>Air</strong> Baseline StudyGroup, April 2000.
INTRODUCTIONOVERVIEW OF THE PROJECT AND REPORTThis market assessment was designed and carried out in consultation with<strong>the</strong> Ad Hoc Evaluation Committee <strong>of</strong> <strong>the</strong> <strong>Compressed</strong> <strong>Air</strong> Challenge ® . TheCommittee reviewed <strong>the</strong> research plan, <strong>the</strong> assessment interviewingapproaches, draft questionnaires, and drafts <strong>of</strong> <strong>the</strong> various sections <strong>of</strong>this report.ObjectivesThe project was designed to answer a number <strong>of</strong> key questions concerning<strong>the</strong> demand and supply sides <strong>of</strong> <strong>the</strong> market <strong>for</strong> compressed airefficiency services.Among <strong>the</strong> key research questions to be addressed on <strong>the</strong> demandside <strong>of</strong> <strong>the</strong> market were <strong>the</strong> following:• To what extent are customers in key end-use sectors aware <strong>of</strong> compressedair usage, costs, and savings opportunities?• What practices do <strong>the</strong>se customers follow to monitor, maintain, andenhance <strong>the</strong> efficiency <strong>of</strong> compressed air systems?• What, if any, services do <strong>the</strong>se customers purchase to maintain orenhance <strong>the</strong> efficiency <strong>of</strong> compressed air systems?• What barriers do customers experience in purchasing such services?• How and by whom are decisions concerning <strong>the</strong> purchase and modification<strong>of</strong> compressed air systems made? What are <strong>the</strong> key criteriain such decisions?The key research questions on <strong>the</strong> supply side <strong>of</strong> <strong>the</strong> market were asfollows:• What efficiency services do compressed air distributors, installers,and consultants currently <strong>of</strong>fer?• What is <strong>the</strong> current volume <strong>of</strong> sales <strong>for</strong> <strong>the</strong>se services (number <strong>of</strong>customers, number <strong>of</strong> projects, dollar volumes)? How has volumechanged over <strong>the</strong> past few years? What are vendors’ expectationsregarding growth?• To which kinds <strong>of</strong> customers (as defined by industry segment, size<strong>of</strong> system, complexity <strong>of</strong> system) are <strong>the</strong>se services most <strong>of</strong>ten sold?• What kinds <strong>of</strong> skills, equipment, and o<strong>the</strong>r resources are needed todeliver efficiency services?• What role do <strong>the</strong>se services play in <strong>the</strong> overall business strategy <strong>of</strong>manufacturers, distributors, and consultants?• What barriers do <strong>the</strong>se businesses face in developing and sellingcompressed air system efficiency services?If <strong>the</strong> recommendedimprovement measuresin Table 1-3 wereimplemented, energysavings would total15,670 GWh per yearor $747 million atcurrent industrialelectric rates.Research ActivitiesThe report is based on a combination <strong>of</strong> primary and secondaryresearch, including:• An assessment <strong>of</strong> 91 compressed air equipment distributors;• An assessment <strong>of</strong> 222 industrial end users who have compressedair systems;U.S. DEPARTMENT OF ENERGY11
<strong>Compressed</strong> <strong>Air</strong> <strong>Market</strong> <strong>Assessment</strong>• Interviews with 5 veteran compressed air efficiency consultants,designed to capture <strong>the</strong>ir perceptions <strong>of</strong> <strong>the</strong> current state andrecent changes in both <strong>the</strong> demand and supply side <strong>of</strong> <strong>the</strong> market<strong>for</strong> compressed air system efficiency services;• Reanalysis <strong>of</strong> data on compressed air use and maintenance practicescollected in 1997 as part <strong>of</strong> <strong>the</strong> field inventory <strong>for</strong> <strong>the</strong> Motor <strong>Market</strong><strong>Assessment</strong>;• Review <strong>of</strong> regional studies <strong>of</strong> <strong>the</strong> market <strong>for</strong> compressed air systemefficiency services. The two principal studies used in this regard were 4 :■ The <strong>Compressed</strong> <strong>Air</strong> Systems <strong>Market</strong> <strong>Assessment</strong> and BaselineStudy <strong>for</strong> New England (2000) by Aspen Systems Corporation <strong>for</strong><strong>the</strong> New England Study Group. This was a comprehensive study <strong>of</strong><strong>the</strong> market <strong>for</strong> compressed air efficiency services in New England.Research included interviews with 56 individuals, including utilitycompany representatives, service providers, equipment vendors,consultants, and end users. This original research was supportedby review <strong>of</strong> existing literature and local energy use studiescommissioned by <strong>the</strong> utilities that <strong>for</strong>med <strong>the</strong> study group.■ <strong>Compressed</strong> <strong>Air</strong> <strong>Market</strong> Trans<strong>for</strong>mation: Quantitative BaselineResearch (1999) prepared by Customer Opinion Research <strong>for</strong>PG&E. The research <strong>for</strong> this study consisted primarily <strong>of</strong> a telephonesurvey <strong>of</strong> 270 <strong>of</strong> PG&E’s industrial customers with compressedair systems <strong>of</strong> at least 50 horsepower. The primary purpose <strong>of</strong><strong>the</strong> study was to establish a baseline <strong>for</strong> compressed air systemoperation and maintenance practices and to quantify <strong>the</strong> marketpotential <strong>for</strong> compressed air system efficiency services.STRUCTURE OF THIS REPORTThe remainder <strong>of</strong> this report is divided into <strong>the</strong> following sections:• Section 2: The Demand Side <strong>of</strong> <strong>the</strong> <strong>Market</strong>. This section presentsfindings from <strong>the</strong> sources discussed above concerning <strong>the</strong> demandside <strong>of</strong> <strong>the</strong> market. In particular, we focus on descriptors <strong>of</strong> compressedair system design and use, customers’ current practices inregard to compressed air system management and maintenance,customers’ current use <strong>of</strong> compressed air system efficiency services,as well as barriers and motivations to greater use <strong>of</strong> such services.• Section 3: The Supply Side <strong>of</strong> <strong>the</strong> <strong>Market</strong>. This section presentsfindings from <strong>the</strong> sources discussed above concerning <strong>the</strong> supplyside <strong>of</strong> <strong>the</strong> market. We concentrate primarily on distributors’ current<strong>of</strong>ferings, <strong>the</strong>ir perceptions <strong>of</strong> trends on <strong>the</strong> demand side <strong>of</strong> <strong>the</strong>market, and barriers and motivations <strong>the</strong>y perceive to developing<strong>the</strong>ir efficiency <strong>of</strong>ferings fur<strong>the</strong>r.12U.S. DEPARTMENT OF ENERGY4 Aspen Systems Corporation, The <strong>Compressed</strong> <strong>Air</strong> Systems <strong>Market</strong> <strong>Assessment</strong> <strong>for</strong> New England, <strong>Compressed</strong> <strong>Air</strong> Baseline StudyGroup, April 2000; and Customer Opinion Research, <strong>Compressed</strong> <strong>Air</strong> <strong>Market</strong> Trans<strong>for</strong>mation: Quantitative Baseline Research, prepared<strong>for</strong> Pacific Gas & Electric, 1999.
SECTION 2: THE DEMAND SIDE OF THE MARKETINTRODUCTIONThis section presents findings from <strong>the</strong> various sources discussed inSection 1 concerning <strong>the</strong> demand side <strong>of</strong> <strong>the</strong> market <strong>for</strong> compressed airsystem efficiency services. The analysis draws principally from <strong>the</strong> findings<strong>of</strong> an assessment <strong>of</strong> 222 plant engineers undertaken <strong>for</strong> this study.We bring in findings from <strong>the</strong> regional studies, <strong>the</strong> Motor <strong>Market</strong><strong>Assessment</strong>, distributor survey, and consultant interviews to provideperspective on <strong>the</strong> findings <strong>of</strong> <strong>the</strong> plant engineer evaluation.METHODS: THE COMPRESSSED AIRMARKET ASSESSMENTObjectivesThe objectives <strong>of</strong> <strong>the</strong> customer assessment were to characterize andquantify customer awareness and use <strong>of</strong> compressed air efficiency servicesin key end-use sectors. This portion <strong>of</strong> <strong>the</strong> study also characterized <strong>the</strong>purchase and maintenance practices <strong>for</strong> compressed air systems.The key research questions addressed were as follows:• To what extent are customers in key end use sectors aware <strong>of</strong>compressed air usage, costs, and savings opportunities?• To what extent are <strong>the</strong>se customers aware <strong>of</strong> <strong>the</strong> costs and benefits<strong>of</strong> compressed air efficiency measures?• What practices do <strong>the</strong>se customers follow to monitor, maintain, andenhance <strong>the</strong> efficiency <strong>of</strong> compressed air systems?• What barriers do customers experience in implementing compressedair system efficiency measures?• What, if any, services do <strong>the</strong>se customers purchase to maintain orenhance <strong>the</strong> efficiency <strong>of</strong> compressed air systems?• What barriers do customers experience in purchasing such services?• To what extent are <strong>the</strong>se customers receptive to various potentialservices to increase compressed air system efficiency?Research ActivitiesThe Interviews. The names <strong>of</strong> <strong>the</strong> customers interviewed <strong>for</strong> this studywere extracted from <strong>the</strong> list <strong>of</strong> subscribers to Plant Engineer magazine.This publication focuses on <strong>the</strong> management <strong>of</strong> industrial equipment.The subscription list does not represent a random listing <strong>of</strong> individuals<strong>for</strong> compressed air system management since subscribers are likely tohave a high interest in operational efficiency issues. However, in previousstudies, XENERGY, Inc., had encountered very high levels <strong>of</strong> nonresponseon listings that did not contain contact names. There<strong>for</strong>e, weelected to use <strong>the</strong> subscriber list because we believed that <strong>the</strong> biasimparted to <strong>the</strong> results would be no worse than <strong>the</strong> non-response biasencountered using random lists that did not contain contact names. Also,given <strong>the</strong> technical content <strong>of</strong> <strong>the</strong> assessment, we believed that datacollection ef<strong>for</strong>ts would be more productive if we focused on individualsU.S. DEPARTMENT OF ENERGY13
<strong>Compressed</strong> <strong>Air</strong> <strong>Market</strong> <strong>Assessment</strong>who had indicated some interest in <strong>the</strong> topics covered.This strategy did have <strong>the</strong> intended effect <strong>of</strong> increasing response rates.The overall response rate <strong>for</strong> this assessment was in <strong>the</strong> 40-50% range.In comparison, <strong>for</strong> a study we recently conducted with end users <strong>of</strong> industrialmotor systems in <strong>the</strong> Nor<strong>the</strong>astern U.S., where <strong>the</strong> sample containedfew contact names, <strong>the</strong> response rate was in <strong>the</strong> 10-20% range.The Plant Engineer subscription list was narrowed down to establishmentsin 11 2-digit SIC codes, as shown in Table 2-1. These 11 SIC codes representindustries that are ei<strong>the</strong>r ranked in <strong>the</strong> top nine industries in motorenergy usage <strong>of</strong> compressed air systems or have at least 20% <strong>of</strong> <strong>the</strong>irmotor energy usage accounted <strong>for</strong> by compressed air systems (SeeTable 2-1). Twenty interviews were initially allocated to each SIC group<strong>for</strong> a target <strong>of</strong> 220 total assessments. An additional 2 were completedwith SIC 29 customers <strong>for</strong> a total <strong>of</strong> 222 completed assessments.ImplementationXENERGY employees designed <strong>the</strong> evaluation with <strong>the</strong> assistance <strong>of</strong><strong>the</strong> <strong>Compressed</strong> <strong>Air</strong> Challenge ® . It was <strong>the</strong>n programmed into a CATIsystem and administered by Atlantic <strong>Market</strong>ing Research <strong>of</strong> Boston,Massachusetts. The questionnaire was pretested and XENERGY staffcontinually oversaw <strong>the</strong> interviewing process. The interviews werefielded in July and August, 1999.FINDINGSCharacteristics <strong>of</strong> CustomersTable 2-2 presents <strong>the</strong> distribution <strong>of</strong> <strong>the</strong> 222 establishments interviewedby a measure <strong>of</strong> size, <strong>the</strong> number <strong>of</strong> employees. The majority <strong>of</strong> <strong>the</strong> interviewedestablishments (71%) fell into <strong>the</strong> medium range <strong>of</strong> 100 to 500employees. By contrast, 83% <strong>of</strong> manufacturing establishments employfewer than 100 persons. This result reflects <strong>the</strong> selection <strong>of</strong> <strong>the</strong> PlantEngineer subscription list as a starting point. We cannot determine <strong>the</strong>extent to which <strong>the</strong> list reflects <strong>the</strong> population <strong>of</strong> all manufacturingestablishments with compressed air systems. However, <strong>the</strong> objective <strong>of</strong><strong>the</strong> approach was to identify customers with significant compressed airsystems who could respond knowledgeably to fairly technical questionsconcerning system management. We believe this objective was achieved.Characteristics <strong>of</strong> <strong>Compressed</strong> <strong>Air</strong> SystemsNumber <strong>of</strong> Compressors. Table 2-3 shows <strong>the</strong> distribution <strong>of</strong> customersby number <strong>of</strong> air compressors in <strong>the</strong>ir facility <strong>for</strong> both this study and <strong>the</strong>PG&E customer survey. Both studies found that almost all customers had2 or more compressors in <strong>the</strong> facility. Findings from <strong>the</strong> New Englandstudy suggest that, in most cases, at least one <strong>of</strong> <strong>the</strong> compressors wasused <strong>for</strong> back-up capacity. On <strong>the</strong> whole, it appears that those interviewed<strong>for</strong> this assessment had larger compressed air systems: 68%had 3 or more compressors versus 45% in <strong>the</strong> Cali<strong>for</strong>nia sample. 114U.S. DEPARTMENT OF ENERGY1 Personal communications with PG&E staff suggest that <strong>the</strong>ir industrial customers fall into <strong>the</strong> small/medium categories.
THE DEMAND SIDE OF THE MARKETTABLE 2-1: Distribution <strong>of</strong> Interviewed Customers by SICSIC Industry Group # <strong>Assessment</strong>s20 Food and Kindred Products 2022 Textile Mill Products 2023 Apparel and O<strong>the</strong>r Textile Products 2026 Paper and Allied Products 2028 Chemicals and Allied Products 2029 Petroleum and Coal Products 2230 Rubber and Miscellaneous Plastics Products 2032 Stone, Clay, and Glass Products 2033 Primary Metal Industries 2034 Fabricated Metal Products 2036 Electronic and O<strong>the</strong>r Electric Equipment 20Total 222TABLE 2-2: Distribution by SIC and Number <strong>of</strong> EmployeesSICNUMBER OF EMPLOYEES1000 Unknown Total20 Food and Kindred 3 8 4 5 0 2022 Textile Mill Products 2 13 5 0 0 2023 Apparel and O<strong>the</strong>r Textile 0 19 1 0 0 2026 Paper and Allied 2 12 3 2 1 2028 Chemicals and Allied 2 16 1 1 0 2029 Petroleum and Coal 4 13 2 2 1 2230 Rubber and Miscellaneous Plastics 0 17 1 2 0 2032 Stone, Clay, and Glass 0 16 1 3 0 2033 Primary Metal 2 14 2 2 0 2034 Fabricated Metal 3 14 2 1 0 2036 Electronic and O<strong>the</strong>r Electric Equipment 0 16 1 2 1 20Total 18 158 23 20 3 222Percent <strong>of</strong> Distribution 8% 71% 10% 9% 1% 100%Percent <strong>of</strong> Population* 83% 8% 1% 0% 8% 100%* Source: Annual Survey <strong>of</strong> Manufactures: 1997.U.S. DEPARTMENT OF ENERGY15
<strong>Compressed</strong> <strong>Air</strong> <strong>Market</strong> <strong>Assessment</strong>TABLE 2-3: Number <strong>of</strong> Compressors in Customer FacilitiesNumber <strong>of</strong> CA <strong>Market</strong> <strong>Assessment</strong> PG&E SurveyCompressors (n = 218) (n= 268)1 7% 18%2 25% 37%3 21% 20%4 19% 12%5 9% 5%6+ 19% 8%TABLE 2-4: Distribution by SIC and Total Horsepower <strong>of</strong> CompressorsSICTOTAL HORSEPOWER OF AIR COMPRESSORS100 100 to 499 500 to 999 1000 Unknown Total20 Food and Kindred Products 5 10 4 1 0 2022 Textile Mill Products 1 11 2 3 3 2023 Apparel and O<strong>the</strong>r Textile Products 12 6 0 0 2 2026 Paper and Allied Products 1 10 1 6 2 2028 Chemicals and Allied Products 3 4 2 3 8 2029 Petroleum and Coal Products 2 7 1 4 8 2230 Rubber and Miscellaneous Plastics 1 13 3 2 1 2032 Stone, Clay, and Glass Products 1 8 2 5 4 2033 Primary Metal Industries 2 11 3 3 1 2034 Fabricated Metal Products 3 11 3 0 3 2036 Electronic and O<strong>the</strong>r Electric Equipment 4 11 2 1 2 20Total 35 102 23 28 34 222TABLE 2-5: Hours <strong>of</strong> <strong>Compressed</strong> <strong>Air</strong> System OperationsHours <strong>of</strong> CA <strong>Market</strong> <strong>Assessment</strong> PG&E SurveyOperation/Week (n = 218) (n= 268)40 hours or less 12% 19%41 - 80 hours 25% 36%81 -120 hours 21% 22%121 - 167 hours 18% 6%168 hours/week 24% 17%(7 days x 24 hours per day)16U.S. DEPARTMENT OF ENERGY
THE DEMAND SIDE OF THE MARKETThis finding is consistent with <strong>the</strong> distribution <strong>of</strong> <strong>the</strong> national list by number<strong>of</strong> employees. The relatively large size <strong>of</strong> <strong>the</strong> companies should bekept in mind when interpreting o<strong>the</strong>r evaluation results.Total <strong>Compressed</strong> <strong>Air</strong> System Horsepower. Table 2-4 displays <strong>the</strong> distributionby SIC and ano<strong>the</strong>r measure <strong>of</strong> size, self-reported compressorhorsepower. Again, most interviewed establishments fall into <strong>the</strong> mediumrange here as well.Hours <strong>of</strong> System Operation. The findings from both this study and <strong>the</strong>PG&E survey indicate that compressed air systems generally have veryheavy hours <strong>of</strong> operation. Table 2-5 shows self-reported hours <strong>of</strong> operationfrom customers to <strong>the</strong> <strong>Compressed</strong> <strong>Air</strong> <strong>Market</strong> <strong>Assessment</strong> and <strong>the</strong> PG&Esurvey. Sixty-three percent <strong>of</strong> <strong>the</strong> customers to this assessment reportedthat <strong>the</strong>y run <strong>the</strong>ir compressed air systems more than 80 hours per week,as did 45% <strong>of</strong> <strong>the</strong> respondents to <strong>the</strong> PG&E survey. Nearly a quarter <strong>of</strong> thoseinterviewed during this assessment reported that <strong>the</strong>ir compressed airsystems run continually, as did 17% <strong>of</strong> <strong>the</strong> PG&E respondents. This highlevel <strong>of</strong> use suggests <strong>the</strong> importance <strong>of</strong> <strong>the</strong> compressed air systems insupporting overall manufacturing operations, as well as <strong>the</strong> importance <strong>of</strong>high-quality system management and maintenance in realizing energysavings.Incidence <strong>of</strong> <strong>Compressed</strong> <strong>Air</strong> Systems. In an ef<strong>for</strong>t to learn more about<strong>the</strong> presence or absence <strong>of</strong> compressed air systems in different industries,<strong>the</strong> assessment research firm recorded <strong>the</strong> number <strong>of</strong> establishmentsthat were screened out because <strong>the</strong>y did not use compressed air systemsin <strong>the</strong>ir facilities. This screening question was posed to <strong>the</strong> contact from<strong>the</strong> subscription list or, if that person no longer worked at <strong>the</strong> facility, <strong>the</strong>plant manager, plant engineer, or maintenance manager. We are <strong>the</strong>re<strong>for</strong>econfident that <strong>the</strong> customer could accurately answer whe<strong>the</strong>r <strong>the</strong>facility had a compressed air system. Table 2-6 displays <strong>the</strong> results <strong>of</strong>this screening. Given <strong>the</strong> small size in each industry, <strong>the</strong> results cannotbe extrapolated to <strong>the</strong> population. However, <strong>the</strong> results closely resemblethose <strong>of</strong> <strong>the</strong> Motor <strong>Market</strong> <strong>Assessment</strong>, which found that 18% <strong>of</strong> allmanufacturing plants have no compressed air systems.Sixty-three percent<strong>of</strong> <strong>the</strong> customers tothis assessmentreported that <strong>the</strong>yrun <strong>the</strong>ir compressedair systems more than80 hours per week....<strong>Compressed</strong> <strong>Air</strong> System ManagementPosition <strong>of</strong> Person with Responsibility <strong>for</strong> <strong>Compressed</strong> <strong>Air</strong> SystemManagement. Maintenance Managers are responsible <strong>for</strong> <strong>the</strong> management<strong>of</strong> compressed air systems in nearly two-thirds <strong>of</strong> <strong>the</strong> establishmentsassessed (See Table 2-7). Plant engineers and plant managers are responsiblein most <strong>of</strong> <strong>the</strong> remaining establishments. This suggests that compressedair system management is considered more as a maintenance functionand is not generally tied to decision-making on capital improvements.Objectives <strong>of</strong> <strong>Compressed</strong> <strong>Air</strong> System Management. Table 2-8shows customers’ responses to open-ended questions regarding <strong>the</strong>irobjectives in managing compressed air systems. Control <strong>of</strong> energycosts ranks very low among <strong>the</strong> objectives <strong>for</strong> managing compressed airsystems. Without prompting, just 9% <strong>of</strong> customers mentioned energyefficiency as <strong>the</strong>ir primary system management objective; only 22%mentioned efficiency at all as a system management objective.U.S. DEPARTMENT OF ENERGY17
TABLE 2-6: Customers Screened Out by SIC<strong>Compressed</strong> <strong>Air</strong> <strong>Market</strong> <strong>Assessment</strong>SIC/Industry Group Number % Screened Out perScreened OutContact Reached20 Food and Kindred Products 3 13%22 Textile Mill Products 3 13%23 Apparel and O<strong>the</strong>r Textile Products 6 23%26 Paper and Allied Products 6 23%28 Chemicals and Allied Products 2 9%29 Petroleum and Coal Products 7 24%30 Rubber and Miscellaneous Plastics Products 3 13%32 Stone, Clay, and Glass Products 3 13%33 Primary Metal Industries 1 5%34 Fabricated Metal Products 3 13%36 Electronic and O<strong>the</strong>r Electric Equipment 3 13%Total 40 15%Maintaining continuous operation and ensuring an adequate supply <strong>of</strong>air were <strong>the</strong> objectives mentioned most frequently by customers (71%<strong>of</strong> first mentions). This finding indicates <strong>the</strong> importance <strong>of</strong> system reliabilityas a customer value in promoting system efficiency services.Incidence <strong>of</strong> <strong>Compressed</strong> <strong>Air</strong> System Problems. Despite <strong>the</strong> orientation<strong>of</strong> compressed air system management activities towards <strong>the</strong> maintenance<strong>of</strong> continuous operation, most companies reported incidents<strong>of</strong> unscheduled downtime. Thirty-five percent <strong>of</strong> customers reportedthat <strong>the</strong>ir systems had experienced unscheduled downtime during <strong>the</strong>previous 12 months. For 60% <strong>of</strong> <strong>the</strong>se establishments, or 21% <strong>of</strong> allestablishments, <strong>the</strong> system was down <strong>for</strong> 2 or more workdays.Two-thirds <strong>of</strong> customers reported experiencing potentially serious problemsin compressed air system operations during <strong>the</strong> past year. Themost <strong>of</strong>ten cited problems were excess moisture in <strong>the</strong> compressed airand inadequate pressure, both within <strong>the</strong> system as a whole and atspecific points (See Table 2-9).Customer Knowledge <strong>of</strong> <strong>Compressed</strong> <strong>Air</strong> SystemEnergy Use and <strong>Efficiency</strong> Opportunities18U.S. DEPARTMENT OF ENERGYThe survey conducted <strong>for</strong> this report did not probe customers’ knowledgeabout specific operating attributes <strong>of</strong> <strong>the</strong>ir compressed air systems.However, <strong>the</strong> survey conducted <strong>for</strong> PG&E did cover this topic. Thatstudy found that operators’ knowledge <strong>of</strong> fundamental aspects <strong>of</strong> compressedair system operations was very low. For example:• Over one-half <strong>of</strong> survey respondents did not know <strong>the</strong> dischargecapacity <strong>of</strong> <strong>the</strong>ir compressor(s). Additionally, over 40% <strong>of</strong> respondents
THE DEMAND SIDE OF THE MARKETTABLE 2-7: Position <strong>of</strong> Person with Responsibility <strong>for</strong> CA System ManagementPositionPercentMaintenance Manager 63%Plant Engineer 18%O<strong>the</strong>r 6%Contractor 4%Plant Manager 4%<strong>Compressed</strong> <strong>Air</strong> Specialist 1%General Manager 1%Manufacturing Manager 1%Mechanic 1%Supervisor/ Team Leader 1%Don't Know 1%Number <strong>of</strong> customers 222TABLE 2-8: Objectives <strong>of</strong> CA System ManagementSystem Management Objective Percent Mentioning Percent Mentioningas Primary Objectiveas ObjectiveMaintain continuous operation 41% 57%Ensure adequate supply <strong>of</strong> air 30% 50%Maintain quality <strong>of</strong> air 12% 37%Preventive maintenance 7% 19%Control or reduce energy use 9% 22%O<strong>the</strong>r 0% 1%Don't know 1% 2%Number <strong>of</strong> customers 222 222U.S. DEPARTMENT OF ENERGY19
<strong>Compressed</strong> <strong>Air</strong> <strong>Market</strong> <strong>Assessment</strong>TABLE 2-9: Reported Problems in <strong>Compressed</strong> <strong>Air</strong> SystemsProblemsPercentExcess moisture in compressed air 50%No problems reported 33%Inadequate pressure in whole system 27%Inadequate pressure at points in <strong>the</strong> system 26%Excess oil in compressed air 12%Frequent fouling <strong>of</strong> air filters 11%Don't know 1%Number <strong>of</strong> responses 222TABLE 2-10: Regularly Scheduled Maintenance ActivitiesMaintenance ActivityPercentCheck lubricant level and filter 71%Clean or replace inlet air filter cartridges 58%Clean air line filters 38%Verify operating temperature per manufacturer specification 22%Clean drain traps 21%Check cooling water quality, replace cooling system 19%Check belts <strong>for</strong> wear and replace 14%Check <strong>for</strong> system leaks 13%Number <strong>of</strong> customers 222TABLE 2-11: Number <strong>of</strong> Maintenance Procedures by Compressor SizeNUMBER OF MAINTENANCEHORSEPOWER OF AIR COMPRESSORSPROCEDURES Up to 100 HP 100 - 500 HP >500 HP All0 9% 9% 10% 9%1 - 2 43% 49% 44% 46%3 - 8 49% 43% 46% 45%Number <strong>of</strong> customers 35 101 52 18820U.S. DEPARTMENT OF ENERGY
THE DEMAND SIDE OF THE MARKETdid not have a clear understanding <strong>of</strong> <strong>the</strong> relationship between compressordischarge pressure and <strong>the</strong> largest pressure requirement <strong>for</strong>a single piece <strong>of</strong> equipment.• There were large gaps between individual respondents’ reportedcompressor discharge pressure and <strong>the</strong> largest pressure requirement<strong>for</strong> a single piece <strong>of</strong> equipment.• Based on “rule <strong>of</strong> thumb” calculations, nearly 60% <strong>of</strong> respondentsshould have between 501 and 2000 gallons <strong>of</strong> air storage. There isa significant difference in <strong>the</strong> recommended amount <strong>of</strong> air storagecompared to <strong>the</strong> actual amount installed. Only 19% <strong>of</strong> respondentshave between 501 and 2000 gallons <strong>of</strong> air storage.• Only 10% <strong>of</strong> respondents reported that <strong>the</strong>y kept track <strong>of</strong> <strong>the</strong>energy cost <strong>of</strong> <strong>the</strong>ir compressed air systems.Interviews with 4 consultants with national experience in providingcompressed air system audits and efficiency services confirmed thatcurrent levels <strong>of</strong> system knowledge among plant engineers and systemoperating personnel is low. However, 3 <strong>of</strong> <strong>the</strong>se consultants report thatawareness <strong>of</strong> <strong>the</strong> benefits <strong>of</strong> increased efficiency among plant engineersis increasing. This perception is consistent with findings from <strong>the</strong> PG&Estudy that over two-thirds <strong>of</strong> compressed air system mangers believethat <strong>the</strong>y can substantially reduce <strong>the</strong> costs <strong>of</strong> operating <strong>the</strong> system.Consultants attribute <strong>the</strong> increase in awareness <strong>of</strong> efficiency opportunitiesto a number <strong>of</strong> factors, including <strong>the</strong> ef<strong>for</strong>ts <strong>of</strong> <strong>the</strong> <strong>Compressed</strong> <strong>Air</strong>Challenge ® , increased coverage <strong>of</strong> compressed air efficiency issuesin trade and industry publications, and utility programs. One consultantnoted that his customers tend to be aware <strong>of</strong> efficiency opportunitiesavailable from upgrades to compressed air system components—dryers,air storage, controls, as well as <strong>the</strong> compressors <strong>the</strong>mselves. However,awareness <strong>of</strong> measures to reduce air demand is still virtually non-existent.By way <strong>of</strong> contrast, 44% <strong>of</strong> <strong>the</strong> customers interviewed <strong>for</strong> this studyreported that <strong>the</strong>y periodically assess whe<strong>the</strong>r <strong>the</strong>ir end uses <strong>of</strong>compressed air are appropriate.There is no correlationbetween size and<strong>the</strong> number <strong>of</strong>maintenance activitiesimplemented.Current System Managementand Maintenance PracticesMaintenance Practices. The assessment asked customers to name <strong>the</strong>maintenance activities <strong>the</strong>y per<strong>for</strong>m on a regular basis. Ninety percent <strong>of</strong><strong>the</strong>m reported undertaking at least one <strong>of</strong> <strong>the</strong> common maintenanceactivities identified in Table 2-10. Checking lubricants was mentioned byalmost three-quarters <strong>of</strong> all customers with over half citing air filtermaintenance. In-house staff per<strong>for</strong>ms <strong>the</strong>se maintenance activities <strong>for</strong>over 75% <strong>of</strong> <strong>the</strong> customers with vendors and consultants doing so <strong>for</strong><strong>the</strong> rest.Generally, we would have expected that facilities with large compressedair systems would expend greater resources on <strong>the</strong>ir maintenance.However, we found that <strong>the</strong>re was no correlation between size, asmeasured by <strong>the</strong> compressed air system horsepower, and <strong>the</strong> number<strong>of</strong> maintenance activities implemented (See Table 2-11). The NewEngland study found that <strong>the</strong>re was no relationship between system orfacility size and staff hours spent on system maintenance.U.S. DEPARTMENT OF ENERGY21
<strong>Compressed</strong> <strong>Air</strong> <strong>Market</strong> <strong>Assessment</strong>One <strong>of</strong> <strong>the</strong> consultants interviewed expressed <strong>the</strong> opinion that <strong>the</strong> level <strong>of</strong>system maintenance ef<strong>for</strong>ts was declining due to trends in outsourcingand assignment <strong>of</strong> maintenance personnel to production positionsoccasioned by historically high levels <strong>of</strong> production.The percentage <strong>of</strong>customers whohave made capitalimprovements to<strong>the</strong>ir compressed airsystems to reduceenergy consumptionis very low.Leak Prevention Programs. Identification and repair <strong>of</strong> leaks in <strong>the</strong> airdistribution system and end-use tools can <strong>of</strong>ten reduce system energyuse by 10 to 15%. The value <strong>of</strong> leak prevention seems intuitively obvious,given <strong>the</strong> exposed nature <strong>of</strong> air lines and <strong>the</strong> audible hiss <strong>of</strong> leaks.However, only 35% <strong>of</strong> those interviewed during this assessment regularlyconducted leak prevention programs in <strong>the</strong>ir facilities. There wasno consistent pattern <strong>of</strong> association between <strong>the</strong> implementation<strong>of</strong> leak prevention programs and ei<strong>the</strong>r SIC or size <strong>of</strong> <strong>the</strong> establishment.The primary activities included in <strong>the</strong>se leak prevention routinesare checking <strong>for</strong> leaks near compressors/dryers and repairing leaks(See Table 2-12). For almost 90% <strong>of</strong> <strong>the</strong> customers with leak preventionprograms, in-house staff per<strong>for</strong>ms <strong>the</strong>se routines.System Monitoring and Management. The assessment contained anumber <strong>of</strong> questions concerning customers’ ef<strong>for</strong>ts to monitor compressedair system per<strong>for</strong>mance. They were asked if <strong>the</strong>y had made avariety <strong>of</strong> operating measurements over <strong>the</strong> past 2 years. Table 2-13displays <strong>the</strong> different quantities that were measured by those interviewed.One-quarter <strong>of</strong> <strong>the</strong>m had made no measurements at all. Measuringpressure levels was cited most <strong>of</strong>ten, by almost two-thirds <strong>of</strong> <strong>the</strong> customers.Forty percent <strong>of</strong> <strong>the</strong>m mentioned making operating measurementsrelated to energy use: demand on compressor motors, energyuse by compressor motors, leak loads, and load pr<strong>of</strong>iles (defined asperiodic demand measurements over <strong>the</strong> course <strong>of</strong> one or more days).The high proportion <strong>of</strong> customers who report measuring pressure levelsis consistent with <strong>the</strong> high proportion <strong>of</strong> customers who are concernedwith reliability <strong>of</strong> air supply.In-house staff carried out <strong>the</strong> above measurements <strong>for</strong> almost threequarters<strong>of</strong> <strong>the</strong> establishments that per<strong>for</strong>med such measures.TABLE 2-12: Leak Prevention ActivitiesLeak Prevention ActivityPercent Included in LeakPrevention ProgramsCheck <strong>for</strong> leaks around compressors and air dryers 77%Repair leaks 67%Check joints <strong>for</strong> leaks 49%Check regulators and tools <strong>for</strong> leaks 45%Tag leaks 41%Check <strong>for</strong> open bleed valves 39%Check bypass valves 37%Number <strong>of</strong> customers 7522U.S. DEPARTMENT OF ENERGY
THE DEMAND SIDE OF THE MARKETCapital Improvements to Increase <strong>Compressed</strong> <strong>Air</strong> System <strong>Efficiency</strong>.All <strong>of</strong> <strong>the</strong> studies consulted <strong>for</strong> this report found that <strong>the</strong> percentage <strong>of</strong>customers who have made capital improvements to <strong>the</strong>ir compressedair systems to reduce energy consumption is very low. The <strong>Market</strong><strong>Assessment</strong> User Practices Survey, conducted in 1997 <strong>for</strong> <strong>the</strong> Motor<strong>Market</strong> <strong>Assessment</strong>, found that 57% <strong>of</strong> all customers with compressedair systems had made no efficiency-related capital improvements to<strong>the</strong>ir system— including leak repair—in <strong>the</strong> 2 years prior to <strong>the</strong> survey.TABLE 2-13: Quantities MeasuredOperating Parameters MeasuredPercentPressure levels 65%Demand on <strong>the</strong> compressor motors (KW) 39%Weekly or monthly compressor motor electric use 21%Leak loads 19%Load Pr<strong>of</strong>iles 16%None <strong>of</strong> <strong>the</strong> above 25%Number <strong>of</strong> customers 222TABLE 2-14: Reported Improvements in Two Years Prior to <strong>the</strong> 1998 Motor <strong>Market</strong> <strong>Assessment</strong>EFFICIENCY MEASURESIZE CATEGORY*Large Large/Med Medium Small/Med Small TotalReplace 1-stage rotary screw unitswith more efficient models 7% 16% 29% 2% 4% 7%Use parallel compressorsto respond to variations in load 23% 12% 10% 13% 8% 9%Reconfigure piping and filtersto reduce pressure drops 14% 25% 5% 13% 1% 5%Add multi-unit controlsto reduce part load consumption 23% 10% 6% 0% 4% 4%Reduce size <strong>of</strong> compressorsto better match load 10% 6% 1% 2% 1% 1%Fix leaks 42% 41% 34% 36% 17% 22%No improvements 39% 45% 37% 63% 58% 57%* Size categories are based on percentile breaks in <strong>the</strong> distribution <strong>of</strong> establishments by size within each SIC. Thus <strong>the</strong>re is no setnumber <strong>of</strong> employees <strong>for</strong> each category.U.S. DEPARTMENT OF ENERGY23
<strong>Compressed</strong> <strong>Air</strong> <strong>Market</strong> <strong>Assessment</strong>The PG&E study found that 63% <strong>of</strong> its customers had made no attemptsto upgrade <strong>the</strong>ir system’s efficiency in <strong>the</strong> 3 years prior to <strong>the</strong> study.Table 2-14 provides details <strong>of</strong> <strong>the</strong> findings from <strong>the</strong> 1998 Motor <strong>Market</strong><strong>Assessment</strong>. Leak repair accounts <strong>for</strong> most <strong>of</strong> <strong>the</strong> measures implemented.Larger facilities were more likely than average to implement <strong>the</strong>semeasures. However, this pattern was not entirely consistent across sizeor measure categories.Purchase <strong>of</strong> System Maintenance <strong>Services</strong>Service Contracts. Overall, 30% <strong>of</strong> customers to <strong>the</strong> Compresssed <strong>Air</strong><strong>Market</strong> <strong>Assessment</strong> reported that <strong>the</strong>y had service contracts <strong>for</strong> <strong>the</strong>ircompressed air systems. The proportion <strong>of</strong> establishments with servicecontracts <strong>for</strong> CA systems did not vary substantially by industry nor bysize <strong>of</strong> establishment. Among establishments with service contracts,83% purchased those services from compressed air equipment vendors.The remaining 17% were serviced by consultants and contractorso<strong>the</strong>r than <strong>the</strong> company’s principal compressed air equipment vendor.Only one-third <strong>of</strong>customers with servicecontracts reportedthat <strong>the</strong>y receivedefficiency-orientedservices.The study’s questionnaire asked customers to name <strong>the</strong> specific servicesprovided under <strong>the</strong>ir service contracts. Table 2-15 shows <strong>the</strong> results <strong>of</strong>this set <strong>of</strong> questions. The results indicate that most compressed air systemservice contracts are oriented primarily towards preventive maintenance<strong>of</strong> <strong>the</strong> compressors and auxiliaries. Only one-third <strong>of</strong> customers withservice contracts (10% <strong>of</strong> <strong>the</strong> total list) reported that <strong>the</strong>y receivedefficiency-oriented services such as leak detection, leak repair, assessment<strong>of</strong> control strategies, energy use monitoring, and load pr<strong>of</strong>iling.Effectiveness <strong>of</strong> Service Contracts. Given <strong>the</strong> emphasis <strong>of</strong> servicecontracts on preventative maintenance, one potential index <strong>of</strong> <strong>the</strong>ireffectiveness would be <strong>the</strong> incidence <strong>of</strong> compressed air system breakdownsand operating problems. We examined <strong>the</strong> association between<strong>the</strong> use <strong>of</strong> service contracts and reported system problems. The proportion<strong>of</strong> customers reporting unscheduled system downtime was virtually<strong>the</strong> same <strong>for</strong> those with and without service contracts: 38%. Table 2-16displays <strong>the</strong> percent <strong>of</strong> customers in both groups who experiencedvarious system operating problems. While <strong>the</strong>re are small differencesbetween <strong>the</strong> 2 groups in <strong>the</strong> portion <strong>of</strong> customers who experiencedcompressed air system operating problems, <strong>the</strong>se differences are notstatistically significant. 2Awareness and Use <strong>of</strong> <strong>Compressed</strong> <strong>Air</strong>System <strong>Efficiency</strong> <strong>Services</strong>Interest in <strong>Efficiency</strong> <strong>Services</strong>. Part <strong>of</strong> this assessment was designedto capture in<strong>for</strong>mation from customers on <strong>the</strong> extent to which vendorsare marketing <strong>the</strong>ir efficiency services and <strong>the</strong> content <strong>of</strong> those <strong>of</strong>fers.Thirty-four percent <strong>of</strong> those interviewed reported that <strong>the</strong>y had beenapproached by vendors selling “services specifically designed to reduceenergy costs in your compressed air systems.” Fifty-eight percent <strong>of</strong> <strong>the</strong>customers who were <strong>of</strong>fered efficiency services were approached bycompressed air equipment vendors. Ano<strong>the</strong>r 39% were approached by24U.S. DEPARTMENT OF ENERGY2 Applied <strong>the</strong> Chi-square test.
THE DEMAND SIDE OF THE MARKETconsultants and 15% by OEM vendors. Only 3% <strong>of</strong> all customersreported purchasing such services.Table 2-17 lists <strong>the</strong> activities included in <strong>the</strong> <strong>of</strong>fers <strong>for</strong> energy efficiencyservices. Among <strong>the</strong> 50 customers who could recall <strong>the</strong> services <strong>of</strong>fered,<strong>the</strong> most <strong>of</strong>ten mentioned services were preventative maintenance oncompressors and assessment <strong>of</strong> control strategies and equipment.While assessment <strong>of</strong> control strategies is clearly an efficiency-orientedservice, preventative maintenance <strong>of</strong> compressors has been a staple <strong>of</strong>conventional service contracts. It is also interesting to note that not oneservice was mentioned as being <strong>of</strong>fered by more than one-half <strong>of</strong> <strong>the</strong>customers. This finding suggests that vendors are trying to work out <strong>the</strong>content <strong>of</strong> efficiency services, and that individual companies are eachcoming up with <strong>the</strong>ir own concepts <strong>of</strong> what <strong>the</strong>se services should include.TABLE 2-15: <strong>Services</strong> Provided under CA System Service Contract(Percent <strong>of</strong> those with Contracts)<strong>Services</strong>Percent MentioningPreventive maintenance on compressors 67%Preventive maintenance on auxiliaries 44%Emergency repair 33%Leak repair 20%<strong>Assessment</strong> <strong>of</strong> control strategies and equipment 14%Leak detection 13%Load pr<strong>of</strong>iling 5%Energy use monitoring 3%Number <strong>of</strong> customers 64TABLE 2-16: Number <strong>of</strong> Operating Problems by Service Contract GroupNumber <strong>of</strong> Operating Have Service No ServiceProblems Reported Contract Contract0 47% 35%1 19% 29%2 22% 13%3 5% 14%4 3% 6%5 5% 3%Number <strong>of</strong> customers 64 150U.S. DEPARTMENT OF ENERGY25
<strong>Compressed</strong> <strong>Air</strong> <strong>Market</strong> <strong>Assessment</strong>TABLE 2-17: Activities Included in <strong>Efficiency</strong> Service Offers<strong>Compressed</strong> <strong>Air</strong> <strong>Efficiency</strong> <strong>Services</strong> OfferedPercent <strong>of</strong> CustomersReceiving Service OffersPreventive maintenance on compressors 46%<strong>Assessment</strong> <strong>of</strong> control strategies and equipment 46%Identification <strong>of</strong> energy-saving measures 42%Leak detection 38%Energy use monitoring/load pr<strong>of</strong>iling 36%Preventive maintenance on auxiliaries 36%<strong>Assessment</strong> <strong>of</strong> compressed air end-uses 30%Financial analysis <strong>of</strong> energy-saving measures 28%Leak repair 24%Installation <strong>of</strong> energy-saving measures 22%Number <strong>of</strong> customers 50TABLE 2-18: Main Reason <strong>for</strong> Not Purchasing <strong>Efficiency</strong> <strong>Services</strong>ReasonPercentToo costly 28%Can do it ourselves 23%No budget 13%Skeptical <strong>of</strong> estimated energy savings 10%Don't know 10%Still considering 8%Not approved by management 7%Number <strong>of</strong> customers 60TABLE 2-19: Sources <strong>of</strong> <strong>Compressed</strong> <strong>Air</strong> System <strong>Efficiency</strong> Study <strong>Services</strong>Source <strong>of</strong> <strong>Efficiency</strong> Study <strong>Services</strong>Percent <strong>of</strong> Those whoHad System AuditA compressed air system consultant 43%Your compressed air equipment vendor 24%Your own staff 13%Some combination <strong>of</strong> <strong>the</strong> above 11%Number <strong>of</strong> customers 3826U.S. DEPARTMENT OF ENERGY
THE DEMAND SIDE OF THE MARKETOf those interviewed who purchased energy efficiency services, almostone-half did so because <strong>the</strong>y believed <strong>the</strong>y would save a substantialamount <strong>of</strong> energy. O<strong>the</strong>r reasons cited include improved production control,improved production efficiency, <strong>the</strong> reputation <strong>of</strong> <strong>the</strong> vendor, and a lack <strong>of</strong>staff time. Among <strong>the</strong> reasons <strong>for</strong> not purchasing efficiency services, <strong>the</strong>most frequently mentioned were that it was too costly or because it couldbe per<strong>for</strong>med by in-house staff (See Table 2-18).Of those customers who were not approached to purchase energyefficiency services, 58% reported that <strong>the</strong>y would be interested insuch services. Among customers who were not interested in <strong>the</strong>seservices, <strong>the</strong> most common reason <strong>for</strong> <strong>the</strong>ir lack <strong>of</strong> interest was <strong>the</strong>irability to per<strong>for</strong>m <strong>the</strong> services in-house (32%) or <strong>the</strong> small size <strong>of</strong> <strong>the</strong>irsystems (39%).Training. Slightly over one-quarter <strong>of</strong> all customers reported that someonein <strong>the</strong>ir staff had been trained in compressed air system efficiency.In roughly half <strong>of</strong> <strong>the</strong>se instances, <strong>the</strong>ir compressed air equipment vendorhad sponsored <strong>the</strong> training. Only 6% <strong>of</strong> all customers were aware <strong>of</strong> <strong>the</strong><strong>Compressed</strong> <strong>Air</strong> Challenge ® program. The key finding from this series<strong>of</strong> questions reveals that operators <strong>of</strong> 75% <strong>of</strong> <strong>the</strong> systems had had n<strong>of</strong>ormal training.<strong>Compressed</strong> <strong>Air</strong> System <strong>Efficiency</strong> Studies. Almost 20% <strong>of</strong> allcustomers reported undertaking energy-efficiency studies <strong>of</strong> <strong>the</strong>ircompressed air systems over <strong>the</strong> past 7 years. 3 For those establishmentsthat did undertake efficiency studies, most used a specializedcompressed air system consultant (37%) or an equipment vendor(24%) to per<strong>for</strong>m <strong>the</strong> study (See Table 2-19).There is no uni<strong>for</strong>m set <strong>of</strong> procedures or protocols <strong>for</strong> conducting compressedair system efficiency study. There are a number <strong>of</strong> computerizedstudy programs currently available which call <strong>for</strong> extensive measurements<strong>of</strong> compressor power and operating parameters under various loadconditions. O<strong>the</strong>r protocols are somewhat less rigorous. Many consultantshave developed <strong>the</strong>ir own procedures that <strong>the</strong>y modify to meet <strong>the</strong>particular requirements <strong>of</strong> <strong>the</strong> site. Table 2-20 lists <strong>the</strong> activities includedin <strong>the</strong>se system studies. While most contained <strong>the</strong> full complement <strong>of</strong>technical assessments, it is interesting to note that fewer than half <strong>of</strong> <strong>the</strong>studies estimated cost and energy savings <strong>for</strong> <strong>the</strong> recommended measures.This in<strong>for</strong>mation is <strong>of</strong>ten necessary to motivate customers to implementrecommendations.Twenty-five <strong>of</strong> <strong>the</strong> 38 establishments (66%) that undertook an efficiencystudy reported that <strong>the</strong>y implemented measures recommended in thosestudies. Twelve <strong>of</strong> <strong>the</strong>se companies reported implementing two or moremeasures. A variety <strong>of</strong> efficiency measures were implemented due to <strong>the</strong>efficiency study (See Table 2-21). Among those 13 customers who hadnot implemented any measures, 7 reported that <strong>the</strong>ir study was not yetcomplete. A number <strong>of</strong> <strong>the</strong>se customers reported that <strong>the</strong>y intended toimplement <strong>the</strong> recommended measures.Fifty-eight percent <strong>of</strong>customers who werenot approached topurchase energyefficiency servicesreported that <strong>the</strong>ywould be interestedin purchasing suchservices.Twenty-five <strong>of</strong> <strong>the</strong>38 establishments(66%) that undertookan efficiency studyreported that <strong>the</strong>yimplementedmeasuresrecommendedin those studies.3 The relevant question read: “Have you undertaken or contracted <strong>for</strong> a study <strong>of</strong> how to make your compressed air system as a wholemore energy efficient?”U.S. DEPARTMENT OF ENERGY27
<strong>Compressed</strong> <strong>Air</strong> <strong>Market</strong> <strong>Assessment</strong>TABLE 2-20: Activities Included in <strong>the</strong> <strong>Efficiency</strong> StudyPercent <strong>of</strong> Those who<strong>Compressed</strong> <strong>Air</strong> <strong>Efficiency</strong> Study <strong>Services</strong>Had System StudyEstimate <strong>of</strong> compressed air system energy use 79%Recommendations <strong>for</strong> improvements 74%<strong>Assessment</strong> <strong>of</strong> auxiliary equipment such asdryers and separators 68%Load pr<strong>of</strong>ile based on system measurements 63%Estimation <strong>of</strong> losses due to leaks 63%<strong>Assessment</strong> <strong>of</strong> control system and alternate strategies 63%Identification <strong>of</strong> inappropriate uses <strong>of</strong> compressed air 61%<strong>Assessment</strong> <strong>of</strong> <strong>the</strong> distribution system <strong>for</strong> pressuredrops and efficiency 61%<strong>Assessment</strong> <strong>of</strong> air storage capacity 61%Estimates <strong>of</strong> costs and energy savings <strong>for</strong>recommended measures 47%Number <strong>of</strong> customers 38TABLE 2-21: Measures Implemented from <strong>Efficiency</strong> StudyPercent <strong>of</strong> Those whoMeasuresImplemented MeasuresImprovements to system auxiliaries 40%Changes to piping, distribution system 40%Leak reduction 32%Added air storage capacity 28%Changes to compressor controls 24%Reduced unnecessary compressed air uses 16%Installed heat-recovery equipment 16%Number <strong>of</strong> customers 25Barriers to <strong>the</strong> Purchase <strong>of</strong> <strong>Compressed</strong> <strong>Air</strong>System <strong>Efficiency</strong> <strong>Services</strong>28U.S. DEPARTMENT OF ENERGYThe compressed air system efficiency consultants interviewed <strong>for</strong> thisreport repeatedly stressed that <strong>the</strong> major barrier to increased demand<strong>for</strong> compressed air efficiency services is lack <strong>of</strong> customer understanding<strong>of</strong> potential benefits: energy savings and improved control overproduction processes.
THE DEMAND SIDE OF THE MARKETO<strong>the</strong>r barriers mentioned included:• Lack <strong>of</strong> time among maintenance and facilities engineering staffto deal with problems that are not directly related to short-termproduction needs.• A lack <strong>of</strong> communication and shared goals between <strong>the</strong> maintenancedepartment—which typically is responsible <strong>for</strong> system operation—and plant engineers, who are focused on meeting <strong>the</strong> needs <strong>of</strong>production departments.These observations are consistent with <strong>the</strong> findings from this assessmentand <strong>the</strong> PG&E customer survey.In light <strong>of</strong> <strong>the</strong>se findings, <strong>the</strong> consultants believed that training and in<strong>for</strong>mationstrategies such as those currently pursued by <strong>the</strong> <strong>Compressed</strong><strong>Air</strong> Challenge ® will be <strong>the</strong> most effective. The consultants stressed that,to be most effective, <strong>the</strong> training programs must:• Be kept relatively simple;• Focus <strong>the</strong> trainee’s attention on “<strong>the</strong> low-hanging fruit,” measures thatare relatively easy to implement and are likely to yield appreciablesavings;• Provide a step-by-step road map regarding how to use in<strong>for</strong>mationgained through <strong>the</strong> training;• Equip <strong>the</strong> trainee to advocate <strong>for</strong> <strong>the</strong> expenditure <strong>of</strong> resources.U.S. DEPARTMENT OF ENERGY29
<strong>Compressed</strong> <strong>Air</strong> <strong>Market</strong> <strong>Assessment</strong>30U.S. DEPARTMENT OF ENERGY
SECTION 3: THE SUPPLY SIDE OF THE MARKETINTRODUCTIONThis section presents findings from <strong>the</strong> various sources discussed inSection 1 concerning <strong>the</strong> supply side <strong>of</strong> <strong>the</strong> market <strong>for</strong> compressed airsystem efficiency services. The analysis draws principally from <strong>the</strong>findings <strong>of</strong> an assessment <strong>of</strong> 91 distributors <strong>of</strong> compressed air equipmentmanufactured by Gardner Denver, Inc., and Quincy. We supplemented<strong>the</strong> findings from this evaluation with in<strong>for</strong>mation taken from regionalmarket studies, interviews with consultants, interviews with managers <strong>of</strong>3 Ingersoll-Rand air centers (manufacturer-owned sales and distributioncenters), and <strong>the</strong> customer interviews.METHODSObjectivesThe objectives <strong>of</strong> <strong>the</strong> distributor assessment were to characterize andquantify <strong>the</strong> compressed air efficiency services <strong>of</strong>fered by distributors.• What efficiency services do compressed air distributors and consultantscurrently <strong>of</strong>fer?• What is <strong>the</strong> <strong>for</strong>mat in which <strong>the</strong>se services are sold: as part <strong>of</strong>equipment sales ef<strong>for</strong>t, as “free-standing” consulting services, aspart <strong>of</strong> a service contract?• What specific measures or components are covered by <strong>the</strong>se services?• What is <strong>the</strong> current volume <strong>of</strong> sales <strong>for</strong> <strong>the</strong>se services? How hasvolume changed over <strong>the</strong> past few years? What are vendors’ expectationsregarding growth?• To which kinds <strong>of</strong> customers (as defined by industry segment, size <strong>of</strong>system, complexity <strong>of</strong> system) are <strong>the</strong>se services most <strong>of</strong>ten sold?• What kinds <strong>of</strong> skills, equipment, and o<strong>the</strong>r resources are needed todeliver efficiency services?• What role do <strong>the</strong>se services play in <strong>the</strong> overall business strategy <strong>of</strong>manufacturers, distributors, and consultants?• What barriers do <strong>the</strong>se businesses face in developing and sellingcompressed air system efficiency services?Selection <strong>of</strong> IntervieweesThe selection group <strong>for</strong> <strong>the</strong> assessment consisted <strong>of</strong> membership lists<strong>for</strong> two distributor associations: <strong>the</strong> Industrial Compressor DistributorsAssociation (ICDA), which represents Gardner Denver distributors, and<strong>the</strong> Association <strong>of</strong> Independent Compressor Distributors (AICD), whichrepresents Quincy distributors. These two lists provided a total <strong>of</strong>204 contacts. Nationally, <strong>the</strong>re are 6 compressor manufacturer associationswho represent approxmately 700 affiliated distributors. The remainingassociations did not provide mailing lists <strong>of</strong> members. According to <strong>the</strong>president <strong>of</strong> <strong>the</strong> <strong>Compressed</strong> <strong>Air</strong> Distributors Associations, <strong>the</strong> umbrellagroup <strong>for</strong> <strong>the</strong> individual associations, Gardner Denver, Inc., and Quincysupply a full line <strong>of</strong> equipment but tend to specialize in rotary screwU.S. DEPARTMENT OF ENERGY31
<strong>Compressed</strong> <strong>Air</strong> <strong>Market</strong> <strong>Assessment</strong>compressors. These machines are generally used to drive small- andmedium-sized systems. O<strong>the</strong>r manufacturers control large shares <strong>of</strong> <strong>the</strong>market <strong>for</strong> centrifugal compressors, which are more <strong>of</strong>ten used topower larger systems. The fact that <strong>the</strong> selection group did not containdistributors <strong>for</strong> manufacturers with varying specialties and target marketsshould be kept in mind when interpreting <strong>the</strong> findings <strong>of</strong> <strong>the</strong> distributorassessment.<strong>Assessment</strong> ImplementationTo pretest <strong>the</strong> effectiveness <strong>of</strong> <strong>the</strong> assessment, 6 samples were distributedto dealers at an early project meeting. The assessment was <strong>the</strong>n mailedout to all 204 distributors by XENERGY, Inc., with a cover letter from<strong>Compressed</strong> <strong>Air</strong> Challenge ® describing <strong>the</strong> research project. However,only 42 completed assessments were received. There<strong>for</strong>e, <strong>the</strong> evaluationwas converted to telephone <strong>for</strong>mat and administered by XENERGY staffto <strong>the</strong> remaining vendors. XENERGY staff also conducted telephoneinterviews with representatives <strong>of</strong> 3 Ingersoll-Rand air centers, whichare manufacturer-owned distributorships. Ano<strong>the</strong>r reason to add <strong>the</strong>Ingersoll-Rand air centers to <strong>the</strong> interviewing group was to capture <strong>the</strong>experience <strong>of</strong> distributors <strong>for</strong> larger capacity equipment, including centrifugalcompressors. The patterns <strong>of</strong> response from <strong>the</strong> Ingersoll-Randcenters were not entirely consistent with one ano<strong>the</strong>r and followed <strong>the</strong>distribution <strong>of</strong> responses from <strong>the</strong> larger group <strong>of</strong> independent distributors.The results <strong>of</strong> <strong>the</strong> Ingersoll-Rand assessments were <strong>the</strong>re<strong>for</strong>e combinedwith those from <strong>the</strong> larger group <strong>for</strong> <strong>the</strong> analysis. A total <strong>of</strong> 94 evaluationswere completed, including 46 via telephone. This work was carried outover <strong>the</strong> summer <strong>of</strong> 1999.FINDINGSCharacteristics <strong>of</strong> VendorsOrganization. Interviewed vendors were located in 36 <strong>of</strong> <strong>the</strong> 50United States. Forty-five percent <strong>of</strong> organizations operate at multiplelocations, while 55% have only one location. All vendors classified <strong>the</strong>irorganizations primarily as compressed air distributors. Eight <strong>of</strong> <strong>the</strong>vendors also claimed to provide consulting services as a major line <strong>of</strong>business. The companies employed between 2 and 100 people, with amean <strong>of</strong> 25 and a median <strong>of</strong> 18 employees.Position <strong>of</strong> Vendors. The assessments were generally completed by<strong>the</strong> contact <strong>for</strong> <strong>the</strong> distributor association. According to staff <strong>of</strong> <strong>the</strong>distributor organizations, <strong>the</strong>se individuals are primarily owners, withsome senior staff as designated representatives.<strong>Market</strong>. Thirty-five percent <strong>of</strong> <strong>the</strong> vendors describe <strong>the</strong>ir company’smarket area as local and 57% describe it as regional. The remaining8% describe <strong>the</strong>ir market as national or global. The industry that provides<strong>the</strong> most customers was food processing, cited by 52% <strong>of</strong> vendors.This was followed by <strong>the</strong> chemical industry, mentioned by 45% <strong>of</strong>distributors, <strong>the</strong>n fabricated metals, with 41%, and printing, with 37%.32U.S. DEPARTMENT OF ENERGY
THE SUPPLY SIDE OF THE MARKETRevenue. Annual revenues in 1998 varied between $500,000 and$35 million, with a mean <strong>of</strong> $7.3 million, and a median <strong>of</strong> $5 million.This finding indicates that most distributorships are small businesses.Distributors were <strong>the</strong>n asked to break out <strong>the</strong>ir revenues <strong>for</strong> differentcompressed air products and services. Table 3-1 displays <strong>the</strong> meanvalue, weighted by annual revenue, and maximum value <strong>for</strong> each category.Given <strong>the</strong> large difference between <strong>the</strong> mean and maximumvalues, it is apparent that different shops focus on different areas in <strong>the</strong>compressed air market.Sales <strong>of</strong> compressed air parts and equipment comprise 59% totalrevenue <strong>for</strong> a typical distributor. Servicing equipment represents ano<strong>the</strong>r19%, while all o<strong>the</strong>r services, including design and efficiency services,comprise only 16%. <strong>Efficiency</strong> services, such as leak detection andsystem audits, appear to play a very minor role in overall business,accounting <strong>for</strong> only 4% <strong>of</strong> total revenue. The types <strong>of</strong> services <strong>of</strong>feredunder <strong>the</strong> category “o<strong>the</strong>r compressed air related services” include <strong>the</strong>sale and rental <strong>of</strong> various equipment, such as pumps, blowers, and dryers.None <strong>of</strong> <strong>the</strong> vendors derived more than 40% <strong>of</strong> revenues from serviceso<strong>the</strong>r than equipment sales, parts sales, and equipment service.<strong>Efficiency</strong> Service OfferingsCurrent Status. Table 3-2 displays <strong>the</strong> percent <strong>of</strong> vendors who reported<strong>of</strong>fering particular efficiency services and <strong>the</strong> pricing structure or <strong>for</strong>matunder which <strong>the</strong>y were <strong>of</strong>fered. The 3 choices in <strong>for</strong>mat include: as part<strong>of</strong> a service contract, as part <strong>of</strong> equipment sales, or as a freestandingengineering service. Seventy-eight percent <strong>of</strong> <strong>the</strong> distributors interviewedreported that <strong>the</strong>y deliver system efficiency assessments; 75% <strong>of</strong>fermeasurements <strong>of</strong> system flow and pressure. Surprisingly, over one-half<strong>of</strong> <strong>the</strong> vendors reported that <strong>the</strong>y <strong>of</strong>fer ultrasonic leak detection services,a fairly new technology. Table 3-2 also suggests that distributors frequentlypackage energy efficiency services with more traditional lines <strong>of</strong> business,such as equipment sales and service. It appears that <strong>the</strong> 2 systemefficiency services, efficiency assessment and measurement, and <strong>the</strong><strong>Efficiency</strong> services,such as leak detectionand system auditsaccount <strong>for</strong> only 4%<strong>of</strong> total revenue.TABLE 3-1: Reported Sources <strong>of</strong> Business RevenuesSERVICEPERCENT OF 1998 REVENUESMeanMaximum<strong>Compressed</strong> air equipment sales 37% 75%<strong>Compressed</strong> air parts sales 22% 50%<strong>Compressed</strong> air equipment service 19% 70%<strong>Compressed</strong> air system design 5% 30%<strong>Compressed</strong> air efficiency services 1 4% 16%O<strong>the</strong>r compressed air related services 9% 45%1 <strong>Compressed</strong> air efficiency services were enumerated in <strong>the</strong> assessment <strong>for</strong>m as measurement <strong>of</strong> system flow and pressure, assessment<strong>of</strong> system efficiency, leak management services, ultrasonic leak detection, and analysis <strong>of</strong> end-use reduction opportunities.U.S. DEPARTMENT OF ENERGY33
TABLE 3-2: <strong>Efficiency</strong> <strong>Services</strong> Offered<strong>Compressed</strong> <strong>Air</strong> <strong>Market</strong> <strong>Assessment</strong>SERVICE FORMAT OF SERVICEOffer Equipment Service FreestandingSales Contract EngineeringService<strong>Assessment</strong> <strong>of</strong> system efficiency 78% 50% 31% 46%Measurement <strong>of</strong> system flow and pressure 73% 55% 34% 46%Analysis <strong>of</strong> end-use reduction opportunities 63% 39% 25% 41%Leak management service 60% 26% 40% 39%Ultrasonic leak detection 54% 24% 29% 33%O<strong>the</strong>r 5% 4% 2% 2%TABLE 3-3: Dates When <strong>Efficiency</strong> <strong>Services</strong> Were First OfferedSERVICE YEAR FIRST OFFEREDSince 1995 Since 1990 Total<strong>Assessment</strong> <strong>of</strong> system efficiency 25% 51% 78%Measurement <strong>of</strong> system flow and pressure 26% 49% 73%Analysis <strong>of</strong> end-use reduction opportunities 30% 53% 60%Leak management service 35% 53% 54%Ultrasonic leak detection 32% 51% 63%TABLE 3-4: Frequency <strong>of</strong> <strong>Compressed</strong> <strong>Air</strong> Needs <strong>Assessment</strong>sas Part <strong>of</strong> Equipment Sales Ef<strong>for</strong>tsFrequency <strong>of</strong> <strong>Compressed</strong> <strong>Air</strong> Needs <strong>Assessment</strong>sPercent <strong>of</strong> DistributorsIn all sales situations 10%In most sales situations 29%In some sales situations 47%In only a few sales situations 14%TABLE 3-5: Customer Objections to <strong>Efficiency</strong> Service OffersObjectionsPercentCustomer is skeptical about savings 75%Customer thinks <strong>the</strong> service costs too much 72%Customer believes internal staff already per<strong>for</strong>ms service 45%34U.S. DEPARTMENT OF ENERGYO<strong>the</strong>r 10%
THE SUPPLY SIDE OF THE MARKETend-use analysis are more likely to be <strong>of</strong>fered as part <strong>of</strong> equipment salesand engineering services. In contrast, <strong>the</strong> 2 leak control services aremore likely to be <strong>of</strong>fered as part <strong>of</strong> a service contract or engineeringservice.Dates <strong>of</strong> Service Initiation. The distributors were asked when <strong>the</strong>ybegan delivering <strong>the</strong> energy efficiency services <strong>the</strong>y claimed to <strong>of</strong>fer. AsTable 3-3 shows, <strong>the</strong> development <strong>of</strong> <strong>the</strong>se services is relatively recent<strong>for</strong> those distributors who <strong>of</strong>fer <strong>the</strong>m. Roughly one-third <strong>of</strong> <strong>the</strong> distributorswho reported <strong>of</strong>fering assessments <strong>of</strong> system efficiency and measurement<strong>of</strong> operating parameters began <strong>of</strong>fering this service after 1995;two-thirds had been <strong>of</strong>fering <strong>the</strong> service since 1990. This pattern holds<strong>for</strong> <strong>the</strong> o<strong>the</strong>r efficiency services <strong>of</strong>fered.The compressed air system efficiency consultants interviewed <strong>for</strong> thisproject all reported that <strong>the</strong> percentage <strong>of</strong> distributors <strong>of</strong>fering variouskinds <strong>of</strong> efficiency-oriented services had increased in <strong>the</strong> past 2 years.However, <strong>the</strong>se consultants felt that far fewer distributors <strong>of</strong>fered efficiencyservices than <strong>the</strong> results <strong>of</strong> <strong>the</strong> assessment would suggest. In particular,it was <strong>the</strong> consultants’ opinion that distributors would seldom <strong>of</strong>ferefficiency-oriented services if doing so would interfere with or complicate<strong>the</strong> sale <strong>of</strong> compressors and ancillary equipment.For <strong>the</strong>ir part, <strong>the</strong> distributors reported that <strong>the</strong>y frequently undertookcompressed air needs assessments—analyses <strong>of</strong> compressed airrequirements based on an inventory <strong>of</strong> end uses—as part <strong>of</strong> <strong>the</strong>ir equipmentsales ef<strong>for</strong>t. Thirty-nine percent <strong>of</strong> <strong>the</strong> vendors reported that <strong>the</strong>yconducted such needs assessments in all or most <strong>of</strong> <strong>the</strong>ir equipmentsales situations (See Table 3-4). These findings are at odds with <strong>the</strong>observations <strong>of</strong> consultants in <strong>the</strong> field. On <strong>the</strong> o<strong>the</strong>r hand, <strong>the</strong> questionnairewas not specific about what procedures should be included in acompressed air needs assessment.Trends in Demand <strong>for</strong> <strong>Efficiency</strong> <strong>Services</strong>. Despite <strong>the</strong> fairly low level<strong>of</strong> reported sales <strong>of</strong> efficiency-oriented services, distributors generallyfound that <strong>the</strong> demand <strong>for</strong> <strong>the</strong>m increased over <strong>the</strong> past year. Fifty-fivepercent <strong>of</strong> distributors interviewed reported that demand <strong>for</strong> systemefficiencyservices had increased over <strong>the</strong> past year; 38% reported thatdemand had remained steady, while 7% believed it had dropped.Several <strong>of</strong> <strong>the</strong> distributors interviewed reported a significant upturn ininterest among customers, with one claiming a 75-80% closing rate <strong>for</strong>proposed efficiency-related products. O<strong>the</strong>rs were more frustrated with<strong>the</strong> lack <strong>of</strong> customer response <strong>the</strong>y encountered, “We’ve had 22 years<strong>of</strong> experience in this field, during which our many air systems surveyshave not resulted in significant changes nor implementation <strong>of</strong> recommendationsby our customers.”The distributor questionnaire did not probe distributors’ observationsregarding <strong>the</strong> factors leading to changes in demand <strong>for</strong> efficiency services.Consultants interviewed <strong>for</strong> <strong>the</strong> project reported that <strong>the</strong> <strong>Compressed</strong><strong>Air</strong> Challenge ® and utility-sponsored programs appeared to be contributingto increased demand, as had increased attention to compressedair system efficiency in major industry and trade publications. The NewEngland baseline study also found evidence that CAC and utilityprograms had an effect on participating customers’ knowledge andFifty-five percent<strong>of</strong> distributorsinterviewed reportedthat demand <strong>for</strong>system-efficiencyservices hadincreased over<strong>the</strong> past year.U.S. DEPARTMENT OF ENERGY35
<strong>Compressed</strong> <strong>Air</strong> <strong>Market</strong> <strong>Assessment</strong>understanding <strong>of</strong> <strong>the</strong> benefits <strong>of</strong> efficiency measures. However, <strong>the</strong>sample <strong>of</strong> end users <strong>for</strong> this study was very small (30 facilities) andhigher awareness may have resulted from extensive utility demand-sidemanagement activity.Barriers and Motivations to Sales<strong>of</strong> <strong>Compressed</strong> <strong>Air</strong> <strong>Efficiency</strong> <strong>Services</strong>Thirty-six percent<strong>of</strong> vendors feel thatefficiency servicesare very importantto <strong>the</strong> competitiveposition <strong>of</strong> <strong>the</strong>irbusiness.Identification <strong>of</strong> Barriers. The distributors interviewed <strong>for</strong> this studyidentified customers’ skepticism concerning energy-savings claims andresistance to service costs as <strong>the</strong> primary barriers to greater sales <strong>of</strong>compressed air efficiency services (See Table 3-5). These findings mirror<strong>the</strong> experience <strong>of</strong> compressed air efficiency consultants who identifiedcustomers’ lack <strong>of</strong> understanding <strong>of</strong> <strong>the</strong> benefits <strong>of</strong> compressed air systemefficiency measures as <strong>the</strong> main obstacle to greater market penetration.Forty-five percent <strong>of</strong> <strong>the</strong> vendors identified customer perceptions thatcompressed air efficiency services were already being provided byin-house staff as an objection to sales ef<strong>for</strong>ts. This finding, combinedwith <strong>the</strong> reported low incidence <strong>of</strong> specific measure implementation,fur<strong>the</strong>r rein<strong>for</strong>ces <strong>the</strong> consultants’ observation that customers are largelyin <strong>the</strong> dark about <strong>the</strong> nature <strong>of</strong> compressed air system efficiency measuresand maintenance practices. Objections included under <strong>the</strong> “o<strong>the</strong>r”category focus on lack <strong>of</strong> time <strong>for</strong> staff to handle efficiency projects,low regional energy costs that reduce <strong>the</strong> return to investment, andcustomers’ lack <strong>of</strong> understanding. One contractor noted: “The aircompressor industry is to blame <strong>for</strong> not educating customers over <strong>the</strong>years [in energy efficiency benefits]. They are more interested in movingproduct than in customers’ needs.”The consultants interviewed <strong>for</strong> this project mentioned that many distributorsexperience conflicting motivations in <strong>of</strong>fering efficiency services.Customers most <strong>of</strong>ten call distributors and consultants when <strong>the</strong>y areexperiencing problems with <strong>the</strong> operation <strong>of</strong> <strong>the</strong>ir systems. These problemsusually involve interruptions in service, inconsistent air pressure, orcontaminated air. Very <strong>of</strong>ten, <strong>the</strong> solutions to <strong>the</strong>se problems involveincreased system efficiency, which may obviate <strong>the</strong> need to purchasenew or larger equipment. In <strong>the</strong>se cases, <strong>the</strong> distributor may feel mostcom<strong>for</strong>table in following established business procedure, which is tosell <strong>the</strong> larger equipment. It should be noted that not all distributorsfollow this pattern. In fact, 2 <strong>of</strong> <strong>the</strong> consultants interviewed are principalsin large distributorships. Interestingly, only one <strong>of</strong> <strong>the</strong> distributors interviewed<strong>for</strong> <strong>the</strong> study identified <strong>the</strong> potential <strong>for</strong> perceived conflict <strong>of</strong>interest as a barrier to entering <strong>the</strong> market. This individual believed thatany engineering advice he would provide to his customers would beviewed as biased.36U.S. DEPARTMENT OF ENERGYCosts. The major costs involved in <strong>of</strong>fering compressed air efficiencyservices are labor-oriented. They include diversion <strong>of</strong> sales or systemengineering staff from o<strong>the</strong>r potential revenue-generating activities andtraining. O<strong>the</strong>r key costs involve <strong>the</strong> accumulation <strong>of</strong> technical materialson diverse lines <strong>of</strong> equipment <strong>for</strong> easy reference and acquisition <strong>of</strong> testequipment. Experienced consultants maintain that technically-orientedsales staff in many distributorships can be trained to per<strong>for</strong>m system
THE SUPPLY SIDE OF THE MARKETdiagnostics and efficiency-oriented specification within a reasonableperiod. The most effective training <strong>for</strong> this kind <strong>of</strong> work consists <strong>of</strong>hands-on mentoring at live customer sites.Findings from <strong>the</strong> distributor assessment suggest that <strong>the</strong> training aspect<strong>of</strong> developing consulting capabilities may not constitute a major barrierto entering <strong>the</strong> market. Over two-thirds <strong>of</strong> vendors reported that <strong>the</strong>yhave implemented a training program in energy-efficient system design<strong>for</strong> <strong>the</strong>ir sales staff. The majority <strong>of</strong> <strong>the</strong>se training programs have beenimplemented since 1995 and <strong>the</strong> programs are held, on average, 5 timesper year, although this figure varies between 1 and 12 times per year.The questionnaire did not probe <strong>the</strong> source <strong>of</strong> this training. However,contacts in <strong>the</strong> industry report that most <strong>of</strong> <strong>the</strong> training currently availableis provided by manufacturers.Motivations to Enter <strong>the</strong> <strong>Market</strong>. Thirty-six percent <strong>of</strong> vendors felt thatefficiency services are very important to <strong>the</strong> competitive position <strong>of</strong> <strong>the</strong>irbusiness. In addition, ano<strong>the</strong>r 31% felt that <strong>the</strong> services are important.Their major motivation to enter <strong>the</strong> market was customer retention. Of<strong>the</strong> 73 vendors who gave reasons as to why system efficiency serviceswere (or were not) important to <strong>the</strong>ir businesses, 16 mentioned customerretention as a key motivation <strong>for</strong> promoting those services. As one dealernoted, “The world is changing. Energy efficiency is very important. Tostay in <strong>the</strong> marketplace, we will have to be trained to understand what<strong>the</strong> customer does not understand and what our competition doesunderstand in order to be a player.”Interviewed distributors mentioned <strong>the</strong> need to differentiate <strong>the</strong>mselvesfrom <strong>the</strong>ir competitors next most frequently (12 <strong>of</strong> 73) as a reason <strong>for</strong><strong>of</strong>fering efficiency-related services. One distributor noted, “[Offering efficiencyservices] is <strong>the</strong> key factor in convincing <strong>the</strong> customer that we area pr<strong>of</strong>essional business.”O<strong>the</strong>r important business motivations <strong>for</strong> <strong>of</strong>fering efficiency servicesincluded:• Enhancing <strong>the</strong> distributor’s credibility in making equipment sales;• Providing value added services to <strong>the</strong> customer (closely related tocustomer retention); and,• Opening up a relatively high-margin business line <strong>for</strong> <strong>the</strong> distributor.Key <strong>Market</strong>s. Based on <strong>the</strong>ir experience in <strong>the</strong> field, <strong>the</strong> distributorsbelieved that <strong>the</strong> market <strong>for</strong> compressed air system efficiency serviceswas not highly segmented by industry type. Their answers to inquiriesprobing <strong>the</strong> most receptive industries <strong>for</strong> <strong>the</strong>se services were fairlyevenly distributed over <strong>the</strong> industries <strong>the</strong> individual firms served. Forexample, distributors identified electronics and high tech manufacturing(13%), food processing (12%), and chemicals, especially pharmaceuticals(15%), as <strong>the</strong> most receptive industries <strong>for</strong> purchase <strong>of</strong> compressed airefficiency services. Fifteen percent <strong>of</strong> vendors replied that <strong>the</strong>re are noparticular industries that are especially receptive to compressed airefficiency services.Overwhelmingly, <strong>the</strong> interviewed distributors believed that larger businessesare more receptive than are smaller-sized businesses. Customerswith large and complex compressed air systems, especially with multiple"[Offering efficiencyservices] is <strong>the</strong> keyfactor in convincing<strong>the</strong> customer that weare a pr<strong>of</strong>essionalbusiness."U.S. DEPARTMENT OF ENERGY37
<strong>Compressed</strong> <strong>Air</strong> <strong>Market</strong> <strong>Assessment</strong>compressors, appear to be most receptive to efficiency services.Consultants who have served as instructors in <strong>the</strong> CAC training programsreport that most end users who have attended <strong>the</strong> programs representmid-sized facilities—those with compressor horsepower in <strong>the</strong> range <strong>of</strong>100 to 500 hp. They believed that larger facilities <strong>of</strong>ten have somewhatexperienced operating personnel, even though many <strong>of</strong> <strong>the</strong>ir ownclients were extremely large manufacturing facilities.38U.S. DEPARTMENT OF ENERGY
APPENDIX A: END-USER ASSESSMENTCOMPRESSED AIR EFFICIENCY SERVICESBASELINE END-USER ASSESSMENTCUSTOMER IDENTIFICATIONContact Name: [from list] .......................................................................................Company: [from list] ...............................................................................................Address: [from list] .................................................................................................City, State, Zip: [from list].......................................................................................Telephone: [from list]..............................................................................................4-Digit SIC Code: [from list] ...................................................................................Industry Description (SIC Name): [from list] ...........................................................Employment Category: [from list] ...........................................................................ID Number: ............................................................................................................Lead-inHello, this is ________ calling from ________. We’re conducting an assessment<strong>of</strong> compressed air system management practices <strong>for</strong> <strong>the</strong> <strong>Compressed</strong> <strong>Air</strong>Challenge, a partnership <strong>of</strong> government and industry organizations.Identification <strong>of</strong> CustomerMay I speak with [CONTACT NAME].IF CONTACT IS NOT AVAILABLE, ASCERTAIN BEST TIME TO CALL.IF CONTACT NO LONGER WORKS AT THE LOCATION, ASK:May I speak with <strong>the</strong> plant manager or maintenance manager. IF NO SUCHPOSITION, ASK FOR INDIVIDUAL WHO MANAGES THE COMPRESSED AIRSYSTEM.ENTER NAME OF CONTACT: _________________________________IF CONTACT IS NOT AVAILABLE, ASCERTAIN BEST TIME TO CALL.Lead-in <strong>for</strong> CustomerHello, this is _________ calling from _________. We’re conducting an assessment<strong>of</strong> compressed air system management practices <strong>for</strong> <strong>the</strong> <strong>Compressed</strong> <strong>Air</strong>Challenge ® , a partnership <strong>of</strong> government and industry organizations that supportsprograms to improve industrial compressed air system per<strong>for</strong>mance. The<strong>Compressed</strong> <strong>Air</strong> Challenge ® is a non-pr<strong>of</strong>it organization, and is not seeking tosell products or services. The in<strong>for</strong>mation you provide will help <strong>the</strong> <strong>Compressed</strong><strong>Air</strong> Challenge ® refine programs to help companies such as yours. The assessmentwill take just a few minutes. In return <strong>for</strong> your participation we will send youa copy <strong>of</strong> <strong>the</strong> book Improving <strong>Compressed</strong> <strong>Air</strong> System Per<strong>for</strong>mance. This booknormally sells <strong>for</strong> $19.95. It provides a practical guide to reducing <strong>the</strong> costs <strong>of</strong>compressed air in your facility.U.S. DEPARTMENT OF ENERGYA-1
Screener<strong>Compressed</strong> <strong>Air</strong> <strong>Market</strong> <strong>Assessment</strong>First, I’d like to get a little in<strong>for</strong>mation about you and your firm.SC1Is <strong>the</strong>re a compressed air system that supplies energy<strong>for</strong> one or more production processes in your facility?Yes . . . . . . . . . . . . . . . . . . . . . . . . . . . . . . . . . . . . . . . . . . . . . . . 1No . . . . . . . . . . . . . . . . . . . . . . . . . . . . . . . . . . . . . . . . . . . . . . . 2Don’t know . . . . . . . . . . . . . . . . . . . . . . . . . . . . . . . . . . . . . . . . . 3IF SC1=1, CONTINUE. ELSE THANK AND TERMINATE.SC2SC3SC4SC5SC6What is your title?Plant Manager . . . . . . . . . . . . . . . . . . . . . . . . . . . . . . . . . . . . . . .1Maintenance Manager . . . . . . . . . . . . . . . . . . . . . . . . . . . . . . . . .2Purchasing Manager . . . . . . . . . . . . . . . . . . . . . . . . . . . . . . . . . .3Plant Engineer . . . . . . . . . . . . . . . . . . . . . . . . . . . . . . . . . . . . . . .4Chief Electrician . . . . . . . . . . . . . . . . . . . . . . . . . . . . . . . . . . . . .5President/CEO . . . . . . . . . . . . . . . . . . . . . . . . . . . . . . . . . . . . . . .6General Manager . . . . . . . . . . . . . . . . . . . . . . . . . . . . . . . . . . . . .7O<strong>the</strong>r(Specify)___________________________________________ 8What is <strong>the</strong> principal product produced or serviceprovided at your facility?Food product . . . . . . . . . . . . . . . . . . . . . . . . . . . . . . . . . . . . . . . .1Textile product . . . . . . . . . . . . . . . . . . . . . . . . . . . . . . . . . . . . . . .2Lumber or wood product . . . . . . . . . . . . . . . . . . . . . . . . . . . . . . .3Paper or allied product . . . . . . . . . . . . . . . . . . . . . . . . . . . . . . . . .4Chemicals . . . . . . . . . . . . . . . . . . . . . . . . . . . . . . . . . . . . . . . . . .5Petroleum . . . . . . . . . . . . . . . . . . . . . . . . . . . . . . . . . . . . . . . . . .6Stone, Clay, Glass . . . . . . . . . . . . . . . . . . . . . . . . . . . . . . . . . . . .7Primary metals (e.g. Steel, aluminum) . . . . . . . . . . . . . . . . . . . . .8Metal fabrication or machinery . . . . . . . . . . . . . . . . . . . . . . . . . . .9O<strong>the</strong>r . . . . . . . . . . . . . . . . . . . . . . . . . . . . . . . . . . . . . . . . . . . . .10How many full-time employees work at this location. Thisincludes clerical and pr<strong>of</strong>essional employees as well asproduction workers.ENTER NUMBER OF EMPLOYEES . . . . . . . . . . . . . . . . . . . .____How many days per week are your production facilitiescurrently operating?ENTER NUMBER OF DAYS PER WEEK . . . . . . . . . . . . . . . .____And how many hours per day, on average?ENTER NUMBER OF HOURS PER DAY . . . . . . . . . . . . . . . .____A-2U.S. DEPARTMENT OF ENERGY
APPENDIX A: END-USER ASSESSMENT<strong>Compressed</strong> <strong>Air</strong> System DescriptionSD1How many compressors are <strong>the</strong>re in your compressedair system?ENTER NUMBER OF COMPRESSORS;97 FOR DON’T KNOW . . . . . . . . . . . . . . . . . . . . . . . . . . . . .____SD2Approximately what is <strong>the</strong> total horsepower <strong>of</strong><strong>the</strong>se compressors?ENTER HORSEPOWER; 97 FOR DON’T KNOW . . . . . . . . . .____SD2 What is <strong>the</strong> principal type <strong>of</strong> compressor-control strategyused in you compressed air system?PROMPT IF NECESSARY.Start/Stop . . . . . . . . . . . . . . . . . . . . . . . . . . . . . . . . . . . . . . . . . .1Load/Unload . . . . . . . . . . . . . . . . . . . . . . . . . . . . . . . . . . . . . . . .2Modulating controls . . . . . . . . . . . . . . . . . . . . . . . . . . . . . . . . . . .3Multi-step controls . . . . . . . . . . . . . . . . . . . . . . . . . . . . . . . . . . . .5Variable speed drives . . . . . . . . . . . . . . . . . . . . . . . . . . . . . . . . .6Variable Displacement . . . . . . . . . . . . . . . . . . . . . . . . . . . . . . . . .7Dual control system . . . . . . . . . . . . . . . . . . . . . . . . . . . . . . . . . . .8O<strong>the</strong>r (Specify) __________________________________________ 9Don’t know . . . . . . . . . . . . . . . . . . . . . . . . . . . . . . . . . . . . . . . . .0IF SD1>1, ASK SD5. ELSE SKIP TO SD6SD5Do you use a system-control scheme such as singlemaster sequencing or multimaster network controls?Yes . . . . . . . . . . . . . . . . . . . . . . . . . . . . . . . . . . . . . . . . . . . . . . .1No . . . . . . . . . . . . . . . . . . . . . . . . . . . . . . . . . . . . . . . . . . . . . . . .2Don’t know . . . . . . . . . . . . . . . . . . . . . . . . . . . . . . . . . . . . . . . . .3<strong>Compressed</strong> <strong>Air</strong> System ManagementAM1 Who in your organization has primary responsibility <strong>for</strong>management and maintenance <strong>of</strong> your compressed airsystem?You . . . . . . . . . . . . . . . . . . . . . . . . . . . . . . . . . . . . . . . . . . . . . . .1Plant engineer (if o<strong>the</strong>r than you) . . . . . . . . . . . . . . . . . . . . . . . . .2Maintenance manager (if o<strong>the</strong>r than you) . . . . . . . . . . . . . . . . . . .3<strong>Compressed</strong> air specialist . . . . . . . . . . . . . . . . . . . . . . . . . . . . . .4Contractor . . . . . . . . . . . . . . . . . . . . . . . . . . . . . . . . . . . . . . . . . .5O<strong>the</strong>r (Specify) __________________________________________ 6U.S. DEPARTMENT OF ENERGYA-3
<strong>Compressed</strong> <strong>Air</strong> <strong>Market</strong> <strong>Assessment</strong>AM2a What would you say is <strong>the</strong> primary objective in <strong>the</strong> wayyou manage your compressed air system?[PROMPT IF NECESSARY. ROTATE PROMPTS.]AM2b Are <strong>the</strong>re o<strong>the</strong>r objectives?AM2aAM2bMain Reason O<strong>the</strong>r ReasonsNo o<strong>the</strong>r objectives 0Maintain continuous operation 1 1Ensure adequate supply <strong>of</strong> air to end uses 2 2Maintain quality <strong>of</strong> air supplied 3 3Preventive maintenance 4 4Control or reduce energy costs/energy use 5 5O<strong>the</strong>r (Specify) 7 7Don’t know 8 8AM3 Do you have a service contract <strong>for</strong> your compressed airsystem or components <strong>of</strong> that system?Yes . . . . . . . . . . . . . . . . . . . . . . . . . . . . . . . . . . . . . . . . . . . . . . .1No . . . . . . . . . . . . . . . . . . . . . . . . . . . . . . . . . . . . . . . . . . . . . . . .2Don’t know . . . . . . . . . . . . . . . . . . . . . . . . . . . . . . . . . . . . . . . . .3IF AM3 = 1 ASK AM4. ELSE SKIP TO MA1.AM4AM5Who provides this service? [PROMPT IF NECESSARY.]<strong>Compressed</strong> air equipment vendor . . . . . . . . . . . . . . . . . . . . . . . .1Independent service contractor or consultant . . . . . . . . . . . . . . . .2O<strong>the</strong>r (Specify) _________________________________________ 3Don’t know . . . . . . . . . . . . . . . . . . . . . . . . . . . . . . . . . . . . . . . . .4Can you tell me what services are provided under <strong>the</strong>contract? [CIRCLE ALL MENTIONED.]Leak detection . . . . . . . . . . . . . . . . . . . . . . . . . . . . . . . . . . . . . . .1Leak repair . . . . . . . . . . . . . . . . . . . . . . . . . . . . . . . . . . . . . . . . .2Energy use monitoring . . . . . . . . . . . . . . . . . . . . . . . . . . . . . . . . .3Load pr<strong>of</strong>iling . . . . . . . . . . . . . . . . . . . . . . . . . . . . . . . . . . . . . . . .4Preventive maintenance on compressors . . . . . . . . . . . . . . . . . . .5Preventive maintenance on auxiliaries . . . . . . . . . . . . . . . . . . . . .6<strong>Assessment</strong> <strong>of</strong> control strategies and equipment . . . . . . . . . . . . .7Emergency repair . . . . . . . . . . . . . . . . . . . . . . . . . . . . . . . . . . . .8O<strong>the</strong>r (Specify) __________________________________________ 9Don’t know . . . . . . . . . . . . . . . . . . . . . . . . . . . . . . . . . . . . . . . . .0A-4U.S. DEPARTMENT OF ENERGY
APPENDIX A: END-USER ASSESSMENTMaintenance PracticesMA1What maintenance activities are carried out on yourcompressed air equipment on a regular basis?DO NOT READ. MARK ALL MENTIONED.Clean or replace inlet air filter cartridges. . . . . . . . . . . . . . . . . . . .1Clean drain traps . . . . . . . . . . . . . . . . . . . . . . . . . . . . . . . . . . . . .2Check lubricant level and filter . . . . . . . . . . . . . . . . . . . . . . . . . . .3Check belts <strong>for</strong> wear and replace . . . . . . . . . . . . . . . . . . . . . . . .4Verify operating temperature per manufacturer specification . . . .5Clean air line filters . . . . . . . . . . . . . . . . . . . . . . . . . . . . . . . . . . .6Check cooling water quality, replace cooling system filters . . . . . .7Check <strong>for</strong> system leaks . . . . . . . . . . . . . . . . . . . . . . . . . . . . . . . .8O<strong>the</strong>r (Specify) __________________________________________ 9MA2MA3In general, how <strong>of</strong>ten do you per<strong>for</strong>m <strong>the</strong>se maintenanceactivities? Would you say it is...Once per year . . . . . . . . . . . . . . . . . . . . . . . . . . . . . . . . . . . . . . .1Once every six months . . . . . . . . . . . . . . . . . . . . . . . . . . . . . . . .2Once per quarter . . . . . . . . . . . . . . . . . . . . . . . . . . . . . . . . . . . . .3Once per month . . . . . . . . . . . . . . . . . . . . . . . . . . . . . . . . . . . . .4Once per week . . . . . . . . . . . . . . . . . . . . . . . . . . . . . . . . . . . . . .5Or more frequently . . . . . . . . . . . . . . . . . . . . . . . . . . . . . . . . . . . .6Don’t know . . . . . . . . . . . . . . . . . . . . . . . . . . . . . . . . . . . . . . . . .7Are <strong>the</strong>se activities carried out by...Your own staff . . . . . . . . . . . . . . . . . . . . . . . . . . . . . . . . . . . . . . .1Your compressed air equipment vendor . . . . . . . . . . . . . . . . . . . .2An independent service contractor or consultant . . . . . . . . . . . . .3Some combination <strong>of</strong> <strong>the</strong> above . . . . . . . . . . . . . . . . . . . . . . . . . .4Don’t know . . . . . . . . . . . . . . . . . . . . . . . . . . . . . . . . . . . . . . . . .5MA4 Do you have a leak-prevention routine or program inplace at your facility?Yes . . . . . . . . . . . . . . . . . . . . . . . . . . . . . . . . . . . . . . . . . . . . . . .1No . . . . . . . . . . . . . . . . . . . . . . . . . . . . . . . . . . . . . . . . . . . . . . . .2Don’t know . . . . . . . . . . . . . . . . . . . . . . . . . . . . . . . . . . . . . . . . .3IF MA4 = 1, ASK MA5. ELSE SKIP TO SM1.MA5 Can you tell me what you do as part <strong>of</strong> yourleak-prevention routine?[CHECK ALL ELEMENTS MENTIONED.]Check <strong>for</strong> leaks around compressors and air dryers . . . . . . . . . . .1Check <strong>for</strong> open bleed valves . . . . . . . . . . . . . . . . . . . . . . . . . . . .2Check bypass valves . . . . . . . . . . . . . . . . . . . . . . . . . . . . . . . . . .3Check joints <strong>for</strong> leaks . . . . . . . . . . . . . . . . . . . . . . . . . . . . . . . . .4U.S. DEPARTMENT OF ENERGYA-5
<strong>Compressed</strong> <strong>Air</strong> <strong>Market</strong> <strong>Assessment</strong>Check regulators and tools <strong>for</strong> leaks . . . . . . . . . . . . . . . . . . . . . .5Tag leaks . . . . . . . . . . . . . . . . . . . . . . . . . . . . . . . . . . . . . . . . . . .6Repair leaks . . . . . . . . . . . . . . . . . . . . . . . . . . . . . . . . . . . . . . . .7O<strong>the</strong>r (Specify) __________________________________________ 8Don’t know . . . . . . . . . . . . . . . . . . . . . . . . . . . . . . . . . . . . . . . . .9MA6Is this activity carried out by...Your own staff . . . . . . . . . . . . . . . . . . . . . . . . . . . . . . . . . . . . . . .1Your compressed air equipment vendor . . . . . . . . . . . . . . . . . . . .2An independent service contractor or consultant . . . . . . . . . . . . .3Some combination <strong>of</strong> <strong>the</strong> above . . . . . . . . . . . . . . . . . . . . . . . . . .4Don’t know . . . . . . . . . . . . . . . . . . . . . . . . . . . . . . . . . . . . . . . . .5MA7a Over <strong>the</strong> past 12 months, has your compressed air systembeen down <strong>for</strong> unscheduled repairs or maintenance?Yes . . . . . . . . . . . . . . . . . . . . . . . . . . . . . . . . . . . . . . . . . . . . . . .1No . . . . . . . . . . . . . . . . . . . . . . . . . . . . . . . . . . . . . . . . . . . . . . . .2Don’t know . . . . . . . . . . . . . . . . . . . . . . . . . . . . . . . . . . . . . . . . .3IF MA7a = 1, ASK MA7b. ELSE SKIP TO MA8.MA7b How many work days was <strong>the</strong> system down?ENTER NUMBER OF DAYS, 97 FOR DON’T KNOW _____MA8Over <strong>the</strong> past 12 months, have you experienced any <strong>of</strong><strong>the</strong> following operating problems in your compressed airsystem? [READ AND MARK ALL THAT APPLY].Inadequate pressure in <strong>the</strong> whole system . . . . . . . . . . . . . . . . . .1Inadequate pressure at specific points in <strong>the</strong> system . . . . . . . . . .2Excess moisture in <strong>the</strong> compressed air . . . . . . . . . . . . . . . . . . . .3Excess oil in <strong>the</strong> air . . . . . . . . . . . . . . . . . . . . . . . . . . . . . . . . . . .4Frequent fouling <strong>of</strong> air filters . . . . . . . . . . . . . . . . . . . . . . . . . . . .5System Monitoring and ManagementSM1 Over <strong>the</strong> past 2 years, have you measured any <strong>of</strong> <strong>the</strong>following quantities in regard to your compressed air system?Demand on <strong>the</strong> compressor motors . . . . . . . . . . . . . . . . . . . . . . .1Weekly or monthly compressor motor electric use . . . . . . . . . . . .2Pressure levels . . . . . . . . . . . . . . . . . . . . . . . . . . . . . . . . . . . . . .3Leak loads . . . . . . . . . . . . . . . . . . . . . . . . . . . . . . . . . . . . . . . . . .4A-6SM3U.S. DEPARTMENT OF ENERGYHave you developed a load pr<strong>of</strong>ile <strong>for</strong> your compressed airsystem? That is, have you prepared an analysis <strong>of</strong> howdemand <strong>for</strong> compressed air varies over a typical week.Yes . . . . . . . . . . . . . . . . . . . . . . . . . . . . . . . . . . . . . . . . . . . . . . . . .1No . . . . . . . . . . . . . . . . . . . . . . . . . . . . . . . . . . . . . . . . . . . . . . . . . .2Don’t know . . . . . . . . . . . . . . . . . . . . . . . . . . . . . . . . . . . . . . . . . . . .3
APPENDIX A: END-USER ASSESSMENTIF SM1 NOT NULL OR SM3 = 1 ASK SM4, ELSE SKIP TO SM5.SM4SM5SM7Who carried out <strong>the</strong>se measurements? Was it...Your own staff . . . . . . . . . . . . . . . . . . . . . . . . . . . . . . . . . . . . . . .1Your compressed air equipment vendor . . . . . . . . . . . . . . . . . . . .2An independent service contractor . . . . . . . . . . . . . . . . . . . . . . . .3A compressed air system consultant . . . . . . . . . . . . . . . . . . . . . .4Some combination <strong>of</strong> <strong>the</strong> above . . . . . . . . . . . . . . . . . . . . . . . . . .5Don’t know . . . . . . . . . . . . . . . . . . . . . . . . . . . . . . . . . . . . . . . . .6Have you evaluated <strong>the</strong> effectiveness <strong>of</strong> your compressorcontrol system in <strong>the</strong> past 2 years?Yes . . . . . . . . . . . . . . . . . . . . . . . . . . . . . . . . . . . . . . . . . . . . . . .1No . . . . . . . . . . . . . . . . . . . . . . . . . . . . . . . . . . . . . . . . . . . . . . . .2Don’t know . . . . . . . . . . . . . . . . . . . . . . . . . . . . . . . . . . . . . . . . .3Do you periodically assess whe<strong>the</strong>r end-uses <strong>of</strong> compressedair in your plant can be eliminated or replacedby motor-driven equipment?Yes . . . . . . . . . . . . . . . . . . . . . . . . . . . . . . . . . . . . . . . . . . . . . . .1No . . . . . . . . . . . . . . . . . . . . . . . . . . . . . . . . . . . . . . . . . . . . . . . .2Don’t know . . . . . . . . . . . . . . . . . . . . . . . . . . . . . . . . . . . . . . . . .7System AuditSA1 Have you undertaken or contracted <strong>for</strong> a study <strong>of</strong> howto make your compressed air system as a whole moreenergy efficient?Yes . . . . . . . . . . . . . . . . . . . . . . . . . . . . . . . . . . . . . . . . . . . . . . .1No . . . . . . . . . . . . . . . . . . . . . . . . . . . . . . . . . . . . . . . . . . . . . . . .2Don’t know . . . . . . . . . . . . . . . . . . . . . . . . . . . . . . . . . . . . . . . . .3IF SA1 = 1, ASK SA2. ELSE SKIP TO ES1.SA2SA3In what year was this study undertaken?ENTER YEAR, 9999 FOR DK _____Was this study per<strong>for</strong>med by...Your own staff . . . . . . . . . . . . . . . . . . . . . . . . . . . . . . . . . . . . . . .1Your compressed air equipment vendor . . . . . . . . . . . . . . . . . . . .2An independent service contractor . . . . . . . . . . . . . . . . . . . . . . . .3A compressed air system consultant . . . . . . . . . . . . . . . . . . . . . .4Some combination <strong>of</strong> <strong>the</strong> above . . . . . . . . . . . . . . . . . . . . . . . . . .5Don’t know . . . . . . . . . . . . . . . . . . . . . . . . . . . . . . . . . . . . . . . . .6U.S. DEPARTMENT OF ENERGYA-7
<strong>Compressed</strong> <strong>Air</strong> <strong>Market</strong> <strong>Assessment</strong>SA4Please tell me which <strong>of</strong> <strong>the</strong> following elements wereincluded in <strong>the</strong> study.[READ AND CIRCLE ALL ELEMENTS MENTIONED.]Estimate <strong>of</strong> compressed air system energy use . . . . . . . . . . . . . .1Load pr<strong>of</strong>ile based on system measurements . . . . . . . . . . . . . . . .2Identification <strong>of</strong> unnecessary or inappropriate uses <strong>of</strong>compressed air . . . . . . . . . . . . . . . . . . . . . . . . . . . . . . . . . . . . . .3Estimation <strong>of</strong> losses due to leaks . . . . . . . . . . . . . . . . . . . . . . . . .4<strong>Assessment</strong> <strong>of</strong> control system and alternate strategies . . . . . . . .5<strong>Assessment</strong> <strong>of</strong> <strong>the</strong> distribution system <strong>for</strong> pressure dropsand efficiency . . . . . . . . . . . . . . . . . . . . . . . . . . . . . . . . . . . . . . .6<strong>Assessment</strong> <strong>of</strong> auxiliary equipment such as dryersand separators . . . . . . . . . . . . . . . . . . . . . . . . . . . . . . . . . . . . . .7<strong>Assessment</strong> <strong>of</strong> air storage capacity . . . . . . . . . . . . . . . . . . . . . . .8Recommendations <strong>for</strong> improvements . . . . . . . . . . . . . . . . . . . . . .9Estimates <strong>of</strong> costs and energy savings <strong>for</strong> recommendedmeasures . . . . . . . . . . . . . . . . . . . . . . . . . . . . . . . . . . . . . . . . . .10O<strong>the</strong>r (Specify) _________________________________________ 11SA5 Have you implemented any <strong>of</strong> <strong>the</strong> measures recommendedin <strong>the</strong> compressed air system audit?Yes . . . . . . . . . . . . . . . . . . . . . . . . . . . . . . . . . . . . . . . . . . . . . . .1No . . . . . . . . . . . . . . . . . . . . . . . . . . . . . . . . . . . . . . . . . . . . . . . .2IF SA5 = NO, ASK SA5a. ELSE SKIP TO SA6.SA5a What is <strong>the</strong> main reason you have not implemented any<strong>of</strong> <strong>the</strong>se measures?SA5b Are <strong>the</strong>re o<strong>the</strong>r reasons?SA5aSA5bMain Reason O<strong>the</strong>r ReasonsToo busy; no time 1 1No personnel in <strong>the</strong> plant to manageimplementation 2 2Skeptical <strong>of</strong> energy-savings estimates 3 3Plan to do it; haven’t gotten around to it 4 4No budget; can’t af<strong>for</strong>d it 5 5Management did not approve 6 6O<strong>the</strong>r (Specify) 7 7Don’t know 8 8A-8U.S. DEPARTMENT OF ENERGY
APPENDIX A: END-USER ASSESSMENTSA6 What measures have you implemented?[DO NOT READ. CHECK ALL THAT APPLY.]Leak reduction . . . . . . . . . . . . . . . . . . . . . . . . . . . . . . . . . . . . . . . . .1Changes to compressor controls . . . . . . . . . . . . . . . . . . . . . . . . . . .2Improvements to system auxiliaries (air dryers, coolers, separators) . .3Reduced unnecessary compressed air uses . . . . . . . . . . . . . . . . . . .4Changes to piping, distribution system . . . . . . . . . . . . . . . . . . . . . . .5Added air storage capacity . . . . . . . . . . . . . . . . . . . . . . . . . . . . . . . .6Installed heat recovery equipment . . . . . . . . . . . . . . . . . . . . . . . . . .7O<strong>the</strong>r (Specify) ____________________________________________ 8Interest in <strong>Efficiency</strong> <strong>Services</strong>ES1 Have any vendors approached you or your company to sellservices specifically designed to reduce energy costs inyour compressed air systems?Yes . . . . . . . . . . . . . . . . . . . . . . . . . . . . . . . . . . . . . . . . . . . . . . . . .1No . . . . . . . . . . . . . . . . . . . . . . . . . . . . . . . . . . . . . . . . . . . . . . . . . .2Don’t know . . . . . . . . . . . . . . . . . . . . . . . . . . . . . . . . . . . . . . . . . . . .3IF ES1 = 1 ASK ES2, ELSE SKIP TO ES7.ES2 What kind <strong>of</strong> company or companies have approached youto sell this service? [PROMPT IF NECESSARY.]<strong>Compressed</strong> air equipment vendor . . . . . . . . . . . . . . . . . . . . . . . . . .1Independent consultant or contractor . . . . . . . . . . . . . . . . . . . . . . . .2OEM equipment vendor . . . . . . . . . . . . . . . . . . . . . . . . . . . . . . . . . .3O<strong>the</strong>r (Specify) . . . . . . . . . . . . . . . . . . . . . . . . . . . . . . . . . . . . . . . . .4Don’t know . . . . . . . . . . . . . . . . . . . . . . . . . . . . . . . . . . . . . . . . . . . .5ES3 Can you tell me what services were <strong>of</strong>fered as part <strong>of</strong> thisservice? [CIRCLE ALL MENTIONED.]Leak detection . . . . . . . . . . . . . . . . . . . . . . . . . . . . . . . . . . . . . . . . .1Leak repair . . . . . . . . . . . . . . . . . . . . . . . . . . . . . . . . . . . . . . . . . . .2Energy use monitoring/load pr<strong>of</strong>iling . . . . . . . . . . . . . . . . . . . . . . . . .3Preventive maintenance on compressors . . . . . . . . . . . . . . . . . . . . .4Preventive maintenance on auxiliaries . . . . . . . . . . . . . . . . . . . . . . .5<strong>Assessment</strong> <strong>of</strong> control strategies and equipment . . . . . . . . . . . . . . .6Identification <strong>of</strong> energy-saving measures . . . . . . . . . . . . . . . . . . . . .7Financial analysis <strong>of</strong> energy-saving measures . . . . . . . . . . . . . . . . .8Installation <strong>of</strong> energy-saving measures . . . . . . . . . . . . . . . . . . . . . . .9<strong>Assessment</strong> <strong>of</strong> compressed air end-uses . . . . . . . . . . . . . . . . . . . .10O<strong>the</strong>r (Specify) ___________________________________________ 11U.S. DEPARTMENT OF ENERGYA-9
<strong>Compressed</strong> <strong>Air</strong> <strong>Market</strong> <strong>Assessment</strong>ES4 Did you purchase this service?Yes . . . . . . . . . . . . . . . . . . . . . . . . . . . . . . . . . . . . . . . . . . . . . . . . .1No . . . . . . . . . . . . . . . . . . . . . . . . . . . . . . . . . . . . . . . . . . . . . . . . . .2Don’t know . . . . . . . . . . . . . . . . . . . . . . . . . . . . . . . . . . . . . . . . . . . .3IF ES4 = YES, ASK ES 5. ELSE SKIP TO ES6.ES5a What was <strong>the</strong> most important factor in your decision topurchase this service?ES5b Were <strong>the</strong>re o<strong>the</strong>r important factors?ES5a-Main ES5b-O<strong>the</strong>rFactor FactorsNo o<strong>the</strong>r factor 0Believed energy savings would be substantial 1 1Improved control over production 2 2Improved efficiency in production 3 3Increased safety 4 4Good <strong>for</strong> <strong>the</strong> environment 5 5Reputation <strong>of</strong> vendor/Good experiencewith vendor 6 6O<strong>the</strong>r (Specify) 7 7Don’t know 8 8GO TO CC1.ES6a What is <strong>the</strong> main reason you decided not to purchasethis service?ES6b Are <strong>the</strong>re o<strong>the</strong>r reasons?ES5aES5bMain Reason O<strong>the</strong>r ReasonsNo o<strong>the</strong>r reason 0Too costly 1 1No budget 2 2Skeptical <strong>of</strong> energy-savings estimates 3 3Can do it ourselves, in-house 4 4Presented to management; managementdid not approve 5 5Still considering 6 6O<strong>the</strong>r (Specify) 7 7Don’t know 8 8A-10U.S. DEPARTMENT OF ENERGY
APPENDIX A: END-USER ASSESSMENTGO TO CC1ES7 Would you consider purchasing such a service?Yes . . . . . . . . . . . . . . . . . . . . . . . . . . . . . . . . . . . . . . . . . . . . . . .1No . . . . . . . . . . . . . . . . . . . . . . . . . . . . . . . . . . . . . . . . . . . . . . . .2Don’t know . . . . . . . . . . . . . . . . . . . . . . . . . . . . . . . . . . . . . . . . .3IF ES7 = 2, ASK ES8. ELSE GO TO CC1.ES8a What is <strong>the</strong> main reason you would not be interested inthis kind <strong>of</strong> service?ES8b Are <strong>the</strong>re o<strong>the</strong>r reasons?ES8aES8bMain Reason O<strong>the</strong>r ReasonsNo o<strong>the</strong>r reason 0No budget 1 1Skeptical <strong>of</strong> energy-savings claims 2 2Already doing it 3 3Can do it ourselves, in-house 4 4<strong>Compressed</strong> air system is too small;not enough savings potential 5 5O<strong>the</strong>r (Specify) 6 6Don’t know 7 7CC1CC2CC3Prior to this interview, had you ever heard <strong>of</strong> <strong>the</strong><strong>Compressed</strong> <strong>Air</strong> Challenge ® Program?Yes . . . . . . . . . . . . . . . . . . . . . . . . . . . . . . . . . . . . . . . . . . . . . . . . .1No . . . . . . . . . . . . . . . . . . . . . . . . . . . . . . . . . . . . . . . . . . . . . . . . .2Don’t know . . . . . . . . . . . . . . . . . . . . . . . . . . . . . . . . . . . . . . . . . . .3Have you or your staff participated in training oncompressed air system efficiency?Yes . . . . . . . . . . . . . . . . . . . . . . . . . . . . . . . . . . . . . . . . . . . . . . . . .1No . . . . . . . . . . . . . . . . . . . . . . . . . . . . . . . . . . . . . . . . . . . . . . . . .2Don’t know . . . . . . . . . . . . . . . . . . . . . . . . . . . . . . . . . . . . . . . . . . .3Who provided that training?Utility . . . . . . . . . . . . . . . . . . . . . . . . . . . . . . . . . . . . . . . . . . . . . . .1Government program . . . . . . . . . . . . . . . . . . . . . . . . . . . . . . . . . . .2University or college . . . . . . . . . . . . . . . . . . . . . . . . . . . . . . . . . . . .3<strong>Compressed</strong> air equipment vendor . . . . . . . . . . . . . . . . . . . . . . . . .4<strong>Compressed</strong> air system consultant . . . . . . . . . . . . . . . . . . . . . . . . .5O<strong>the</strong>r (Specify): _________________________________________6Don’t know . . . . . . . . . . . . . . . . . . . . . . . . . . . . . . . . . . . . . . . . . . .7U.S. DEPARTMENT OF ENERGYA-11
<strong>Compressed</strong> <strong>Air</strong> <strong>Market</strong> <strong>Assessment</strong>CC4 Would you like to receive <strong>the</strong> sourcebook Improving<strong>Compressed</strong> <strong>Air</strong> System Per<strong>for</strong>mance?Yes . . . . . . . . . . . . . . . . . . . . . . . . . . . . . . . . . . . . . . . . . . . . . . . . .1No . . . . . . . . . . . . . . . . . . . . . . . . . . . . . . . . . . . . . . . . . . . . . . . . .2IF CC4 = 1, Confirm name and address.Name: ....................................................................................................................Title: .......................................................................................................................Company:...............................................................................................................Address:.................................................................................................................Street Address: ......................................................................................................City: .......................................................................................................................State:..........................................................................Zip: .....................................END: THANK YOU VERY MUCH FOR YOUR TIME AND COOPERATION.A-12U.S. DEPARTMENT OF ENERGY
APPENDIX B: EXPERT ASSESSMENTBARCODE:ID:ZIPCODE:MARKET FOR COMPRESSED AIRSYSTEM EFFICIENCY SERVICESThe <strong>Compressed</strong> <strong>Air</strong> Challenge ® Program is conducting an assessment <strong>of</strong>compressed air system distributors and consultants to help guide its programef<strong>for</strong>ts and establish a baseline <strong>for</strong> evaluation <strong>of</strong> its ef<strong>for</strong>ts. Please take a fewminutes to complete this questionnaire. All answers are strictly confidential.<strong>Assessment</strong> results will be made available publicly in a few months.COMPANY CHARACTERISTICS1. LOCATION(S) OF YOUR COMPANYCITYSTATE2. TYPE OF COMPANY (Check most appropriate).❑ <strong>Compressed</strong> air equipment distributor ❑ Mechanical engineering❑ <strong>Compressed</strong> air system consultant/designer ❑ O<strong>the</strong>r (Specify_______)3. MARKET AREA FOR YOUR COMPANY❑ Local ❑ National ❑ Regional ❑ Global4. NUMBER OF EMPLOYEES: ____ ____ ____ ____5. ANNUAL SALES: $ ___ ___ ___ , ___ ___ ___ , ___ ___ ___6. PLEASE WRITE PERCENT OF 1998 REVENUES ACCOUNTEDFOR BY SERVICES LISTED BELOW IN THE SPACE PROVIDED.If you are unsure <strong>of</strong> share <strong>of</strong> revenues, simply check thoseservices that you provide.Service<strong>Compressed</strong> air equipment sales<strong>Compressed</strong> air parts sales<strong>Compressed</strong> air equipment service<strong>Compressed</strong> air system design<strong>Compressed</strong> air efficiency services (leak detection,compressed air system audits, system optimization, controls)O<strong>the</strong>r compressed air related services(Specify)_______________________Percent <strong>of</strong>1998 RevenuesU.S. DEPARTMENT OF ENERGYB-1
<strong>Compressed</strong> <strong>Air</strong> <strong>Market</strong> <strong>Assessment</strong>7. PLEASE CHECK THE INDUSTRIES THAT ACCOUNT FORMOST OF YOUR CUSTOMERS. Check a maximum <strong>of</strong> four.❑ Food Processing ❑ Petroleum Products ❑ Electronic Equipment❑ Textile Mill Products ❑ Rubber and Plastics ❑ Transportation Equpt❑ Paper & Allied Products❑ Primary Metals ❑ O<strong>the</strong>r _______❑ Printing ❑ Fabricated Metals ❑ O<strong>the</strong>r _______❑ Chemicals ❑ Industrial Equipment ❑ O<strong>the</strong>r _______EFFICIENCY SERVICESUse <strong>the</strong> grid below to mark your answers to <strong>the</strong> next three questions.1. WHICH OF THE EFFICIENCY SERVICES LISTED IN THE GRID BELOW DOYOU OFFER?2. IN WHAT YEAR DID YOU FIRST OFFER THE SERVICE?3. IS THE SERVICE OFFERED AS:• PART OF A SERVICE CONTRACT (Serv)?• A FREESTANDING ENGINEERING SERVICE (Eng)?• PART OF EQUIPMENT SALES (Eqpt)?Check all that apply.1 2 3Format <strong>of</strong> ServiceServiceOffer?(Check <strong>for</strong> Yes) Year First Offered Serv. Eng. Eqpt.Example X 1996 X XMeasurement <strong>of</strong> system flowand pressure<strong>Assessment</strong> <strong>of</strong> system efficiencyLeak management serviceUltrasonic leak detectionAnalysis <strong>of</strong> end-use reductionopportunitiesO<strong>the</strong>r (please specify)4. HAS THE VOLUME OF EFFICIENCY SERVICES YOU SELLINCREASED, DECREASED, OR REMAINED ABOUT THESAME OVER THE PAST YEAR?❑ Increased ❑ Decreased ❑ Remained <strong>the</strong> same5. HOW OFTEN DO YOU CONDUCT A COMPRESSED AIRNEEDS ASSESSMENT AS PART OF A SYSTEM SALESORDER OR BID RESPONSE?❑ In all sales and bid situations ❑ In some sales and bid situations❑ Never❑ In most sales and bid situations❑ In relatively few sales and bid situationsB-2U.S. DEPARTMENT OF ENERGY
APPENDIX B: EXPERT ASSESSMENTBARCODE:ID:ZIPCODE:6. HAVE YOU IMPLEMENTED A TRAINING PROGRAM IN ENERGY-EFFICIENT SYSTEM DESIGN FOR YOUR SALES STAFF?❑ Yes → In what year? 19_____ _____→ How <strong>of</strong>ten do you hold training sessions?❑ No7. WHAT KIND OF SPECIAL SKILLS, EQUIPMENT, AND OTHERRESOURCES ARE NEEDED TO DELIVER THESE SERVICESEFFECTIVELY? Enter one skill, piece <strong>of</strong> equipment, or o<strong>the</strong>rresource in each response box.Skills:Equipment:O<strong>the</strong>r resources:8. WHAT KIND OF BUSINESSES APPEAR TO BE MOSTRECEPTIVE TO PURCHASING COMPRESSED AIR SYSTEMEFFICIENCY SERVICES?Types <strong>of</strong> IndustriesExample: Textile millsTypes <strong>of</strong> Industries: 1.2.3.SizeLarge, Medium, SmallExample: Medium and largeSize 1.2.3.Size or complexity <strong>of</strong> CA system Example: Over 200 HP1.2.3.9. WHAT OBJECTIONS DO YOU ENCOUNTER MOSTFREQUENTLY IN TRYING TO SELL COMPRESSED AIRSYSTEM EFFICIENCY SERVICES?ObjectionsCustomer thinks <strong>the</strong> service costs too muchCustomer is skeptical about savingsCustomer believes service is already per<strong>for</strong>med by internal staffO<strong>the</strong>r (please specify)Checkif ApplicableU.S. DEPARTMENT OF ENERGYB-3
<strong>Compressed</strong> <strong>Air</strong> <strong>Market</strong> <strong>Assessment</strong>10.HOW IMPORTANT DO YOU THINK EFFICIENCY SERVICES AREIN ESTABLISHING THE COMPETITIVE POSITION OF YOURCOMPANY?1 2 3 4 5❑ ❑ ❑ ❑ ❑Not Somewhat VeryImportant Important Important11.WHAT ARE YOUR REASONS FOR THIS ASSESSMENT?_ _ _ _ _ _ _ _ _ _ _ _ _ _ _ _ _ _ _ _ _ _ _ _ _ _ _ _ _ _ _ _ _ _ _ _ _ _ _ _ _ _ _ _ _ _ _ _ _ _ _ _ _ _ _ _ _ _ _ _ _ _ _ _ _ _ _ _ _ _ _ _ _ _ _ _ _ _ _ _ _ _ __ _ _ _ _ _ _ _ _ _ _ _ _ _ _ _ _ _ _ _ _ _ _ _ _ _ _ _ _ _ _ _ _ _ _ _ _ _ _ _ _ _ _ _ _ _ _ _ _ _ _ _ _ _ _ _ _ _ _ _ _ _ _ _ _ _ _ _ _ _ _ _ _ _ _ _ _ _ _ _ _ _ __ _ _ _ _ _ _ _ _ _ _ _ _ _ _ _ _ _ _ _ _ _ _ _ _ _ _ _ _ _ _ _ _ _ _ _ _ _ _ _ _ _ _ _ _ _ _ _ _ _ _ _ _ _ _ _ _ _ _ _ _ _ _ _ _ _ _ _ _ _ _ _ _ _ _ _ _ _ _ _ _ _ __ _ _ _ _ _ _ _ _ _ _ _ _ _ _ _ _ _ _ _ _ _ _ _ _ _ _ _ _ _ _ _ _ _ _ _ _ _ _ _ _ _ _ _ _ _ _ _ _ _ _ _ _ _ _ _ _ _ _ _ _ _ _ _ _ _ _ _ _ _ _ _ _ _ _ _ _ _ _ _ _ _ _B-4U.S. DEPARTMENT OF ENERGY
ABOUT THE OFFICE OF INDUSTRIAL TECHNOLOGIESThe U.S. Department <strong>of</strong> Energy’s (DOE) Office <strong>of</strong> Industrial Technologies (OIT),through partnerships with industry, government, and non-governmentalorganizations, develops and delivers advanced energy efficiency, renewable energy, andpollution-prevention technologies <strong>for</strong> industrial applications. OIT is part <strong>of</strong> DOE’s Office <strong>of</strong> Energy<strong>Efficiency</strong> and Renewable Energy.OIT encourages industry-wide ef<strong>for</strong>ts to boost resource productivity through <strong>the</strong> Industries <strong>of</strong> <strong>the</strong>Future (IOF) strategy. The industry-led IOF strategy focuses on <strong>the</strong>se energy- and resource-intensiveindustries:Agriculture Aluminum ChemicalsForest Products Glass Metal CastingMining Petroleum SteelThese nine industries account <strong>for</strong> more than 80% <strong>of</strong> <strong>the</strong> manufacturing sector’s energy use.In addition, <strong>the</strong>y account <strong>for</strong> over 80% <strong>of</strong> <strong>the</strong> volume <strong>of</strong> all waste and pollution generated inmanufacturing, and about two-thirds <strong>of</strong> all pollution-control expenditures in manufacturing.To help industries begin saving energy, reducing costs, and cutting pollution right away, OIT <strong>of</strong>fersa comprehensive portfolio <strong>of</strong> emerging technologies, practices, tools, in<strong>for</strong>mation, and resourcesin a variety <strong>of</strong> application areas. Visit our Web site at www.oit.doe.gov to find out more about OITand how your company can get involved.ABOUT OIT’S BESTPRACTICES PROGRAMBestPractices is part <strong>of</strong> OIT’s Industries <strong>of</strong> <strong>the</strong> Future strategy. BestPracticesbrings toge<strong>the</strong>r <strong>the</strong> best-available and emerging technologies and practicesto help companies immediately begin improving energy efficiency, environmentalper<strong>for</strong>mance, and productivity.In addition to bringing emerging technologies closer to commercialization, BestPractices focuseson plant systems, where significant efficiency improvements and savings can be achieved. Industrygains easy access to near-term and long-term solutions <strong>for</strong> improving <strong>the</strong> per<strong>for</strong>mance <strong>of</strong> motor,steam, compressed air, and process heating systems. The Industrial <strong>Assessment</strong> Centers providecomprehensive industrial energy evaluations to small- and medium-sized manufacturers.BestPractices also works with an extensive network <strong>of</strong> Allied Partners to help deliver energyefficiency in<strong>for</strong>mation to industry. Allied Partners enhance <strong>the</strong> IOF strategy by working with <strong>the</strong>seindustries to adopt proven technologies and best energy management practices.BestPractices <strong>of</strong>fers a wide range <strong>of</strong> resources—including s<strong>of</strong>tware, training, tip sheets, casestudies, sourcebooks, and a bi-monthly newsletter—to industry on how to take advantage <strong>of</strong>energy- and cost-saving opportunities in <strong>the</strong>ir facilities.To learn more about BestPractices, visit our Web site at www.oit.doe.gov/bestpractices.ABOUT THE COMPRESSED AIR CHALLENGE ®The <strong>Compressed</strong> <strong>Air</strong> Challenge ® (CAC) is a non-pr<strong>of</strong>it corporationthat is a collaboration <strong>of</strong> industrial users <strong>of</strong> compressed air and <strong>the</strong>irassociations; equipment manufacturers, distributors and <strong>the</strong>ir associations; <strong>the</strong> U.S. Department<strong>of</strong> Energy; state research and development agencies; utility companies, and energy efficiencyorganizations. The purpose <strong>of</strong> <strong>the</strong> CAC is to educate both users and suppliers <strong>of</strong> industrialcompressed air systems on <strong>the</strong> benefits <strong>of</strong> taking a “systems approach” as set <strong>for</strong>th in trainingmaterials, publications, s<strong>of</strong>tware, and o<strong>the</strong>r media. The CAC takes a strict “solutions neutral”approach as an unbiased source <strong>of</strong> in<strong>for</strong>mation. For more in<strong>for</strong>mation, visit our Web site atwww.compressedairchallenge.org.
For additional in<strong>for</strong>mation, please contact:OIT ClearinghousePhone: (800) 862-2086Fax: (360) 586-8303clearinghouse@ee.doe.govVisit our Web site atwww.oit.doe.gov/bestpracticesOffice <strong>of</strong> Industrial TechnologiesEnergy <strong>Efficiency</strong> and Renewable EnergyU.S. Department <strong>of</strong> EnergyWashington, DC 20585-0121DOE/GO-102001-1197June 2001Printed with a renewable-source ink on paper containingat least 50% wastepaper, including 20% post consumer waste.