Sustainability r e p o r t - Sabesp
Sustainability r e p o r t - Sabesp
Sustainability r e p o r t - Sabesp

You also want an ePaper? Increase the reach of your titles
YUMPU automatically turns print PDFs into web optimized ePapers that Google loves.
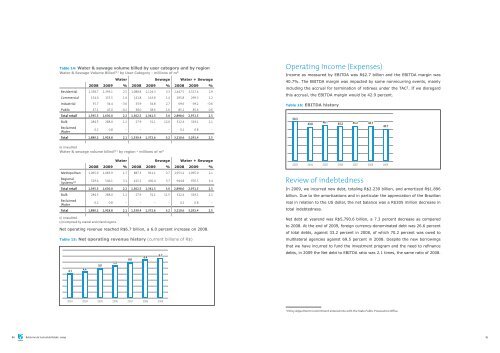
Table 14: Water & sewage volume billed by user category and by regionWater & Sewage Volume Billed (1) by User Category - millions of m 3Water Sewage Water + Sewage2008 2009 % 2008 2009 % 2008 2009 %Residential 1,358.7 1,393.1 2.5 1,088.8 1,124.3 3.3 2,447.5 2,517.4 2.9Commercial 154.0 155.5 1.0 141.8 143.8 1.4 295.8 299.3 1.2Industrial 35.7 34.4 -3.6 33.9 34.8 2.7 69.6 69.2 -0.6Public 47.1 47.0 -0.2 38.0 38.6 1.6 85.1 85.6 0.6Total retail 1,595.5 1,630.0 2.2 1,302.5 1,341.5 3.0 2,898.0 2,971.5 2.5Bulk 284.5 288.0 1.2 27.9 31.1 12.0 312.4 319.1 2.1ReclaimedWater0.2 0.8 - - - - 0.2 0.8 -Total 1,880.2 1,918.8 2.1 1,330.4 1,372.6 3.2 3,210.6 3,291.4 2.5Operating Income (Expenses)Income as measured by EBITDA was R$2.7 billion and the EBITDA margin was40.7%. The EBITDA margin was impacted by some nonrecurring events, mainlyincluding the accrual for termination of retirees under the TAC 2 . If we disregardthis accrual, the EBITDA margin would be 42.9 percent.Table 16: EBITDA history50.346.143.844.3 45.2 44.740.7(1) UnauditedWater & sewage volume billed (1) by region - millions of m 3Water Sewage Water + Sewage2008 2009 % 2008 2009 % 2008 2009 %Metropolitan 1,065.9 1,083.9 1.7 887.3 911.1 2.7 1,953.2 1,995.0 2.1RegionalSystems (2) 529.6 546.1 3.1 415.2 430.4 3.7 944.8 976.5 3.4Total retail 1,595.5 1,630.0 2.2 1,302.5 1,341.5 3.0 2,898.0 2,971.5 2.5Bulk 284.5 288.0 1.2 27.9 31.1 11.5 312.4 319.1 2.1ReclaimedWater0.2 0.8 - - - - 0.2 0.8 -Total 1,880.2 1,918.8 2.1 1,330.4 1,372.6 3.2 3,210.6 3,291.4 2.5(1) Unaudited(2) Comprised by coastal and inland regions.Net operating revenue reached R$6.7 billion, a 6.0 percent increase on 2008.Table 15: Net operating revenue history (current billions of R$)4x1 4.14.45.05.56.06.46.72003 2004 2005 2006 2007 2008 2009Review of indebtednessIn 2009, we incurred new debt, totaling R$2.239 billion, and amortized R$1.896billion. Due to the amortizations and in particular the appreciation of the Brazilianreal in relation to the US dollar, the net balance was a R$305 million decrease intotal indebtedness.Net debt at yearend was R$5,790.6 billion, a 7.3 percent decrease as comparedto 2008. At the end of 2009, foreign currency-denominated debt was 26.6 percentof total debts, against 33.2 percent in 2008, of which 70.2 percent was owed tomultilateral agencies against 69.5 percent in 2008. Despite the new borrowingsthat we have incurred to fund the investment program and the need to refinancedebts, in 2009 the Net debt to EBITDA ratio was 2.1 times, the same ratio of 2008.20032004200520062007200820092Policy Adjustment Commitment entered into with the State Public Prosecution Office.86 Relatório de Sustentabilidade 2009 87

![MBBR ppt for Pulp&Paper, Sabesp, Oct 3, 2008 [Somente leitura]](https://img.yumpu.com/34976291/1/190x135/mbbr-ppt-for-pulppaper-sabesp-oct-3-2008-somente-leitura.jpg?quality=85)