The Biodiversity Atlas of British Columbia - Biodiversity BC
The Biodiversity Atlas of British Columbia - Biodiversity BC
The Biodiversity Atlas of British Columbia - Biodiversity BC

You also want an ePaper? Increase the reach of your titles
YUMPU automatically turns print PDFs into web optimized ePapers that Google loves.
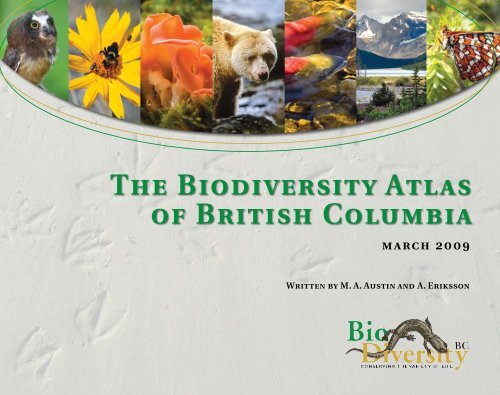
the biodiversity atlas <strong>of</strong> british columbiai<strong>The</strong> <strong>Biodiversity</strong> <strong>Atlas</strong><strong>of</strong> <strong>British</strong> <strong>Columbia</strong>march 2009Written by M. A. Austin and A. Eriksson
<strong>The</strong> <strong>Biodiversity</strong> <strong>Atlas</strong><strong>of</strong> <strong>British</strong> <strong>Columbia</strong>march 2009Written by M. A. Austin and A. Eriksson
table <strong>of</strong> contentsvIndustrial Operations 116Contaminated Sites and Landfills 116Emissions <strong>of</strong> Nitrogen Oxides 118Emissions <strong>of</strong> Sulphur Oxides 120Water Pollution 122Glossary 124Endnotes 127List <strong>of</strong> Figuresfigure 1. Vintage <strong>of</strong> Baseline <strong>The</strong>matic Mapping (version 1 & 2 merged) and Terrain ResourcesInformation Management Mapping. 6figure 2. How to read the maps. 7figure 3. Land cover types in B.C. as percentage <strong>of</strong> total area <strong>of</strong> province. 14figure 4. <strong>The</strong> world’s water supply. 28figure 5. Historic (a) and current (b) species richness for 17 carnivore and ungulate species that haveundergone significant range contractions in North America. 52figure 6. Population growth for B.C. (1861-2006) with a projection to 2031. 78figure 7. Trends in the number <strong>of</strong> alien vascular plant species established in B.C. 84figure 8. Trends in the number <strong>of</strong> alien freshwater fish species established in B.C. 86figure 9. Comparison in year to year variation in average minimum temperature for Februaryfor Quesnel and Victoria. 90figure 10. Forests in B.C. affected by mountain pine beetle with projections to 2018. 102figure 11. Potential loss <strong>of</strong> fish habitat owing to stream crossings that block fish passage. 108figure 12. Human-initiated sources <strong>of</strong> nitrogen oxides in B.C. 118figure 13. Human-initiated sources <strong>of</strong> sulphur oxides in B.C. 120figure 14. Comparison <strong>of</strong> stream magnitude and order. 122List <strong>of</strong> Mapsmap 1. Example <strong>of</strong> biodiversity spatial analysis units 4map 2. Major topographic features 9map 3. Elevation 11
vithe biodiversity atlas <strong>of</strong> british columbiamap 4. Standard climate variables 13map 5. Land cover 15map 6. Net primary productivity 17map 7. Ecoprovinces and ecosections 19map 8. Biogeoclimatic ecosystem classification - zones 21map 9. Biogeoclimatic zones <strong>of</strong> conservation concern 23map 10. Biogeoclimatic zones for which B.C. has the majority <strong>of</strong> the global range 25map 11. Ecosystem mapping as <strong>of</strong> 2006 27map 12. Major Drainage Areas 29map 13. Major Drainage Areas <strong>of</strong> conservation concern 31map 14. Parks, protected areas and conservation lands 33map 15. Species richness 37map 16. Terrestrial species richness 38map 17. Freshwater species richness 39map 18. Species richness: species <strong>of</strong> global conservation concern 41map 19. Species richness: species <strong>of</strong> provincial conservation concern 43map 20. Species richness: species with a majority <strong>of</strong> their global range in B.C. 45map 21. Species richness: amphibians 47map 22. Species richness: perching birds 49map 23. Species richness: freshwater fishes 51map 24. Species richness: mammals 53map 25. Species richness: reptiles and turtles 55map 26. Species richness: insects 57map 27. Species richness: butterflies 59map 28. Species richness: dragonflies and damselflies 61map 29. Species richness: selected freshwater crustaceans (diaptomid copepods) 63map 30. Species richness: vascular plants 65map 31. Species richness: mosses 67map 32. Species richness: lichens 69map 33. Selected special elements: species 73map 34. Selected special elements: ecosystems 75map 35. Human footprint index 77map 36. Human population density 79
table <strong>of</strong> contentsviimap 37. Terrestrial ecosystem conversion 81map 38. Number <strong>of</strong> terrestrial and freshwater alien species 83map 39. Number <strong>of</strong> terrestrial alien species 85map 40. Number <strong>of</strong> freshwater alien species 87map 41. Absolute rate <strong>of</strong> change in minimum temperature (average <strong>of</strong> all months) from 1971 to 2000 89map 42. Relative rate <strong>of</strong> change in minimum temperature (average <strong>of</strong> all months) from 1971 to 2000 91map 43. Absolute rate <strong>of</strong> change in maximum temperature (average <strong>of</strong> all months) from 1971 to 2000 93map 44. Relative rate <strong>of</strong> change in maximum temperature (average <strong>of</strong> all months) from 1971 to 2000 94map 45. Absolute rate <strong>of</strong> change in precipitation (average <strong>of</strong> all months) from 1971 to 2000 96map 46. Relative rate <strong>of</strong> change in precipitation (average <strong>of</strong> all months) from 1971 to 2000 97map 47. Seasonal trends in minimum temperature from 1971 to 2000 99map 48. Seasonal trends in maximum temperature from 1971 to 2000 100map 49. Seasonal trends in precipitation from 1971 to 2000 101map 50. Area <strong>of</strong> forests more than 10% impacted by mountain pine beetle 103map 51. Logged since the 1970s 105map 52. Density <strong>of</strong> roads and other linear development features 107map 53. Density <strong>of</strong> road crossings on fish-bearing streams 109map 54. Water diversion index 111map 55. Areas upstream <strong>of</strong> a dam 113map 56. Oil and gas sites density 115map 57. Contaminated sites and landfills density 117map 58. Nitrogen oxides emissions density 119map 59. Sulphur oxides emissions density 121map 60. Water pollution index 123List <strong>of</strong> Tablestable 1. Size distribution for biodiversity spatial analysis units. 3table 2. Areal extent <strong>of</strong> biogeoclimatic zones in B.C. 20table 3. Conservation status <strong>of</strong> biogeoclimatic zones in B.C. 22table 4. Classification system for proportion <strong>of</strong> global range: ecosystems. 24table 5. Provincial conservation status <strong>of</strong> ecological communities in B.C. by biogeoclimatic zone. 26table 6. Provincial conservation status <strong>of</strong> Major Drainage Areas in B.C. 30
viiithe biodiversity atlas <strong>of</strong> british columbiatable 7. Protected areas in B.C. 32table 8. Native terrestrial and freshwater species in B.C. assessed for species richness. 36table 9. Summary <strong>of</strong> B.C. native species by global and provincial conservation status. 40table 10. Classification system for proportion <strong>of</strong> global range: species. 44table 11. Native amphibians <strong>of</strong> conservation concern in B.C. 46table 12. Native perching birds <strong>of</strong> conservation concern in B.C. 48table 13. Endemic freshwater fishes in B.C. currently without formal scientific species names. 50table 14. Native reptiles and turtles <strong>of</strong> conservation concern in B.C. 54table 15. B.C. native insect groups included on Map 26. 56table 16. Native butterfly and skipper species <strong>of</strong> global conservation concern in B.C. 58table 17. Diaptomid copepods found in saline lakes in B.C. 62table 18. Native vascular plants in B.C. included on Map 30. 64table 19. Conservation status <strong>of</strong> some endemic mosses in B.C. 66table 20. Some B.C. lichen species endemic to the Pacific Northwest region. 68table 21. Selected special elements <strong>of</strong> biodiversity related to species in B.C. 72table 22. Selected special elements <strong>of</strong> biodiversity related to ecosystems in B.C. 74table 23. Area <strong>of</strong> terrestrial ecosystem conversion in B.C. since European contact. 80table 24. Alien species in B.C. included on Maps 38 to 40. 82table 25. Terrestrial alien species richness for biogeoclimatic zones in B.C. 84table 26. Freshwater alien species richness for Major Drainage Areas in B.C. 86table 27. Percentage <strong>of</strong> land logged in B.C. since the 1970s by biogeoclimatic zone. 104table 28. Density and presence <strong>of</strong> roads or other linear features for B.C.’s biogeoclimatic zones. 106table 29. Surface water allocation in B.C. by Major Drainage Area. 110table 30. Density <strong>of</strong> oil and gas sites in B.C. by biogeoclimatic zone. 114table 31. Water pollution index values for Major Drainage Areas in B.C. 122
xthe biodiversity atlas <strong>of</strong> british columbia<strong>The</strong> <strong>Atlas</strong> is designed to serve as a companion document to Taking Nature’s Pulse: <strong>The</strong> Status <strong>of</strong> <strong>Biodiversity</strong>in <strong>British</strong> <strong>Columbia</strong> – a comprehensive scientific assessment <strong>of</strong> biodiversity in the province. Both the <strong>Atlas</strong> andTaking Nature’s Pulse are projects <strong>of</strong> <strong>Biodiversity</strong> <strong>BC</strong>, a partnership <strong>of</strong> conservation groups and governmentagencies.Although there are currently a wide variety <strong>of</strong> conservation tools and measures in place to conserve biodiversityin B.C., <strong>The</strong> <strong>Biodiversity</strong> <strong>Atlas</strong> <strong>of</strong> <strong>British</strong> <strong>Columbia</strong> does not attempt to provide an assessment <strong>of</strong> these. Itspurpose is to present maps illustrating aspects <strong>of</strong> biodiversity in the province and related threats from humanactivity. An assessment <strong>of</strong> the extent to which management tools have proven to be effective in maintainingbiodiversity is something that can better be done in the context <strong>of</strong> determining future priorities and actions forbiodiversity conservation.Garibaldi Provincial Park.photo: david p. lewisGrizzly bear (Ursus arctos) with salmon.photo: stephen schwartzSandhill cranes (Grus canadensis).photo: frank leung
the biodiversity atlas <strong>of</strong> british columbiaXAcknowledgements<strong>The</strong> preparation <strong>of</strong> <strong>The</strong> <strong>Biodiversity</strong> <strong>Atlas</strong> <strong>of</strong> <strong>British</strong> <strong>Columbia</strong> was overseen by <strong>Biodiversity</strong> <strong>BC</strong>’s Technical Subcommittee.<strong>The</strong> technical subcommittee consists <strong>of</strong>:• Matt Austin, B.C. Ministry <strong>of</strong> Environment;• Dan Buffett, Ducks Unlimited Canada;• Dave Nicolson, formerly with Nature Conservancy <strong>of</strong> Canada;• Ge<strong>of</strong>f Scudder, <strong>The</strong> Nature Trust <strong>of</strong> <strong>British</strong> <strong>Columbia</strong>; and• Victoria (Tory) Stevens, B.C. Ministry <strong>of</strong> Environment.<strong>The</strong> <strong>Biodiversity</strong> <strong>BC</strong> secretariat supports the work <strong>of</strong> the Steering Committee and the Technical Subcommittee andprovides ongoing strategic advice. <strong>The</strong> secretariat includes Stuart Gale as Executive Director and Janet Fontaineas Coordinator. <strong>Biodiversity</strong> <strong>BC</strong> would like to thank the following people who contributed data, expertise, reviewcomments, and many hours <strong>of</strong> time into making <strong>The</strong> <strong>Biodiversity</strong> <strong>Atlas</strong> <strong>of</strong> <strong>British</strong> <strong>Columbia</strong> a reality:Marian AdairMartin AnPia ArchibaldTamsin BakerDoug BiffordDavid BronaughFrank BrownTony ButtonCarmen CadrinKristine CirunaDianna ColnettAndrew CouturierChris DalleyTed DownJenny FraserMalcolm GrayGe<strong>of</strong>f HainesAndrew HarcombeBruce HarrisonDaryll HebertPierre IachettiGe<strong>of</strong>frey JohnsonWilliam JolleyAlan KenneyJan KirkbyTed LeaKaaren LewisGraham MacGregorWill MacKenzieDave MintyKathleen MooreAnn MorrisonTrevor MurdockRemi OdenseCarol OgborneBob PeartJenifer PennySusan PinkusLeah RamsayMichael RensingEva RicciusJim ShinkewskiLiz StanlakeDavid TeschMei-Ching TsoiWilliam UnwinJim WalkerAdrian WaltonArelia WernerLiz WilliamsRalph WinterHeather Wornellxi
xiithe biodiversity atlas <strong>of</strong> british columbiaAnd to those who made special contributions:Writing and editing support: Alison Leslie and David GreerSpatial analysis: Anne Downton, Emily Gouge, Kevin Neufeld and Paul RamseyMap production: Ann Blyth and Ian LaingDesign, production and printing: Arifin Graham, Michael Love and Eric HughesWe thank you all.Matt Austin, Ann Eriksson and the <strong>Biodiversity</strong> <strong>BC</strong> Steering Committee, Technical Subcommittee.<strong>Biodiversity</strong> <strong>BC</strong> Partner Groups: <strong>The</strong> Nature Trust <strong>of</strong> <strong>British</strong> <strong>Columbia</strong>, B.C. Ministry <strong>of</strong> Environment, B.C.Ministry <strong>of</strong> Agriculture and Lands, Ducks Unlimited Canada, Nature Conservancy <strong>of</strong> Canada, EnvironmentCanada, Habitat Conservation Trust Foundation, Metro Vancouver (representing the Union <strong>of</strong> <strong>British</strong> <strong>Columbia</strong>Municipalities), <strong>The</strong> Land Conservancy <strong>of</strong> <strong>British</strong> <strong>Columbia</strong>, Pacific Salmon Foundation, Ecojustice (representingenvironmental non-governmental organizations).**Previously represented by Canadian Parks and Wilderness Society.
the biodiversity atlas <strong>of</strong> british columbia 1Introduction<strong>British</strong> <strong>Columbia</strong>, Canada’s westernmost province, is famous for its abundance and diversity <strong>of</strong> life. Underthe influence <strong>of</strong> the Pacific Ocean and with mountainous terrain that covers most <strong>of</strong> the land base,the province has a rich variety <strong>of</strong> life that is unparalleled in the rest <strong>of</strong> Canada. Large tracts <strong>of</strong> relativelyundisturbed land support populations <strong>of</strong> large carnivores and ungulates, the country’s only temperate rainforestsproduce giant trees the height <strong>of</strong> skyscrapers, and unique populations <strong>of</strong> fish have evolved in isolationsince the last ice age. Millions <strong>of</strong> migrating birds and populations <strong>of</strong> marine mammals travel along the coastevery year, stopping over to feed or rest. Thousands <strong>of</strong> smaller species that inhabit the wide variety <strong>of</strong> ecosystemsfrom the sea to the mountain tops go largely unnoticed: insects and amphibians, lichens and reptiles,fungi and flowering plants and more; yet all are important components <strong>of</strong> <strong>British</strong> <strong>Columbia</strong>’s natural legacy.This variety <strong>of</strong> life in all its forms is termed biodiversity: the variety <strong>of</strong> species and ecosystems on Earth andthe ecological processes <strong>of</strong> which they are a part – including ecosystem, species and genetic diversity components.1 <strong>The</strong> <strong>Biodiversity</strong> <strong>Atlas</strong> <strong>of</strong> <strong>British</strong> <strong>Columbia</strong> provides a map-based, province-wide overview for a selection<strong>of</strong> ecosystems and species in both the terrestrial and freshwater realms. Not included in this atlas are speciesand ecosystems that are exclusively in the marine realm. <strong>The</strong> marine realm is currently part <strong>of</strong> comprehensiveplanning initiatives under the auspices <strong>of</strong> the Canada Oceans Act and led by Fisheries and Oceans Canada. a Alsoincluded are maps <strong>of</strong> a number <strong>of</strong> threats currently affecting biodiversity in the province. <strong>The</strong> <strong>Atlas</strong> is a companiondocument to Taking Nature’s Pulse: <strong>The</strong> Status <strong>of</strong> <strong>Biodiversity</strong> in <strong>British</strong> <strong>Columbia</strong> and Ecological Concepts,Principles and Applications to Conservation. Collectively these publications are intended to guide government andnon-government organizations and citizens in taking action to conserve biodiversity.<strong>The</strong> variety <strong>of</strong> life in all its forms istermed biodiversity.photo: rick jones.aSee Pacific Ocean status reports at: www.pac.dfo-mpo.gc.ca/SCI/psarc/OSRs/Ocean_SSR_e.htm.
introductionWhile the best available data was used in the development <strong>of</strong> the <strong>Atlas</strong>, the process has illuminated some gaps inour knowledge. More data has been collected near urban areas and roads, some areas <strong>of</strong> the province have never beensurveyed, distribution and population studies have been limited in the past due to a focus on species <strong>of</strong> commercialimportance, and genetic diversity has not been well studied. It is important to keep these limitations in mind whileviewing the maps.How to Read the <strong>Biodiversity</strong> <strong>Atlas</strong><strong>The</strong> <strong>Biodiversity</strong> <strong>Atlas</strong> <strong>of</strong> <strong>British</strong> <strong>Columbia</strong> is divided into four sections. <strong>The</strong> first section, Ecosystems, presents maps thatcharacterize the province in a variety <strong>of</strong> ways from topography to land cover, including commonly used classificationsystems. Section two, Species, summarizes known biological data for native species in the province using richnessanalyses. <strong>The</strong> third section, Special Elements <strong>of</strong> <strong>Biodiversity</strong>, describes and maps some elements <strong>of</strong> biodiversity thatare nationally or globally significant. Section four, Threats to <strong>Biodiversity</strong>, examines the major stresses to biodiversityand human-induced sources <strong>of</strong> those stresses, including climate change.References are cited by number (e.g., 3 ) and provided in order at the end <strong>of</strong> the document in the section titled Notesbeginning on page 127. Cross-references within the <strong>Atlas</strong> are indicated by a page number (e.g., p. 5). Footnotes areindicated by letter (e.g., a ) and provided at the bottom <strong>of</strong> the relevant page. All glossary items are highlighted in greenwhen first used from this point forward in the body <strong>of</strong> the text and defined in the glossary which begins on page 124.Scientific names are given only with the first mention <strong>of</strong> a species within the body <strong>of</strong> the text. Species common namesare not capitalized except for proper nouns (e.g., great blue heron; Oregon spotted frog). Units <strong>of</strong> measurement areabbreviated (e.g., 2 metres = 2 m, 10 kilometres = 10 km).How the Maps Were Created<strong>The</strong> maps presented in the <strong>Atlas</strong> were created using a variety <strong>of</strong> methods. <strong>The</strong> ecosystem maps (pp. 8-33) and the specialelements maps (pp. 71-75) are simply displays <strong>of</strong> existing datasets applied to the <strong>Atlas</strong> format. Sources for thesedata sets are listed on each map. <strong>The</strong> maps for species richness (pp.35-69) and the maps for threats to biodiversity(pp. 76-123) were developed specifically for the <strong>Atlas</strong> using detailed analyses as outlined below.Maps for Species RichnessSpecies richness is a common measure <strong>of</strong> biodiversity calculated as the number <strong>of</strong> species within a specific area <strong>of</strong>interest. An area <strong>of</strong> high species richness supports a larger number <strong>of</strong> different species than an area <strong>of</strong> low richness.To produce the species richness display on a map, the province was divided into 1,208 grid cells, based on the 1:50,000
the biodiversity atlas <strong>of</strong> british columbia 3National Topographic System map sheet grid, and the number <strong>of</strong> species in each grid cell counted. Eachgrid cell corresponds to a particular area in B.C. ranging in size from 780 km 2 to 1,030 km 2 . 2 <strong>The</strong> grid cellsrange in size because they follow lines <strong>of</strong> latitude and longitude along the curvature <strong>of</strong> the earth.<strong>The</strong> number <strong>of</strong> species in each <strong>of</strong> the 1,208 grid cells was counted electronically using computerizedlocation data from surveys and incidental sightings. Inventory has been particularly limited for some groups<strong>of</strong> species [i.e., amphibians (p. 46), perching birds (p. 48), reptiles and turtles (p. 54), insects (p. 56), butterflies(p.58), damselflies and dragonflies (p. 60), and crustaceans (p. 62)]. This limitation is reflected in the maps,and evident as areas categorized as ‘no observations’. Data was available for 2,640 species <strong>of</strong> vertebrates,invertebrates, and vascular and non-vascular plants native to B.C. Only species locations recorded between1961 and 2006 were included in the analysis because historic occurrences may no longer be representative <strong>of</strong>current species locations due to pressures from land use and climate change. Once the species were counted,each grid cell was coloured according to the categories specific to each map as outlined in the map legend.See Understanding the Maps on the following two pages for further explanation <strong>of</strong> the map categories.Maps for Threats to <strong>Biodiversity</strong>This series <strong>of</strong> maps required the creation <strong>of</strong> analysis units for calculating measures such as road density. Tobegin, overlays <strong>of</strong> ecosections 3 (p. 18), biogeoclimatic subzones and variants 4 (p. 20), and third-order watersheds5,6 were performed. <strong>The</strong> areas occupied by unique combinations <strong>of</strong> the polygons from the three layers(biogeoclimatic subzones/variant x ecosections x watersheds) were used as the basic biodiversity spatialanalysis units (analysis units) (Map 1). <strong>The</strong> resulting distribution across the province was 72,335 polygonsranging in size from 1 km 2 to 1,530 km 2 with 96% less than 50 km 2 (Table 1). Small areas <strong>of</strong> overlap (less than1 km 2 ) were merged into larger neighbouring polygons.<strong>The</strong> calculations within analysis units were carried out using a computerized grid approach to data processingand summarization called Hectares <strong>BC</strong>. 7 <strong>The</strong> province was divided into approximately 95 million onehectaresquares (100 m on a side), also called a raster grid. Specific maps were generated by superimposingone or more data layers <strong>of</strong> interest (e.g., area recently logged) over the raster grid system. Data for each gridsquare was determined (e.g., recently logged or not recently logged) and summary measurements were thencalculated for each analysis unit using a specific formula designed for that feature based on the data attribute.For example, the map for percentage land logged since the 1970s (p. 105) was calculated using the formula:[(total area <strong>of</strong> all grid cells in an analysis unit that were recently logged minus water area) divided by (totalarea <strong>of</strong> the analysis unit minus water area) x 100]. <strong>The</strong> analysis unit is then coloured on the map according tothe legend scale for each map described in detail in Understanding the Maps (p. 5).table 1. size distribution forbiodiversity spatial analysis unitsAreaNumber <strong>of</strong> polygons1 – 10 50,20911 – 20 11,21821 – 30 4,31931 – 40 2,15641 – 50 1,22151 – 60 73561 – 70 54071 – 80 34081 – 90 26191 – 100 199101 – 110 147111 – 120 121121 – 130 89131 – 140 98141 – 150 75151 – 160 55161 – 170 48171 – 180 44181 – 190 47191– 200 37201 – 210 28211 – 220 27221 – 230 19231 – 240 15241 – 250 12251 – 260 10261 – 270 12271 – 280 19281 – 290 12291 – 300 10301 – 1,530 212Total 72,335
the biodiversity atlas <strong>of</strong> british M AcolumbiaP 1tExample <strong>of</strong>biodiversity spatialanalysis unitsLegendRoadRiver/Stream50°NO k a n agan La k eKelownaEnlargement Area50°NLakeEcosectionsWatershedsBiogeoclimatic EcosystemClassification Variant!.Enlargement 1: Ecosection, watershed andBiogeoclimatic Ecosystem Classification variantboundariesEnlargement 2: <strong>Biodiversity</strong> and spatial analysis units*Area <strong>of</strong> Detail0 5 10KilometresData sources:Biogeoclimatic EcosystemClassification (v. 6.0), Freshwater<strong>Atlas</strong> (3 rd order watersheds),Ecoregions (v. 2.01)Map by:Caslys Consulting LtdProjection:<strong>BC</strong> Albers NAD83Produced for:*Each colour denotes a separate analysis unit.January 29, 2009120°W
the biodiversity atlas <strong>of</strong> british columbia 5<strong>The</strong> measurement units for the absolute values resulting from each calculation vary for each specific map andcan be expressed as a proportion, a percentage, a density (i.e., km/km 2 ) or an index value. Index values are expressedin units unique for the particular map, each explained in the accompanying text. For example, the water pollutionindex (p. 122) is expressed as a number, where the potential for water pollution impacts based on provincial dischargepermits increases as the index number increases.Understanding the Maps<strong>The</strong> maps for species and for threats consist <strong>of</strong> a main map and a smaller inset map, which present the data in twodifferent ways. <strong>The</strong>se two cartographic approaches for presenting data were used to meet three sometimes conflictinggoals: following consistent mapping methods; allowing for comparisons between maps; and accurately representingthe distribution <strong>of</strong> data values, while showing spatial variation within B.C.<strong>The</strong> main map uses ten percentile classes, b,c each <strong>of</strong> which generally incorporates the same number <strong>of</strong> analysis units. dIn effect, one-tenth <strong>of</strong> the analysis units are in each percentile class no matter what range <strong>of</strong> values are represented. eFor example, if an analysis unit has a road density (p. 107) that is greater than or equal to 60% <strong>of</strong> the other analysisunits, it is in the 60 th percentile.Many maps have an inset in the lower left corner comparing mapping <strong>of</strong> the same data using an equal interval approach,in which the data are divided into 10 equally spaced classes based on the range <strong>of</strong> the measurements, whereeach class may contain a different number <strong>of</strong> analysis units. For example, the road density values (p. 107) range from0-22.1 km/km 2 , so the first class contains all analysis units with a value between 0 and 2.21 km/km 2 , the second classcontains all analysis units with a value between 2.22 and 4.42 km/km 2 etc. In some cases, the data is grouped into categoriesbased on regular breaks in the data rather than equal spacing. For example, breaks for the equal interval classesused for the species richness map (p. 37) were approximately 93 species per category (4-98; 99-191 etc). Equal intervalclassification <strong>of</strong>ten results in a significantly different spatial distribution <strong>of</strong> the data than when classed by percentile.bIn order to convert the absolute values <strong>of</strong> the analysis units to percentiles, all summary data values for the analysis units were sorted fromlowest to highest and ranked starting with 1. <strong>The</strong> ranks were then converted to a percentile using the formula: rank-1/total number <strong>of</strong> analysisunits.cMost <strong>of</strong> the maps use ten categories. Exceptions occur for the climate change seasonal trends maps (pp.99-101), and maps for areas upstream<strong>of</strong> a dam (p.113), nitrogen oxides emissions density (p.119), and sulphur oxides emission density (p.121), all <strong>of</strong> which have less than 10 categories.Some <strong>of</strong> the native species richness maps (pp.36-69) have 11 classes because “no observations” was treated as a separate class.dExceptions to the rule <strong>of</strong> each percentile class having the same number <strong>of</strong> analysis units occurred in cases where more than one-tenth <strong>of</strong>the analysis units had the same value (this happened where large numbers <strong>of</strong> analysis units had 0 values such as for road density). In thoseinstances the remaining classes have an equal number <strong>of</strong> analysis units that is less than one-tenth <strong>of</strong> the total number (e.g., if the first classincluded 55% <strong>of</strong> analysis units all tied with a value <strong>of</strong> 0 the remaining 9 classes would each have 5% <strong>of</strong> the analysis units).e<strong>The</strong> analysis units vary in size and therefore, one-tenth <strong>of</strong> analysis units does not necessary equal one-tenth <strong>of</strong> the area <strong>of</strong> the province.
introductionEach category <strong>of</strong> corresponding percentiles (or equal interval classes) for a single analysis unit was translated intocolours on the map. For example, on species richness maps (pp. 36-69), analysis units with the highest category <strong>of</strong> richnessvalues are coloured dark green, those with the lowest richness values are dark brown. No colour (grey backgroundshade is visible) means either that the attribute data is not present or that the data is deficient for the analysis unit.BTM Land BTM Use Land Vintage Use Vintage1991 19911992 19921993 19931994 19941995 19951996 19961997 1997Data Sources<strong>The</strong> data analyzed and presented on the maps came from a variety <strong>of</strong> sources, summarized in the lower right handcorner <strong>of</strong> each map.<strong>The</strong> base maps were developed from the Natural ResourcesCanada 1:7,500,000 scale National <strong>Atlas</strong> and baseTRIM 1 Land TRIM Use 1 Land Vintage Use Vintage1979 19791981 1981data distributed with Environmental Systems Research1982 19821984 1984Institute’s (ESRI) ArcMap s<strong>of</strong>tware (www.esri.com). <strong>The</strong>1985 1985political boundaries, roads, rivers, lakes and city locationscame from the National <strong>Atlas</strong>. 8 <strong>The</strong> grey hillshade1986 19861987 19871988 1988(used to depict the land) and the bathymetric data (usedto depict the ocean) came from the ESRI dataset.<strong>The</strong> map has been projected to the province’s standardmap projection which is <strong>BC</strong> Albers using NorthAmerican Datum 1983.Two important sources <strong>of</strong> provincial land cover andland use data are the Baseline <strong>The</strong>matic Mapping (BTMversion 1&2) 9 and Terrain Resources Information ManagementMapping (TRIM). 10 Figure 1 shows the dates <strong>of</strong>BTM and TRIM mapping which vary across the province.Note that neither has been updated in some time, thereforethis time period is a limitation for some <strong>of</strong> the mapsin the Ecosystem and Threats sections.figure 1: Vintage <strong>of</strong> Baseline <strong>The</strong>matic Mapping (version 1 & 2 merged) and TerrainResources Information Management Mapping.source: B.C. Integrated Land Management Bureau. Baseline <strong>The</strong>matic Mapping. Available at:ilmbwww.gov.bc.ca/cis/initiatives/ias/btm/index.html; B.C. Integrated Land Management Bureau.Terrain Resources Information Management Mapping. Available at: ilmbwww.gov.bc.ca/bmgs/products/mapdata/trim_enhanced_map.htm.
the biodiversity atlas <strong>of</strong> british columbia 7figure 2: How to read the mapsTitle <strong>of</strong> map.60°NY u k o n130°W 120°WN o r t h w e s tT e r r i t o r i e st110°W60°NSpecies richness:mammals*!. CityM A P 2 4LegendRoadLegend.Map symbols are identified in thelegend. Four symbols common toall maps: city, road, river/streamand lake.Longitude andlatitude marks.55°NQueenCharlotteIslandsPrince RupertB r i t i s hC o l u m b i aFort St. JohnPrince GeorgeA l b e r t aEdmonton55°NRiver/StreamLakeNumber <strong>of</strong> speciesNo observations1 - 67891011 - 1213 - 1415 - 1718 - 2122 - 52Units = number <strong>of</strong> species per gridsquare based on observations from1961-2006 (102 species total).Percentile-basedinterval classification.Units are below the legend.Colour coding for main and insetmap: Brown is lowest biodiversityvalue (e.g., species richness) andthe highest threat value (e.g., roaddensity). Dark green is the highestbiodiversity value and the lowestthreat value. <strong>The</strong> grey hill shadeindicates areas that are either datadeficient or the attribute data isnot present at this location.Inset map.Based on equal intervalclassification (units arebelow the main legend).50°NEqual Interval ClassificationNumber <strong>of</strong> speciesNo observations1 - 67 - 1112 - 1617 - 2122 - 2728 - 3233 - 3738 - 42P a c i f i cO c e a nVancouverIslandVancouverVictoriaKamloopsKelownaU N I T E D S T A T E SCalgary50°NArea <strong>of</strong> Detail0 100 200KilometresData sources:Compiled by the University <strong>of</strong><strong>British</strong> <strong>Columbia</strong>Map by:Caslys Consulting LtdProjection:<strong>BC</strong> Albers NAD83Produced for:Notes under the legend.Description <strong>of</strong> the units, method<strong>of</strong> calculation and furtherexplanations.Scale bar in kilometres.Data sources and projection:Listed in right hand margin.43 - 4748 - 52*Based on documented observations (the lack <strong>of</strong> an observation does not necessarily mean a species is not present).February 4, 2009130°W120°WNote: It is important to read the exact specifications sited in thelegend to each map, as they may differ even on similar maps.
8 the biodiversity atlas <strong>of</strong> british columbiaEcosystemsAn ecosystem can be a smallas a single log.photo: tory stevens.An ecosystem is a dynamic complex <strong>of</strong> plants, animals and microorganisms, and the abiotic environmentin which they live, all interacting as a functional unit. Ecosystems can be examined at a wide range<strong>of</strong> scales from a single log in a forest to an entire forest type covering thousands <strong>of</strong> square kilometres.<strong>The</strong> latitude, coastline and topography <strong>of</strong> B.C., and the resulting climatic variation have created a wide diversity<strong>of</strong> ecosystems from intertidal areas to forests to grasslands to alpine ice and snow. <strong>The</strong> province stretchesfrom the 48 o north latitude at its most southerly point on Vancouver Island to the 60 0 north latitude, and risesin altitude from sea level to more than 4,000 m at the peaks <strong>of</strong> the highest mountains – Mt. Waddington in theCoast Mountains, and Mt. Fairweather on the Alaska-B.C. border at the south end <strong>of</strong> the St. Elias Mountains. 11B.C. has some <strong>of</strong> the highest mountain ranges in Canada and these mountain systems give rise to over a dozenlarge rivers: the Fraser, Thompson, Kootenay, <strong>Columbia</strong>, Parsnip, Finlay, Peace, Kechika, Liard, Skeena, Nass,Stikine and Taku (Map 2). B.C. has the longest valley in North America – the 1,400 km long Rocky MountainTrench – and Canada’s longest coastline at approximately 29,000 km 12 and shares the world’s only interior temperaterainforest with Idaho, Montana and Washington.Ecosystems are dynamic over space and time, and can be difficult to characterize as discrete units. <strong>The</strong> followingsection presents a number <strong>of</strong> ways <strong>of</strong> viewing the broad-scale terrestrial and freshwater ecosystems <strong>of</strong><strong>British</strong> <strong>Columbia</strong>, including a variety <strong>of</strong> classification systems developed specifically for the province.8
t130°W 120°W110°W60°NY u k o nN o r t h w e s tT e r r i t o r i e s60°NM A P 2Major topographicfeaturesSt. Elias Mountains!.Mt. FairweatherC O A S T M O U N T A I N STakuRiverStikineRiverC a s s i a r M o u n t a i n sLiaKechika RiverFinlayrdRiverRi v erInteriorPlainsLegend!. CityRoadRiver/StreamLakeSkeena Mountainsiv ers RN a sRiverR O C K Y M O U N T A I N SB r i t i s hFort St. JohnA l b e r t a55°NC o l u m b i aOminecaMountainsParsni p RiPeace River55°NPrince RupertaSke e nHazeltonMountainsverEdmontonQueen CharlotteMountainsPrince GeorgeQueenCharlotteIslandsInteriorPlateauCariboo Mountains*ColCalgaryArea <strong>of</strong> Detail0 100 200u mbia R50°NP a c i f i cO c e a nC O A S T M O U N T A I N SVancouverIslandMt. Waddington!5F r as erR iv e rVancouverThompsoRivernR O C K Y M O U N T A I N SKamloopsKelownaiverMonasheeMountains*Purcell Mountains*Selkirk Mountains*KootenayRiver50°NKilometresMap by:Caslys Consulting LtdProjection:<strong>BC</strong> Albers NAD83Produced for:VictoriaU N I T E D S T A T E S*<strong>The</strong> Cariboo, Monashee, Selkirk and Purcell mountains are collectively known as the <strong>Columbia</strong> Mountains.January 29, 2009130°W120°W
10 the biodiversity atlas <strong>of</strong> british columbiaTopography and ClimateMuch <strong>of</strong> the character <strong>of</strong> <strong>British</strong> <strong>Columbia</strong>’sbiodiversity can be explainedby the province’s mountainous topographyand the resulting climatic conditions. <strong>The</strong>province lies within the Cordilleran mountainsystem <strong>of</strong> western North America, withthe Coast Mountains to the west, the RockyMountains and the <strong>Columbia</strong> Mountains inthe east, and the Cassiar-Omineca Mountainsin the north (Map 2). <strong>The</strong> elevationmap (Map 3) emphasizes that the majority<strong>of</strong> the land exceeds 1,000 m in altitude,including much <strong>of</strong> the Interior Plateau tothe west <strong>of</strong> Prince George. Lower elevationland below 1,000 m occurs only along rivervalleys, in the northeast Interior Plains andalong the coast.While high mountains, rock, ice andsnow add to the overall diversity <strong>of</strong> habitatin the province, they do not provide conditionsconducive to the survival <strong>of</strong> most species.Below 1,000 m where climatic conditionsare less severe, productivity is higherand habitats tend to be more diverse. As aresult, species richness (p. 36) tends to begreater in the low elevation areas, particularlythe warm, moist, valley bottoms in thesouth <strong>of</strong> the province. <strong>The</strong>se same areas areattractive places for humans to live, recreateand work. <strong>The</strong> mountainous topographyin B.C. has limited many human activitiesto low elevation areas. Consequently, thegreatest impacts on biodiversity (pp. 76-123)occur on flatter land in the southern valleybottoms, the Interior Plateau and in thenortheast. Pressures on freshwater biodiversityare also relatively high overall as themajor rivers and lakes occur in the valleybottoms. As well, the mountainous terrainmakes it relatively easy to build dams onriver systems (p. 112).<strong>The</strong> Bugaboos.photo: karen wipond.
t130°W 120°W110°W60°NY u k o nN o r t h w e s tT e r r i t o r i e s60°NM A P 3ElevationLegend!. CityRoadRiver/StreamLakeB r i t i s hC o l u m b i aFort St. JohnA l b e r t aElevation (metres)1 - 500501 - 1,0001,001 - 1,5001,501 - 2,0002,001 - 2,5002,501 - 3,000> 3,00055°N55°NPrince RupertPrince GeorgeEdmontonQueenCharlotteIslandsArea <strong>of</strong> DetailCalgary0 100 200Kilometres50°NP a c i f i cO c e a nKamloopsKelowna50°NData sources:ESRI North AmericaElevation GridMap by:Caslys Consulting LtdVancouverIslandVancouverProjection:<strong>BC</strong> Albers NAD83Produced for:VictoriaU N I T E D S T A T E SJanuary 29, 2009130°W120°W
12 the biodiversity atlas <strong>of</strong> british columbiaTopography and Climate continued...Climatic conditions are influencedgreatly by topography as well as a number<strong>of</strong> other factors such as ocean currents andlatitude. Map 4 shows four standard climatevariables across the province as measuredbetween 1961 and 1990: mean annualtemperature, mean annual precipitation,precipitation as snow and Growing DegreesDays (GDD). Growing Degree Days refers tothe annual sum <strong>of</strong> degrees Celsius above thebase <strong>of</strong> 5 o C based on daily mean temperatures(the average <strong>of</strong> the daily maximum andminimum). For example, ten days at 6 o C is10 GDD while 10 days at 10 o C is 50 GDD.<strong>The</strong> moderating influence <strong>of</strong> thePacific Ocean is evident from the maps withthe warmest temperatures, relatively highprecipitation and lower snowfall, and highGDD occurring along the coast. Warm, moistair from the Pacific Ocean releases its moistureas rain or snow as it rises over the Coast<strong>The</strong> Canadian Rockies.photo: neta degany.Mountains, producing the highest rainfalland some <strong>of</strong> the most productive forests inCanada. 13 Inland, the continental air masscreates greater extremes <strong>of</strong> temperature andprecipitation than on the coast. <strong>The</strong> province’sdriest regions occur in the southerninterior, in the rain shadow to the east <strong>of</strong>the Coast Mountains. <strong>The</strong> warm Pacific airrises once again as it travels east, creating aninterior wet belt in the <strong>Columbia</strong> Mountainswest <strong>of</strong>, and within parts <strong>of</strong>, the Rockies. <strong>The</strong>Peace region in the northeast, an extension<strong>of</strong> the Interior Plains <strong>of</strong> Alberta, is characterizedby low elevation rolling hills and a coldnorthern climate in winter. Climate in theprovince is also influenced in the summer bywarm or hot air from the Great Basin and the<strong>Columbia</strong> Basin to the south in the UnitedStates.Organisms are sensitive to changes inclimate and, although many individuals,species and ecosystems can tolerate someclimatic variation, extremes <strong>of</strong> high and lowtemperature and precipitation determine thedistribution <strong>of</strong> many species and the ecosystemsin which they live (p. 88). Climate is amajor factor in the net primary productivity<strong>of</strong> ecosystems (p. 16) and is a key considerationin the classification <strong>of</strong> B.C.’s broadscaleecosystems such as Ecoregions (p. 18)and biogeoclimatic zones (p. 20).
N o r t h w e s tY u k o nT e r r i t o r i e sB r i t i s hC o l u m b i aMean annual temperature (°C)" -23.5 to -2.9" -2.8 to -1.7" -1.6 to -0.8" -0.7 to +0.2" 0.3 to +1.1" 1.2 to +1.9" 2.0 to +2.7" 2.8 to +4.6" 4.7 to +7.1" 7.2 to +11.4Y u k o nB r i t i s hC o l u m b i aN o r t h w e s tT e r r i t o r i e sMean annual precipitation (mm)" 175 - 427" 428 - 472" 473 - 509" 510 - 568" 569 - 644" 645 - 790" 791 - 1,114" 1,115 - 1,707" 1,708 - 2,873" 2,874 - 12,738M A P 4Standard climatevariablesLegendRiver/StreamLakeA l b e r t aA l b e r t aQueenCharlotteIslandsQueenCharlotteIslandsP a c i f i cO c e a nP a c i f i cO c e a nVancouverIslandVancouverIslandU N I T E D S T A T E SU N I T E D S T A T E SY u k o nN o r t h w e s tT e r r i t o r i e sPrecipitation as snow (mm)" 28 - 123Y u k o nN o r t h w e s tT e r r i t o r i e sDegree days over 5°C" 44 - 280" 124 - 140" 281 - 499" 141 - 155" 500 - 690" 156 - 190" 691 - 887B r i t i s hC o l u m b i a" 191 - 238" 239 - 294" 295 - 376" 377 - 549" 550 - 910" 911 - 8,416B r i t i s hC o l u m b i a" 888 - 1,078" 1,079 - 1,249" 1,250 - 1,467" 1,468 - 1,802" 1,803 - 2,189" 2,190 - 2,935Area <strong>of</strong> Detail0 250 500KilometresQueenCharlotteIslandsA l b e r t aQueenCharlotteIslandsA l b e r t aData sources:Pacific Climate ImpactsConsortium (University <strong>of</strong>Victoria): 1961 - 1990 averagesMap by:Caslys Consulting LtdP a c i f i cP a c i f i cProjection:<strong>BC</strong> Albers NAD83O c e a nO c e a nProduced for:VancouverIslandVancouverIslandU N I T E D S T A T E SU N I T E D S T A T E SFebruary 5, 2009
14 the biodiversity atlas <strong>of</strong> british columbiaLand Cover<strong>The</strong> land cover map provides a view <strong>of</strong>the province in terms <strong>of</strong> the kinds <strong>of</strong>basic ecosystem types referred to in commonterms such as grasslands, wetlandsand forests (Map 5). f Within each <strong>of</strong> thesecategories, a wide range <strong>of</strong> ecosystems occurs.Forests, for example, range from riparianforest to swamp forest to steep, shallowareas with low productivity, parkland andkrummholz.B.C. is predominantly a land <strong>of</strong> trees,rock and ice. More than 70% <strong>of</strong> the total landarea is forest and 13% is alpine (Figure 3).While not a specific category, rock coversalmost 10% <strong>of</strong> the province, with the majority(close to 9%) occurring in the alpine. 14<strong>The</strong> rarest land cover type is grassland(1%). Grasslands are not only naturally rareon the landscape, they are also <strong>of</strong> conservationconcern (p. 22). <strong>The</strong> two major biogeoclimaticzones that represent grasslands inB.C. – Ponderosa Pine and Bunchgrass – areconsidered critically imperilled. 15 More thanone-third <strong>of</strong> B.C.’s vertebrates <strong>of</strong> conservationconcern depend on grasslands for theirsurvival. 16,17Similarly, more than 30% <strong>of</strong> species<strong>of</strong> conservation concern depend onwetlands. g,18 Due to the scale <strong>of</strong> the display70%1% 2%3%4%7%13%GrasslandsHuman dominated land*Fresh waterGlaciersWetlandsAlpineForest and other**figure 3: Land cover types in B.C. as percentage<strong>of</strong> total area <strong>of</strong> province.source: Produced for this report.*Areas mapped as urban, agriculture, recreation (e.g., golfcourses) or mining.**Forest and other=All areas not mapped into the other sixcategories; the vast majority is forest.and the small size <strong>of</strong> many wetlands, mostare not visible on the map.Freshwater in lakes, rivers, and reservoirsoccupies only 3% <strong>of</strong> the area <strong>of</strong> the provinceyet supports a large proportion <strong>of</strong> B.C.’s plantsand animals, including people (Figure 3).fSources: Grasslands – Grasslands Conservation Council; Glaciers – Terrain Resource Information Management mapping: Enhanced Base Map (TRIM: EBM); Wetlands –Terrain Resource Information Management mapping: Enhanced Base Map (TRIM: EBM); Freshwater – Lakes, rivers and reservoirs from Terrain Resource InformationManagement mapping: Enhanced Base Map (TRIM: EBM); Alpine – Baseline <strong>The</strong>matic Mapping (BTM 1 & 2) 1991-1997; Human dominated – Baseline <strong>The</strong>matic Mapping(BTM 1&2); Forest – Total provincial land area minus all other land classes.gWetlands include freshwater wetlands but not estuarine areas on the coast.
t130°W 120°W110°W60°NY u k o nN o r t h w e s tT e r r i t o r i e s60°NM A P 5Land coverLegendB r i t i s hC o l u m b i aFort St. JohnA l b e r t a!. CityRoadLakeClassification*Grassland (GCC)Human dominated (BTM)Fresh water (TRIM: EBM)Glacier (TRIM: EBM)Wetland (TRIM: EBM)Alpine (BTM)Forest and other**55°N55°N*BTM - Baseline <strong>The</strong>matic Mapping,TRIM-EBM - Terrain ResourceInformation Management-Enhanced Base Map,GCC - Grasslands ConservationCouncil**All areas not mapped into theother six classes.Prince RupertEdmontonPrince GeorgeQueenCharlotteIslandsArea <strong>of</strong> DetailCalgary0 100 200Kilometres50°NP a c i f i cO c e a nKamloopsKelowna50°NData sources:Baseline <strong>The</strong>matic Mapping(v.1 and 2 merged), TerrainResource Information Management- Enhanced Base Map, GrasslandsConservation CouncilMap by:Caslys Consulting LtdVancouverIslandVancouverProjection:<strong>BC</strong> Albers NAD83Produced for:VictoriaU N I T E D S T A T E SFebruary 25, 2009130°W120°W
16 the biodiversity atlas <strong>of</strong> british columbiaNet Primary Productivity<strong>The</strong> net primary productivity (NPP) <strong>of</strong>an ecosystem is the difference betweentotal photosynthesis by plants and totalplant respiration. 19 NPP is a measure <strong>of</strong> therate <strong>of</strong> production <strong>of</strong> the net useful chemicalenergy (in the form <strong>of</strong> carbon) availablefor the growth and reproduction <strong>of</strong> primaryproducers and for consumption by herbivores.20 In terrestrial ecosystems, primaryproduction is carried out mostly by vascularplants (with a small fraction coming from algaeand non-vascular plants such as mossesand liverworts). Algae carry out the majority<strong>of</strong> primary production in aquatic systems.Map 6 shows patterns <strong>of</strong> average netprimary productivity on land across theprovince under the climatic conditions occurringbetween 1960 and 2000 and basedon the land cover present in 2000. <strong>The</strong> map,produced from national data, is at a fairlycoarse resolution <strong>of</strong> 5x5 km. Finer resolutionWest coast <strong>British</strong> <strong>Columbia</strong> rainforest.photo: robert koopmans.regional mapping specific for B.C. has notyet been carried out. In general, land withgreater plant cover will have greater net primaryproductivity as can be seen when Map5 (p. 15) is compared with Map 6 (p. 17).<strong>The</strong>highest net primary productivity occurs inthe forested areas <strong>of</strong> the province, with thelowest productivity in the alpine regions. Allforms <strong>of</strong> life on earth rely directly or indirectlyon primary production and thereforehigher levels <strong>of</strong> net primary productivitygenerally support more life in terms <strong>of</strong> bothdensity and diversity, making it a good predictorfor species richness (p. 36). 21Net primary productivity in terrestrialecosystems is most <strong>of</strong>ten measured as mass<strong>of</strong> carbon fixed per unit area per year(g C/m 2 /yr) and is a major component <strong>of</strong>the carbon cycle. 22 NPP is useful in climatescience to calculate how much carbon isremoved from the atmosphere by plants. 23Water, temperature and light have thegreatest influence on net primary productivity.<strong>The</strong>refore, climate is an importantdriver <strong>of</strong> NPP. Plant growth can be limited byextreme temperatures and/or low levels <strong>of</strong>water and light. Climate change (p. 88) hasthe potential to dramatically alter NPP insome ecosystems. 24,25,26,27
t130°W 120°W110°W60°NY u k o nN o r t h w e s tT e r r i t o r i e s60°NM A P 6Net primaryproductivityLegend!. CityRoadRiver/StreamLakePrimary productivity0B r i t i s h1 - 4849 - 84C o l u m b i a85 - 117118 - 158159 - 198Fort St. JohnA l b e r t a199 - 239240 - 298299 - 352353 - 60255°N55°NUnits = g C/m 2 /yr.Prince RupertEdmontonPrince GeorgeQueenCharlotteIslandsArea <strong>of</strong> DetailCalgary0 100 200Kilometres50°NP a c i f i cO c e a nKamloopsKelowna50°NData sources:Canada Centre for RemoteSensing: 1960 to 2000 climatedata, 2000 land cover dataMap by:Caslys Consulting LtdVancouverIslandVancouverProjection:<strong>BC</strong> Albers NAD83Produced for:VictoriaU N I T E D S T A T E SFebruary 4, 2009130°W120°W
18 the biodiversity atlas <strong>of</strong> british columbiaEcoregion Classification<strong>British</strong> <strong>Columbia</strong> is a province with greatecological complexity. In light <strong>of</strong> thiscomplexity, the Ecoregion classification systemwas developed to provide a systematicview <strong>of</strong> the broad ecological relationshipsin the province. 28 <strong>The</strong> system is organizedaccording to five hierarchical levels: Ecodomain,Ecodivision, Ecoprovince, Ecoregionand Ecosection. <strong>The</strong> highest two levels <strong>of</strong>this classification, Ecodomain and Ecodivision,are very broad and place <strong>British</strong><strong>Columbia</strong> in a global context. Ecoprovinces,Ecoregions, and Ecosections, progressivelymore detailed and narrow in scope, relatedifferent segments <strong>of</strong> the province to oneanother based on areas <strong>of</strong> similar climate,physiography, oceanography, hydrology,vegetation, and wildlife potential. Withinthe terrestrial environment each Ecoregionand Ecosection can be further subdivided bybiogeoclimatic criteria to provide a basis fordetailed interpretation <strong>of</strong> climate, topography,soil, and vegetation reflected by theplant and animal communities present.Ecosections combined with biogeoclimaticsubzones and variants (p. 20) and thirdorderwatersheds (p. 128) form the basis <strong>of</strong>the biodiversity spatial analysis units (pp. 3and 4) used to produce the maps presentedin the Threats to <strong>Biodiversity</strong> section <strong>of</strong> the<strong>Atlas</strong> (p. 76).<strong>The</strong> map shows the ten Ecoprovincesand the 139 Ecosection divisions for theprovince (Map 7).Near Kamloops.photo: marek slusarczyk.
t130°W 120°W110°W60°NY u k o nN o r t h w e s tT e r r i t o r i e s60°NM A P 7Ecoprovincesand ecosectionsLegend!. CityRoadRiver/StreamLakeEcosections*B r i t i s hC o l u m b i aFort St. JohnA l b e r t aEcoprovincesBoreal PlainsCentral InteriorCoast and MountainsGeorgia DepressionNorthern Boreal MountainsSouthern Alaska MountainsSouthern InteriorSouthern Interior MountainsSub-boreal InteriorTaiga Plains55°N55°N*Islands are surrounded byecosection boundaries (becausethe neighbouring marine areas arenot part <strong>of</strong> the same ecosection)but generally are not uniqueecosections.Prince RupertPrince GeorgeEdmontonQueenCharlotteIslandsArea <strong>of</strong> DetailCalgary0 100 200Kilometres50°NP a c i f i cO c e a nKamloopsKelowna50°NData sources:Ecoregions (v. 2.01)Map by:Caslys Consulting LtdProjection:<strong>BC</strong> Albers NAD83VancouverIslandVancouverProduced for:VictoriaU N I T E D S T A T E SJanuary 29, 2009130°W120°W
20 the biodiversity atlas <strong>of</strong> british columbiaBiogeoclimatic Ecosystem ClassificationBiogeoclimatic Ecosystem Classification(BEC) zones, commonly referredto as biogeoclimatic zones, are large geographicalareas sharing similar climate andvegetation. h,29 <strong>The</strong> BEC system was developedspecifically for B.C. in the 1960s andearly 1970s and continues to be revised andupdated. Sixteen biogeoclimatic zones arerecognized for <strong>British</strong> <strong>Columbia</strong> (Map 8).Each <strong>of</strong> the zones is identified by the dominantvegetation type or a climatic modifier(e.g., Coastal Douglas-fir, Montane Spruce,etc.) and referred to by an abbreviation (e.g.,Coastal Douglas-fir = CDF; Montane Spruce= MS). Twelve <strong>of</strong> the zones are forested, threeare alpine and one is dominated by grasses.<strong>The</strong> zones are divided into subzones,based on differences in regional climate.Variants are still finer subdivisions <strong>of</strong> subzones,which reflect local variation withinthe subzone-level climate (e.g., areas thatare slightly wetter or warmer than otherareas in the subzone). While not displayedon the map, biogeoclimatic subzones andvariants, combined with third-order watersheds(p.128) and Ecosections (p. 18), formthe basis <strong>of</strong> the biodiversity spatial analysisunits (pp. 4) used to produce the maps presentedin the Threats to <strong>Biodiversity</strong> section<strong>of</strong> the <strong>Atlas</strong> (p. 76).Table 2 summarizes the area <strong>of</strong> each <strong>of</strong>B.C.’s biogeoclimatic zones, listing themin order <strong>of</strong> rarity (from most common torarest). <strong>The</strong> least common zones, CoastalDouglas-fir, Bunchgrass and Ponderosatable 2. areal extent <strong>of</strong> biogeoclimatic zones in b.c.Pine, are all dry, low-elevation or valley-bottomzones, and together make up less than1% <strong>of</strong> the province’s land area. <strong>The</strong> mostcommon zones are Engelmann Spruce–Subalpinefir, Boreal White and Black Spruce,and Coastal Western Hemlock, all predominantlyforested ecosystems.Biogeoclimatic Zone area (km 2 ) percentageEngelmann Spruce–Subalpine Fir (ESSF) 170,364 18%Boreal White and Black Spruce (BWBS) 153,367 17%Coastal Western Hemlock (CWH) 102,253 11%Sub-Boreal Spruce (SBS) 92,346 10%Spruce–Willow–Birch (SWB) 80,101 9%Boreal Altai Fescue Alpine (BAFA) 76,812 8%Coastal Mountain-heather Alpine (CMA) 52,007 6%Interior Cedar–Hemlock (ICH) 50,915 5%Interior Douglas-fir (IDF) 40,418 4%Mountain Hemlock (MH) 36,572 4%Montane Spruce (MS) 27,795 3%Sub-Boreal Pine Spruce (SBPS) 22,359 2%Interior Mountain-heather Alpine (IMA) 17,681 2%Ponderosa Pine (PP) 2,896
t130°W 120°W110°W60°NY u k o nN o r t h w e s tT e r r i t o r i e s60°NM A P 8Biogeoclimaticecosystemclassification - zonesLegend55°NB r i t i s hC o l u m b i aFort St. JohnA l b e r t a55°N!. CityRoadRiver/StreamLakeZoneBoreal Altai Fescue AlpineCoastal Mountain-heather AlpineInterior Mountain-heather AlpineSpruce -- Willow -- BirchBoreal White and Black SpruceSub-Boreal Pine -- SpruceSub-Boreal SpruceMountain HemlockEngelmann Spruce -- Subalpine FirMontane SpruceBunchgrassPonderosa PineInterior Douglas-firCoastal Douglas-firInterior Cedar -- HemlockCoastal Western HemlockPrince RupertEdmontonPrince GeorgeQueenCharlotteIslandsArea <strong>of</strong> DetailCalgary0 100 200Kilometres50°NP a c i f i cO c e a nKamloopsKelowna50°NData sources:Biogeoclimatic EcosystemClassification (v. 6.0)Map by:Caslys Consulting LtdVancouverIslandVancouverProjection:<strong>BC</strong> Albers NAD83Produced for:VictoriaU N I T E D S T A T E SJanuary 2, 2009130°W120°W
22 the biodiversity atlas <strong>of</strong> british columbiaBiogeoclimatic Zones <strong>of</strong> Conservation Concern<strong>The</strong> conservation status <strong>of</strong> each <strong>of</strong> thebiogeoclimatic zones was determined usinga modification <strong>of</strong> NatureServe i methodsused for assessing species (p. 40). Conservationstatus rankings were based on criteriathat included rarity, trends and the level <strong>of</strong>threat from human activity. 30 <strong>The</strong> threat assessmentcarried out as part <strong>of</strong> this processincluded the effects <strong>of</strong> residential development,agriculture and aquaculture, energyproduction and mining, transportationand service corridors, biological resourceuse (e.g., hunting and collecting, logging,fishing), human intrusion and disturbance,natural systems modification (e.g., fire andfire suppression, dams and water management),invasive and problem species, pollution,geological events, and climate changeand severe weather.Specific information used in the assessmentsincluded the overlap <strong>of</strong> the presentand projected biogeoclimatic zone climateenvelopes (p. 20), 31 the proportion <strong>of</strong> thezone with roads and other linear developmentfeatures present (p.107) and the proportion<strong>of</strong> the zone recently logged (p. 105).Four biogeoclimatic zones are <strong>of</strong> conservationconcern in the province): three in theinterior (Bunchgrass, Ponderosa Pine andInterior Douglas-fir) and one on the coast(Coastal Douglas-fir) (Table 3). Collectively,these zones occupy less than 5% <strong>of</strong> B.C.’sarea (Map 9).table 3. conservation status <strong>of</strong> biogeoclimatic zones in b.c.Biogeoclimatic Zoneconservation StatusBunchgrass I imperilled (S2)Coastal Douglas-firimperilled (S2)Ponderosa Pineimperilled/Vulnerable (S2/S3)Interior Douglas-firVulnerable (S3)Coastal Western HemlockApparently secure (S4)Interior Cedar–HemlockApparently secure (S4)Sub-Boreal Pine–SpruceApparently secure (S4)Boreal White and Black SpruceApparently secure (S4)Spruce–Willow–BirchApparently secure (S4)Sub-Boreal SpruceApparently secure (S4)Montane SpruceApparently secure (S4)Mountain HemlockApparently secure (S4)Engelmann Spruce–Subalpine FirSecure (S5)Coastal Mountain-heather AlpineSecure (S5)Boreal Altai Fescue AlpineSecure (S5)Interior Mountain-heather AlpineSecure (S5)source: Kremsater, L. 2007. Draft S Ranks and Surrogate G Ranks for BEC Zones and Draft S Ranks for Ecoprovincesand Major Drainage Areas <strong>of</strong> B.C.: Preliminary Rankings for Informing the <strong>Biodiversity</strong> Status Report andAction Plan. <strong>Biodiversity</strong> <strong>BC</strong>, Victoria, <strong>BC</strong>. 64pp. Available at: www.biodiversitybc.org.notes: Boldface indicates biogeoclimatic zone is <strong>of</strong> conservation concern. <strong>The</strong> global conservation status (Grank) for the biogeoclimatic zones was considered relative to the provincial conservation status (S rank) and inall cases was assumed to be similar; therefore, the G and S rankings were the same. Only the S rank is reported.iNatureServe is an international network that includes the B.C. Conservation Data Centre. For more information see www.natureserve.org/explorer.
t130°W 120°W110°W60°NY u k o nN o r t h w e s tT e r r i t o r i e s60°NM A P 9Biogeoclimatic zones<strong>of</strong> conservationconcernB r i t i s hC o l u m b i aLegend!. CityRoadRiver/StreamLakeZoneBunchgrassPonderosa PineInterior Douglas-firCoastal Douglas-fir55°NFort St. JohnA l b e r t a55°NStatus assessment from:Kremsater, L. 2007. Draft S Ranksand Surrogate G Ranks for BECZones and Draft S Ranks forEcoprovinces and Major DrainageUnits <strong>of</strong> B.C.: Preliminary Rankingsfor Informing the <strong>Biodiversity</strong> StatusReport and Action Plan.<strong>Biodiversity</strong> B.C., Victoria, B.C. 64pp.Prince RupertEdmontonPrince GeorgeQueenCharlotteIslandsArea <strong>of</strong> DetailCalgary0 100 200Kilometres50°NP a c i f i cO c e a nKamloopsKelowna50°NData sources:Biogeoclimatic EcosystemClassification (v. 6.0)Map by:Caslys Consulting LtdVancouverIslandVancouverProjection:<strong>BC</strong> Albers NAD83Produced for:VictoriaU N I T E D S T A T E SFebruary 25, 2009130°W120°W
24 the biodiversity atlas <strong>of</strong> british columbiaBiogeoclimatic Zones with Majority <strong>of</strong> Global Range in B.C.For each biogeoclimatic zone, the proportion<strong>of</strong> its global range that occurs in B.C.was determined using maps covering anumber <strong>of</strong> neighbouring jurisdictions,combined with expert knowledge where thezones were believed to extend beyond thelimits <strong>of</strong> available information. j,32 Proportion<strong>of</strong> global range is described by seven classesranging from 1 (Endemic: 100% <strong>of</strong> globalrange in <strong>British</strong> <strong>Columbia</strong>) to 7 (Low andLocalized: less than 10% <strong>of</strong> range in <strong>British</strong><strong>Columbia</strong> and occurs over less than 30% <strong>of</strong>the province) (Table 4).Six <strong>of</strong> the 16 zones have more than 50%<strong>of</strong> their global range in B.C. (Classes 1-3)(Map 10). <strong>The</strong>se six zones collectively coverabout one-quarter <strong>of</strong> the province. B.C. has70-80% <strong>of</strong> the global range <strong>of</strong> the Coastal Both are forested ecosystems located in theDouglas-fir zone, one <strong>of</strong> the province’s four north-central part <strong>of</strong> the province.zones <strong>of</strong> conservation concern (p. 22), which Except for the two endemic zones, allfurther emphasizes the importance <strong>of</strong> B.C. <strong>of</strong> the province’s biogeoclimatic zones arefor its conservation. Two zones – the Sub- shared with neighbouring jurisdictions. 33Boreal Pine–Spruce and the Sub-Boreal For example, the Interior Cedar-HemlockSpruce – are endemic to B.C., meaning zone is distributed across <strong>British</strong> <strong>Columbia</strong>,they are found nowhere else in the world. Montana, Idaho, Washington and Oregon.table 4. classification system for proportion <strong>of</strong> global range: ecosystems.GLOBAL RANGE CLASSpercenT OF GLOBAL RANGE THAT OCCURS IN B.C.1 Endemic 100% <strong>of</strong> global range2 Very High 75–99% <strong>of</strong> global range3 High 51–74% <strong>of</strong> global range4 Moderately High 30–50% <strong>of</strong> global range5 Intermediate 11–29% <strong>of</strong> global range6 Low and Widespread less than 10% <strong>of</strong> global range, and occurs over more than30% <strong>of</strong> the province7 Low and Localized less than 10% <strong>of</strong> global range, and occurs over more than30% <strong>of</strong> the provincesource: Adapted from Bunnell, F., L. Kremsater and I. Houde. 2006. Applying the Concept <strong>of</strong> Stewardship Responsibilityin <strong>British</strong> <strong>Columbia</strong>: 2007 Update. <strong>Biodiversity</strong> <strong>BC</strong>, Victoria, <strong>BC</strong>. 188pp. Available at: www.biodiversitybc.org.notes: Boldface indicates that ecosystems in this global range class are included on Map 10.jIdeally, information on the condition <strong>of</strong> the biogeoclimatic zones in areas outside the province would have been considered (particularly regarding ecosystem conversion);however, those data were not readily available.
t130°W 120°W110°W60°NY u k o nN o r t h w e s tT e r r i t o r i e s60°NM A P 1 0Biogeoclimatic zonesfor which B.C. hasthe majority <strong>of</strong> theglobal rangeLegend55°NB r i t i s hC o l u m b i aFort St. JohnA l b e r t a55°N!. CityRoadRiver/StreamLakeZoneSub-Boreal Pine -- SpruceSub-Boreal SpruceMountain HemlockMontane SpruceCoastal Douglas-firInterior Cedar -- HemlockStatus assessment from:Kremsater, L. 2007. Draft S Ranksand Surrogate G Ranks for BECzones and Draft S Ranks forEcoprovinces and Major DrainageUnits <strong>of</strong> B.C.: Preliminary Rankingsfor Informing the <strong>Biodiversity</strong> StatusReport and Action Plan.<strong>Biodiversity</strong> B.C., Victoria, B.C. 64pp.Prince RupertEdmontonPrince GeorgeQueenCharlotteIslandsArea <strong>of</strong> DetailCalgary0 100 200Kilometres50°NP a c i f i cO c e a nKamloopsKelowna50°NData sources:Biogeoclimatic EcosystemClassification (v. 6.0)Map by:Caslys Consulting LtdVancouverIslandVancouverProjection:<strong>BC</strong> Albers NAD83Produced for:VictoriaU N I T E D S T A T E SFebruary 25, 2009130°W120°W
26 the biodiversity atlas <strong>of</strong> british columbiaEcological CommunitiesEcological communities are ecosystemsclassified at a much finer resolution thanbiogeoclimatic zones. <strong>The</strong> same communitycan occur in more than one zone. To date, 611ecological communities have been describedin B.C. (Table 5). 34 Although not all ecologicalcommunities in the province have been described,the current list represents a majority<strong>of</strong> the province’s ecological communities. 35Ecological community classification is themost incomplete for alpine ecosystems, butthis is a focus <strong>of</strong> current classification work. 36Of the ecological communities describedin B.C., 532 (87%) have had their provincialconservation status assessed and 340(56% <strong>of</strong> the total number described) are <strong>of</strong>provincial conservation concern (Table 5).Ecological communities in B.C. have not yetbeen fully mapped, however three types <strong>of</strong>ecosystem mapping have been carried outin some areas: Terrestrial Ecosystem Mapping(TEM), Predictive Ecosystem Mapping(PEM) and Sensitive Ecosystem Inventory(SEI). Ecosystem mapping can be used topredict sites where conditions might supportspecific ecological communities.TEM is a standard inventory methodbased on airphoto interpretation supportedby intensive ground visitation that delineatesareas <strong>of</strong> land and shallow water that arehomogenous with respect to landform, soils,climax vegetation, and wildlife. 37,38 TEM coversapproximately 20% <strong>of</strong> the province.PEM maps the same classification andmost <strong>of</strong> the same attributes as TEM, butrather than being photo-interpreted, themap units and their attributes are modelledon the basis <strong>of</strong> existing information, typicallyincluding digital elevation models, VegetationResource Inventory, and focussedterrain mapping. 39 As a result PEM is lessaccurate than TEM but also less costly. PEMcovers approximately 50% <strong>of</strong> the province.SEI identifies rare and fragile ecosystemsin an area using air photography and fieldchecking <strong>of</strong> the data. 40 Ecosystems identifiedin SEI are <strong>of</strong>ten the remnants <strong>of</strong> the naturalecosystems that once occupied a muchlarger area.table 5. provincial conservation status <strong>of</strong> ecological communities in b.c.by biogeoclimatic zone.Biogeoclimatic Zone number <strong>of</strong> communitieS percentage <strong>of</strong>Describedcomunities describedTHat are <strong>of</strong> provincialconservation concernCoastal Douglas-fir 36 97%Bunchgrass 30 93%Ponderosa Pine 29 93%Coastal Western Hemlock 128 83%Interior Douglas-fir 87 82%Sub-Boreal Spruce 92 61%Interior Cedar–Hemlock 89 52%Sub-Boreal Pine–Spruce 38 50%Montane Spruce 66 47%Boreal White and Black Spruce 52 25%Engelmann Spruce–Subalpine Fir 149 21%Mountain Hemlock 43 19%Spruce–Willow–Birch 21 5%Coastal Mountain-heather Alpine 23 4%Interior Mountain-heather Alpine 39 3%Boreal Altai Fescue Alpine 53 2%Province 611 56%source: Prepared for this report with data from the B.C. Conservation Data Centre.notes: Boldface indicates biogeoclimatic zone is <strong>of</strong> conservation concern. Some ecological communities occurin more than one biogeoclimatic zone.
130°W 120°W110°W60°NY u k o nN o r t h w e s tT e r r i t o r i e sB r i t i s hC o l u m b i at60°NM A P 1 1Ecosystem mappingas <strong>of</strong> 2006Legend!. CityRoadRiver/StreamLakePredictive EcosystemMapping (1:50,000)Terrestrial EcosystemMapping (1:50,000)Terrestrial EcosystemMapping (1:20,000)Sensitive EcosystemInventoryFort St. JohnA l b e r t a55°N55°NPrince RupertEdmontonPrince GeorgeQueenCharlotteIslandsArea <strong>of</strong> DetailCalgary0 100 200Kilometres50°NP a c i f i cO c e a nKamloopsKelowna50°NData sources:B.C. Ministry <strong>of</strong> EnvironmentMap by:Caslys Consulting LtdProjection:<strong>BC</strong> Albers NAD83VancouverIslandVancouverProduced for:VictoriaU N I T E D S T A T E SFebruary 25, 2009130°W120°W
28 the biodiversity atlas <strong>of</strong> british columbiaMajor Drainage AreasFreshwater is an essential ingredient forlife on earth. Most fresh water is frozenor underground, locked either in polar icecaps and permafrost or in undergroundaquifers, many with recharge times <strong>of</strong>thousands <strong>of</strong> years. 41 Rivers, lakes, wetlands,soil moisture and water vapour togetherhold 0.01% <strong>of</strong> the planet’s total water supply(including salt water) and just under 0.4% <strong>of</strong>the world’s fresh water (Figure 4). 42,43 <strong>British</strong><strong>Columbia</strong> holds 25% <strong>of</strong> Canada’s freshwatersupply 44 and 5% <strong>of</strong> the world’s supply 45 .Fresh water available in lakes, streams,reservoirs and wetlands provides vitalhabitat for a disproportionate number <strong>of</strong>B.C.’s species, including a wide variety <strong>of</strong>native plants, fungi, fish, mussels, crayfish,snails, reptiles, amphibians, insects, microorganisms,birds and mammals that live in,on, and around water. Approximately 25% <strong>of</strong>native vertebrate, invertebrate and vascularplant species that have been assessed forecosystem requirements in B.C. are associatedwith freshwater ecosystems. 46 In additionto providing water, food, habitat, andphysical, chemical and hydrologic processes,freshwater ecosystems are required forlife cycle stages <strong>of</strong> many organisms, such assalmon (for spawning) and dragonflies (forlarval development). Freshwater ecosystemsalso provide humans with essential services.Freshwater ecosystems are highly variableand dynamic. <strong>The</strong>y interact closelywith adjacent riparian areas and nearshorecommunities, sharing physical habitats andecological and environmental processes,GLOBAL WATERSalt water97.476%Freshwater,not frozen orunderground0.0103%Freshwater,frozenor underground2.522%and are highly sensitive to climate change(p. 88).One broad scale division <strong>of</strong> freshwaterecosystems in <strong>British</strong> <strong>Columbia</strong> is the MajorDrainage Area (MDA). 47 <strong>The</strong>re are nine MajorDrainage Areas in the province (Map 12).With the exception <strong>of</strong> the Coastal area, eachdefines the drainage basin <strong>of</strong> a major riversystem. <strong>The</strong> Coastal area comprises manysmall coastal rivers and streams that draindirectly into the Pacific Ocean.FRESHWATERFrozen69.56%Lakes, soil moisture, watervapour, wetlands, rivers, etc.0.389%Groundwater30.06%figure 4: <strong>The</strong> world’s water supply.source: Adapted from Gleick, P.H. 2000. <strong>The</strong> World’s Water 2000-2001. Washington, B.C. Island Press.7%13%
t130°W 120°W110°W60°NY u k o nN o r t h w e s tT e r r i t o r i e s60°NM A P 1 2Major DrainageAreasLegend!. CityRoadRiver/StreamLake55°NB r i t i s hC o l u m b i aFort St. JohnA l b e r t a55°NMajor Drainage AreasCoastal<strong>Columbia</strong>FraserMackenzieNassSkeenaStikineTakuYukonPrince RupertPrince GeorgeEdmontonQueenCharlotteIslandsArea <strong>of</strong> DetailCalgary0 100 200Kilometres50°NP a c i f i cO c e a nKamloopsKelowna50°NData sources:Freshwater <strong>Atlas</strong>Map by:Caslys Consulting LtdProjection:<strong>BC</strong> Albers NAD83VancouverIslandVancouverProduced for:VictoriaU N I T E D S T A T E SJanuary 5, 2009130°W120°W
0the biodiversity atlas <strong>of</strong> british columbia<strong>Columbia</strong> wetlands.photo: karen wipond.Conservation Status <strong>of</strong> Major Drainage Areas in B.C.According to an assessment <strong>of</strong> conservationstatus using the same methodsWhile the Coastal and Mackenzie MajorValley, is ranked as imperilled/vulnerable.applied to biogeoclimatic zones (p. 22), four Drainage Areas are both ranked as vulnerable/apparentlysecure, it is important to keep<strong>of</strong> the nine Major Drainage Areas <strong>of</strong> B.C. are<strong>of</strong> conservation concern (Table 6, Map 13). in mind that impacts in a single watershed<strong>The</strong>se four areas occupy 83% <strong>of</strong> the province. within the Coastal system, which is made<strong>The</strong> <strong>Columbia</strong> River drainage, which is up <strong>of</strong> many individual watersheds, will behighly impacted by dams (p. 112) is ranked restricted to that watershed. Impacts in theas imperilled. <strong>The</strong> Fraser system, one <strong>of</strong> the other Major Drainage Areas have the potentialto spread downstream throughout thelargest river systems in the world, whichflows through the highly populated Fraser entire drainage basin.table 6. provincial conservation status <strong>of</strong> major drainage areas in b.c.MAJOR DRAINAGE area conservation Status total area (KM 2 ) percent <strong>of</strong>province<strong>Columbia</strong> imperilled (S2) 102,798 11%Fraser imperilled/vulnerable (S2S3) 231,459 25%Coastal Vulnerable/apparently secure (S3S4) 164,115 17%Mackenzie Vulnerable/apparently secure (S3S4) 278,667 30%Taku Apparently secure/secure (S4S5) 16,585 2%Stikine Apparently secure/secure (S4S5) 49,631 5%Yukon Apparently secure/secure (S4S5) 24,950 3%Skeena Apparently secure/secure (S4S5) 54,401 6%Nass Secure (S5) 21,530 2%source: Kremsater, L. 2007. Draft S Ranks and Surrogate G Ranks for BEC Zones and Draft S Ranks for Ecoprovincesand Major Drainage Areas <strong>of</strong> B.C.: Preliminary Rankings for Informing the <strong>Biodiversity</strong> Status Report and Action Plan.<strong>Biodiversity</strong> <strong>BC</strong>, Victoria, <strong>BC</strong>. 64pp. Available at: www.biodiversitybc.org.notes: Boldface indicates the Major Drainage Area is <strong>of</strong> conservation concern.
t130°W 120°W110°W60°NY u k o nN o r t h w e s tT e r r i t o r i e s60°NM A P 1 3Major DrainageAreas <strong>of</strong> conservationconcernB r i t i s hC o l u m b i aLegend!. CityRoadRiver/StreamLakeMajor Drainage AreasCoastal<strong>Columbia</strong>FraserMackenzie55°NFort St. JohnA l b e r t a55°NStatus assessment from:Kremsater, L. 2007. Draft S Ranksand Surrogate G ranks for BECzones and draft S ranks forEcoprovinces and Major DrainageUnits <strong>of</strong> B.C.: Preliminary rankingsfor Informing the <strong>Biodiversity</strong> StatusReport and Action Plan.<strong>Biodiversity</strong> <strong>BC</strong>, Victoria, <strong>BC</strong>. 64pp.Prince RupertPrince GeorgeEdmontonQueenCharlotteIslandsArea <strong>of</strong> DetailCalgary0 100 200Kilometres50°NP a c i f i cO c e a nKamloopsKelowna50°NData sources:Freshwater <strong>Atlas</strong>Map by:Caslys Consulting LtdProjection:<strong>BC</strong> Albers NAD83VancouverIslandVancouverProduced for:VictoriaU N I T E D S T A T E SJanuary 29, 2009130°W120°W
2the biodiversity atlas <strong>of</strong> british columbiaProtected Areas<strong>The</strong> International Union for Conservation<strong>of</strong> Nature (IUCN) World Commissionon Protected Areas defines a protectedarea as an area <strong>of</strong> land and/or sea especiallydedicated to the protection and maintenance<strong>of</strong> biological diversity, and <strong>of</strong> natural andassociated cultural resources, and managedthrough legal or other effective means. 48 Protectedareas in B.C. that are included on themap are national parks, provincial parks andprotected areas, regional parks, and conservationlands (Table 7, Map 14).National parks, administered by ParksCanada, protect representative natural areas<strong>of</strong> Canadian significance for public understanding,appreciation and enjoyment,while being maintained in an unimpairedstate for future generations. 49,50 Seven nationalparks are located in B.C. and occupyover 660,000 hectares.Provincial parks and protected areas arethose designated under several provincialacts and include ecological reserves; ClassA, B, and C parks; protected areas, recreationareas, and conservancies. 51,52,53,54 B.C.has over 13,000,000 hectares <strong>of</strong> provinciallydesignated parks and protected areas.Regional parks are those owned andmanaged by regional districts throughoutthe province. Not all regional parks are managedfor conservation. Many regional parksare too small to show up on the map.Conservation lands include lands managedfor conservation purposes that areowned or administered by either the Ministry<strong>of</strong> Environment (MOE), the CanadianWildlife Service (CWS) or by a non-governmentalorganization. <strong>The</strong> majority <strong>of</strong> conservationlands are presently administeredby MOE with the largest area encompassedby Wildlife Management Area (WMA) des-table 7. protected areas in b.c.ignations. WMAs are lands requiring specialprotection and management under section4 <strong>of</strong> the B.C. Wildlife Act. 55 Conservationlands administered by CWS include NationalWildlife Areas 56 and Migratory Bird Sanctuaries.57 Non-governmental organizationsown many properties which they eithermanage themselves or lease to MOE to manage.<strong>The</strong>se areas are usually relatively smallalthough the recent 55,000 ha Darkwoodsproperty acquisition in the Selkirk Mountainsjust northeast <strong>of</strong> Creston is the largestsingle private conservation land property inthe province.protected area category approximate area (HA) percentage <strong>of</strong>provincial areaNational parks 662,414 0.7%Provincial parks and protected areas 13,008,110 14.3%Regional parks* 79,584 0.1%Conservation landsWildlife Management Areas 232,941 0.3%All other conservation lands 98,812 0.1%Total 14,081,447 15.5%source: Ken Morrison and Karen Wipond, Parks and Protected Areas Division, Ministry <strong>of</strong> Environment. 2008.note: Federally designated marine protected areas are not included.*Only those regional parks for which data were available are included in the table and on the map.
130°W 120°W110°W60°NY u k o nN o r t h w e s tT e r r i t o r i e sB r i t i s hC o l u m b i at60°NM A P 1 4Parks, protected areasand conservation landsLegend!. CityRoadRiver/StreamLakeNational park*Provincial park/protected areaRegional park**Conservation landsWildlife Management AreaAll other conservation land***55°NFort St. JohnA l b e r t a55°N* Note: Federally designatedmarine protected areas are notincluded.** Regional parks information isnot complete.*** Land held for the purpose<strong>of</strong> conservation by the Ministry <strong>of</strong>Environment, Canadian WildlifeService or a non-governmentalorganization.Prince RupertEdmontonPrince GeorgeQueenCharlotteIslandsArea <strong>of</strong> DetailCalgary0 100 200Kilometres50°NP a c i f i cO c e a nKamloopsKelowna50°NData sources:B.C. Conservation Land Forum,B.C. Ministry <strong>of</strong> EnvironmentMap by:Caslys Consulting LtdVancouverIslandVancouverCrestonProjection:<strong>BC</strong> Albers NAD83Produced for:VictoriaU N I T E D S T A T E SFebruary 25, 2009130°W120°W
4the biodiversity atlas <strong>of</strong> british columbia
SpeciesSpecies interact within ecosystems, performing essential ecological functions necessary for life onearth. With a wide variety <strong>of</strong> ecosystems resulting from its complex topography and climate, <strong>British</strong><strong>Columbia</strong> supports a rich diversity <strong>of</strong> species. <strong>The</strong> province is home to more species <strong>of</strong> native vascularplants, mosses, mammals, butterflies and breeding birds than any other Canadian province or territory. 58More than 50,000 native species are thought to live here, 59 the majority <strong>of</strong> which are yet to be described by science.Known species include 600 vertebrates, over 2,000 vascular plant species, 1,000 mosses and liverwortsand at least 1,600 lichens. Invertebrate species alone are estimated to number in the tens <strong>of</strong> thousands. 60Most species in <strong>British</strong> <strong>Columbia</strong> are poorly documented. Surveys and incidental observations are <strong>of</strong>tensporadic and inconsistent and/or concentrated along roads and in areas <strong>of</strong> higher human population. Parts <strong>of</strong>the province have never been surveyed and a number <strong>of</strong> taxonomic groups have never been assessed. <strong>The</strong> onlygroups <strong>of</strong> organisms for which lists <strong>of</strong> species within the province are complete or near-complete are vascularplants and vertebrates within terrestrial ecosystems. Invertebrates, non-vascular plants, lichens, fungi, andmany freshwater species are not well surveyed. It is thought that less than 10% <strong>of</strong> the invertebrates occurringwithin the province are known, particularly among soil organisms and arboreal species. 61This section provides information on those native species for which computerized location data, collectedbetween 1961 and 2006, is available. This is a fraction <strong>of</strong> the total species potentially found in B.C. Subspecies, varietiesand populations, many <strong>of</strong> which are <strong>of</strong> conservation concern, have not been assessed for this report.American bison (Bos bison).photo: frank leung.
6the biodiversity atlas <strong>of</strong> british columbiaSpecies RichnessSpecies richness is one common measure<strong>of</strong> biodiversity calculated as the number<strong>of</strong> species in a given area (p. 2).Map 15 shows patterns <strong>of</strong> species richnessfor 2,640 native species in 11 <strong>of</strong> themost well-studied groups in B.C. (Table 8).Species richness for the species assessed ishighest in the south <strong>of</strong> the province and onVancouver Island, areas <strong>of</strong> highest humanpopulation. <strong>The</strong> biogeoclimatic zones withhighest species richness 62 are PonderosaPine, Coastal Douglas-fir, Bunchgrass andInterior Douglas-fir, all zones <strong>of</strong> conservationconcern (p. 22). 63Note that the data are biased because<strong>of</strong> uneven survey effort. <strong>The</strong>re are far fewerrecords from the northern part <strong>of</strong> the provincethan in the south where more peoplelive and where surveys are more likely to beconducted. Species richness in many parts<strong>of</strong> the north is likely far greater than themaps depict. For example, some large areasappearing to have low species richness arethe most inaccessible in the province (e.g.,north <strong>of</strong> Spatsizi Provincial Park) and havenot been well surveyed. Such is also the casealong B.C.’s long, rugged coastline.When data for 2,295 terrestrial speciesand 594 freshwater species are mappedseparately, somewhat different patterns <strong>of</strong>species richness are evident (Map 16, p. 38and Map 17, p. 39). While both maps showhigh species richness in the south <strong>of</strong> theprovince, areas <strong>of</strong> relatively high freshwaterspecies richness extend further north. Notethat areas <strong>of</strong> high freshwater species richnessgenerally have fewer species than areas<strong>of</strong> high terrestrial species richness.table 8. native terrestrial and freshwater species in b.c. assessedfor species richness.species groupVertebrates 391 319 109Amphibians 20 20 17Birds 187 185 18Freshwater Fishes 70 0 70Mammals 102 102 3Reptiles and Turtles 12 12 1Invertebrates 257 257 85Butterflies and Skippers 172 172 0Dragonflies and Damselflies 85 85 85Vascular Plants 1,992 1,718 400Ferns and Fern Allies 103Conifers 25Flowering Plants (Monocots) 525Flowering Plants (Dicots) 1,339number <strong>of</strong> native species mappedall SPECIES Terrestrial FreshwaterNot differentiated Not differentiated576 194TOTAL 2,640 2,294 594source: Warman, L. and G.G.E. Scudder. 2007. Species Richness and Summed Irreplaceability in B.C. <strong>Biodiversity</strong> <strong>BC</strong>,Victoria, <strong>BC</strong>. 36pp. Available at: www.biodiversitybc.org.note: A terrestrial species requires terrestrial habitat for at least one <strong>of</strong> its life requisites. A freshwater species requiresfreshwater habitat (lakes, rivers, streams and wetlands) for at least one <strong>of</strong> its life requisites. A species can require bothfreshwater and terrestrial habitats and therefore will appear in numbers for both.
t130°W 120°W110°W60°NY u k o nN o r t h w e s tT e r r i t o r i e s60°NM A P 1 5Species richness*Legend!. CityRoadRiver/StreamLakeNumber <strong>of</strong> species4 - 27B r i t i s h28 - 4546 - 72C o l u m b i a73 - 9798 - 132133 - 166Fort St. JohnA l b e r t a167 - 210211 - 266267 - 36955°N55°N370 - 940Units = number <strong>of</strong> species per gridsquare based on observations from1961-2006 (2,640 species total).Prince RupertEdmontonPrince GeorgeQueenCharlotteIslandsArea <strong>of</strong> DetailEqual Interval ClassificationCalgary0 100 200Kilometres50°NNumber <strong>of</strong> speciesP a c i f i cO c e a nKamloopsKelowna50°NData sources:Compiled by the University <strong>of</strong><strong>British</strong> <strong>Columbia</strong>Map by:Caslys Consulting Ltd4 - 9899 - 191192 - 285286 - 378379 - 472VancouverIslandVancouverProjection:<strong>BC</strong> Albers NAD83Produced for:473 - 566567 - 659660 - 753VictoriaU N I T E D S T A T E S754 - 846847 - 940*Based on documented observations (the lack <strong>of</strong> an observation does not necessarily mean a species is not present).February 4, 2009130°W120°W
130°W 120°W110°W60°N8Y u k o nN o r t h w e s tT e r r i t o r i e sthe biodiversity atlas <strong>of</strong> british M A P columbia1 6Terrestrial speciesrichness*t60°NLegend!. CityRoadRiver/StreamLakeNumber <strong>of</strong> speciesB r i t i s hC o l u m b i aNo observations2 - 3940 - 8081 - 117118 - 156Fort St. JohnA l b e r t a157 - 205206 - 265266 - 337338 - 42355°N55°N424 - 557558 - 840Units = number <strong>of</strong> species per gridsquare based on observations from1961-2006 (2,294 species total).Prince RupertEdmontonPrince GeorgeQueenCharlotteIslandsArea <strong>of</strong> Detail50°NEqual Interval ClassificationNumber <strong>of</strong> speciesNo observations2 - 8687 - 170171 - 253254 - 337338 - 421P a c i f i cO c e a nVancouverIslandVancouverKamloopsKelownaCalgary50°N0 100 200KilometresData sources:Compiled by the University <strong>of</strong><strong>British</strong> <strong>Columbia</strong>Map by:Caslys Consulting LtdProjection:<strong>BC</strong> Albers NAD83Produced for:422 - 505506 - 589590 - 672VictoriaU N I T E D S T A T E S673 - 756757 - 840*Based on documented observations (the lack <strong>of</strong> an observation does not necessarily mean a species is not present).February 4, 2009130°W120°W
t130°W 120°W110°WM A P 1 760°NY u k o nN o r t h w e s tT e r r i t o r i e s60°NFreshwater speciesrichness*Legend!. CityRoadRiver/StreamLakeNumber <strong>of</strong> speciesB r i t i s hC o l u m b i aNo observations1 - 1415 - 1920 - 2425 - 30Fort St. JohnA l b e r t a31 - 3839 - 4546 - 5657 - 6955°N55°N70 - 8788 - 223Units = number <strong>of</strong> species per gridsquare based on observations from1961-2006 (594 species total).Prince RupertPrince GeorgeEdmontonQueenCharlotteIslandsArea <strong>of</strong> DetailCalgary0 100 20050°NEqual Interval ClassificationNumber <strong>of</strong> speciesNo observations1 - 23P a c i f i cO c e a nKamloopsKelowna50°NKilometresData sources:Compiled by the University <strong>of</strong><strong>British</strong> <strong>Columbia</strong>Map by:Caslys Consulting Ltd24 - 4546 - 6869 - 9091 - 112VancouverIslandVancouverProjection:<strong>BC</strong> Albers NAD83Produced for:113 - 134135 - 156157 - 179VictoriaU N I T E D S T A T E S180 - 201202 - 223*Based on documented observations (the lack <strong>of</strong> an observation does not necessarily mean a species is not present).February 4, 2009130°W120°W
40 the biodiversity atlas <strong>of</strong> british columbiaSpecies <strong>of</strong> Conservation ConcernConservation status is the level <strong>of</strong> risk <strong>of</strong>extirpation (provincial loss) or extinction(global loss) for a species. Species <strong>of</strong>conservation concern are those classified ascritically imperilled (1), imperilled (2), or vulnerable(3) by NatureServe Canada k accordingto a set <strong>of</strong> criteria including number <strong>of</strong>occurrences, population size, extent <strong>of</strong> range,area <strong>of</strong> occupancy, population and habitattrends, type and severity <strong>of</strong> threats, level <strong>of</strong>protection and intrinsic vulnerability. 64 <strong>The</strong>analysis <strong>of</strong> conservation status was applied attwo geographic levels, global or range-wide(G) and subnational or province-wide (S).<strong>The</strong> conservation status rank <strong>of</strong> a species isusually different at each geographic level.For example, the sharp-tailed snake (Contiatenuis) has a global conservation status rank<strong>of</strong> G5 indicating its secure status across itsentire range; whereas it has a provincial conservationstatus rank <strong>of</strong> S1 to convey its veryhigh risk <strong>of</strong> extirpation in B.C.B.C. has the highest number <strong>of</strong> nativespecies <strong>of</strong> global conservation concern inCanada compared to other provinces andterritories. 65 Of the 3,808 B.C. native speciesassessed for conservation status, 6% are <strong>of</strong>global conservation concern (Table 9). Map18 shows species richness for all 233 species<strong>of</strong> global conservation concern. High concentrationsoccur on Vancouver Island, theQueen Charlotte Islands/Haida Gwaii andthe Lower Mainland. Certain species groupssuch as invertebrates, lichens and fungihave not been well assessed for conservationstatus in the province.table 9. summary <strong>of</strong> b.c. native species by global and provincial conservationstatus.conservation status rankgloBAL (G RANK) Provincial (S RANK)Total Percentage number Percentagespecies <strong>of</strong> species <strong>of</strong> species <strong>of</strong> speciesExtinct or Extirpated (GX, SX) 1
t130°W 120°W110°W60°NY u k o nN o r t h w e s tT e r r i t o r i e s60°NM A P 1 8Species richness:species <strong>of</strong> globalconservation concern*Legend!. CityRoadRiver/StreamLakeNumber <strong>of</strong> speciesB r i t i s hC o l u m b i aNo observations1234Fort St. JohnA l b e r t a567855°N55°N10 - 1314 - 24Units = number <strong>of</strong> species per gridsquare based on observations from1961-2006 (233 species total).Prince RupertEdmontonPrince GeorgeQueenCharlotteIslandsArea <strong>of</strong> DetailCalgary0 100 20050°NEqual Interval ClassificationNumber <strong>of</strong> speciesNo observationsP a c i f i cO c e a nKamloopsKelowna50°NKilometresData sources:Compiled by the University <strong>of</strong><strong>British</strong> <strong>Columbia</strong>Map by:Caslys Consulting Ltd1 - 34 - 67 - 89 - 1011 - 13VancouverIslandVancouverProjection:<strong>BC</strong> Albers NAD83Produced for:14 - 1516 - 1718 - 19VictoriaU N I T E D S T A T E S20 - 2223 - 24*Based on documented observations (the lack <strong>of</strong> an observation does not necessarily mean a species is not present).February 4, 2009130°W120°W
42 the biodiversity atlas <strong>of</strong> british columbiaSpecies <strong>of</strong> conservation concern continued...Forty-three percent <strong>of</strong> B.C. native speciesassessed for conservation status are <strong>of</strong> provincialconservation concern (Table 9). Map19 shows the distribution <strong>of</strong> species richnessfor all 1,640 species <strong>of</strong> provincial conservationconcern in B.C. Concentrations <strong>of</strong>species <strong>of</strong> provincial conservation concernare evident in the southern part <strong>of</strong> theprovince and on the large <strong>of</strong>fshore islands.<strong>The</strong> high proportion <strong>of</strong> species <strong>of</strong> provincialconservation concern reflects, in part, thehigh number whose habitat in B.C. was rareeven before European contact as well as theconcentration <strong>of</strong> ecosystem conversion(p. 80) in some areas. For example, close to20% <strong>of</strong> the land area in the Bunchgrass andPonderosa Pine biogeoclimatic zones (p. 20)in the southern interior has been convertedto human uses, 66 with significant impactsto many native grassland species livingthere, including the burrowing owl (Athenecuniculari) and the yellow-breasted chat(Icteria virens). Both <strong>of</strong> these bird species arecritically imperilled in the province. 67 Almost50% <strong>of</strong> the Coastal Douglas-fir zone (p. 80)on Vancouver Island and the Gulf Islandshas been converted to human uses, with lessthan 5% <strong>of</strong> the original area <strong>of</strong> the Garry oakecosystems found in this zone remaining innear-natural condition. 68 Garry oak and relatedecosystems are home to many species<strong>of</strong> conservation concern such as the sharptailedsnake (Contia tenuis) and Macoun’smeadowfoam (Limnanthes macounii), aprovincially imperilled plant. 69,70Sharp-tailed snake (Contia tenuis).photo: kristiina ovaska.
t130°W 120°W110°WM A P 1 960°NY u k o nN o r t h w e s tT e r r i t o r i e s60°NSpecies richness:species <strong>of</strong> provincialconservation concern*Legend!. CityRoadRiver/StreamLakeNumber <strong>of</strong> speciesB r i t i s hC o l u m b i a1 - 45 - 78 - 1011 - 13Fort St. JohnA l b e r t a14 - 1718 - 2223 - 2930 - 3855°N55°N39 - 5960 - 200Units = number <strong>of</strong> species per gridsquare based on observations from1961-2006 (1,640 species total).Prince RupertEdmontonPrince GeorgeQueenCharlotteIslandsArea <strong>of</strong> DetailCalgary0 100 20050°NEqual Interval ClassificationNumber <strong>of</strong> speciesP a c i f i cO c e a nKamloopsKelowna50°NKilometresData sources:Compiled by the University <strong>of</strong><strong>British</strong> <strong>Columbia</strong>Map by:Caslys Consulting Ltd1 - 2122 - 4142 - 6162 - 8182 - 101VancouverIslandVancouverProjection:<strong>BC</strong> Albers NAD83Produced for:102 - 120121 - 140141 - 160161 - 180VictoriaU N I T E D S T A T E S181 - 200*Based on documented observations (the lack <strong>of</strong> an observation does not necessarily mean a species is not present).February 4, 2009130°W120°W
44 the biodiversity atlas <strong>of</strong> british columbiaProportion <strong>of</strong> Global Range for Species<strong>The</strong> proportion <strong>of</strong> global range for aspecies was assessed based on sevenclasses ranging from 1 (Endemic: 100% <strong>of</strong>global range or population is in B.C.) to 7(Low and Localized: less than 10% <strong>of</strong> rangeor population is in B.C. and occurs over lessthan 30% <strong>of</strong> the province) (Table 10). Speciesin classes 1-3 (Endemic, Very High andHigh) have a majority (greater than 50%) <strong>of</strong>their range, area or population within theprovince.Consideration <strong>of</strong> the proportion <strong>of</strong> aspecies’ global range should be balanced byconsideration <strong>of</strong> how the species is distributedacross other jurisdictions. 71 This isparticularly important for species that areranked low and widespread (meaning a lowproportion <strong>of</strong> their global range occurs inB.C. but they still occupy greater than 30%<strong>of</strong> the province and by extension must havea large global range). For example, fishers(Martes pennanti) are sufficiently wide-spread globally that no jurisdiction has morethan 10% <strong>of</strong> the global range.Of 3,841 native species in 13 groupsassessed for proportion <strong>of</strong> global range, 99(3%) were determined to have greater than50% <strong>of</strong> their range in B.C. 72 Computerizedlocation data was available for 82 <strong>of</strong> these 99species. Species richness for these 82 speciesis mapped on the facing page (Map 20). Areas<strong>of</strong> the province with the highest number<strong>of</strong> species with the majority <strong>of</strong> their rangein B.C. are concentrated in the south <strong>of</strong> theprovince, on the Queen Charlotte Islands/Haida Gwaii, and on Vancouver Island.table 10. classification system for proportion <strong>of</strong> global range: species.Townsend’s vole (Micotus townsendii).photo: david shackleton.1 Endemic 100% <strong>of</strong> the range, area or population is within the province2 Very High 75-99% <strong>of</strong> the range, area or population is within the province3 High 51-74% <strong>of</strong> the range, area or population is within the province4 Moderately High 30-50% <strong>of</strong> the range, area or population is within the province5 Intermediate 11-29% <strong>of</strong> the range, area or population is within the province6 Low and Widespread less than 10% <strong>of</strong> the range, area or population is within the provincebut occurs over greater than 30% <strong>of</strong> the province.7 Low and Localized less than 10% <strong>of</strong> the range, area or population is within the provinceand is localized, occurring over less than 30% <strong>of</strong> the province.source: Bunnell, F., L. Kremsater and I. Houde. 2006. Applying the Concept <strong>of</strong> Stewardship Responsibility in <strong>British</strong><strong>Columbia</strong>: 2007 Update. <strong>Biodiversity</strong> <strong>BC</strong>, Victoria, <strong>BC</strong>. 188pp. Available at: www.biodiversitybc.org.note: Boldface indicates that species in this global range class are included on Map 20.
t130°W 120°W110°W60°NY u k o nN o r t h w e s tT e r r i t o r i e s60°NM A P 2 0Species richness: specieswith a majority <strong>of</strong> theirglobal range in B.C.*Legend!. CityRoadRiver/StreamLakeNumber <strong>of</strong> speciesB r i t i s hNo observations1 - 2C o l u m b i a3 - 45 - 67 - 8Fort St. JohnA l b e r t a9 - 1011 - 1213 - 1455°N55°N15 - 1617 - 1920 - 35Units = number <strong>of</strong> species per gridsquare based on observations from1961-2006 (82 species total).Prince RupertEdmontonPrince GeorgeQueenCharlotteIslandsArea <strong>of</strong> DetailCalgary0 100 20050°NEqual Interval ClassificationNumber <strong>of</strong> speciesNo observations1 - 45 - 89 - 1112 - 1516 - 1819 - 2122 - 2526 - 2829 - 3233 - 35P a c i f i cO c e a nVancouverIslandVancouverVictoriaKamloopsKelownaU N I T E D S T A T E S*Based on documented observations (the lack <strong>of</strong> an observation does not necessarily mean a species is not present).50°NKilometresData sources:Compiled by the University <strong>of</strong><strong>British</strong> <strong>Columbia</strong>Map by:Caslys Consulting LtdProjection:<strong>BC</strong> Albers NAD83Produced for:February 4, 2009130°W120°W
46 the biodiversity atlas <strong>of</strong> british columbiaAmphibians<strong>British</strong> <strong>Columbia</strong> has 20 species <strong>of</strong> amphibianswhich include the salamanders,newts, toads and frogs. 73 Amphibians,as small predators, play important rolesin food chains and eat large numbers <strong>of</strong>insects. Except for three terrestrial salamanders,all amphibians are reliant on freshwaterecosystems for one or more <strong>of</strong> their liferequisites, usually a larval stage.Species richness for B.C.’s amphibians isshown on Map 21. <strong>The</strong> large area classifiedas ‘no observations’ indicates a particularlack <strong>of</strong> available data for this group.Many species <strong>of</strong> amphibians are decliningover most <strong>of</strong> their Canadian range. 74 Asingle species, Oregon spotted frog (Ranapretiosa), is imperilled globally, while at theprovincial level, 9 amphibians are <strong>of</strong> conservationconcern (Table 11).Fifty-five percent <strong>of</strong> the province’s amphibianshave less than 10% <strong>of</strong> their rangeor population within B.C. and occur here atthe northern extent <strong>of</strong> their ranges (p. 44). 75<strong>Columbia</strong> spotted frog (Rana luteiventris), aspecies which is apparently secure (p. 40) inits global range, is the only amphibian whichhas greater than 50% <strong>of</strong> its range or populationin B.C.Within Canada, thirteen species <strong>of</strong> nativeamphibians are found only in B.C., 76 howevernone are endemic to the province.table 11. native amphibians <strong>of</strong> conservation concern in b.c.SPECIES NAME, COMMON NAMEgloBALCONSERVATION RANKproVINCIAL<strong>Columbia</strong> spotted frog (Rana luteiventris).photo: werner eigelsreiter.Ambystoma tigrinum, tiger salamander Secure (G5) Imperilled (S2)Ascaphus montanus, Rocky Mountain tailed frog Apparently secure (G4) Critically imperilled (S1)Ascaphus truei, coastal tailed frog Apparently secure (G4) Vulnerable/apparentlysecure (S3S4)Dicamptodon tenebrosus, Pacific giant salamander Secure (G5) Imperilled (S2)Plethodon idahoensis, Coeur d’Alene salamander Apparently secure (G4) Vulnerable (S3)Rana aurora, red-legged frog Apparently secure (G4) Vulnerable/apparentlysecure (S3S4)Rana pipiens, northern leopard frog Secure (G5) Critically imperilled (S1)Rana pretiosa, Oregon spotted frog Imperilled (G2) Critically imperilled (S1)Spea intermontana, Great Basin spadefoot Secure (G5) Vulnerable (S3)source: Anions, M. 2006. Global and Provincial Status <strong>of</strong> Species in <strong>British</strong> <strong>Columbia</strong>: 2007 Update. <strong>Biodiversity</strong> <strong>BC</strong>,Victoria, <strong>BC</strong>. 16pp. Available at: www.biodiversitybc.org.
t130°W 120°W110°W60°NY u k o nN o r t h w e s tT e r r i t o r i e s60°NM A P 2 1Species richness:amphibians*Legend!. CityRoadRiver/StreamLakeNumber <strong>of</strong> speciesB r i t i s hC o l u m b i aNo observations1234Fort St. JohnA l b e r t a567855°N55°N910Units = number <strong>of</strong> species per gridsquare based on observations from1961-2006 (20 species total).Prince RupertEdmontonPrince GeorgeQueenCharlotteIslandsArea <strong>of</strong> DetailCalgary0 100 200Kilometres50°NP a c i f i cO c e a nKamloopsKelowna50°NData sources:Compiled by the University <strong>of</strong><strong>British</strong> <strong>Columbia</strong>Map by:Caslys Consulting LtdVancouverIslandVancouverProjection:<strong>BC</strong> Albers NAD83Produced for:VictoriaU N I T E D S T A T E S*Based on documented observations (the lack <strong>of</strong> an observation does not necessarily mean a species is not present).February 4, 2009130°W120°W
48 the biodiversity atlas <strong>of</strong> british columbiaPerching BirdsBirds comprise the largest vertebrategroup in <strong>British</strong> <strong>Columbia</strong> with 353species. 77 This is the most well-studied groupin the province, surveyed yearly throughprograms such as the Christmas Bird Count 78and the Breeding Bird Survey. 79 Birds play anumber <strong>of</strong> ecological roles. Some, like goldeneagles (Aquila chrysaetos) are top predators,while woodpeckers create cavities in treesthat are used by other species for nesting,shelter and feeding. A large number <strong>of</strong> migratorybirds pass through B.C., stopping to feedand rest during their long journeys.Map 22 shows species richness for the142 perching birds (passerines) for whichcomputerized location data was available. l<strong>The</strong> large area classified as ‘no observations’indicates a particular lack <strong>of</strong> available datafor this group.<strong>The</strong> perching birds include, amongothers, the flycatchers, swallows, warblers,sparrows, wrens and finches – familiar birds<strong>of</strong> forests, open meadows, wetlands, andgrasslands.None <strong>of</strong> the perching birds are <strong>of</strong> conservationconcern in their global range, butthere are 18 species <strong>of</strong> conservation concernwithin B.C. (p.42) (Table 12).table 12. native perching birds <strong>of</strong> conservation concern in b.c.SPECIES NAME, COMMON NAMEAmmodramus leconteii, Le Conte’s sparrowApparently secure (G4) Vulnerable/apparentlysecure (S3S4B)Ammodramus nelsoni, Nelson’s sharp-tailed sparrow Secure (G5) Imperilled (S2B)Ammodramus savannarum, grasshopper sparrow Secure (G5) Imperilled (S2B)Calcarius pictus, Smith’s longspur Secure (G5) Vulnerable/apparentlysecure (S3S4B)Catherpes mexicanus, canyon wren Secure (G5) Vulnerable (S3)Chondestes grammacus, lark sparrow Secure (G5) Imperilled (S2B)Dendroica castanea, bay-breasted warbler Secure (G5) Imperilled (S2B)Dendroica tigrina, Cape May warbler Secure (G5) Imperilled (S2B)Dendroica virens, black-throated green warbler Secure (G5) Vulnerable (S3B)Dolichonyx oryzivorus, bobolink Secure (G5) Vulnerable (S3B)Empidonax wrightii, gray flycatcher Secure (G5) Vulnerable (S3B)Euphagus carolinus, rusty blackbirdApparently secure (G4) Vulnerable/apparentlysecure (S3S4B)Hirundo rustica, barn swallow Secure (G5) Vulnerable/apparentlysecure (S3S4B)Icteria virens, yellow-breasted chat Secure (G5) Critically imperilled/imperilled (S1S2B)Oporornis agilis, Connecticut warblerCONSERVATION RANKgloBALproVINCIALApparently secure (G4) Imperilled (S2B)Oreoscoptes montanus, sage thrasher Secure (G5) Critically imperilled (S1B)Progne subis, purple martin Secure (G5) Imperilled/vulnerable (S2S3B)Wilsonia canadensis, Canada warbler Secure (G5) Vulnerable/apparently secure(S3S4B)source: Anions, M. 2006. Global and Provincial Status <strong>of</strong> Species in <strong>British</strong> <strong>Columbia</strong>. <strong>Biodiversity</strong> <strong>BC</strong>: 2007 Update.<strong>Biodiversity</strong> <strong>BC</strong>, Victoria, <strong>BC</strong>. 16pp. Available at: www.biodiversitybc.org.note: B indicates rank for breeding only.lNon-passerines are not included on the map owing to a lack <strong>of</strong> available computerized location data.
t130°W 120°W110°WM A P 2 260°NY u k o nN o r t h w e s tT e r r i t o r i e s60°NSpecies richness:perching birds*Legend!. CityRoadRiver/StreamLakeNumber <strong>of</strong> speciesB r i t i s hC o l u m b i aNo observations12 - 45 - 910 - 15Fort St. JohnA l b e r t a16 - 2223 - 3435 - 4445 - 5955°N55°N60 - 8283 - 123Units = number <strong>of</strong> species per gridsquare based on observations from1961-2006 (142 species total).Prince RupertPrince GeorgeEdmontonQueenCharlotteIslandsArea <strong>of</strong> DetailCalgary0 100 20050°NEqual Interval ClassificationNumber <strong>of</strong> speciesNo observations1 - 13P a c i f i cO c e a nKamloopsKelowna50°NKilometresData sources:Compiled by the University <strong>of</strong><strong>British</strong> <strong>Columbia</strong>Map by:Caslys Consulting Ltd14 - 2526 - 3839 - 5051 - 62VancouverIslandVancouverProjection:<strong>BC</strong> Albers NAD83Produced for:63 - 7475 - 8687 - 99VictoriaU N I T E D S T A T E S100 - 111112 - 123*Based on documented observations (the lack <strong>of</strong> an observation does not necessarily mean a species is not present).February 4, 2009130°W120°W
0the biodiversity atlas <strong>of</strong> british columbiaFreshwater FishesFreshwater fishes in B.C. are a geneticallyfascinating group. Many fishesoccurring in B.C. are found nowhere else inCanada and some are found nowhere elsein the world. 80 <strong>The</strong> complex topography andrelatively recent glaciations <strong>of</strong> the provincehave resulted in rapid genetic divergence<strong>of</strong> some species, such as salmon, where anexplosion <strong>of</strong> genetic diversity has occurredat the population level.Map 23 shows species richness for 70<strong>of</strong> B.C.’s freshwater fishes, including thosetaxa listed in Table 13, which have not been(and due to their taxonomic complexitymay never be) assigned formal scientificnames. 81 <strong>The</strong>se ‘unnamed’ taxa, many whichare endemic to B.C., are scientifically importantand almost all are <strong>of</strong> conservationconcern (p. 40). For example, the pairs <strong>of</strong>limnetic and benthic sticklebacks (Gasterosteussp.) found in several geographicallyisolated lakes, are fascinating examples<strong>of</strong> parallel evolution and represent some<strong>of</strong> the most interesting elements <strong>of</strong> B.C.’sfreshwater fish biodiversity. Overall, close to5% <strong>of</strong> B.C.’s species <strong>of</strong> freshwater fishes are<strong>of</strong> global conservation concern, while 34%are <strong>of</strong> provincial conservation concern. 82Five freshwater fish species (7.5%) have themajority <strong>of</strong> their global range in B.C. (p. 44) 83including bull trout (Salvelinus confluentus),and Cowichan Lake (or Vancouver Island)lamprey (Lampetra macrostoma), both <strong>of</strong>which are critically imperilled in their globalranges. 84table 13. endemic freshwater fishes in b.c. currently without formalscientific species namesSPECIES NAME, COMMON NAMEGLOBALCONSERVATION RANKproVINCIALCottus sp. 2, Cultus, pygmy sculpin Critically imperilled (G1) Critically imperilled (S1)Gasterosteus sp. 1, giant stickleback Critically imperilled (G1) Critically imperilled (S1)Gasterosteus sp. 16, Vananda Creek Critically imperilled (G1) Critically imperilled (S1)limnetic sticklebackGasterosteus sp. 17, Vananda Creek Critically imperilled (G1) Critically imperilled (S1)benthic sticklebackGasterosteus sp. 18, Misty Lake Not ranked (GNR) Critically imperilled (S1)“lake” sticklebackGasterosteus sp. 19, Misty Lake Not ranked (GNR) Critically imperilled (S1)“stream” sticklebackGasterosteus sp. 2, Enos Lake Critically imperilled (G1) Critically imperilled (S1)limnetic sticklebackwGasterosteus sp. 3, Enos Lake Critically imperilled (G1) Critically imperilled (S1)benthic sticklebackGasterosteus sp. 4, Paxton Lake Critically imperilled (G1) Critically imperilled (S1)limnetic sticklebackGasterosteus sp. 5, Paxton Lake Critically imperilled (G1) Critically imperilled (S1)benthic sticklebackProsopium sp. 2, McCleese Lake Critically imperilled (G1) Not ranked (SNR)pygmy whitefishProsopium sp. 2, McClure Lake Critically imperilled (G1) Not ranked (SNR)pygmy whitefishSpirinchus sp. 1, pygmy longfin smelt Critically imperilled (G1) Critically imperilled (S1)source: Anions, M. 2006. Global and Provincial Status <strong>of</strong> Species in <strong>British</strong> <strong>Columbia</strong>. <strong>Biodiversity</strong> <strong>BC</strong>: 2007 Update.<strong>Biodiversity</strong> <strong>BC</strong>, Victoria, <strong>BC</strong>. 16pp. Available at: www.biodiversitybc.org.
t130°W 120°W110°WM A P 2 360°NY u k o nN o r t h w e s tT e r r i t o r i e s60°NSpecies richness:freshwater fishes*Legend!. CityRoadRiver/StreamLakeNumber <strong>of</strong> speciesNo observationsB r i t i s hC o l u m b i a2 - 1112 - 1314 - 1617 - 18Fort St. JohnA l b e r t a1920 - 2122 - 242555°N55°N26 - 2728 - 30Units = number <strong>of</strong> species per gridsquare based on observations from1961-2006 (70 species total).Prince RupertPrince GeorgeEdmontonQueenCharlotteIslandsArea <strong>of</strong> DetailCalgary0 100 20050°NEqual Interval ClassificationNumber <strong>of</strong> speciesNo observations2 - 5P a c i f i cO c e a nKamloopsKelowna50°NKilometresData sources:Compiled by the University <strong>of</strong><strong>British</strong> <strong>Columbia</strong>Map by:Caslys Consulting Ltd6 - 89 - 1011 - 1314 - 16VancouverIslandVancouverProjection:<strong>BC</strong> Albers NAD83Produced for:17 - 1920 - 2223 - 24VictoriaU N I T E D S T A T E S25 - 2728 - 30*Based on documented observations (the lack <strong>of</strong> an observation does not necessarily mean a species is not present).February 4, 2009130°W120°W
52 the biodiversity atlas <strong>of</strong> british columbiaMammalsMammals are one <strong>of</strong> the most recognizableand varied groups <strong>of</strong> vertebrates,ranging in size from moles, shrews and batsto the biggest animals on earth: the baleenwhales. An estimated 5,488 described species<strong>of</strong> mammals are found in the world, 85with 109 species native to B.C. 86B.C. is globally significant for its richness<strong>of</strong> large carnivore (e.g., wolves and cougars)and ungulate species (e.g., deer, elk, caribouand moose). 87 <strong>The</strong> ranges <strong>of</strong> 17 species <strong>of</strong>carnivores and ungulates in North Americahave contracted toward <strong>British</strong> <strong>Columbia</strong>,where wild populations <strong>of</strong> these mammals,lost in many other jurisdictions, are stillfound (Figure 5).Species richness for the 102 mammalsfor which computerized location data wasavailable is shown on Map 24. m Areas <strong>of</strong> highmammal richness for these species are concentratedin the south <strong>of</strong> the province andon Vancouver Island.Four <strong>of</strong> B.C.’s native mammal speciesare <strong>of</strong> global conservation concern and 29species are <strong>of</strong> provincial conservation concern(p. 40). 88 Five species have the majority<strong>of</strong> their global range (p. 44) in the province:Keen’s myotis (Myotis keenii), mountaingoat (Oreamnos americanus), northwesterndeer mouse (Peromyscus keeni), PacificaNumber<strong>of</strong> specieswater shrew (Sorex bendirii) and VancouverIsland marmot (Marmota vancouverensis); 89all are <strong>of</strong> conservation concern. 90Vancouver Island marmot, B.C.’s onlyendemic mammal, is critically imperilledin its global range.figure 5: Historic (a) and current (b) species richness for 17 carnivore and ungulate speciesthat have undergone significant range contractions in North America.source: Laliberte, A.S. and W.J. Ripple. 2004. Range contractions <strong>of</strong> North American carnivores and ungulates.Bioscience 54(2): 123-138.bmMap 24 does not include marine mammals.
t130°W 120°W110°WM A P 2 460°NY u k o nN o r t h w e s tT e r r i t o r i e s60°NSpecies richness:mammals*Legend!. CityRoadRiver/StreamLakeNumber <strong>of</strong> speciesNo observationsB r i t i s hC o l u m b i a1 - 6789Fort St. JohnA l b e r t a1011 - 1213 - 1415 - 1755°N55°N18 - 2122 - 52Units = number <strong>of</strong> species per gridsquare based on observations from1961-2006 (102 species total).Prince RupertPrince GeorgeEdmontonQueenCharlotteIslandsArea <strong>of</strong> DetailCalgary0 100 20050°NEqual Interval ClassificationNumber <strong>of</strong> speciesNo observations1 - 6P a c i f i cO c e a nKamloopsKelowna50°NKilometresData sources:Compiled by the University <strong>of</strong><strong>British</strong> <strong>Columbia</strong>Map by:Caslys Consulting Ltd7 - 1112 - 1617 - 2122 - 27VancouverIslandVancouverProjection:<strong>BC</strong> Albers NAD83Produced for:28 - 3233 - 3738 - 42VictoriaU N I T E D S T A T E S43 - 4748 - 52*Based on documented observations (the lack <strong>of</strong> an observation does not necessarily mean a species is not present).February 4, 2009130°W120°W
4the biodiversity atlas <strong>of</strong> british columbiaReptiles and TurtlesCompared to other parts <strong>of</strong> the world,<strong>British</strong> <strong>Columbia</strong> is a relatively inhospitableplace for reptiles and turtles. <strong>The</strong>re areabout 6,500 species <strong>of</strong> reptiles and turtles inthe world, most which live in tropical andsubtropical regions. 91 B.C. has 12 species:9 snakes, 2 lizards and 1 turtle. 92 However,compared to the rest <strong>of</strong> Canada, which asa whole has about 40 species, B.C.’s reptilefauna is relatively rich, exceeded in speciesnumbers only by Ontario and Quebec. 93 Thisdiversity is owing to the wide variety <strong>of</strong> suitablehabitats in B.C. ranging from the hot,dry interior to the coastal rainforests.Species richness for the 11 native species<strong>of</strong> reptiles and turtles for which computerizedlocation data was available is presentedon Map 25. <strong>The</strong> large area classified as ‘noobservations’ indicates a particular lack <strong>of</strong>available data for this group, however, basedon current data, the highest species richnessis in the dry southern Okanagan regionsouth <strong>of</strong> Kamloops and Kelowna.Western painted turtle (Chrysemys picta).photo: ian gardiner.Nine species <strong>of</strong> native reptiles andturtles are <strong>of</strong> conservation concern (p. 40)(Table 14). Two species have been extirpatedfrom the province, the western pond turtle(Actinemys marmorata), which is vulnerablein its global range, and the pigmyshort-horned lizard (Phrynosoma douglasii),known only from the Okanagan.table 14. native reptiles and turtles <strong>of</strong> conservation concern in b.c.SPECIES NAME, COMMON NAMECONSERVATION RANKGLOBALproVINCIALActinemys marmorata, western pond turtle Vulnerable (G3) Extirpated (SX)Chrysemys picta, western painted turtle Secure (G5) Vulnerable/apparentlysecure (S3S4)Coluber constrictor, racer Secure (G5) Vulnerable/apparentlysecure (S3S4)Contia tenuis, sharp-tailed snake Secure (G5) Critically imperilled (S1)Crotalus oreganus, western rattlesnake Secure (G5) Vulnerable (S3)Eumeces skiltonianus, western skink Secure (G5) Imperilled/vulnerable (S2S3)Hypsiglena torquata, night snake Secure (G5) Critically imperilled (S1)Phrynosoma douglasii, pygmy Secure (G5) Extirpated (SX)short-horned lizardPituophis catenifer, gopher snake Secure (G5) Vulnerable (S3)source: Anions, M. 2006. Global and Provincial Status <strong>of</strong> Species in <strong>British</strong> <strong>Columbia</strong>: 2007 Update. <strong>Biodiversity</strong> <strong>BC</strong>,Victoria, <strong>BC</strong>. 16pp. Available at: www.biodiversitybc.org.
t130°W 120°W110°WM A P 2 560°NY u k o nN o r t h w e s tT e r r i t o r i e s60°NSpecies richness:reptiles and turtles*Legend!. CityRoadRiver/StreamLakeNumber <strong>of</strong> speciesB r i t i s hNo observations1C o l u m b i a234Fort St. JohnA l b e r t a567 - 855°N55°N910Units = number <strong>of</strong> species per gridsquare based on observations from1961-2006 (11 species total).Prince RupertEdmontonPrince GeorgeQueenCharlotteIslandsArea <strong>of</strong> DetailCalgary0 100 20050°NEqual Interval ClassificationP a c i f i cO c e a nKamloopsKelowna50°NKilometresData sources:Compiled by the University <strong>of</strong><strong>British</strong> <strong>Columbia</strong>Map by:Caslys Consulting LtdNumber <strong>of</strong> speciesNo observations1 - 4VancouverIslandVancouverVictoriaU N I T E D S T A T E SProjection:<strong>BC</strong> Albers NAD83Produced for:5 - 78 - 10*Based on documented observations (the lack <strong>of</strong> an observation does not necessarily mean a species is not present).February 4, 2009130°W120°W
6the biodiversity atlas <strong>of</strong> british columbiaInsectsMap 26 includes available location datafor 1,383 native B.C. species from sixinsect groups: butterflies and skippers (orderLepidoptera); dragonflies and damselflies(order Odonata); the stoneflies (order Plecoptera);the true bugs (order Hemiptera:Heteroptera); antlions, snakeflies, lacewingsand allies (order Neuroptera); and the groundbeetles (order Coleoptera, family Carabidae)(Table 15). Insects have not been well studiedin <strong>British</strong> <strong>Columbia</strong> and large areas <strong>of</strong>the province have not been surveyed for thisgroup, indicated by the number <strong>of</strong> grid cellson the map classified as ‘no observations’.Information about the butterflies andskippers, and the dragonflies and damselfliescan be found on pages 58 and 60 respectively.<strong>The</strong> stoneflies <strong>of</strong> the order Plecoptera areaquatic insects found in or near fast-flowingstreams or on rocky lakeshores. <strong>The</strong>re areapproximately 1,550 species <strong>of</strong> this orderknown worldwide with 460 species describedin North America. 94 Stoneflies are importantsources <strong>of</strong> food for fish and other vertebrates,and are considered indicators <strong>of</strong> water quality,surviving only in clean, highly oxygenatedwater. Some stoneflies are carnivorous, othersfeed on bacteria, algae and plants.<strong>The</strong> true bugs are primarily terrestrial andfeed on plants (phytophagous), specificallyplant fluids. <strong>The</strong>y are common on grass,trees and shrubs. Some families, such asthe assassin bugs (Reduviidae), flower bugs(Anthocoridae) and damsel bugs (Nabidae)are completely predaceous, as are somegenera <strong>of</strong> plant bugs (Miridae) and stink bugs(Pentatomidae). Bedbugs (Cimicidae) feedon warm-blooded vertebrates. All the aquaticand semi-aquatic species are predaceous,feeding on other invertebrates, and sometimessmall vertebrates.<strong>The</strong> insects <strong>of</strong> the order Neuroptera arethe antlions, snakeflies, lacewings and theirallies. Most are terrestrial, usually foundnear their larval habitat. <strong>The</strong> adults <strong>of</strong> somespecies are predaceous, others feed on nectarand pollen, while the larvae are predaceousor parasitic.table 15. b.c. native insect groups included on map 26.insect group<strong>The</strong> family Carabidae, commonly calledthe ground beetles, is the second largestfamily <strong>of</strong> beetles in North America. Althoughvaried in appearance, most have shinyblack, elongate, somewhat flattened, mediumto large-sized bodies with long legs.Most adults are opportunistic predators<strong>of</strong> other invertebrates, although a few arespecialist snail predators and some feed onthe seeds <strong>of</strong> plants. <strong>The</strong> adults hide underobjects during the day, emerging to huntat night. <strong>The</strong> larvae are also predaceous.Ground beetles can be very sensitive to humanactivity and insecticides. Canada hasabout 930 species <strong>of</strong> ground beetle. 95Little is known about the global and provincialconservation concern <strong>of</strong> insect groupsin B.C.number <strong>of</strong> species mappedButterflies and skippers (order Lepidoptera) 172Dragonflies and damselflies (order Odonata) 85Stoneflies (order Plecoptera) 85True bugs (order Hemiptera: Heteroptera) 581Antlions, snakeflies, lacewings and allies (order Neuroptera) 74Ground beetles (order Coleoptera, family Carabidae) 386Total 1,383source: Warman, L. and G.G.E. Scudder. 2007. Species Richness and Summed Irreplaceability in B.C. <strong>Biodiversity</strong> <strong>BC</strong>,Victoria, <strong>BC</strong>. 36pp. Available at: www.biodiversitybc.org.
t130°W 120°W110°WM A P 2 660°NY u k o nN o r t h w e s tT e r r i t o r i e s60°NSpecies richness:insects*Legend!. CityRoadRiver/StreamLakeNumber <strong>of</strong> speciesB r i t i s hC o l u m b i aNo observations1 - 23 - 56 - 89 - 13Fort St. JohnA l b e r t a14 - 1920 - 2627 - 3536 - 5055°N55°N51 - 8687 - 526Units = number <strong>of</strong> species per gridsquare based on observations from1961-2006 (1,383 species total).Prince RupertPrince GeorgeEdmontonQueenCharlotteIslandsArea <strong>of</strong> DetailCalgary0 100 20050°NEqual Interval ClassificationNumber <strong>of</strong> speciesNo observations1 - 54P a c i f i cO c e a nKamloopsKelowna50°NKilometresData sources:Compiled by the University <strong>of</strong><strong>British</strong> <strong>Columbia</strong>Map by:Caslys Consulting Ltd55 - 106107 - 159160 - 211212 - 264VancouverIslandVancouverProjection:<strong>BC</strong> Albers NAD83Produced for:265 - 316317 - 369370 - 421VictoriaU N I T E D S T A T E S422 - 474475 - 526*Based on documented observations (the lack <strong>of</strong> an observation does not necessarily mean a species is not present).February 4, 2009130°W120°W
8the biodiversity atlas <strong>of</strong> british columbiaButterflies and SkippersButterflies and skippers are a subset <strong>of</strong>the large insect order Lepidoptera. <strong>The</strong>adults <strong>of</strong> the Lepidoptera are characterizedby two pairs <strong>of</strong> large, membranous wingswhich are covered, as are the body and legs,with overlapping scales. 96 Butterflies, many<strong>of</strong> which are brightly coloured, hold theirwings vertically over the body when at restand have a long, coiled, sucking proboscis(mouth part) and slender antennae witha clubbed tip. Skippers have proportionallysmaller wings and larger bodies thanbutterflies and hooked antennae tips. Adultbutterflies and skippers feed on the nectar<strong>of</strong> flowering plants and are important pollinators.Butterfly and skipper larvae feedstrictly on plants.<strong>British</strong> <strong>Columbia</strong> has 180 known nativespecies <strong>of</strong> butterflies and skippers. 97 <strong>The</strong> mapdisplays species richness for the 172 speciesfor which computerized location data wasavailable (Map 27). <strong>The</strong> large area classifiedas ‘no observations’ indicates a particularlack <strong>of</strong> available data for this group.Eighty-seven percent <strong>of</strong> this group haveless than 10% <strong>of</strong> their range in B.C. 98 Many<strong>of</strong> these species are at the northern edge <strong>of</strong>their range. Six species <strong>of</strong> the butterfly andskipper group are <strong>of</strong> conservation concern(p. 40) in their global range (3.3%) (Table16). At the provincial level, 46 species are <strong>of</strong>conservation concern. One species, viceroy(Limenitis archippus) has been extirpatedfrom B.C. but is secure in the rest <strong>of</strong> itsrange. A single species, the Vidler’s alpine(Erebia vidleri), has the majority <strong>of</strong> its globalrange in the province (p. 44), but is not <strong>of</strong>conservation concern.table 16. b.c. native butterfly and skipper species <strong>of</strong> global conservationconcern in b.c.species name, common nameEuphydryas gillettii, Gillette’s checkerspotBoloria alberta, Albert’s fritillaryBoloria natazhati, Beringian fritillaryCallophrys johnsoni, Johnson’s hairstreakColias occidentalis, western sulphurOeneis philipi, Philip’s arcticglobal conservation rankImperilled (G2)Vulnerable (G3)Vulnerable (G3)Vulnerable (G3)Vulnerable (G3)Vulnerable (G3)source: Anions, M. 2006. Global and Provincial Status <strong>of</strong> Species in <strong>British</strong> <strong>Columbia</strong>: 2007 Update. <strong>Biodiversity</strong> <strong>BC</strong>,Victoria, <strong>BC</strong>. 16pp. Available at: www.biodiversitybc.org.Vidler’s alpine (Erebia vidleri).photo: ian lane.
t130°W 120°W110°W60°NY u k o nN o r t h w e s tT e r r i t o r i e s60°NM A P 2 7Species richness:butterflies*Legend!. CityRoadRiver/StreamLakeNumber <strong>of</strong> speciesB r i t i s hNo observations1C o l u m b i a23 - 45 - 7Fort St. JohnA l b e r t a8 - 1011 - 1516 - 2122 - 3055°N55°N31 - 3839 - 99Units = number <strong>of</strong> species per gridsquare based on observations from1961-2006 (172 species total).Prince RupertPrince GeorgeEdmontonQueenCharlotteIslandsArea <strong>of</strong> DetailCalgary0 100 20050°NEqual Interval ClassificationNumber <strong>of</strong> speciesNo observations1 - 11P a c i f i cO c e a nKamloopsKelowna50°NKilometresData sources:Compiled by the University <strong>of</strong><strong>British</strong> <strong>Columbia</strong>Map by:Caslys Consulting Ltd12 - 2122 - 3031 - 4041 - 50VancouverIslandVancouverProjection:<strong>BC</strong> Albers NAD83Produced for:51 - 6061 - 7071 - 79VictoriaU N I T E D S T A T E S80 - 8990 - 99*Based on documented observations (the lack <strong>of</strong> an observation does not necessarily mean a species is not present).February 4, 2009130°W120°W
60 the biodiversity atlas <strong>of</strong> british columbiaDragonflies and Damselflies<strong>The</strong> dragonflies and damselflies are agroup <strong>of</strong> well-known insects from theorder Odonata. <strong>The</strong> adults have two pairs<strong>of</strong> large, elongate, membranous and manyveinedwings, which work independently toallow both backwards and forwards flight. 99This group is predaceous, the adults generallytaking flying insects while on the wing,including other odonates. <strong>The</strong> juvenile naiadsor nymphs live in freshwater, mostlyin still water (lentic) habitats although a feware moving-water (lotic) inhabitants. <strong>The</strong>ycan also occur in acidic waters, or alkalinesaline lakes. <strong>The</strong> naiads feed on aquatic invertebrates,tadpoles and sometimes fish.Of the 4,870 species known world-wide,430 have been recorded in Canada. 100 All 85native species known from <strong>British</strong> <strong>Columbia</strong>are included on the richness map (Map 28).<strong>The</strong> large area classified as ‘no observations’indicates a particular lack <strong>of</strong> available datafor this groupAs with butterflies and skippers, a largeproportion (88%) <strong>of</strong> dragonfly and damselflyspecies have less than 10% <strong>of</strong> theirglobal range in <strong>British</strong> <strong>Columbia</strong> (p. 44). 101No species <strong>of</strong> this group have the majority<strong>of</strong> their global range in B.C. One speciesis <strong>of</strong> global conservation concern (p. 40),the Quebec emerald (Somatochlora brevicincta),which lives near slightly acidicpools in mossy fens from the Cariboo to theRocky Mountains and north to the OminecaMountains. Twenty-one species <strong>of</strong>dragonfly and skipper are <strong>of</strong> concern at theprovincial level. 102Quebec emerald (Somatochlora brevicincta).photo: sidney dunkle.
t130°W 120°W110°WM A P 2 860°NY u k o nN o r t h w e s tT e r r i t o r i e s60°NSpecies richness:dragonflies anddamselflies*Legend!. CityRoadRiver/StreamLakeNumber <strong>of</strong> speciesB r i t i s hNo observations1C o l u m b i a2 - 34 - 56 - 7Fort St. JohnA l b e r t a8 - 910 - 1213 - 1516 - 2055°N55°N21 - 2829 - 50Units = number <strong>of</strong> species per gridsquare based on observations from1961-2006 (85 species total).Prince RupertPrince GeorgeEdmontonQueenCharlotteIslandsArea <strong>of</strong> DetailCalgary0 100 20050°NEqual Interval ClassificationNumber <strong>of</strong> speciesNo observations1 - 6P a c i f i cO c e a nKamloopsKelowna50°NKilometresData sources:Compiled by the University <strong>of</strong><strong>British</strong> <strong>Columbia</strong>Map by:Caslys Consulting Ltd7 - 1112 - 1617 - 2122 - 26VancouverIslandVancouverProjection:<strong>BC</strong> Albers NAD83Produced for:27 - 3031 - 3536 - 40VictoriaU N I T E D S T A T E S41 - 4546 - 50*Based on documented observations (the lack <strong>of</strong> an observation does not necessarily mean a species is not present).February 4, 2009130°W120°W
62 the biodiversity atlas <strong>of</strong> british columbiaSelected Freshwater Crustaceans: Diaptomid CopepodsCopepods are aquatic crustaceans foundwherever there is water. <strong>The</strong> wordcopepod means oar-footed and refers to thefive or six pairs <strong>of</strong> swimming legs that movetogether like the oars <strong>of</strong> a sculling shell. <strong>The</strong>reare over 24,000 described species in theworld. 103 <strong>The</strong> copepods are a versatile group,found in habitats ranging from fresh to saltwater, from subterranean caves to water inleaf litter, and from streams, rivers, and lakesto the sediment layer in the open ocean. <strong>The</strong>ycan live at the tops <strong>of</strong> mountains, in deepocean trenches, and from cold polar ice tohot hydrothermal vents. Important links inthe food chain, copepods are an importantsource <strong>of</strong> protein for fish, birds and othercrustaceans. <strong>The</strong>y are intermediate hosts <strong>of</strong>many human and animal parasites.Free-living freshwater copepods includethree Suborders: the Calanoida, the Cyclopoidaand the Harpacticoida. 104 <strong>The</strong> diaptomidcopepods are a family within the SuborderCalanoida. <strong>The</strong> richness map includestable 17. diaptomid copepods foundin saline lakes in b.c.species nameAglaodiaptomus leptopusHesperodiaptomus kiseriHesperodiaptomus nevadensisHesperodiaptomus novemdecimusHesperodiaptomus sp.nr.hirsutusLeptodiaptomus connexusLeptodiaptomus sicilissource: G.G.E. Scudder, <strong>The</strong> Nature Trust <strong>of</strong> <strong>British</strong><strong>Columbia</strong>, personal communication.note: these species do not have common names.all 85 species <strong>of</strong> native copepods from thefamily Diaptomidae known from <strong>British</strong> <strong>Columbia</strong>(Map 29). <strong>The</strong> large area classified as‘no observations’ indicates a particular lack<strong>of</strong> available data for this group.<strong>The</strong> diaptomid copepods typically occurin lakes, ponds and ditches, are planktonicand rarely found near shore. <strong>The</strong> groupincludes both freshwater species and thosethat live and thrive in inland saline lakes(Table 17). Saline lakes are those which havemore than 3 g/l salt content (see also p. 74).<strong>The</strong> southern interior plateau <strong>of</strong> B.C. is dottedwith small saline ponds usually less than1 km 2 in area, particularly in the Okanaganand Kamloops area and throughout theInterior Plateau. 105Saline lake.photo: sarma liepins.
t130°W 120°W110°W60°NY u k o nN o r t h w e s tT e r r i t o r i e s60°NM A P 2 9Species richness:selected freshwatercrustaceans(diaptomid copepods)*Legend!. CityRoadRiver/StreamLakeB r i t i s hNumber <strong>of</strong> speciesNo observationsC o l u m b i a123Fort St. JohnA l b e r t a45655°N55°N7Units = number <strong>of</strong> species per gridsquare based on observations from1961-2006 (85 species total).Prince RupertEdmontonPrince GeorgeQueenCharlotteIslandsArea <strong>of</strong> DetailCalgary0 100 200Kilometres50°NP a c i f i cO c e a nKamloopsKelowna50°NData sources:Compiled by the University <strong>of</strong><strong>British</strong> <strong>Columbia</strong>Map by:Caslys Consulting LtdVancouverIslandVancouverProjection:<strong>BC</strong> Albers NAD83Produced for:VictoriaU N I T E D S T A T E S*Based on documented observations (the lack <strong>of</strong> an observation does not necessarily mean a species is not present).February 4, 2009130°W120°W
64 the biodiversity atlas <strong>of</strong> british columbiaVascular PlantsTiger lily (Lilium columbianum).photo: werner eigelsreiter.table 18. native vascular plants inb.c. included on map 30.species groupnumber <strong>of</strong>species mappedFerns and Fern Allies 103Conifers 25Monocots 525Dicots 1,339Total 1,992source: Warman, L. and G.G.E. Scudder. 2007.Species Richness and Summed Irreplaceability in B.C.<strong>Biodiversity</strong> <strong>BC</strong>, Victoria, <strong>BC</strong>. 36pp. Available at: www.biodiversitybc.org.Vascular plants include flowering herbs,shrubs, trees and ferns with their allies(horsetails, club mosses and quillworts).<strong>The</strong>se plants provide essential structure toterrestrial ecosystems and are a primaryenergy source for animals (p.16). 106B.C. is known to have 2,093 species <strong>of</strong>native vascular plants. 107 Species richness forthe 1,992 native vascular plants for whichcomputerized location data was available(Table 18) is shown on Map 30. Highestspecies richness for the species assessed isconcentrated in the south <strong>of</strong> the provinceand on Vancouver Island.<strong>British</strong> <strong>Columbia</strong> is home to 91% <strong>of</strong>Canada’s native ferns and fern allies, includingone endemic species, corrupt spleenwort(Asplenium adulterinum). 108<strong>The</strong> giant trees <strong>of</strong> <strong>British</strong> <strong>Columbia</strong>’s temperaterainforests, famous around the worldfor their size and longevity, are members <strong>of</strong>the conifers, a group that includes 26 speciesin three families: the Pinaceae, Cupressaceae,and Taxaceae. Two conifer species are <strong>of</strong>concern provincially (p. 40): jack pine (Pinusbanksiana) and limber pine (Pinus flexilis). 109Monocotyledons (monocots) are agroup <strong>of</strong> flowering plants that tend to preferlow elevation grasslands and wetlands,ecosystems which are relatively uncommonin <strong>British</strong> <strong>Columbia</strong>. About 84% <strong>of</strong> the nativemonocots are at the edge <strong>of</strong> their globalrange in B.C. (p. 44). 110 A significant proportion<strong>of</strong> the monocots present (74%) belongto the grass-like plants or graminoids: thesedges (Cyperaceae), grasses (Poaceae), andrushes (Juncaceae). Other important families<strong>of</strong> monocots are the lilies (Liliaceae),orchids (Orchidaceae) and pondweeds(Potomagetonaceae). Two species have themajority <strong>of</strong> their global range in B.C.: tigerlily (Lilium columbianum) and broad-leavedtwayblade (Listera convallarioides). 111Dicotyledons (dicots), the largest <strong>of</strong> theplant groups assessed, include 88 families <strong>of</strong>flowering plants such as aster (Asteraceae),pea (Fabaceae), mustard (Brassicaceae), rose(Rosaceae), snapdragon (Scrophulariaceae),buttercup (Ranunculaceae), willow (Salicaceae)and carrot (Apiaceae). About 4% <strong>of</strong>B.C.’s dicotyledon plants are <strong>of</strong> global conservationconcern and 46% are <strong>of</strong> provincialconservation concern. 112 Four <strong>of</strong> these dicotspecies <strong>of</strong> conservation concern are endemicto B.C.: Queen Charlotte false rue-anemone(Enemion savilei), Queen Charlotte avens(Geum sch<strong>of</strong>ieldii), Macoun’s meadow-foam(Limnanthes macounii), and Taylor’s saxifrage(Saxifraga taylori). 113
t130°W 120°W110°WM A P 3 060°NY u k o nN o r t h w e s tT e r r i t o r i e s60°NSpecies richness:vascular plants*Legend!. CityRoadRiver/StreamLakeNumber <strong>of</strong> speciesB r i t i s hNo observations1 - 14C o l u m b i a15 - 3132 - 5354 - 75Fort St. JohnA l b e r t a76 - 100101 - 123124 - 156157 - 19855°N55°N199 - 259260 - 630Units = number <strong>of</strong> species per gridsquare based on observations from1961-2006 (1,992 species total).Prince RupertPrince GeorgeEdmontonQueenCharlotteIslandsArea <strong>of</strong> DetailCalgary0 100 20050°NEqual Interval ClassificationNumber <strong>of</strong> speciesNo observations1 - 6465 - 127128 - 190191 - 253254 - 316P a c i f i cO c e a nVancouverIslandVancouverKamloopsKelowna50°NKilometresData sources:Compiled by the University <strong>of</strong><strong>British</strong> <strong>Columbia</strong>Map by:Caslys Consulting LtdProjection:<strong>BC</strong> Albers NAD83Produced for:317 - 378379 - 441442 - 504VictoriaU N I T E D S T A T E S505 - 567568 - 630*Based on documented observations (the lack <strong>of</strong> an observation does not necessarily mean a species is not present).February 4, 2009130°W120°W
66 the biodiversity atlas <strong>of</strong> british columbiaMosses<strong>The</strong> bryophytes include the mosses,liverworts and hornworts. <strong>The</strong>se nonvascularplants lack well-developed waterandfood-conducting systems. 114 <strong>The</strong> lack<strong>of</strong> vascular tissues requires that bryophytesremain small and usually grow in placeswhere water is available, making <strong>British</strong><strong>Columbia</strong> a good place for this group. Somemoss species that live in arid places such asgrasslands can dry up and when wet againbegin to photosynthesize almost immediately.All bryophytes lack true roots and areattached to the substrate by slender, rootlikefilaments called rhizoids.Over 700 species <strong>of</strong> mosses are currentlylisted as occurring in B.C. 115 Mosses are themost common <strong>of</strong> the non-vascular plantsand the only bryophytes included on themap. Map 31 shows richness for the 690known native moss species with availablecomputerized location data.Many mosses are naturally rare in theprovince. Compared to 12 other speciesgroups assessed for conservation status(p. 40), mosses have the second highestpercentage <strong>of</strong> species <strong>of</strong> global conservationRoell’s brotherella moss (Brotherella roellii).photo: steve joya.concern (12%) and the highest percentage<strong>of</strong> species <strong>of</strong> provincial conservation concern(65%). 116 <strong>The</strong> five moss species knownto be endemic to B.C. are all <strong>of</strong> conservationconcern both globally and provincially(Table 19). 117Knowledge <strong>of</strong> mosses and moss distributionin B.C. is limited and the grouphas been poorly inventoried. Informationrequired to map richness for many mosses isincomplete. 118table 19. conservation status <strong>of</strong> some endemic mosses in b.c.SPECIES NAME, COMMON NAMEGLOBALCONSERVATION RANKproVINCIALPohlia pacifica, Imperilled (G2) Critically imperilled toPacific pohlia mossvulnerable (S1S3)Ctenidium sch<strong>of</strong>ieldii, Imperilled/vulnerable (G2G3) Imperilled/vulnerableSch<strong>of</strong>ield’s ctenidium moss(S2S3)Seligeria careyana, Critically imperilled (G1) Critically imperilled (S1)Carey small limestone mossBrotherella roellii, Vulnerable (G3) Vulnerable (S3)Roell’s brotherella mossWijkia carlottae, Imperilled (G2) Imperilled (S2)Carlotte’s wijkia mosssource: Anions, M. 2006. Global and Provincial Status <strong>of</strong> Species in <strong>British</strong> <strong>Columbia</strong>: 2007 Update. <strong>Biodiversity</strong> <strong>BC</strong>,Victoria, <strong>BC</strong>. 16pp. Available at: www.biodiversitybc.org.
t130°W 120°W110°WM A P 3 160°NY u k o nN o r t h w e s tT e r r i t o r i e s60°NSpecies richness:mosses*Legend!. CityRoadRiver/StreamLakeNumber <strong>of</strong> speciesB r i t i s hNo observations1 - 4C o l u m b i a5 - 910 - 1314 - 17Fort St. JohnA l b e r t a18 - 2324 - 3132 - 4243 - 5655°N55°N57 - 7980 - 253Units = number <strong>of</strong> species per gridsquare based on observations from1961-2006 (690 species total).Prince RupertPrince GeorgeEdmontonQueenCharlotteIslandsArea <strong>of</strong> DetailCalgary0 100 20050°NEqual Interval ClassificationNumber <strong>of</strong> speciesNo observations1 - 26P a c i f i cO c e a nKamloopsKelowna50°NKilometresData sources:Compiled by the University <strong>of</strong><strong>British</strong> <strong>Columbia</strong>Map by:Caslys Consulting Ltd27 - 5152 - 7778 - 102103 - 127VancouverIslandVancouverProjection:<strong>BC</strong> Albers NAD83Produced for:128 - 152153 - 177178 - 203VictoriaU N I T E D S T A T E S204 - 228229 - 253*Based on documented observations (the lack <strong>of</strong> an observation does not necessarily mean a species is not present).February 4, 2009130°W120°W
68 the biodiversity atlas <strong>of</strong> british columbiaLichensLichens are the result <strong>of</strong> a symbiosisbetween fungi and either green algaeor a cyanobacterium. 119 <strong>The</strong> photosyntheticalgae grow within the fungus, gainingprotection from the elements and providingthe fungus with carbohydrates, vitamins andproteins. <strong>The</strong> richest habitats for lichens arerocky headlands, open forests and alpine.Oldgrowth specklebelly (Pseudocyphallariarainierensis).photo: jim riley.Old forests are important to manyspecies <strong>of</strong> lichens, and in turn, lichensmake a significant contribution <strong>of</strong> nitrogento forests. 120 Arboreal lichens arean important food source for woodlandcaribou. 121 A number <strong>of</strong> lichen speciesfound in <strong>British</strong> <strong>Columbia</strong> are endemicto the Pacific Northwest region (Alaskato California) (Table 20). In most cases,these species live on standing trees.Included on Map 32 are the 1,008native lichen species known to occur in<strong>British</strong> <strong>Columbia</strong> and for which computerizedgeoreferenced distributiondata is available. Information requiredto map richness for many lichens isincomplete. 122 For the species assessed,lichen richness is highest in the south<strong>of</strong> the province and on Vancouver Islandand the Queen Charlotte Islands/Haida Gwaii.<strong>The</strong> conservation status (p. 40) <strong>of</strong>lichens has not been assessed for theprovince.table 20. some b.c. lichen speciesendemic to the pacificnorthwest region.SPECIES NAME, COMMON NAMEAlectoria imshaugii, Imshaug’s witch’s hair lichenBryoria carlottae, Carlott’s horsehair lichenBryoria cervinula, horsehair lichenCladonia sch<strong>of</strong>ieldia, a lichenFuscopannaria pacifica, a lichenFuscopannaria alaskana, a lichenHypogymnia heterophylla, seaside boneLeptogium polycarpum, a lichenLeptogium tacomae, a lichenLobaria silvae-veteris, a lichenMassalongia microphylliza, littlelobed lichenNe<strong>of</strong>uscelia subhosseana, erupted camouflage lichenNephroma occultum, cryptic pawPhyscia tribacia, rosette lichenPseudocyphellaria mallota, a lichenPseudocyphellaria perpetua, a lichenPseudocyphellaria rainierensis , oldgrowth specklebellysource: Bunnell, F., L. Kremsater and I. Houde. 2006. Applyingthe Concept <strong>of</strong> Stewardship Responsibility in <strong>British</strong> <strong>Columbia</strong>:2007 Update. <strong>Biodiversity</strong> <strong>BC</strong>, Victoria, <strong>BC</strong>. 188pp. Available at:www.biodiversitybc.org.
t130°W 120°W110°WM A P 3 260°NY u k o nN o r t h w e s tT e r r i t o r i e s60°NSpecies richness:lichens*Legend!. CityRoadRiver/StreamLakeNumber <strong>of</strong> speciesB r i t i s hC o l u m b i aNo observations1 - 23 - 45 - 78 - 10Fort St. JohnA l b e r t a11 - 1516 - 2021 - 2930 - 4555°N55°N46 - 6566 - 222Units = number <strong>of</strong> species per gridsquare based on observations from1961-2006 (1,008 species total).Prince RupertPrince GeorgeEdmontonQueenCharlotteIslandsArea <strong>of</strong> DetailCalgary0 100 20050°NEqual Interval ClassificationNumber <strong>of</strong> speciesNo observations1 - 23P a c i f i cO c e a nKamloopsKelowna50°NKilometresData sources:Compiled by the University <strong>of</strong><strong>British</strong> <strong>Columbia</strong>Map by:Caslys Consulting Ltd24 - 4546 - 6768 - 8990 - 112VancouverIslandVancouverProjection:<strong>BC</strong> Albers NAD83Produced for:113 - 134135 - 156157 - 178VictoriaU N I T E D S T A T E S179 - 200201 - 222*Based on documented observations (the lack <strong>of</strong> an observation does not necessarily mean a species is not present).February 5, 2009130°W120°W
Special Elements <strong>of</strong> <strong>Biodiversity</strong><strong>BC</strong> is home to some elements <strong>of</strong> biodiversity that are <strong>of</strong> global significance either because they are importanthabitat for concentrations <strong>of</strong> species or because they are uncommon or even unique. 123 <strong>The</strong>seelements are among the things that make B.C. special. <strong>The</strong>ir presence here relates to geography, geologyand the relatively undisturbed character <strong>of</strong> large areas <strong>of</strong> the province.Some examples <strong>of</strong> special elements found in B.C. include areas where birds, salmon or sea lions concentrateduring certain seasons <strong>of</strong> the year; special communities <strong>of</strong> old-growth temperate rainforests and intact largemammal predator-prey systems. Also included are noteworthy features such as hot springs, large wetlands andsaline lakes, all <strong>of</strong> which are inhabited by rare and specialized species.<strong>The</strong> list <strong>of</strong> special elements presented in the following pages is not intended to be all-inclusive, but ratherto highlight some uncommon B.C. species, communities and ecosystems <strong>of</strong> ecological significance for whichmapping information was available. A selection <strong>of</strong> special elements related to species is described in Table 21and mapped on page 73 (Map 33). Some special elements related to ecosystems are described in Table 22 andtheir locations mapped on page 75 (Map 34).Many special elements <strong>of</strong> biodiversity found in the province are subject to numerous threats (p.76).Spotted Lake, Okanagan, <strong>British</strong><strong>Columbia</strong>.photo: orville dyer.1
2the biodiversity atlas <strong>of</strong> british columbiaSpecial Elements: SpeciesTable 21 lists the five special elements related to species that are included on Map 33.table 21. selected special elements <strong>of</strong> biodiversity related to species in b.c.REALM SPECIAL ELEMENT DESCRIPTION STATUS THREATSSeasonalconcentrations<strong>of</strong> speciesMajor salmonspawning sitesMajor salmon spawning sites are locatedwhere spawning populationsexceed a defined species-specificnumber <strong>of</strong> individuals in two ormore years.Nearly 20% <strong>of</strong> B.C. and Yukonpopulations were <strong>of</strong> conservationconcern in the 1990s.Trend is increasing.Most mortality occurs in the marinerealm, but freshwater and terrestrialthreats include changing hydrology,sedimentation, artificial stream barriers,loss <strong>of</strong> estuaries and warming water.Important birdareasB.C. has globally significantseasonal concentrations<strong>of</strong> birds.Most sites are not protected.Concentrations <strong>of</strong> species are vulnerableto catastrophic events. Other threats:loss <strong>of</strong> intertidal habitat from ecosystemconversion, sea level rise, pollution anddirect disturbance.Steller sea lionrookeries/hauloutsRookeries are rocky islands usedfor breeding. Haul-outs are nonbreedingareas.Species is <strong>of</strong> conservationconcern in B.C. Two <strong>of</strong> threerookeries are protected.Steller sea lions are vulnerable to catastrophicevents at the three rookeries andthreatened by shooting and entanglementin fishing gear.Specific FeatureMicrobialitesFossilized mats formed by microbes,primarily cyanobacteria. Freshwaterexamples are globally rare, with twoexamples known in B.C.Only one site is protected. Bothare in fairly good condition.Microbialites are subject to damage byrecreational users <strong>of</strong> the lakes.Special CommunityIntact largemammal predatorpreysystemsPredator-prey systems in which all<strong>of</strong> the native large carnivores andungulates are present. Such systemshave collapsed in much <strong>of</strong> the rest<strong>of</strong> North America.28% <strong>of</strong> B.C. has intact systems. Loss <strong>of</strong> large mammals is due to directmortality (e.g., hunting, accidental roadkill) and ecosystem conversion anddegradation.note: Elements listed in this table are just a small sample <strong>of</strong> the special elements <strong>of</strong> biodiversity in B.C. <strong>The</strong>y are used for illustrative purposes..
t130°W 120°W110°W60°NY u k o nN o r t h w e s tT e r r i t o r i e s60°NM A P 3 3Selected specialelements: speciesLegend!. CityRoadRiver/StreamLake55°NB r i t i s hC o l u m b i aFort St. JohnA l b e r t a55°NSpecial elementsMajor salmon spawningsites*Steller sea lion hauloutsSteller sea lion rookeries") MicrobialitesImportant bird areasIntact large mammalpredator-prey system (allnative large mammalspresent, no alien largemammals)*** Defined as those with spawningpopulations above a specific level (i.e.,>20,000 pink, >10,000 chum, >5,000 lake-type sockeye, >2,000 coho, >500 chinookand >500 river-type sockeye) in two ormore years.** Large is defined as >20 kg averagebody mass.Prince RupertEdmontonPrince GeorgeQueenCharlotteIslandsArea <strong>of</strong> Detail50°NP a c i f i cO c e a n") ")KamloopsKelownaCalgary50°N0 100 200KilometresData sources:B.C. Ministry <strong>of</strong> Environment,Fisheries and Oceans Canada,Important Bird AreasConservation Data CentreMap by:Caslys Consulting LtdVancouverIslandVancouverProjection:<strong>BC</strong> Albers NAD83Produced for:VictoriaU N I T E D S T A T E SFebruary 25, 2009130°W120°W
4the biodiversity atlas <strong>of</strong> british columbiaSpecial Elements: EcosystemsTable 22 lists the five special elements relatedto ecosystems that are included onMap 34. Some other special elements relatedto ecosystems for which provincial mappingdata was not available include karst, aunique landscape created from soluble bedrock;serpentine soils formed from bedrockwith high toxicity from heavy metals; andnaturally fishless lakes. 124table 22. selected special elements <strong>of</strong> biodiversity related to ecosystems in b.c.REALM SPECIAL ELEMENT DESCRIPTION STATUS THREATSSpecialEcosystemFeaturesSaline lakesLakes or ponds with no outletand a very high salt content.Home to invertebrate speciesnot found in other water bodies.Some are protected.Saline lakes are <strong>of</strong>ten found in dryclimates with agricultural pressures.<strong>The</strong>y are especially vulnerable to climatechange because most lack trees andshrubs to buffer them against air temperaturechange and are at threat frompermanent dry out.Hot springsHot springs are unique, selfcontainedhabitats created fromvery hot water from deep withinthe earth.Large wetlands are centres <strong>of</strong>both freshwater and terrestrialbiodiversity. One example, BurnsBog, hosts organisms absent orrare elsewhere and is the largestraised bog in coastal NorthAmerica.Many are heavily usedfor recreation.Vulnerable to pollution, disturbance andecosystem conversion.Large Wetlands(Freshwater)• Burns Bog• Creston ValleyWetlands• <strong>Columbia</strong> ValleyWetlandsPartially protected.Large wetlands are threatened by pollutionfrom agricultural and urban activities;motorized recreation; ecosystemconversion; and artificially managedwater levels.Glacially influencedwatershedsWatersheds that have morethan 5% <strong>of</strong> their area covered inglaciers are defined as glaciallyinfluenced.Increasing temperaturesover the past centuryhave resulted in loss <strong>of</strong>glacial volume.Continuing increases in temperature andchanges in the type <strong>of</strong> precipitation willaffect glaciers in the future. Many smallerglaciers have already melted. Lowerelevationglaciers are most affected.Remaining low-elevation forests are<strong>of</strong>ten highly fragmented by roads andforest harvesting.Special CommunityOld-growth temperaterainforestsTemperate rainforests aretypically associated with coastalmountain ranges. Also occurin interior B.C. Province has theworld’s greatest continuousextent <strong>of</strong> these forests.Much <strong>of</strong> the low-lying,highly productive areashave been logged and/or converted to highhuman density areas oragriculture, or floodedby hydroelectric dams.note: Elements listed in this table are just a small sample <strong>of</strong> the special elements <strong>of</strong> biodiversity in B.C. <strong>The</strong>y are used for illustrative purposes..
t130°W 120°W110°W60°NY u k o nN o r t h w e s tT e r r i t o r i e s60°NM A P 3 4Selected specialelements: ecosystemsLegend!. CityRoadRiver/StreamLake55°NB r i t i s hC o l u m b i aFort St. JohnA l b e r t a55°NSpecial elementsHot springsG Saline lakes# Burns Bog# Creston Valley Wetlands# <strong>Columbia</strong> Valley WetlandsGlacially influencedwatersheds (>5% <strong>of</strong> areacovered by glaciers)Old growthtemperate rainforest(>250 years old in theCoastal WesternHemlock, MountainHemlock and InteriorCedar-Hemlock biogeoclimaticzones)Prince RupertEdmontonPrince GeorgeQueenCharlotteIslandsArea <strong>of</strong> Detail50°NP a c i f i cO c e a nVancouverIslandGGGGGG GG GGG GGGG#VancouverGGGKamloopsGGGGGGGKelowna##Calgary50°N0 100 200KilometresData sources:Dr. G. Scudder; B.C. Ministry <strong>of</strong>Environment; B.C. Ministry <strong>of</strong>Energy, Mines and PetroleumResources; B.C. Ministry <strong>of</strong>Agriculture and LandsMap by:Caslys Consulting LtdProjection:<strong>BC</strong> Albers NAD83Produced for:VictoriaU N I T E D S T A T E SFebruary 25, 2009130°W120°W
6the biodiversity atlas <strong>of</strong> british columbiaThreats to <strong>Biodiversity</strong>Cutleaf evergreen blackberry (Rubuslaciniatus).photo: jim riley.Compared to many other places in the world, biodiversity in <strong>British</strong> <strong>Columbia</strong> is in relatively good conditionas illustrated by the global human footprint map (Map 35, p. 77). This map was developed bycombining data for population density, land conversion, accessibility, and electrical power infrastructureto show the relative impact <strong>of</strong> human activity on the land.However, at a finer scale <strong>of</strong> examination, it becomes evident that all is not well in some areas and for someaspects <strong>of</strong> the province’s biodiversity. People are attracted to the mild climate and productive land in <strong>British</strong> <strong>Columbia</strong>’ssouthern valleys, the south coast and islands, and the central plateau region (Map 36, p. 79). <strong>The</strong>se are thesame areas that provide prime habitat for most <strong>of</strong> the province’s species (p. 36). As a consequence, many humanactivities have had detrimental effects on the plants and animals which share the land base. Over 6% <strong>of</strong> B.C.’s assessednative species are <strong>of</strong> global conservation concern, the highest in the country (p. 40). 125 Almost half (43%)are <strong>of</strong> provincial conservation concern. Four <strong>of</strong> B.C.’s 16 biogeoclimatic zones (p. 22) and four <strong>of</strong> B.C.’s nine MajorDrainage Areas (p. 30) are <strong>of</strong> conservation concern, 126 as are a large percentage <strong>of</strong> ecological communities (p.26).Ecosystem conversion (p. 80), ecosystem degradation, and the introduction and spread <strong>of</strong> alien species(p. 82) have been identified as the most significant stresses on biodiversity in B.C. 127, 128 Other important stressesinclude direct mortality <strong>of</strong> species, species disturbance, and environmental contamination (p. 116). Many humanactivities contribute to these stresses, and losses to biodiversity more <strong>of</strong>ten than not originate from morethan one source. Multiple stresses can impact biodiversity at a magnitude greater than the sum <strong>of</strong> the individualthreats, can be cumulative over time, and can incur cascading impacts on other components <strong>of</strong> biodiversity. 1296
90°150°W120°W90°W60°W30°W0°30°E60°E90°E120°E150°E90°M A P 3 5Human footprintindexLegend!. CityRoadRiver/StreamLake60°N60°NHuman footprint index*0 - 11.1 - 1010.1 - 2020.1 - 3030°N30°N30.1 - 4040.1 - 6060.1 - 8080.1 - 1000°30°S0°30°S*<strong>The</strong> human footprint index isbased on four types <strong>of</strong> data asproxies for human influence:population density, landtransformation, accessibility,and electrical power infrastructure.Larger values indicate higherimpacts.60°S60°S0 2,500 5,000KilometresData sources:E.W. Sanderson, M. Jaiteh,M.A. Levy, K.H. Redford, A.V.Wannebo and G. Woolmer.2002. <strong>The</strong> human footprintand the last <strong>of</strong> the wild.BioScience 52(10): 891-904.90°150°W120°W90°W60°W30°W0°30°E60°E90°E120°E150°E90°Map by:Caslys Consulting LtdProjection:<strong>BC</strong> Albers NAD83Produced for:Area <strong>of</strong> detail:<strong>British</strong> <strong>Columbia</strong>February 5, 2009
8the biodiversity atlas <strong>of</strong> british columbiaThis section presents maps, tables andtext describing some <strong>of</strong> the stresses onbiodiversity in B.C. and the human-inducedthreats that contribute to those stresses.Specific maps are presented for two majorstresses: terrestrial ecosystem conversion(p. 80) and alien species (p. 82). Maps are alsoprovided for a number <strong>of</strong> human activitiesthat contribute to ecosystem conversion andalien species, as well as to ecosystem degradationand environmental contamination.<strong>The</strong>se include climate change (p. 88), forestry(p. 104), the building and use <strong>of</strong> transportationand utility corridors (p. 106), water development(including dams) (p. 110), oil and gasdevelopment (p. 114),and industrial development(contaminated sites and pollution)(p. 116). As a result <strong>of</strong> some aspects <strong>of</strong> theseactivities, ecosystems in B.C. are less able tosupport healthy populations <strong>of</strong> plants andanimals, and to provide important ecosystemfunctions essential for human well-being.Human-induced climate change hasrecently emerged as an important threat tobiodiversity. A consequence <strong>of</strong> industrial anddomestic activities that produce greenhousegases – such as methane and carbon dioxide– climate change has already had measurableeffects on species and ecosystems in<strong>British</strong> <strong>Columbia</strong> and is identified as the130, 131,132foremost threat to biodiversity in B.C.Human Population GrowthHuman Population (x1000)6,0005,0004,0003,0002,0001,0000YearSince 1971, the human population <strong>of</strong> B.C.has almost doubled to 4.3 million andis expected to reach close to 6 million by2031 (Figure 6). In the 2006 Canadian census,<strong>British</strong> <strong>Columbia</strong> was the third-fastestgrowing province in Canada, its populationincreasing by 5.3% between 2001 and2006, compared to 4.9% between 1996 and2001. 133 Most <strong>of</strong> this growth has occurredwhere species richness (p. 36) is highest: thelower mainland, the east and south coasts <strong>of</strong>Vancouver Island and the Okanagan (Map36). <strong>The</strong> lower mainland has the highesthuman population densities with the maximumexceeding 125,000 people per km 2 .Many impacts on biodiversity are associatedwith population growth; the most immediateis the conversion (p. 80) <strong>of</strong> naturallandscapes to buildings, parking lots andplaying fields. Other impacts include habitatfragmentation, predation <strong>of</strong> native speciesby domestic animals, disruption <strong>of</strong> surfacewater flow over imperious surfaces, pollution(p. 116), and facilitation <strong>of</strong> alien speciesintroductions (p. 82). 134 <strong>The</strong> impacts to biodiversityare relatively permanent; even reductionsin human population (experienced insome areas <strong>of</strong> the province) do not necessarilyimprove the status <strong>of</strong> biodiversity, sinceinfrastructure such as roads (p. 106) andbuildings remains. Given continued growthin low elevation areas, the impact <strong>of</strong> populationgrowth and urban development onbiodiversity is expected to intensify.Current population 20071861 1871 1891 1901 1911 1921 1931 1941 1951 1961 1971 1981 1991 2001 2011 2021 2031figure 6: Population growth for B.C. (1861–2006) with a projection to 2031.source: B.C. Stats. 2007. <strong>British</strong> <strong>Columbia</strong> Population 1867 to 2007. Available at: www.bcstats.gov.bc.ca.
140°W130°W 120°W110°W60°NY u k o nEnlargement <strong>of</strong> theOkanagan RegionVernon60°NM A P 3 6Human populationdensityLegendB r i t i s hC o l u m b i aWestbankKelowna!. CityRoadRiver/StreamLakePopulation density< 11 - 10>10 - 100>100 - 1,000> 1,000Fort St. JohnA l b e r t a55°N55°NUnits = number <strong>of</strong> people per km 2 .Prince RupertPenticton EdmontonPrince GeorgeQueenCharlotteIslandsArea <strong>of</strong> DetailCalgary0 100 20050°NVancouverP a c i f i cO c e a nKamloops50°NKilometresData sources:Statistics Canada (2006Census)KelownaMap by:Caslys Consulting LtdVancouverIslandVancouverProjection:<strong>BC</strong> Albers NAD83VictoriaU N I T E D S T A T E SProduced for:VictoriaEnlargement <strong>of</strong> theLower Mainland RegionFebruary 5, 2009130°W120°W
80 the biodiversity atlas <strong>of</strong> british columbiaTerrestrial Ecosystem ConversionEcosystem conversion is the direct andcomplete conversion <strong>of</strong> natural landscapessuch as forests, wetlands or grasslandsto landscapes <strong>of</strong> human uses (e.g.,buildings, houses, parking lots, mines, reservoirs,and agricultural fields). 135 Ecosystemconversion compromises or eliminates theability <strong>of</strong> native species to survive in the newconditions and they adapt, move if they areable, or die. <strong>The</strong> result is reduced richness<strong>of</strong> species and the loss <strong>of</strong> ecological functionssuch as purification <strong>of</strong> air and water,decomposition, pollination, soil formation,and climate regulation.<strong>The</strong> magnitude <strong>of</strong> ecosystem conversionvaries spatially within the province (Map 37).<strong>The</strong> mountainous topography has limitedhuman activity in high elevation areas, whileareas below 1,000 m in elevation such as valleybottoms and coastal areas where humanpopulation is concentrated have experiencedthe greatest levels <strong>of</strong> ecosystem conversion.Significant ecosystem conversion is evidentin and around urban centres, on the southeastcoast <strong>of</strong> Vancouver Island, in the interiorplateau, and along highway corridors.<strong>The</strong> greatest degree <strong>of</strong> ecosystem conversionfor the 16 biogeoclimatic zones, (p. 20)has occurred in the Coastal Douglas-firzone found on the south-eastern coast <strong>of</strong>Vancouver Island, and in the Bunchgrassand Ponderosa Pine zones in the Okanagantable 23. area <strong>of</strong> terrestrial ecosystem conversion in b.c.since european contact.(Table 23) all three <strong>of</strong> which are <strong>of</strong> conservationconcern (p. 22). 136 As <strong>of</strong> the 1990s, about2% <strong>of</strong> provincial land has been converted tohuman dominated uses (Table 23).BIOgeoclimatic zone Total land area Area <strong>of</strong> Area <strong>of</strong> PERCENT <strong>of</strong>Before Ecosystem ecosystem ecosystem land areaconversion conversion Remaining converted to(km 2 ) (km 2 ) (km 2 ) Human usesCoastal Douglas-fir 2,561 1,251 1,310 49%Bunchgrass 2,579 531 2,048 21%Ponderosa Pine 3,513 617 2,896 18%Interior Douglas-fir 42,721 2,302 40,419 5%Boreal White and Black Spruce 159,473 6,106 153,367 4%Sub-Boreal Spruce 95,551 3,206 92,345 3%Coastal Western Hemlock 104,998 2,745 102,253 3%Interior Cedar–Hemlock 51,751 837 50,914 2%Sub-Boreal Pine–Spruce 22,643 284 22,359 1%Montane Spruce 27,996 201 27,795 1%Engelmann Spruce–Subalpine Fir 170,564 200 170,364
130°W 120°W110°W60°NY u k o nN o r t h w e s tT e r r i t o r i e stM A P 3 760°NTerrestrial ecosystemconversion*Legend!. CityRoadRiver/StreamLakePercentage0.00B r i t i s hC o l u m b i a0.01 - 0.130.14 - 0.670.68 - 1.661.67 - 3.493.50 - 6.99Fort St. JohnA l b e r t a7.00 - 12.1212.13 - 21.9521.96 - 43.0055°N55°N43.01 - 100.00Units = percentage <strong>of</strong> land andreservoir area.Prince RupertEdmontonPrince GeorgeQueenCharlotteIslandsArea <strong>of</strong> Detail50°NEqual Interval ClassificationPercentage0.0 - 10.010.1 - 20.020.1 - 30.030.1 - 40.040.1 - 50.050.1 - 60.060.1 - 70.070.1 - 80.0P a c i f i cO c e a nVancouverIslandVancouverVictoriaKamloopsKelownaU N I T E D S T A T E SCalgary50°N0 100 200KilometresData sources:Baseline <strong>The</strong>matic Mapping (v.1and 2 merged), Terrain ResourceInformation Management -Enhanced Base MapMap by:Caslys Consulting LtdProjection:<strong>BC</strong> Albers NAD83Produced for:80.1 - 90.090.1 - 100.0*Terrestrial ecosystem conversion is the proportion <strong>of</strong> land area that falls within the following land uses: reservoirs;urban; agriculture; recreation; residential/agriculture mix; and mining.February 5, 2009130°W120°W
82 the biodiversity atlas <strong>of</strong> british columbiaAlien SpeciesAlien species are those that occur outsidetheir native range owing to introductionby humans. 137 Alien species can be introducedintentionally (e.g., plants used foragriculture or forestry use, or the release <strong>of</strong>pets), accidentally (e.g., species attached toequipment that is transported), or by escapefrom captive or commercial cultivation (e.g.,escapes from zoos, farms and research facilities).138 Species that are native to some parts<strong>of</strong> B.C. can be alien species when moved toother areas <strong>of</strong> the province. For example,raccoon and deer are alien species on theQueen Charlotte Islands/Haida Gwaii.Not all alien species are harmful, but invasivealien species are those species whoseintroduction and/or spread threaten biodiversity.One estimate is that about 10% <strong>of</strong>alien species become invasive. 139 However,some species also exhibit a time lag betweenintroduction and impact to biodiversity.For example, gorse (Ulex europaeus) was introducedto B.C. at least 90 years ago 140 andwas only recently recognized as an invasivealien species.Invasive alien species alter forest firecycles, nutrient cycling, hydrology andenergy budgets in native ecosystems. 141 <strong>The</strong>ydisplace native populations <strong>of</strong> plants andanimals by occupying habitat and competingfor resources. 142 Alien species can affectnative species through competition andpredation, displacement, habitat degradation(e.g., removal or replacement <strong>of</strong> vegetation),hybridization and the introduction <strong>of</strong>diseases, as well as facilitating the spread <strong>of</strong>other non-native species. 143A total <strong>of</strong> 809 alien species are listed bythe B.C. Conservation Data Centre (CDC). 144<strong>The</strong> majority <strong>of</strong> alien species listed by theCDC are vascular plants. However, theinventory <strong>of</strong> many alien insects such asbeetles, true bugs and plant lice are incompletein B.C., and in other jurisdictions, theabundance <strong>of</strong> alien insects far exceeds that<strong>of</strong> alien vascular plants. 145,146,147,148 Map 38includes the 776 terrestrial and freshwateralien species <strong>of</strong> vertebrates, invertebratesand vascular plants for which computerizedlocation data was available (Table 24). nMap 39 shows species richness for the718 terrestrial alien species for which computerizedlocation data was available. <strong>The</strong>spread <strong>of</strong> alien species tends to follow eco-table 24. alien species in b.c. included on maps 38 to 40SPECIES GROUPNUMBER OF ALIEN SPECIES MAPPEDFRESHWATER TERRESTRIAL FRESHWATERAND TERRESTRIALAmphibians 1 1 1Birds 7 7 2Freshwater Fishes 15 0 15Mammals 17 17 3Reptiles and Turtles 1 1 0Invertebrates 55 55 0Vascular Plants 680 637 43TOTAL 776 718 64source: Produced for this report.notes: A species can require both freshwater and terrestrial habitats and therefore will appear in numbers for both.Terrestrial includes wetland margins; freshwater includes species found in freshwater, wetland and marine.nUnlike the species richness maps (pp. 36-67) where the analysis used data from point locations, the alien species maps were created by compiling lists <strong>of</strong> alien species foreach Ecosection (p.18) and biogeoclimatic variant (p. 20) combination. This methodology has the effect <strong>of</strong> lowering spatial precision. Every polygon <strong>of</strong> a biogeoclimaticvariant in an Ecosection gets the same value whereas one may have a high road density (p. 106) and many alien species while another may be relatively pristine.
t130°W 120°W110°WM A P 3 860°NY u k o nN o r t h w e s tT e r r i t o r i e s60°NNumber <strong>of</strong> terrestrialand freshwateralien species*Legend!. CityRoadRiver/StreamLakeNumber <strong>of</strong> speciesB r i t i s hC o l u m b i a0123Fort St. JohnA l b e r t a4567 - 855°N55°N9 - 1112 - 92Units = number <strong>of</strong> alien species(776 alien species total).Prince RupertEdmontonPrince GeorgeQueenCharlotteIslandsArea <strong>of</strong> DetailEqual Interval ClassificationCalgary0 100 200KilometresP a c i f i cKamloopsData sources:B.C. Ministry <strong>of</strong> Environment50°NNumber <strong>of</strong> species0 - 9O c e a nKelowna50°NMap by:Caslys Consulting LtdProjection:<strong>BC</strong> Albers NAD8310 - 1819 - 2829 - 3738 - 46VancouverIslandVancouverProduced for:47 - 5556 - 6465 - 7475 - 8384 - 92VictoriaU N I T E D S T A T E S*Taxonomic groups include: mammals, birds, freshwater fishes, reptiles, amphibians, insects and vascular plants.February 25, 2009130°W120°W
84 the biodiversity atlas <strong>of</strong> british columbiaAlien species continued . . .Number <strong>of</strong> Species750700650600550500VASCULAR PLANTS1994 1995* 1996 1997 1998 1999 2000 2001 2002 2003 2004 2005* 2006YEARfigure 7: Trends in the number <strong>of</strong> alien vascularplant species established in B.C.source: B.C. Ministry <strong>of</strong> Environment. 2007. SpeciesConservation. Technical Paper for Environmental Trends2007. State <strong>of</strong> Environment Reporting Office, Victoria, <strong>BC</strong>.Available at: www.env.gov.bc.ca/soe/et07/07_species_conserv/technical_paper/species_conservation.pdf. Note: * Years withno data.25system degradation, FRESHWATER with FISH the greatestnumber <strong>of</strong> alien species found inareas <strong>of</strong> greatest human influence: 21the lower 20 mainland, the east coast<strong>of</strong> Vancouver Island, along roadsystems and near urban centres. ANumber <strong>of</strong> Species15study <strong>of</strong> the vegetation on seventeengrazed public grassland sitesin south-eastern B.C. found that10the percentage cover <strong>of</strong> non-nativesranged from 0-84% with an average<strong>of</strong>535%. 149 Introduced grasses inGarry oak meadows, a rare ecosystem<strong>of</strong> conservation concern within0713the Douglas-fir 1950 1975 biogeoclimatic 2005 2007zone(p. 20), likely make up YEAR over 90% <strong>of</strong>the herb layer biomass. 150 Lakesand islands are also particularlyvulnerable to alien species because<strong>of</strong> their isolation from competition.<strong>The</strong> highest numbers <strong>of</strong> mappedalien species in higher level terrestrialecosystems (p.20) are foundin the Coastal Western Hemlock18(579), Coastal Douglas-fir (515) and InteriorDouglas-fir (335) biogeoclimatic zones(Table 25).<strong>The</strong> number <strong>of</strong> alien vascular plants recognizedin B.C. increased by 29% betweentable 25. terrestrial alienspecies richness forbiogeoclimatic zonesin b.c.BIOGEOCLIMATicZonenumBERoF SPECIESCoastal Western Hemlock 579Coastal Douglas-fir 515Interior Douglas-fir 335Interior Cedar–Hemlock 265Engelmann Spruce–Subalpine Fir 232Ponderosa Pine 187Montane Spruce 182Bunchgrass 148Mountain Hemlock 120Sub-Boreal Spruce 116Boreal White and Black Spruce 88Coastal Mountain-heather Alpine 56Interior Mountain-heather Alpine 44Sub-Boreal Pine–Spruce 37Boreal Altai Fescue Alpine 19Spruce–Willow–Birch 15source: Produced for this report.
t130°W 120°W110°W60°NY u k o nN o r t h w e s tT e r r i t o r i e s60°NM A P 3 9Number <strong>of</strong> terrestrialalien speciesLegend!. CityRoadRiver/StreamLakeB r i t i s hC o l u m b i aNumber <strong>of</strong> species0123Fort St. JohnA l b e r t a4567 - 855°N55°N9 - 1314 - 87Units = number <strong>of</strong> alien species(718 alien species total).Prince RupertEdmontonPrince GeorgeQueenCharlotteIslandsArea <strong>of</strong> Detail50°NEqual Interval ClassificationNumber <strong>of</strong> species0 - 910 - 1718 - 2627 - 3536 - 44P a c i f i cO c e a nVancouverIslandVancouverKamloopsKelownaCalgary50°N0 100 200KilometresData sources:B.C. Ministry <strong>of</strong> EnvironmentMap by:Caslys Consulting LtdProjection:<strong>BC</strong> Albers NAD83Produced for:45 - 5253 - 6162 - 7071 - 7879 - 87Victoria*Taxonomic groups include: mammals, birds, reptiles, amphibians, insects and vascular plants.U N I T E D S T A T E SFebruary 25, 2009130°W120°W
86 the biodiversity atlas <strong>of</strong> british columbiaAlien species continued . . .2004 2005* 2006Number <strong>of</strong> Species25201510507FRESHWATER FISH13211950 1975 2005 2007YEARfigure 8: Trends in the number<strong>of</strong> alien freshwater fish speciesestablished in B.C.source: B.C. Ministry <strong>of</strong> Environment. 2007.Species Conservation. Technical Paperfor Environmental Trends 2007. State <strong>of</strong>Environment Reporting Office, Victoria,<strong>BC</strong>. Available at: www.env.gov.bc.ca/soe/et07/07_species_conserv/technical_paper/species_conservation.pdf and D. McPhail,University <strong>of</strong> <strong>British</strong> <strong>Columbia</strong>, Emeritus,personal communication.181994 and 2006 (Figure 7). Note that theincrease in detections <strong>of</strong> alien species overtime is a function <strong>of</strong> both new introductionsand better information (i.e., detections<strong>of</strong> alien species that had previously beenintroduced).Map 40 shows species richness for the64 freshwater alien species for which computerizedlocation data was available. Whilethe extent <strong>of</strong> the spread <strong>of</strong> alien species inthe province appears less significant thanfor terrestrial alien species, alien freshwaterfish species reported in B.C. have more thandoubled from 7 in 1950 to 18 in 2005 (Figure8). 151,152 <strong>The</strong> number <strong>of</strong> water bodies identifiedthat contain alien fish species increasedover the same time period from 28 to 625.Major Drainage Areas (p. 28) with thehighest freshwater alien species richnessare the Coastal, Fraser and <strong>Columbia</strong> (Table26). Because the Coastal system is not asingle connected watershed, the impact <strong>of</strong>the introduction <strong>of</strong> exotic species will beless widespread than an introduction into asystem such as the Fraser, which is one largeinterconnected basin (p. 30).While the general pattern <strong>of</strong> alien speciesintroductions following ecosystem degradationappears to hold for both terrestrial andaquatic species, in some cases, alien speciesare capable <strong>of</strong> invading apparently unalteredecosystems such as islands and lakes,which <strong>of</strong>ten have significant genetic andspecies-level diversity. 153,154table 26. freshwater alien speciesrichness for majordrainage areas in b.c.MAJOR DRAINAGEareaNUMBER OF FRESHWATERalien SPECIESCoastal 25Fraser 24<strong>Columbia</strong> 22Mackenzie 5Skeena 2Nass 1Yukon 1Stikine 0Taku 0source: Produced for this report.
t130°W 120°W110°W60°NY u k o nN o r t h w e s tT e r r i t o r i e s60°NM A P 4 0Number <strong>of</strong> freshwateralien speciesLegend!. CityRoadRiver/StreamLakeB r i t i s hC o l u m b i aNumber <strong>of</strong> species0123Fort St. JohnA l b e r t a456755°N55°N89 - 15Units = number <strong>of</strong> alien species(64 alien species total).Prince RupertEdmontonPrince GeorgeQueenCharlotteIslandsArea <strong>of</strong> Detail50°NEqual Interval ClassificationNumber <strong>of</strong> species0 - 34 - 67 - 910 - 1213 - 15P a c i f i cO c e a nVancouverIslandVancouverKamloopsKelownaCalgary50°N0 100 200KilometresData sources:B.C. Ministry <strong>of</strong> EnvironmentMap by:Caslys Consulting LtdProjection:<strong>BC</strong> Albers NAD83Produced for:VictoriaU N I T E D S T A T E S*Taxonomic groups include: mammals, birds, freshwater fishes, amphibians, insects and vascular plants.February 25, 2009130°W120°W
88 the biodiversity atlas <strong>of</strong> british columbiaClimate ChangeClimate is the primary factor enablingand shaping the distribution <strong>of</strong> organismsand the nature and character <strong>of</strong> ecosystems,155 and is therefore a key driver <strong>of</strong>biological diversity. Climate is defined as the‘average weather’ over a period <strong>of</strong> time (includingextremes), representing the weatherconditions that are typically expected for alocation, the standard interval <strong>of</strong> measurementbeing 30 years. 156 Temperature andprecipitation – measured monthly, seasonallyand annually – are used to representclimate. Global and regional climates varyover millennia, usually changing graduallybut at times, such as during glacial conditions,shifting rapidly. <strong>British</strong> <strong>Columbia</strong>’sregions have experienced at least 4,000 years<strong>of</strong> relatively stable climate leading to thecurrent pattern <strong>of</strong> ecosystems. 157,158Rapid climate change is underway in responseto human greenhouse gas (primarilyCO 2) emissions 159 and biodiversity impactsare evident. 160 <strong>The</strong> United Nations IntergovernmentalPanel on Climate Change (IPCC)reports that the average global surfacetemperature has increased by nearly 1 o Cover the past century and is likely to rise byanother 1.1 to 6.4 o C by 2100. 161 <strong>The</strong> resultingrate <strong>of</strong> change will be unprecedented in thelast 750,000 years. 162 <strong>The</strong> precise amount <strong>of</strong>warming and associated changes are uncertain,nevertheless significant warminghas already taken place in northwest NorthAmerica where changes are expected to occurfaster and be more pronounced than theglobal average. 163Organisms are sensitive to change inclimate, although many individuals, speciesand ecosystems can tolerate some climaticvariation. Extremes <strong>of</strong> high and low temperatureand precipitation determine the distribution<strong>of</strong> many species. As a step towardunderstanding the effects <strong>of</strong> climate changeon biodiversity, map-based indices were developed.164 Based on measured changes intemperature and precipitation from weatherstations between 1971 and 2000, o the indicesprovide information on how rapidly climatehas been changing in the assessment periodacross the province. Three variables wereapplied to the indices:• average rate <strong>of</strong> change in minimumtemperature (1971-2000),• average rate <strong>of</strong> change in maximumtemperature (1971-2000),and• average rate <strong>of</strong> change in precipitation(1971-2000).Each <strong>of</strong> the variables has been mappedfor both absolute rate <strong>of</strong> change (Map 41,Map 43, Map 45) and relative rate <strong>of</strong> change(Maps 42, Map 44, Map 46). p<strong>The</strong> absolute rate <strong>of</strong> change representsthe average <strong>of</strong> the magnitudes q for eachmonth’s rate <strong>of</strong> change in 0 C per decade fortemperature and mm/decade for precipitation.Decade was chosen as a convenientunit for reporting (e.g., other units such as‘per year’ or ‘per thirty years’ could havealso been used). Map 41 shows the absoluterate <strong>of</strong> change in minimum temperature forVictoria on southern Vancouver Island wasbetween 0.42 and 0.45 o C per decade. <strong>The</strong>refore,over the thirty year assessment period<strong>of</strong> 1971-2000, the absolute rate <strong>of</strong> change inminimum temperature for Victoria has beenbetween 1.26 and 1.35 o C.oFor the purposes <strong>of</strong> this analysis, it was assumed that most elements <strong>of</strong> biodiversity will be responding to the most recent changes in climate, hence the use<strong>of</strong> the 1971-2000 time frame.pA non-standard method was used for computing the data for the maps. For details see Murdock, T.Q., A.T. Werner and D. Bronaugh. 2007. Preliminary Analysis<strong>of</strong> <strong>BC</strong> Climate Trends for <strong>Biodiversity</strong>. <strong>Biodiversity</strong> <strong>BC</strong>, Victoria, <strong>BC</strong>. 24pp. Available at: www.biodiversitybc.org.
t130°W 120°W110°W60°NY u k o nN o r t h w e s tT e r r i t o r i e s60°NM A P 4 1Absolute rate <strong>of</strong>change in minimumtemperature (average<strong>of</strong> all months) from1971 to 2000Legend!. CityRoadRiver/StreamLakeB r i t i s hTemperature change0.00 - 0.35C o l u m b i a0.36 - 0.410.42 - 0.450.46 - 0.50Fort St. JohnA l b e r t a0.51 - 0.540.55 - 0.590.60 - 0.6455°N55°N0.65 - 0.710.72 - 0.820.83 - 0.98Units = °C per decade.Prince RupertEdmontonPrince GeorgeQueenCharlotteIslandsQuesnelArea <strong>of</strong> DetailEqual Interval ClassificationCalgary0 100 200Kilometres50°NTemperature change0.00 - 0.100.11 - 0.200.21 - 0.290.30 - 0.390.40 - 0.49P a c i f i cO c e a nVancouverIslandVancouverKamloopsKelowna50°NData sources:Pacific Climate ImpactsConsortium (University <strong>of</strong>Victoria)Map by:Caslys Consulting LtdProjection:<strong>BC</strong> Albers NAD83Produced for:0.50 - 0.590.60 - 0.690.70 - 0.790.80 - 0.88VictoriaU N I T E D S T A T E S0.89 - 0.98February 5, 2009130°W120°W
0the biodiversity atlas <strong>of</strong> british columbiaDegrees CelciusDegrees Celcius302520151050-5-10-15-20-25-30302520151050-5-10-15-20-25-30197119721973QUESNEL – AVERAGE MINIMUM TEMPERATURE FOR FEBRUARY197419751976197719781979198019811982198319841985YEAR197119721973197419751976197719781979198019811982198319841985198619871988198919901991199219931994199519961997199819992000VICTORIA INTERNATIONAL AIRPORT – AVERAGE MINIMUM TEMPERATURE FOR FEBRUARYYEAR198619871988198919901991199219931994199519961997199819992000<strong>The</strong> relative rate <strong>of</strong> change represents theaverage <strong>of</strong> the magnitudes for each month’srate <strong>of</strong> change divided by the standard deviationsfor those measures for each month.<strong>The</strong> unit used for the mapping <strong>of</strong> relative rate<strong>of</strong> change is standard deviations/decade.Relative change gives a different picture<strong>of</strong> the rate <strong>of</strong> climate change than doesabsolute change. <strong>The</strong> difference betweenabsolute and relative rate <strong>of</strong> change is illustratedwith an example. Figure 9 showsaverage minimum temperatures in Februaryfor both Quesnel and Victoria. <strong>The</strong> averageminimum temperature in Quesnel in Februarybetween 1971 and 2000 varied between-19 and -2°C (a total range <strong>of</strong> 17°C), whileaverage minimum temperature in Victoriafor the same month varied between -4 and+3°C (a smaller total range <strong>of</strong> only 7°C). Acomparison <strong>of</strong> Map 41 and Map 42 for these2 areas illustrates how a consideration <strong>of</strong>this year to year variability influences therelative rate <strong>of</strong> change for a variable. <strong>The</strong> absoluterate <strong>of</strong> change in minimum temperaturefor Quesnel (0.51 to 0.54°C per decade)and Victoria (0.46 to 0.50°C per decade)are similar (Map 41). In contrast, when thefigure 9: Comparison in year to yearvariation in average minimum temperature forFebruary for Quesnel and Victoria.source: Prepared for this report from date retrievedfrom Environment Canada. Climate Data On-line.Available at http://www.climate.weather<strong>of</strong>fice.ec.gc.ca/climateData/canada_e.html.
t130°W 120°W110°W60°NY u k o nN o r t h w e s tT e r r i t o r i e s60°NM A P 4 2Relative rate <strong>of</strong>change in minimumtemperature (average<strong>of</strong> all months) from1971 to 2000Legend!. CityRoadRiver/StreamLakeB r i t i s hTemperature change0.000 - 0.252C o l u m b i a0.253 - 0.2730.274 - 0.2830.284 - 0.293Fort St. JohnA l b e r t a0.294 - 0.3060.307 - 0.3150.316 - 0.32455°N55°N0.325 - 0.3360.337 - 0.3540.355 - 0.475Units = standard deviations perdecade averaged for all months.Prince RupertEdmontonPrince GeorgeQueenCharlotteIslandsQuesnelArea <strong>of</strong> DetailEqual Interval ClassificationCalgary0 100 200Kilometres50°NTemperature change0.00 - 0.050.06 - 0.090.10 - 0.140.15 - 0.190.20 - 0.240.25 - 0.28P a c i f i cO c e a nVancouverIslandVancouverKamloopsKelowna50°NData sources:Pacific Climate ImpactsConsortium (University <strong>of</strong>Victoria)Map by:Caslys Consulting LtdProjection:<strong>BC</strong> Albers NAD83Produced for:0.29 - 0.330.34 - 0.380.39 - 0.43VictoriaU N I T E D S T A T E S0.44 - 0.47February 5, 2009130°W120°W
2the biodiversity atlas <strong>of</strong> british columbiahistorical variation is taken into account, therelative rate <strong>of</strong> change for Quesnel at 0.284to 0.293 standard deviations per decade issignificantly less than Victoria at 0.355 to0.475 standard deviations per decade, one <strong>of</strong>the highest rates <strong>of</strong> change in the province(Map 42). Small changes in temperatureand precipitation in areas with little yearto year variability can have greater relativerates <strong>of</strong> change. From the perspective <strong>of</strong>biodiversity and the sensitivity <strong>of</strong> individualspecies, small average temperature changesin regions <strong>of</strong> narrow climatic variation (suchas on southern Vancouver Island) may be<strong>of</strong> greater consequence than larger averagetemperature changes where the climaticvariation is greater. Species historicallyphoto: luis camargo.exposed to large natural variation may havemore capacity to tolerate large changes.temperatureIncreasing temperature is most <strong>of</strong>ten citedas the primary element <strong>of</strong> climate changeand likely the most reliable to project intothe future. 165 Previous analyses for <strong>British</strong><strong>Columbia</strong> have shown that temperaturechanges have been larger in the cold seasons,larger for night time lows than daytimehighs and larger in the areas <strong>of</strong> B.C that havemore inter-annual variability. 166 Temperatureshave been rising across the provincewith more rapid increases in winter andspring. 167 Changes in average temperaturescan affect the timing <strong>of</strong> reproduction inplants and animals, timing <strong>of</strong> species migration,length <strong>of</strong> the growing season, speciesdistributions and population sizes, and thefrequency <strong>of</strong> pest and disease outbreaks.As previously mentioned, in the interval1971 to 2000, most <strong>of</strong> the changes in temperaturehave been increases (warming).<strong>The</strong> absolute change in average minimumtemperature varied between 0.00 o C perdecade and 0.59 o C per decade in the south<strong>of</strong> the province and on the central coast andup to 0.98 o C per decade in the north (Map41). Map 42 shows average minimum temperaturerelative to the year to year variationwith many areas in the south and on thecentral coast showing some <strong>of</strong> the highestrelative rates <strong>of</strong> change in the province. Ingeneral, the ocean has a moderating influenceon temperatures and coastal areas tendto have less variability from year to year.Maps 43 and 44 show absolute and relativerates <strong>of</strong> change for maximum temperatureacross the province. Maximum temperaturechanges have been smaller thanchanges in minimum temperature (e.g.,highest changes <strong>of</strong> 0.68°C and 0.98°C perdecade respectively). <strong>The</strong> highest absoluterates <strong>of</strong> change in maximum temperature(shown in brown) have occurred on thenorth half <strong>of</strong> Vancouver Island, the QueenCharlotte Islands/Haida Gwaii and along thecentral coast and in some areas <strong>of</strong> the north(Map 43). When year to year variability istaken into account, large relative changesin maximum temperature on southernVancouver Island and along the north coastnow stand out despite small absolute trendsbecause the historical year to year variationis small at these locations (Map 44).
t130°W 120°W110°W60°NY u k o nN o r t h w e s tT e r r i t o r i e s60°NM A P 4 3Absolute rate <strong>of</strong>change in maximumtemperature (average<strong>of</strong> all months) from1971 to 2000Legend!. CityRoadRiver/StreamLakeB r i t i s hTemperature change0.00 - 0.34C o l u m b i a0.35 - 0.370.38 - 0.410.42 - 0.47Fort St. JohnA l b e r t a0.48 - 0.490.50 - 0.510.51 - 0.5255°N55°N0.52 - 0.530.54 - 0.560.57 - 0.68Units = °C per decade.Prince RupertEdmontonPrince GeorgeQueenCharlotteIslandsArea <strong>of</strong> Detail50°NEqual Interval ClassificationTemperature change0.00 - 0.07P a c i f i cO c e a nKamloopsKelownaCalgary50°N0 100 200KilometresData sources:Pacific Climate ImpactsConsortium (University <strong>of</strong>Victoria)Map by:Caslys Consulting Ltd0.08 - 0.140.15 - 0.200.21 - 0.270.28 - 0.340.35 - 0.41VancouverIslandVancouverProjection:<strong>BC</strong> Albers NAD83Produced for:0.42 - 0.470.48 - 0.540.55 - 0.61VictoriaU N I T E D S T A T E S0.62 - 0.68February 5, 2009130°W120°W
130°W 120°W110°W60°N4Y u k o nN o r t h w e s tT e r r i t o r i e sM A P 4 4the biodiversity atlas <strong>of</strong> british columbiaRelative rate <strong>of</strong>change in maximumtemperature (average<strong>of</strong> all months) from1971 to 2000t60°NLegend!. CityRoadRiver/StreamLakeB r i t i s hTemperature change0.00 - 0.15C o l u m b i a0.15 - 0.160.16 - 0.170.18 - 0.19Fort St. JohnA l b e r t a0.20 - 0.210.21 - 0.220.22 - 0.2355°N55°N0.24 - 0.260.27 - 0.370.38 - 0.54Units = standard deviations perdecade averaged for all months.Prince RupertEdmontonPrince GeorgeQueenCharlotteIslandsArea <strong>of</strong> DetailEqual Interval ClassificationCalgary0 100 200Kilometres50°NTemperature change0.00 - 0.05P a c i f i cO c e a nKamloopsKelowna50°NData sources:Pacific Climate ImpactsConsortium (University <strong>of</strong>Victoria)Map by:Caslys Consulting Ltd0.06 - 0.110.12 - 0.160.17 - 0.210.22 - 0.270.28 - 0.32VancouverIslandVancouverProjection:<strong>BC</strong> Albers NAD83Produced for:0.33 - 0.380.39 - 0.430.44 - 0.48VictoriaU N I T E D S T A T E S0.49 - 0.54February 5, 2009130°W120°W
the biodiversity atlas <strong>of</strong> british columbiaPrecipitationPrevious studies <strong>of</strong> the magnitude anddirection <strong>of</strong> climate change suggest thatprecipitation has increased in southern B.C.by 2 to 4% per decade and that total annualprecipitation has increased in many parts <strong>of</strong>the province, most noticeably in the Okanaganand North Coast regions, which masksa shift toward drier winters in parts <strong>of</strong> theprovince. 168,169 <strong>The</strong> long term annual precipitationtrend shows widespread moistening<strong>of</strong> 10 to 30% per century in most <strong>of</strong> theprovince except the southwest where littlechange has occurred. 170<strong>The</strong> maps presented here show that theprovince has experienced rates <strong>of</strong> absolutechange in precipitation between 1971 and2000 <strong>of</strong> up to 27.3 mm per decade (Map 45).<strong>The</strong> regions <strong>of</strong> the province experiencingphoto: ge<strong>of</strong>frey holman.the most significant rate <strong>of</strong> absolute changeare those that generally get more rainfall,along the coast and the islands and alongthe west side <strong>of</strong> the Rocky Mountains. <strong>The</strong>use <strong>of</strong> the magnitude for monthly valuesin calculating absolute and relative changemeans that trends towards both wetterconditions and drier conditions in differentmonths are included and do not cancel eachother out. <strong>The</strong> analysis does not indicatewhether an area is getting wetter or drier,only that change is occurring and at whatrate per month. <strong>The</strong> seasonal trend map forprecipitation on page 101 (Map 49) providesinformation about which areas <strong>of</strong> the provinceare experiencing increases or decreasesin precipitation.When natural variation is included in theanalysis, it becomes apparent that the rates<strong>of</strong> change in precipitation are more significantin the south and central interior <strong>of</strong> theprovince where year to year variability inprecipitation is less (Map 46).
130°W 120°W110°W60°N6Y u k o nN o r t h w e s tT e r r i t o r i e sM A P 4 5the biodiversity atlas <strong>of</strong> british columbiaAbsolute rate <strong>of</strong>change in precipitation(average <strong>of</strong> all months)from 1971 to 2000t60°NLegend!. CityRoadRiver/StreamLakeB r i t i s hPrecipitation change0.00 - 1.98C o l u m b i a1.99 - 2.552.56 - 3.183.19 - 3.84Fort St. JohnA l b e r t a3.85 - 5.375.38 - 6.746.75 - 7.9255°N55°N7.93 - 9.559.56 - 11.6111.62 - 27.28Units = millimetres per decade.Prince RupertEdmontonPrince GeorgeQueenCharlotteIslandsArea <strong>of</strong> DetailEqual Interval ClassificationCalgary0 100 200Kilometres50°NPrecipitation change0.00 - 2.732.74 - 5.465.47 - 8.188.19 - 10.9110.92 - 13.6413.65 - 16.37P a c i f i cO c e a nVancouverIslandVancouverKamloopsKelowna50°NData sources:Pacific Climate ImpactsConsortium (University <strong>of</strong>Victoria)Map by:Caslys Consulting LtdProjection:<strong>BC</strong> Albers NAD83Produced for:16.38 - 19.0919.10 - 21.8221.83 - 24.55VictoriaU N I T E D S T A T E S24.56 - 27.28February 5, 2009130°W120°W
t130°W 120°W110°W60°NY u k o nN o r t h w e s tT e r r i t o r i e s60°NM A P 4 6Relative rate <strong>of</strong>change in precipitation(average <strong>of</strong> all months)from 1971 to 2000Legend!. CityRoadRiver/StreamLakeB r i t i s hPrecipitation change0.00 - 0.13C o l u m b i a0.13 - 0.140.14 - 0.150.15 - 0.16Fort St. JohnA l b e r t a0.16 - 0.170.17 - 0.180.19 - 0.2055°N55°N0.20 - 0.210.22 - 0.230.24 - 0.45Units = standard deviations perdecade averaged for all months.Prince RupertEdmontonPrince GeorgeQueenCharlotteIslandsArea <strong>of</strong> DetailEqual Interval ClassificationCalgary0 100 200Kilometres50°NPrecipitation change0.00 - 0.040.05 - 0.090.10 - 0.130.14 - 0.180.19 - 0.22P a c i f i cO c e a nVancouverIslandVancouverKamloopsKelowna50°NData sources:Pacific Climate ImpactsConsortium (University <strong>of</strong>Victoria)Map by:Caslys Consulting LtdProjection:<strong>BC</strong> Albers NAD83Produced for:0.23 - 0.270.28 - 0.310.32 - 0.360.37 - 0.40VictoriaU N I T E D S T A T E S0.41 - 0.45February 5, 2009130°W120°W
8the biodiversity atlas <strong>of</strong> british columbiaSeasonal Trends in Climate<strong>The</strong> following series <strong>of</strong> seasonal maps showtrends around the province for the threeclimate variables over the 30 years from1971-2000. 171 <strong>The</strong> trends are based on rates<strong>of</strong> change for temperature in o C per decadeand rates <strong>of</strong> change in precipitation in millimetresper decade.Minimum temperatures have beenincreasing across most <strong>of</strong> the province, morerapidly in winter, spring and summer, withthe greatest rates <strong>of</strong> change (up to 2.0 o C/decade)in the north in winter (Map 47).<strong>The</strong> changes in maximum temperaturevary widely compared to minimum temperatures(Map 48). Winters in much <strong>of</strong> theprovince have warmed strongly by up to1.5 o C per decade. Spring temperatures havealso warmed by up to 0.75 o C per decade.Summer maximum temperatures havewarmed in the south and north, but actuallycooled in the southeast and extreme northeastcorner. Maximum fall temperatureshave warmed in the south, but cooled by asmuch as 0.5 o C per decade in much <strong>of</strong> thenorth.Dry stream bed in the Chilcotin Mountains.photo: craig farish.Map 49 shows seasonal trends in precipitation.In general, the south <strong>of</strong> the provincehas been getting wetter in spring, summerand fall. <strong>The</strong> north has been wetter in summerand drier in spring and fall, except for thenorth coast and the northeast corner <strong>of</strong> theprovince which have been wetter in fall. Wintertrends show that most <strong>of</strong> the province hasbeen getting drier by about –2.9 mm per decadewith pockets <strong>of</strong> more significant dryingon the central coast and the southeast cornerwhere precipitation in the Rocky MountainTrench has decreased by as much as -8.9mm per decade (dark orange colouring).Exceptions occur on Vancouver Island andthe northwest corner <strong>of</strong> the province whereprecipitation in winter has been increasing.
Y u k o nN o r t h w e s tT e r r i t o r i e sY u k o nN o r t h w e s tT e r r i t o r i e sM A P 4 7Seasonal trends inminimum temperaturefrom 1971 to 2000B r i t i s hC o l u m b i aA l b e r t aB r i t i s hC o l u m b i aA l b e r t aLegendRiver/StreamLakeTemperature trendQueenCharlotteIslandsQueenCharlotteIslands-0.25 to 0.000.00 to +0.25+0.26 to +0.50+0.51 to +0.75+0.76 to +1.00+1.01 to +1.25+1.26 to +1.50+1.51 to +1.75P a c i f i cP a c i f i c+1.76 to +2.00O c e a nO c e a nVancouverIslandWinter - December, January and FebruaryU N I T E D S T A T E SVancouverIslandSpring - March, April and MayU N I T E D S T A T E SUnits = °C per decade.Negative numbers indicate adecrease and positive an increasein temperature.Y u k o nN o r t h w e s tT e r r i t o r i e sY u k o nN o r t h w e s tT e r r i t o r i e sB r i t i s hC o l u m b i aB r i t i s hC o l u m b i aArea <strong>of</strong> DetailA l b e r t aA l b e r t a0 250 500KilometresQueenCharlotteIslandsQueenCharlotteIslandsData sources:Pacific Climate ImpactsConsortium (University <strong>of</strong>Victoria)Map by:Caslys Consulting LtdP a c i f i cP a c i f i cProjection:<strong>BC</strong> Albers NAD83O c e a nO c e a nProduced for:VancouverIslandVancouverIslandSummer - June, July and AugustU N I T E D S T A T E SFall - September, October and NovemberU N I T E D S T A T E SFebruary 4, 2009
N o r t h w e s tN o r t h w e s t100 Y u k o nY u k o nthe biodiversity atlas <strong>of</strong> british columbiaT e r r i t o r i e sT e r r i t o r i e sSeasonal trends inmaximum temperaturefrom 1971 to 2000M A P 4 8QueenCharlotteIslandsB r i t i s hC o l u m b i aA l b e r t aQueenCharlotteIslandsB r i t i s hC o l u m b i aA l b e r t aLegendRiver/StreamLakeTemperature trend-0.50 to -0.25-0.26 to 0.000.00 to +0.25+0.26 to +0.50+0.51 to +0.75+0.76 to +1.00+1.01 to +1.25+1.26 to +1.50P a c i f i cP a c i f i cO c e a nO c e a nVancouverIslandWinter - December, January and FebruaryU N I T E D S T A T E SVancouverIslandSpring - March, April and MayU N I T E D S T A T E SUnits = °C per decade.Negative numbers indicate adecrease and positive an increasein temperature.Y u k o nN o r t h w e s tT e r r i t o r i e sY u k o nN o r t h w e s tT e r r i t o r i e sB r i t i s hC o l u m b i aB r i t i s hC o l u m b i aArea <strong>of</strong> DetailA l b e r t aA l b e r t a0 250 500KilometresQueenCharlotteIslandsQueenCharlotteIslandsData sources:Pacific Climate ImpactsConsortium (University <strong>of</strong>Victoria)Map by:Caslys Consulting LtdP a c i f i cP a c i f i cProjection:<strong>BC</strong> Albers NAD83O c e a nO c e a nProduced for:VancouverIslandVancouverIslandSummer - June, July and AugustU N I T E D S T A T E SFall - September, October and NovemberU N I T E D S T A T E SFebruary 4, 2009
Y u k o nN o r t h w e s tT e r r i t o r i e sY u k o nN o r t h w e s tT e r r i t o r i e sM A P 4 9Seasonal trendsin precipitation from1971 to 2000B r i t i s hC o l u m b i aA l b e r t aB r i t i s hC o l u m b i aA l b e r t aLegendRiver/StreamLakePrecipitation trendQueenCharlotteIslandsQueenCharlotteIslands-11.9 to -9.0-8.9 to -6.0-5.9 to -3.0-2.9 to 0.0+0.1 to +3.0+3.1 to +6.0P a c i f i cP a c i f i cO c e a nO c e a nVancouverIslandWinter - December, January and FebruaryU N I T E D S T A T E SVancouverIslandSpring - March, April and MayU N I T E D S T A T E SUnits = millimetres per decade.Negative numbers indicate adecrease and positive an increasein precipitation.Y u k o nN o r t h w e s tT e r r i t o r i e sY u k o nN o r t h w e s tT e r r i t o r i e sB r i t i s hB r i t i s hC o l u m b i aC o l u m b i aArea <strong>of</strong> DetailA l b e r t aA l b e r t a0 250 500KilometresQueenCharlotteIslandsQueenCharlotteIslandsData sources:Pacific Climate ImpactsConsortium (University <strong>of</strong>Victoria)Map by:Caslys Consulting LtdP a c i f i cP a c i f i cProjection:<strong>BC</strong> Albers NAD83O c e a nO c e a nProduced for:VancouverIslandVancouverIslandSummer - June, July and AugustU N I T E D S T A T E SFall - September, October and NovemberU N I T E D S T A T E SFebruary 4, 2009
102 the biodiversity atlas <strong>of</strong> british columbiaMountain Pine Beetle48%19%32%AREA OF FOREST NOTAFFECTED BY MPB, 48%PROJECTED ADDITIONALAREA OF FOREST AFFECTEDBY MPB IN 2018, 32%FOREST AFFECTED BY MPBIN 2006, 19%figure 10: Forests in B.C. affectedby mountain pine beetle (MPB), withprojections to 2018.source: Forest area is based on Baseline<strong>The</strong>matic Mapping (BTM), IntegratedLand Management Bureau from mid-1990sinventory data. Mountain pine beetle data isbased on the Ministry <strong>of</strong> Forests and Range1999 to 2006 Provincial Aerial Overview <strong>of</strong>Forest Health (http://www.for.gov.bc.ca/hfp/health/overview/overview.htm) and outputfrom the <strong>BC</strong>MPB Projection Model (version4) (www.for.gov.bc.ca/hre/<strong>BC</strong>MPB).<strong>The</strong> mountain pine beetle (MPB) (Dentroctonusponderosae) is a natural part <strong>of</strong> B.C.’sinterior pine forest ecosystems. <strong>The</strong> adultbeetle lays its eggs under the bark <strong>of</strong> maturepine trees. When the eggs hatch, the pinebeetle larvae feed on the inner bark, cutting<strong>of</strong>f the tree’s nutrient supply. 172 <strong>The</strong> beetlealso introduces a blue stain fungus into thesapwood, which prevents the tree from repellingthe attacking beetles with pitch flow. Amountain pine beetle infestation can kill ahost tree within a few weeks. 173B.C. is currently experiencing the largestmountain pine beetle infestation ever recordedin the province. <strong>The</strong> outbreak is dueto two factors: the large amount <strong>of</strong> maturepine – the beetle’s preferred host – presentin B.C.’s interior forests as a result <strong>of</strong> pastfire suppression and silvicultural practices;and the lack <strong>of</strong> sufficiently long periods <strong>of</strong>winter temperatures cold enough to killoverwintering beetles and keep the populationin check. 174,175 In the southern part <strong>of</strong>the mountain pine beetle’s range, droughtduring the past several years has also madethe trees less able to resist attack. 176As <strong>of</strong> 2006, 19% <strong>of</strong> B.C.’s forest had beeninfected by mountain pine beetle with an additional32% expected to be affected by 2018(Figure 10). <strong>The</strong> infestation peaked in 2004and will have largely subsided by 2019. 177Map 50 shows areas <strong>of</strong> the provincemore than 10% impacted by mountain pinebeetle up to and including 2007. <strong>The</strong> resultingchanges in forest structure have a number <strong>of</strong>ramifications. Pine obligate species, such asthe western pine elfin (Callophrys eryphon)and the pine subspecies <strong>of</strong> the red crossbill(Loxia curvirostra stricklandi), may sufferfrom the dramatic loss <strong>of</strong> pine in the province.178 Loss <strong>of</strong> mature forest canopy reduceshabitat quality and quantity for many birdand mammal species, and winter cover forungulates, although the increase in standingand fallen dead trees will provide habitat forwoodpeckers and cavity nesting birds. 179 Newunderstory vegetation may benefit some speciessuch as grouse, deer and bears. Reductionin transpiration as a result <strong>of</strong> extensive treedeath is expected to significantly raise peakdischarge in forest hydrology. 180,181 <strong>The</strong> resultingincreased run-<strong>of</strong>f will have short-termeffects on stream systems, including erosion.<strong>The</strong> effects <strong>of</strong> increased logging levels (p.104)from the salvage <strong>of</strong> beetle-killed timber maybe significant. 182,183,184,185 <strong>The</strong> risk <strong>of</strong> fire inbeetle-killed forests is increasing. 186,187<strong>The</strong> effects <strong>of</strong> climate change have alreadyexpanded the amount <strong>of</strong> habitat suitablefor mountain pine beetle by 75% in the pastthree decades, and the beetle has moved intoAlberta. 188 This trend is expected to continue.
t130°W 120°W110°W60°NY u k o nN o r t h w e s tT e r r i t o r i e s60°NM A P 5 0Area <strong>of</strong> forestsmore than 10%impacted bymountain pine beetleLegendB r i t i s hC o l u m b i a!. CityRoadRiver/StreamLakeYear200720031999Fort St. JohnA l b e r t a55°N55°NPrince RupertEdmontonPrince GeorgeQueenCharlotteIslandsArea <strong>of</strong> DetailCalgary0 100 200Kilometres50°NP a c i f i cO c e a nKamloopsKelowna50°NData sources:B.C. Ministry <strong>of</strong> Forests andRangeMap by:Caslys Consulting LtdVancouverIslandVancouverProjection:<strong>BC</strong> Albers NAD83Produced for:VictoriaU N I T E D S T A T E SFebruary 25, 2009130°W120°W
104 the biodiversity atlas <strong>of</strong> british columbiaForestrySeventy percent <strong>of</strong> B.C.’s land is coveredby forest (p.14). Timber has or is expectedto be harvested from approximately 46%(28.4 million ha) <strong>of</strong> this forest land base. 189Excluded are protected forests, other reservesand forests considered uneconomicalfor timber production. Some aspects <strong>of</strong> specificforestry activities such as the building<strong>of</strong> forest access roads, silviculture, and firesuppression can result in ecosystem degradation,and disturbance, affecting speciesand ecosystems. 190Most forestry operations take place inthe productive, easily accessible, low elevationvalleys where the majority <strong>of</strong> speciesalso live. An assessment <strong>of</strong> 3,199 B.C. nativeinvertebrates and vascular plant speciesclassified 41% as forest-associated, q 8% <strong>of</strong>which are <strong>of</strong> conservation concern. 191 Manyspecies (e.g., marbled murrelets, somelichens and invertebrates) are known to relyon old large trees and the oldest age classes<strong>of</strong> forests. 192,193,194,195Approximately 9% <strong>of</strong> the total land area r<strong>of</strong> <strong>British</strong> <strong>Columbia</strong> has been logged sincethe 1970s (Table 27, Map 51). Logging priortable 27. percentage <strong>of</strong> landlogged in b.c. since the1970s by biogeoclimaticzone.biogeoclimaticzonepercentage <strong>of</strong> totalland area loggedsince 1970sSub-Boreal Spruce 23%Interior Douglas-fir 22%Montane Spruce 22%Interior Cedar–Hemlock 22%Sub-Boreal Pine–Spruce 17%Coastal Western Hemlock 14%Ponderosa Pine 8%Engelmann Spruce–Subalpine Fir 6%Coastal Douglas-fir 6%Boreal White and Black Spruce 5%Mountain Hemlock 2%Spruce–Willow–Birch
t130°W 120°W110°WM A P 5 160°NY u k o nN o r t h w e s tT e r r i t o r i e s60°NPercentage loggedsince the 1970sLegend!. CityRoadRiver/StreamLakePercentageB r i t i s hC o l u m b i a0.000.01 - 1.571.58 - 4.584.59 - 8.658.66 - 13.84Fort St. JohnA l b e r t a13.85 - 19.7819.79 - 27.4227.43 - 37.0937.10 - 51.2155°N55°N51.22 - 100.00Units = percentage <strong>of</strong> land area.Prince RupertEdmontonPrince GeorgeQueenCharlotteIslandsArea <strong>of</strong> Detail50°NEqual Interval ClassificationPercentage0.00 - 10.0010.01 - 20.0020.01 - 30.0030.01 - 40.0040.01 - 50.0050.01 - 60.00P a c i f i cO c e a nVancouverIslandVancouverKamloopsKelownaCalgary50°N0 100 200KilometresData sources:Baseline <strong>The</strong>matic Mapping(v.1 and 2 merged), B.C.Ministry <strong>of</strong> Forests and Range(Results and Change Detection)Map by:Caslys Consulting LtdProjection:<strong>BC</strong> Albers NAD83Produced for:60.01 - 70.0070.01 - 80.0080.01 - 90.00VictoriaU N I T E D S T A T E S90.01 - 100.00February 25, 2009130°W120°W
106 the biodiversity atlas <strong>of</strong> british columbiaTransportation and Utility CorridorsRoads and other linear features includeprimary, secondary and forestry roads,trails, hydro transmission corridors, seismiclines, s pipelines, and railways. Roads andother linear features impede the movement<strong>of</strong> native species, facilitate invasion by alienspecies and alter predator-prey relationships.198,199 Roads can fragment ranges, populations,habitats and ecosystems, 200, 201, 202 andreduce gene flow, resulting in loss <strong>of</strong> geneticdiversity. 203 Roads can impede the naturalflow <strong>of</strong> water and soil across the landscape.Roads can increase access to previously inaccessibleareas, resulting in increased roadkill <strong>of</strong> wildlife and increased access for legaland illegal fishing and hunting. Both on-roadand <strong>of</strong>f-road vehicles can create disturbance,which can alter species behaviour.<strong>The</strong> ecological impacts <strong>of</strong> roads can affectapproximately 20 times the land area that theroads actually cover, 204 making roads a usefulindex for cumulative impacts on biodiversity.Between 1988 and 2000, road length t in B.C.increased by 48% from an estimated 387,000km to over 570,000 km. 205 By 2005, total roadlength was 702,574 km, a 23% increase in fiveyears, and an 82% increase since 1988. 206Table 28 compares the density <strong>of</strong> roadsand other linear features (including seismiclines) for B.C.’s biogeoclimatic zones (p. 20).<strong>The</strong> density <strong>of</strong> roads and other linearHighest densities <strong>of</strong> roads and other linearfeatures are found in the Coastal Douglas-fir,Ponderosa Pine, Bunchgrass, and InteriorDouglas-fir zones, all zones <strong>of</strong> conservationconcern (p. 22). 207features varies across the province, with thegreatest densities in the northeast, centralinterior and southwest (including VancouverIsland) and in the major valleys in the southerninterior (Map 52). Seventy-six percent <strong>of</strong>table 28. density and presence <strong>of</strong> roads or other linear B.C.’s roads are forestfeatures for b.c.’s biogeoclimatic zonesaccess roads. 208 <strong>The</strong>ROAD DENSITY PercentaGe <strong>of</strong> 1area <strong>of</strong> high density inBIOGEOCLIMATIC ZONE(km/km 2 ) hectare units with the northeast cornerroads present<strong>of</strong> the province isCoastal Douglas-fir 4.7 38% largely due to seismicPonderosa Pine 3.0 28%lines used for oilBunchgrass 2.8 25% and gas explorationInterior Douglas-fir 2.1 22% (p.114). Although seismicBoreal White and Black Spruce 1.4 15%lines are allowedInterior Cedar–Hemlock 1.3 14% to revert back to forestSub-Boreal Spruce 1.3 13% after use, thousandsMontane Spruce 1.3 14% <strong>of</strong> kilometres <strong>of</strong> newSub-Boreal Pine–Spruce 1.1 12% lines are cut eachCoastal Western Hemlock 0.9 9% year. 209 Large tracts,Engelmann Spruce–Subalpine Fir 0.3 3%predominantly mountainous,Mountain Hemlock 0.1 1%in the north-Spruce–Willow–Birch 0.1 1%west <strong>of</strong> the provinceBoreal Altai Fescue Alpine
t130°W 120°W110°W60°NY u k o nN o r t h w e s tT e r r i t o r i e s60°NM A P 5 2Density <strong>of</strong> roads andother linear developmentfeatures*Legend!. CityRoadRiver/StreamLakeB r i t i s hC o l u m b i aLinear density0.000.01 - 0.140.15 - 0.350.36 - 0.63Fort St. JohnA l b e r t a0.64 - 0.950.96 - 1.291.30 - 1.671.68 - 2.1355°N55°N2.14 - 2.892.90 - 22.10Units = km/km 2 .Prince RupertEdmontonPrince GeorgeQueenCharlotteIslandsArea <strong>of</strong> DetailEqual Interval ClassificationCalgary0 100 200Kilometres50°NLinear density0.00 - 2.212.22 - 4.42P a c i f i cO c e a nKamloopsKelowna50°NData sources:Terrain Resource InformationManagement - Enhanced BaseMap, Digital Road <strong>Atlas</strong> (v. 1.1),Oil and Gas CommissionMap by:Caslys Consulting Ltd4.43 - 6.636.64 - 8.848.85 - 11.0511.06 - 13.26VancouverIslandVancouverProjection:<strong>BC</strong> Albers NAD83Produced for:13.27 - 15.4715.48 - 17.6817.69 - 19.89VictoriaU N I T E D S T A T E S19.90 - 22.10*Other linear development features include: transmission lines; railways; seismic lines; and pipelines.February 5, 2009130°W120°W
108 the biodiversity atlas <strong>of</strong> british columbiaObstacles to Fish PassageGord MacKinnonAn estimated 66,000 new road crossings <strong>of</strong>streams were constructed in B.C. between2000 and 2005, which represents an average<strong>of</strong> 13,369 new structures every year. 211,212Through GIS analysis, it has been estimatedthat there are approximately 550,000 km <strong>of</strong>resource roads in B.C. with approximately444,000 stream crossings. Modelling <strong>of</strong> fishhabitat has shown that over 313,000 <strong>of</strong> thesecrossings occur on stream reaches that havebeen classified as potential fish habitat. Afteradjusting for bridges and other openbottom structures (not as likely to impedebarrierstreams with connectivity lostroadupstream fish passage), the estimate forclosed bottom culverts on fish streams is approximately250,000. 213When these crossings are poorly designed,built or maintained, they can represent ablockage to the upstream migration <strong>of</strong> fish,thereby disrupting connectivity and effectivelycutting <strong>of</strong>f thousands <strong>of</strong> kilometres <strong>of</strong>fish habitat across the province. Figure 11illustrates how potential fish habitat is lostupstream <strong>of</strong> a culvertbarrierthat fails to allowfish passage. Mapstreams with connectivitymaintainedfigure 11: Potential loss <strong>of</strong> fish habitat owingto stream crossings that block fish passage.illustration: Soren Henrich.not a barrierGord MackinnonTory Stevens53 shows the density per square kilometre<strong>of</strong> potential obstacles on known fish bearingstreams around the province. It is importantto note that not all fish bearing streams havebeen documented and that not all crossingswill act as barriers to fish passage.Where total obstruction to all life stages <strong>of</strong>salmon exists in the lower reaches <strong>of</strong> a watershed,critical migrations and access to largeareas <strong>of</strong> essential rearing and spawning habitatupstream may be eliminated, resultingin significant impacts on a salmon stock orpopulation. 214 In addition, the elimination <strong>of</strong>access for fish to large portions <strong>of</strong> a watershedcan disrupt nutrient cycling by preventinganadromous salmon, which have spent part<strong>of</strong> their life cycle at sea, from transportingvaluable nutrients and food into the farthestinland reaches <strong>of</strong> the province. 215 Similarly,the dispersal <strong>of</strong> aquatic invertebrates, suchas freshwater mussels, whose larvae travelthroughout stream systems on the fins or gills<strong>of</strong> fish, may be limited.Unfortunately, poorly functioning closedbottom culverts are very common in B.C. Anumber <strong>of</strong> culvert assessment projects showthat 90% <strong>of</strong> the closed bottom structures onfish habitat were either partial or completebarriers to fish passage. 216, 217 Even a moreconservative failure rate <strong>of</strong> 70% to 80% representsbetween 175,000 and 200,000 crossingswhich impede fish passage in some way.
t130°W 120°W110°W60°NY u k o nN o r t h w e s tT e r r i t o r i e s60°NM A P 5 3Density <strong>of</strong> roadcrossings onfish-bearing streams*Legend!. CityRoadRiver/StreamB r i t i s hC o l u m b i aLakeRoad/stream crossing density0.000.01 - 0.160.17 - 0.290.30 - 0.440.45 - 0.610.62 - 0.80Fort St. JohnA l b e r t a0.81 - 1.021.03 - 1.351.36 - 1.9555°N55°N1.96 - 11.98Units = number <strong>of</strong> road crossingson fish-bearing streams/km 2 .Prince RupertEdmontonPrince GeorgeQueenCharlotteIslandsArea <strong>of</strong> Detail50°NEqual Interval ClassificationP a c i f i cO c e a nRoad/stream crossing density0.00 - 1.201.21 - 2.402.41 - 3.593.60 - 4.794.80 - 5.996.00 - 7.197.20 - 8.388.39 - 9.58VancouverIslandVancouverVictoriaCalgaryKamloopsKelownaU N I T E D S T A T E S50°N0 100 200KilometresData sources:Terrain Resource InformationManagement - Enhanced Base Map,Digital Road <strong>Atlas</strong> (v. 1.1), ForestTenure Roads, Corporate WatershedBase, Fisheries Information SummarySystem (2006)Map by:Caslys Consulting LtdProjection:<strong>BC</strong> Albers NAD83Produced for:9.59 - 10.7810.79 - 11.98*Not all fish-bearing streams have been documented.February 5, 2009130°W120°W
110 the biodiversity atlas <strong>of</strong> british columbiaWater DevelopmentWater development refers to activitiesand associated infrastructure relatingto the usage <strong>of</strong> water for domestic, commercial,agricultural and industrial purposes.Mapping information was available for twoaspects <strong>of</strong> water development in <strong>British</strong><strong>Columbia</strong>: water diversion and dams.Water DiversionWater licenses and short-term use approvalscalled water allocations are issued fora variety <strong>of</strong> purposes which include smalldomestic and large-scale municipal watersupply, irrigation and agriculture, industrialand commercial uses, mining, habitatconservation, power production, and waterstorage. <strong>The</strong> diversion <strong>of</strong> water from lakescan cause excessive drawdown <strong>of</strong> surfaceCleveland dam.photo: klaas lingbeek-van kranen.water sources with consequent disruption<strong>of</strong> aquatic and riparian habitat. 218 In rivers,water diversions reduce flow and lowerwater levels, which can create barriers tomovement <strong>of</strong> fish and other aquatic species.219, 220 Withdrawal <strong>of</strong> water from streamscan affect the biological carrying capacity <strong>of</strong>the stream, cause changes in temperaturesand alter life history stages <strong>of</strong> aquatic organisms,depending on when and how muchwater is removed. Fish and other animals aresometimes trapped or die when drawn intodiversion channels or other in-stream structures,such as turbines. Wastewater divertedfrom industrial uses is <strong>of</strong>ten returned to thesource waterbody with contaminants and/or significant changes in temperature.Table 29 shows water allocation (excludingwater storage, diversion for dams andallocations for conservation purposes) inB.C.’s nine Major Drainage Areas (p.28) withthe highest allocations occurring in theFraser, Coastal and <strong>Columbia</strong> areas. <strong>The</strong>seallocations include about 30,000 licensesfor a total permitted volume <strong>of</strong> over 21billion kilolitres/year. Map 54 illustratescomparative levels <strong>of</strong> water diversion acrossthe province. u A license does not mean that100% <strong>of</strong> the permitted water is diverted bytable 29. surface water allocation inb.c. by major drainage areaMAJOR DRAINAGEAREAVOLUME OF LICENSEWATER ALLOCATION(KILOLITRES/YEAR)Fraser 10,617,165,159Coastal 6,960,674,550<strong>Columbia</strong> 3,191,406,652Skeena 547,689,512Mackenzie 393,667,691Stikine 1,002,531Nass 816,950Yukon 816,924Taku 27,990Provincial total 21,713,267,959source: Prepared for this report based on data fromthe B.C. Ministry <strong>of</strong> Environment.notes: This excludes water storage, diversion for damsand allocations for conservation purposes.a user; therefore the index reflects only themaximum potential for diversion. Betweenhalf and two-thirds <strong>of</strong> available surfacewater in populated regions <strong>of</strong> B.C. has beenallocated. 221 Over the past three decades,surface water use restrictions have increasedwith close to 30% <strong>of</strong> licensed stream lengthin the province now under restrictions. 222<strong>The</strong> majority <strong>of</strong> the restrictions are locatedin the southern Interior.u<strong>The</strong> calculation for the index values on the map uses the magnitude and dilution approach as shown for the water pollution index on page 122 (Fig.14).
t130°W 120°W110°WM A P 5 460°NY u k o nN o r t h w e s tT e r r i t o r i e s60°NWater diversionindexLegend!. CityRoadRiver/StreamLakeWater diversion index0B r i t i s h1 - 220221 - 1,157C o l u m b i a1,158 - 4,1514,152 - 11,24611,247 - 26,057Fort St. JohnA l b e r t a26,058 - 55,65355,654 - 121,707121,708 - 337,04255°N55°N337,043 - 5,056,563,610Index = kilolitres <strong>of</strong> licensed waterdiversion (excluding water storage,diversion for dams and conservationallocations) within or upstream <strong>of</strong> theanalysis unit / maximum streammagnitude in, or upstream <strong>of</strong>, theanalysis unit.Prince RupertPrince GeorgeEdmontonQueenCharlotteIslandsArea <strong>of</strong> DetailCalgary0 100 200Equal Interval ClassificationKilometres50°NWater diversion index0 - 505,656,361505,656,362 - 1,011,312,722P a c i f i cO c e a nKamloopsKelowna50°NData sources:B.C. Ministry <strong>of</strong> EnvironmentMap by:Caslys Consulting LtdProjection:<strong>BC</strong> Albers NAD831,011,312,723 - 1,516,969,0831,516,969,084 - 2,022,625,4442,022,625,445 - 2,528,281,805VancouverIslandVancouverProduced for:2,528,281,806 - 3,033,938,1663,033,938,167 - 3,539,594,5273,539,594,528 - 4,045,250,8884,045,250,889 - 4,550,907,249VictoriaU N I T E D S T A T E S4,550,907,250 - 5,056,563,610February 25, 2009130°W120°W
112 the biodiversity atlas <strong>of</strong> british columbiaDamsDams are built primarily for hydroelectricpower generation, flood control,and irrigation. In B.C., mountainous terrain,high volume rivers, and long narrow valleysmakes dam construction relatively easy(p. 10). Ninety percent <strong>of</strong> B.C.’s electricity isgenerated by hydroelectric dams, and morethan 70% <strong>of</strong> this is produced by dams on thePeace and <strong>Columbia</strong> Rivers. 223Of the 2,200 registered dams in <strong>British</strong><strong>Columbia</strong>, 44 are for generating hydroelectricpower, including 13 on the <strong>Columbia</strong>River, two on the Peace River, 11 in the LowerMainland, seven on Vancouver Island, andtwo on the mainland coast. 224,225 <strong>The</strong> thousands<strong>of</strong> other dams are generally small andused for domestic water sources, run-<strong>of</strong>-riverpower production, and local industrial uses.Impacts from dams result in both ecosystemconversion and degradation relatedto infrastructure, upstream reservoirs anddegradation <strong>of</strong> downstream ecosystems.<strong>The</strong> inundation <strong>of</strong> a reservoir upstream<strong>of</strong> a dam results in ecosystem conversion(p.80) through the extirpation <strong>of</strong> riparianand valley-bottom habitats, which typicallysupport high levels <strong>of</strong> biodiversity. 226 Besidesdecreasing biodiversity in adjacent riparianplant communities, 227 flooded riparianvegetation can be a source <strong>of</strong> methane andCO 2, both greenhouse gases that contributeto climate change (p. 88). 228 Reservoirs slowthe velocity <strong>of</strong> the water, trapping sedimentsand nutrients that normally depositin estuaries and deltas downstream, andwhich instead build up on the bottom <strong>of</strong> thereservoir. 229 Many species have difficulty adjustingto the sometimes daily fluctuationsin water levels in a reservoir, and aquaticbiodiversity is lower in a reservoir than in alake <strong>of</strong> similar size and location. 230Dams can also create significant ecosystemdegradation by hampering the movement<strong>of</strong> migratory fish species (which reducesthe transfer <strong>of</strong> marine-derived nutrientsinto interior ecosystems) and some terrestrialspecies. Dams can change turbidity and sedimentlevels to which species and ecosystemsare adapted, disrupt normal processes <strong>of</strong>river channel scouring and silt deposition,prevent normal downstream movement <strong>of</strong>large woody debris, change water temperatureand oxygen conditions, provide habitatfor alien species (p. 82), and create unstable,early seral communities along shorelines.A dam typically decreases the annual floodarea below the dam and may increase flowduring the summer so that the river no longerdeposits sediments downstream. Decreaseddelivery <strong>of</strong> water and nutrients to downstreamecosystems, such as marshes and riparianareas, can cause a shift to species thatare adapted to drier conditions. Water thatflows through turbines into a river is colderand less oxygenated, because it originatesfrom deep in the reservoir and does not mixwith surface air. Vegetation, wildlife and fishpopulations can be altered for hundreds <strong>of</strong>kilometres downstream. 231Like large dams, small dams can alsoimpede fish passage, trap nutrients and alterflow regimes. Cumulative impacts can resultfrom the number <strong>of</strong> small dams on a river.Concerns include water diversion (p.110)and increases in construction <strong>of</strong> roads andtransmission lines (p.106).<strong>The</strong> Major Drainage Areas in B.C. (p. 28)that are most significantly affected by damsare those <strong>of</strong> the <strong>Columbia</strong>, Coastal, Mackenzieand Fraser rivers, and less significantly, theSkeena River. A dam can influence extensiveareas <strong>of</strong> the upstream watershed as illustratedby Map 55. Some river systems in B.C. are affectedby dams built outside the province.Dams have a functional lifespan andmany hundreds <strong>of</strong> dams have been abandoned.232 Dam decommissioning, modification,removal and water use planning havebeen used on some B.C. rivers to restore fishhabitat and water flow regimes. 233
t130°W 120°W110°WM A P 5 560°NY u k o nN o r t h w e s tT e r r i t o r i e s60°NAreas upstream<strong>of</strong> a damLegendB r i t i s h!. CityRoadRiver/StreamLakeDam downstreamNoYesC o l u m b i aFort St. JohnA l b e r t a55°N55°NPrince RupertEdmontonPrince GeorgeQueenCharlotteIslandsArea <strong>of</strong> DetailCalgary0 100 200Kilometres50°NP a c i f i cO c e a nKamloopsKelowna50°NData sources:Freshwater <strong>Atlas</strong>,B.C. Ministry <strong>of</strong> EnvironmentMap by:Caslys Consulting LtdVancouverIslandVancouverProjection:<strong>BC</strong> Albers NAD83Produced for:VictoriaU N I T E D S T A T E SFebruary 25, 2009130°W120°W
114 the biodiversity atlas <strong>of</strong> british columbiaOil and Gas DevelopmentPrimary and secondary impacts <strong>of</strong> oiland gas exploration and extraction caninclude ecosystem conversion, ecosystemdegradation, species disturbance and environmentalcontamination <strong>of</strong> soil, water andair. 234,235,236 At present, the majority <strong>of</strong> activitiesassociated with petroleum or natural gasextraction in <strong>British</strong> <strong>Columbia</strong> take place inInfrastructure relating to oil and gasdevelopment.photo: don wilkie.the relatively flat Interior Plains in the northeastcorner (Map 56). Densities <strong>of</strong> oil andgas sites in this region can reach 14.7 sites/km 2 . <strong>The</strong> map includes more than 32,000 oiland gas wells (average well pads are 1.4ha insize) and production facilities with most <strong>of</strong>the sites concentrated in the Boreal Whiteand Black Spruce biogeoclimatic zone (p.20)at a density <strong>of</strong> 196 sites/1,000km 2 (Table30). Many <strong>of</strong> these are inactive and will besubject to required reclamation.table 30. density <strong>of</strong> oil and gassites in b.c. bybiogeoclimatic zoneBIOGEOCLIMATIC ZONEdensity (number<strong>of</strong> sites /1,000 km 2 )Boreal White and Black Spruce 196Engelmann Spruce–Subalpine Fir 3Coastal Douglas-fir 2Montane Spruce 2Spruce–Willow–Birch 2Sub-Boreal Spruce 1Interior Douglas-fir
t130°W 120°W110°WM A P 5 660°NY u k o nN o r t h w e s tT e r r i t o r i e s60°NOil and gassite densityLegend!. CityRoadRiver/StreamLakeSite densityB r i t i s hC o l u m b i a0.000.01 - 0.040.05 - 0.080.09 - 0.130.14 - 0.20Fort St. JohnA l b e r t a0.21 - 0.300.31 - 0.430.44 - 0.620.63 - 0.9555°N55°N0.96 - 14.73Units = sites/km 2 .Prince RupertEdmontonPrince GeorgeQueenCharlotteIslandsArea <strong>of</strong> Detail50°NEqual Interval ClassificationSite density0.00 - 1.471.48 - 2.95P a c i f i cO c e a nKamloopsKelownaCalgary50°N0 100 200KilometresData sources:Oil and Gas CommissionMap by:Caslys Consulting LtdProjection:<strong>BC</strong> Albers NAD832.96 - 4.424.43 - 5.895.90 - 7.367.37 - 8.84VancouverIslandVancouverProduced for:8.85 - 10.3110.32 - 11.7811.79 - 13.26VictoriaU N I T E D S T A T E S13.27 - 14.73February 5, 2009130°W120°W
116 the biodiversity atlas <strong>of</strong> british columbiaIndustrial OperationsIndustrial operations refer to infrastructureand activities associated with largeproduction facilities such as factories, pulpand paper mills, municipal landfills, refineriesand smelters. <strong>The</strong> most significantimpact <strong>of</strong> industrial operations is environmentalcontamination. Four examples <strong>of</strong>environmental contamination in B.C. forwhich mapping data was available are presentedhere: contaminated sites (includinglandfills), emissions <strong>of</strong> nitrogen oxides andsulphur oxides, and water pollution.Black bear (Ursus americanus).photo: craig farish.Contaminated Sitesand LandfillsA contaminated site is one which hasbecome unsuitable for specified land andwater uses owing to spills or deposits <strong>of</strong>chemicals during commercial and industrialactivity. 237 Toxic substances from somecontaminated sites can migrate into soil,surface water and groundwater, posing athreat to the immediate and neighbouringland and water. Toxic chemicals can persistfor many years and even decades. 238 Activitiesrelated to vehicles and fossil fuels, suchas petroleum and natural gas storage anddistribution, vehicle salvage and wrecking,are the largest sources <strong>of</strong> environmentalcontamination in B.C., with benzene andtoluene from gasoline found at two-thirds <strong>of</strong>the sites. 239 Other chemicals include heavymetals such as lead, arsenic, cadmium andmercury; chlorophenols, benzo[a]pyreneand naphthalene from wood treatment; andpolychlorinated biphenyls (PCBs) releasedfrom heavy electrical equipment. 240Municipal landfills can be sources <strong>of</strong>ground and surface water pollution, as wellas greenhouse gas emissions, primarilymethane (CH 4) and carbon dioxide (CO 2). 241For example, groundwater contaminationand gas emissions are a concern at BurnsBog, a 5,000-year-old, 30 km 2 raised bogin Delta, <strong>British</strong> <strong>Columbia</strong> near Vancouver(p.74). 242 Burns Bog is the site <strong>of</strong> Canada’slargest landfill west <strong>of</strong> Toronto, and ninesmaller landfills are situated adjacentto the bog.As <strong>of</strong> 2008, over 9,000 sites were listedon the provincial registry. 243 Note that notall <strong>of</strong> the sites in the registry are necessarilycontaminated. Some were found to be cleanafter they were registered, others have beenremediated or are awaiting complete assessmentfor degree <strong>of</strong> contamination. Over2,000 contaminated sites and 634 landfillsare portrayed on Map 57 at densities up to7.7 sites/km 2 in the Lower Mainland and onVancouver Island. Not surprisingly, contaminatedsites and landfills are found predominantlyalong the highway system and inareas <strong>of</strong> human habitation.
t130°W 120°W110°W60°NY u k o nN o r t h w e s tT e r r i t o r i e s60°NM A P 5 7Contaminated sitesand landfills densityLegend!. CityRoadRiver/StreamLakeSite densityB r i t i s h0.0000.001 - 0.011C o l u m b i a0.012 - 0.0190.020 - 0.0290.030 - 0.049Fort St. JohnA l b e r t a0.050 - 0.0740.075 - 0.1040.105 - 0.18155°N55°N0.182 - 0.3380.339 - 7.692Units = sites/km 2 .Prince RupertEdmontonPrince GeorgeQueenCharlotteIslandsArea <strong>of</strong> Detail50°NEqual Interval ClassificationSite density0.000 - 0.0140.015 - 0.0500.051 - 0.1000.101 - 0.1700.171 - 0.2710.272 - 0.410P a c i f i cO c e a nVancouverIslandVancouverKamloopsKelownaCalgary50°N0 100 200KilometresData sources:B.C. Ministry <strong>of</strong> EnvironmentMap by:Caslys Consulting LtdProjection:<strong>BC</strong> Albers NAD83Produced for:0.411 - 0.6180.619 - 0.9840.985 - 2.201VictoriaU N I T E D S T A T E S2.202 - 7.692February 25, 2009130°W120°W
118 the biodiversity atlas <strong>of</strong> british columbiaEmissions <strong>of</strong> Nitrogen OxidesNitrogen oxides (NO X) refer to a family <strong>of</strong> reactivegases emitted largely when fossil fuelsare burned at high temperatures. Nitrogenoxides are released into the air from motorvehicle exhaust, the burning <strong>of</strong> coal, oil ornatural gas, and during industrial processessuch as arc welding, electroplating, engravingand dynamite blasting. NO Xcan also beformed naturally by lightning. 244Oxides <strong>of</strong> nitrogen in the atmosphere increasethe amount <strong>of</strong> other greenhouse gasessuch as methane, which eventually oxidizeto carbon dioxide, which is linked to climatechange (p. 88). 245 High levels <strong>of</strong> nitrogen oxidescan cause irritation to eyes, ears, throatand lungs, fatigue and gastric problems inhumans and other animals. Long-term exposuremay cause fluid build-up in the lungs,heart disease, decreased birth rates in animalsand damage to the nervous system. 246<strong>The</strong> province-wide density <strong>of</strong> emissions(kg/year/km 2 ) from human-initiated sourcesare shown on Map 58. v Total NO Xemissionsin 2000 in <strong>British</strong> <strong>Columbia</strong> were 338,631tonnes, with more than 60% occurring in theLower Fraser Valley (Figure 12). <strong>The</strong> mostsignificant human-initiated sources <strong>of</strong> NO Xin B.C. were marine transportation, heavydutydiesel vehicles and the oil and gasindustry. In the most populated region <strong>of</strong>the province, the Lower Fraser Valley, mobileRailtransportationOff-road use<strong>of</strong> dieselOthermobile9%16%Pulp and paperindustry6%13%10%18%Oil and gasindustry7%Marinetransportation14%Heavy dutyvehicles4%Other areasourcesOther pointsourcesfigure 12: Human-initiated sources <strong>of</strong>nitrogen oxides in B.C.source: B.C. Ministry <strong>of</strong> Water, Land and AirProtection (<strong>BC</strong>WLAP). 2005 (revision). 2000 <strong>British</strong><strong>Columbia</strong> Emissions Inventory <strong>of</strong> Criteria AirContaminants. Water, Air and Climate ChangeBranch. Available at: http://www.env.gov.bc.ca/air/airquality/pdfs/2000_inven_rep.pdf.sources (cars, trucks, aircraft, boats, trainsand <strong>of</strong>f-road vehicles) accounted for 88% <strong>of</strong>emissions.It is important to note that the map indicatesonly the emissions <strong>of</strong> NO Xat the pointand time <strong>of</strong> discharge. 247 Emissions willdissipate from the source over time. Highestdensities <strong>of</strong> emissions occur near Vancouverat up to 904 kg/year/km 2 .v<strong>The</strong> data is based on models. <strong>The</strong> model for the Lower Mainland near Vancouver, which appears as a block <strong>of</strong> colour, was developed separately from the model used forthe rest <strong>of</strong> the province.
t130°W 120°W110°W60°NY u k o nN o r t h w e s tT e r r i t o r i e s60°NM A P 5 8Nitrogen oxidesemission densityLegend!. CityRoadRiver/StreamLakeB r i t i s hC o l u m b i aNOx emission density*0.000.01 - 0.500.51 - 1.001.01 - 100.00Fort St. JohnA l b e r t a100.01 - 904.1155°N55°NUnits = kg/year/km 2 .Prince RupertEdmontonPrince GeorgeQueenCharlotteIslandsArea <strong>of</strong> DetailCalgary0 100 200Kilometres50°NP a c i f i cO c e a nKamloopsKelowna50°NData sources:B.C. Ministry <strong>of</strong> EnvironmentMap by:Caslys Consulting LtdVancouverIslandVancouverProjection:<strong>BC</strong> Albers NAD83Produced for:VictoriaU N I T E D S T A T E S*Only total emission data was available for two large areas in the lower mainland and, as a result, the average emission density is shown for each.February 25, 2009130°W120°W
120 the biodiversity atlas <strong>of</strong> british columbiaEmissions <strong>of</strong> Sulphur OxidesSulphur oxides (SO x) are corrosive colourlessgases produced by the combustion <strong>of</strong> fossilfuels containing sulphur and by power plantsand factories that burn coal or oil for fuel.Animals exposed to high concentrations <strong>of</strong>sulphur dioxide exhibited decreased respiration,inflammation <strong>of</strong> airways and destruction<strong>of</strong> lung tissue. 248Total SO Xemissions in 2000 in <strong>British</strong><strong>Columbia</strong> were 138,105 tonnes. 249 <strong>The</strong> majorpoint source <strong>of</strong> sulphur oxides in B.C. is thePulp and paperindustryOther mobilesources3% Marinetransportation12%11%Oil and gasindustry62%12%Other pointsourcesoil and gas industry (62%) (Figure 13). Othersignificant sources are the pulp and paperindustry and marine transportation. <strong>The</strong>province-wide density <strong>of</strong> emissions from allhuman-initiated sources is shown on Map59, w with the highest densities in the northeastPeace region where most <strong>of</strong> the oil andgas activity takes place.It is important to note that the map indicatesonly the emissions <strong>of</strong> SO xat the pointand time <strong>of</strong> discharge. 250 Emissions will dissipatefrom the source over time.figure 13: Human-initiated sources <strong>of</strong>sulphur oxides in B.C.source: B.C. Ministry <strong>of</strong> Water, Land and AirProtection (<strong>BC</strong>WLAP). 2005 (revision). 2000 <strong>British</strong><strong>Columbia</strong> Emissions Inventory <strong>of</strong> Criteria AirContaminants. Water, Air and Climate ChangeBranch. Available at: http://www.env.gov.bc.ca/air/airquality/pdfs/2000_inven_rep.pdf.w<strong>The</strong> data is based on models. <strong>The</strong> model for the Lower Mainland near Vancouver, which appears as a block <strong>of</strong> colour, was developed separately from the model used for therest <strong>of</strong> the province.
t130°W 120°W110°W60°NY u k o nN o r t h w e s tT e r r i t o r i e s60°NM A P 5 9Sulphur oxidesemission densityLegend!. CityRoadRiver/StreamLakeSOx emission density*B r i t i s hC o l u m b i a0.000.01 - 0.500.51 - 1.001.01 - 100.00Fort St. JohnA l b e r t a100.01 - 453.1055°N55°NUnits = kg/year/km 2 .Prince RupertEdmontonPrince GeorgeQueenCharlotteIslandsArea <strong>of</strong> DetailCalgary0 100 200Kilometres50°NP a c i f i cO c e a nKamloopsKelowna50°NData sources:B.C. Ministry <strong>of</strong> EnvironmentMap by:Caslys Consulting LtdVancouverIslandVancouverProjection:<strong>BC</strong> Albers NAD83Produced for:VictoriaU N I T E D S T A T E S*Only total emission data was available for two large areas in the lower mainland and, as a result, the average emission density is shown for each.February 25, 2009130°W120°W
122 the biodiversity atlas <strong>of</strong> british columbiaWater PollutionEnvironmental contamination in the form<strong>of</strong> water pollution can affect biodiversity bydegrading habitat quality for aquatic speciesand by creating conditions that impair thehealth <strong>of</strong> plants and animals.Under <strong>British</strong> <strong>Columbia</strong>’s EnvironmentalManagement Act, certain industries, trades,businesses, operations or activities dischargingwaste into streams and rivers require apermit. 251, 252,253 Information from this permitsystem was used to calculate a relativemeasure for the amount <strong>of</strong> water pollutionoccurring in the province. Because largevolumes <strong>of</strong> water have a diluting effect onpollutants, the water pollution index, shownon Map 60, was calculated by dividing thetotal discharge fees (a proxy for dischargepollution) within or upstream <strong>of</strong> an analysisunit by the magnitude <strong>of</strong> the maximummagnitude stream within or upstream <strong>of</strong> xthat analysis unit. Magnitude, which differsfrom stream order, is a proxy value for thevolume <strong>of</strong> water in the stream or river and iscalculated by adding the magnitudes <strong>of</strong> incomingupstream tributaries as illustrated inFigure 14. For example, if an industrial sitedischarges effluent upstream into a mainstemwith a magnitude <strong>of</strong> 2, the value <strong>of</strong> thedischarge will decrease proportionally as itmoves downstream through a magnitude 4figure 14: Comparison <strong>of</strong> stream magnitude and order.source: Magnitude: Shreve, R.L. 1967. Infinite topologically random channel networks J.Geology 75:178-186. Order:Strahler, A.N. 1952. Hypsometric (area-attitude) analysis <strong>of</strong> erosional topography. Bulletin <strong>of</strong> the Geological Society <strong>of</strong>America 63:923-938.section, until it encounters another source<strong>of</strong> discharge.<strong>The</strong> water pollution index is highest inthe Coastal, <strong>Columbia</strong>, Fraser and MackenzieMajor Drainage Areas (p. 28) (Table31). <strong>The</strong> extremely high index value for theCoastal area is owing to a number <strong>of</strong> largeindustrial sites near the coast that dischargeeffluent into the ocean. <strong>The</strong> water pollutionindex map does not indicate the volume ornature <strong>of</strong> the discharge or the level <strong>of</strong> pollutionbut shows only waterbodies with dischargeinputs under permit. <strong>The</strong>refore theindex indicates pollution potential ratherthan actual pollution levels or severity.table 31. water pollution indexvalues for majordrainage areas in b.c.MAJOR DrainageareawaTER POLLUTIONinDEXCoastal 372<strong>Columbia</strong> 32Fraser 24Mackenzie 10Skeena 1Stikine
t130°W 120°W110°WM A P 6 060°NY u k o nN o r t h w e s tT e r r i t o r i e s60°NWater pollutionindexLegend!. CityRoadRiver/StreamLakeWater pollution index0.00B r i t i s h0.01 - 0.030.04 - 0.15C o l u m b i a0.16 - 0.550.56 - 1.441.45 - 2.78Fort St. JohnA l b e r t a2.79 - 6.776.78 - 18.3618.37 - 49.8355°N55°N49.84 - 25,284.38Index = $ value <strong>of</strong> licensed waterpollution within or upstream <strong>of</strong> theanalysis unit / maximum streammagnitude in, or upstream <strong>of</strong>, theanalysis unit.Prince RupertPrince GeorgeEdmontonQueenCharlotteIslandsArea <strong>of</strong> DetailEqual Interval ClassificationCalgary0 100 200Kilometres50°NP a c i f i cO c e a nKamloopsKelowna50°NData sources:B.C. Ministry <strong>of</strong> EnvironmentMap by:Caslys Consulting LtdWater pollution index0.00 - 2,528.442,528.45 - 5,056.885,056.89 - 7,585.317,585.32 - 10,113.7510,113.76 - 12,642.19VancouverIslandVancouverProjection:<strong>BC</strong> Albers NAD83Produced for:12,642.20 - 15,170.6315,170.64 - 17,699.0717,699.08 - 20,227.5020,227.51 - 22,755.94VictoriaU N I T E D S T A T E S22,755.95 - 25,284.38February 25, 2009130°W120°W
124 the biodiversity atlas <strong>of</strong> british columbiaGlossaryAbiotic: non-living chemical and physicalfactors in the environment, including solarradiation, water, atmospheric gases, soil andphysical geography.Alien species: a species occurring in an areaoutside its historically known natural range asa result <strong>of</strong> intentional or accidental dispersalby humans (i.e., movement <strong>of</strong> individuals) ordirect human activities that remove a naturalbarrier (e.g., creation <strong>of</strong> a fish ladder to allowfish to move past a waterfall). Also knownas an exotic or introduced species. See alsoInvasive alien species.Anadromous: fish species that spawn (breedand lay eggs) in freshwater environments,but spend at least part <strong>of</strong> their adult life in amarine environment.Benthic: the bottom substrate <strong>of</strong> an aquaticenvironment.<strong>Biodiversity</strong>: the variety <strong>of</strong> species andecosystems on earth and the ecologicalprocesses <strong>of</strong> which they are a part, includingecosystem, species and genetic diversitycomponents.Bryophyte: primitive plant in the plant phylumBryophyta, lacking a vascular system andtypically growing in moist habitats.Carnivore: members <strong>of</strong> the Carnivora, anorder <strong>of</strong> mammals with most well-developedincisors and canine teeth for tearing flesh.Cascading impacts: impacts which initiateadditional impacts – e.g., loss <strong>of</strong> a majorpredator causes population increases in preyspecies which deplete forage plants.Climate change: a statistically significantvariation in either the mean state <strong>of</strong> theclimate or in its variability, persisting for anextended time period (typically decades orlonger).Climate envelope: the area <strong>of</strong> suitable climatefor a species or ecosystem in terms <strong>of</strong>temperature and precipitation. Climateenvelope models determine the currentdistribution <strong>of</strong> the species or ecosystem, thenmap the location <strong>of</strong> this same envelope undera climate change scenario.Conifer: a cone-bearing tree having needles orscale-like leaves; usually evergreen (with theexception in B.C. <strong>of</strong> Larix species).Connectivity: the degree to which ecosystemstructure facilitates or impedes dispersal andflow across a landscape.Conservation concern: globally or provinciallycritically imperilled (G1 or S1), imperilled(G2 or S2), or vulnerable (G3 or S3). Species,biogeoclimatic zones/subzones/variants,major drainage units and ecologicalcommunities <strong>of</strong> global conservation concernare ranked G1 to G3. Species, biogeoclimaticzones/subzones/variants, major drainageunits and ecological communities <strong>of</strong> provincialconservation concern are ranked S1 to S3.Conservation status: a measure <strong>of</strong> the risk <strong>of</strong>regional (i.e., provincial) extirpation or globalextinction for an element <strong>of</strong> biodiversity,population, subspecies, species or ecosystem.Contaminated site: one which has becomeunsuitable for specified land and wateruses owing to spills or deposits <strong>of</strong> chemicalsduring commercial and industrial activity.Cumulative impact: changes to theenvironment that are caused by a humanaction in combination with other past,present and future human actions.Cyanobacterium [pl. cyanobacteria]: aphotosynthetic bacterium generally bluegreenin colour.Decomposition: the breakdown <strong>of</strong> dead plantand animal matter into their inorganicconstituents such as carbon and nitrogen.
the biodiversity atlas <strong>of</strong> british columbia12Dicot [dicotyledon]: a flowering, vascular plantwith two cotyledons (primary embryonicleaves) in its seed (e.g., rose, aster, etc.).Direct mortality: the direct killing <strong>of</strong> individuals(e.g. harvest, by-catch, road kills, intentionalpoisoning).Dispersal: active or passive movement <strong>of</strong>individual organisms to different localities.Divergence (as in divergent evolution):accumulation <strong>of</strong> differences between groupswhich can lead to the formation <strong>of</strong> newspecies, usually a result <strong>of</strong> different groups<strong>of</strong> the same species adapting to differentenvironments.Ecosystem: a dynamic complex <strong>of</strong> plant, animaland microorganism communities and theirabiotic environment, all interacting as afunctional unit.Ecosystem conversion: replacement <strong>of</strong> naturalcommunities with human-dominatedsystems (e.g., intensive agriculture) orphysical works (e.g., mines, urban areas,reservoirs).Ecosystem degradation: direct change to thestructure <strong>of</strong> natural systems (e.g., throughforest harvesting or water diversion).Endemic: found only in a specified geographicregion native to, and restricted to, a particulargeographical region.Extinction (Extinct): the elimination <strong>of</strong> aspecies or subspecies from its entire globalrange.Extirpation [Extirpated]: the elimination <strong>of</strong> aspecies or subspecies from a specified area,but not from its entire global range.Fungi: single-celled, multinucleate ormulticellular organisms that lack chlorophylland vascular tissues; includes yeasts,moulds, smuts and mushrooms. Much <strong>of</strong> theorganism can occur underground.Groundwater: water in the soil and underlyinggeological strata.Habitat: the natural environment in which anorganism normally lives.Index value: a number derived from a formula,used to characterize a set <strong>of</strong> data.Invasive alien species: alien species thatthreaten biodiversity due to their ability tospread and out-compete or otherwise impactnative species or dominate ecosystems.Invertebrate: an animal without a backbone.Krummholz: a stunted forest characteristic <strong>of</strong>the timberline.Large woody debris [LWD]: large pieces<strong>of</strong> wood, generally greater than 10 cmin diameter, in an aquatic environment,including sound or rotting logs, stumps andlarge branches that have fallen or been cut;when found on or near the forest floor thismaterial is called coarse woody debris (CWD).Lichen: an organism consisting <strong>of</strong> an outerfungal body enclosing photosynthetic algaeor cyanobacteria.Limnetic: <strong>of</strong>, or pertaining to, the deeper, openwaters <strong>of</strong> a lake.Liverwort: any <strong>of</strong> a class (Hepaticae) <strong>of</strong>bryophytic plants characterized by a thalloidgametophyte or sometimes an upright leafygametophyte.Magnitude (in hydrology): the volume <strong>of</strong> waterin a stream or river.Mainstem: the main channel <strong>of</strong> a river orstream.Migration: movement from one place <strong>of</strong>residence to another on a regular basis.Monocot [monocotyledon]: a flowering,vascular plant that has a single cotyledon(primary embryonic leaf) in its seed (e.g.,grass, sedge, rush, etc.).Native species: a species that naturally occursin an area as a result <strong>of</strong> its own movements(unaided by direct human actions allowing itto move past a natural barrier).Non-vascular plant: a plant without specializedtissues for conducting water and nutrients(e.g., algae, mosses, fungi, lichen).Nutrient cycling: circulation or exchange<strong>of</strong> elements, such as nitrogen and carbondioxide, between non-living and living parts<strong>of</strong> the environment.Parkland: the ecotone between a forestedenvironment and an open environment suchas alpine or grassland.Peak discharge (in hydrology): river base flowincrease, due to rain input, to its highest level.Photosynthesis: the conversion <strong>of</strong> light energyinto chemical energy by living organisms.Photosynthesize: to perform the process <strong>of</strong>photosynthesis (i.e., using sunlight, CO 2andwater to form carbohydrates).Pollination: the process in which pollen istransferred from an anther <strong>of</strong> male plant to areceptive stigma <strong>of</strong> a female plant.
126 the biodiversity atlas <strong>of</strong> british columbiaPopulation: a group <strong>of</strong> individuals withcommon ancestry that are much morelikely to mate with one another than withindividuals from another such group.Predator-prey system: a system involvinginteractions between predators and theirprey.Recharge time (in hydrology): the time takento replenish groundwater.Riparian: a zone <strong>of</strong> transition between anaquatic and a terrestrial system, dependentupon surface or sometimes subsurfacewater. Riparian areas may be located adjacentto lakes, estuaries, rivers, or ephemeral,intermittent or perennial streams.Seral: the series <strong>of</strong> plant community conditionsthat develop during ecological successionfrom bare ground (primary succession) (ormajor disturbances-secondary succession)to the climax stage. Three main stages aretypically recognized in a forest context: earlyseral,mid-seral and late-seral.Special elements: elements <strong>of</strong> biodiversitythat are <strong>of</strong> global or regional significanceeither because they are important habitatfor seasonal concentrations <strong>of</strong> species orbecause they are uncommon or even uniqueon a global or regional scale owing to theirunusual ecological characteristics.Species: in most living organisms, a speciesgenerally represents a complete, selfgenerating,unique ensemble <strong>of</strong> geneticvariation, capable <strong>of</strong> interbreeding andproducing fertile <strong>of</strong>fspring.Species richness: the number <strong>of</strong> species withina specified area.Stream order: first order streams are those withno tributaries; two first order streams jointo make a second order stream; two secondorder streams join to make a third-orderstream, etc. See also third-order watershed.Stresses: impaired aspects <strong>of</strong> biodiversity thatresult directly or indirectly from humanactivities. See also Threats.Subspecies: a geographically defined aggregate<strong>of</strong> local populations that differs from othersuch subdivisions <strong>of</strong> a species.Taxon [pl. taxa]: any one <strong>of</strong> the categories usedin naming and classifying organisms (e.g.,phylum, class, order, family, genus, species,subspecies, variety).Taxonomic group: a group <strong>of</strong> organisms atthe same level <strong>of</strong> organization in biologicalclassification.Third-order watershed: a watershed is thearea drained by a river or stream, or a riversystem. First order streams are those withno tributaries; two first order streams jointo make a second order stream, two secondorder streams join to make a third-orderstream. A third-order watershed as mappedby Watersheds <strong>BC</strong> is a composite <strong>of</strong> thirdorder streams and above.Threats: the proximate (human) activities orprocesses that have caused, are causing, ormay cause the destruction, degradation and/or impairment <strong>of</strong> biodiversity and naturalprocesses.Topography: the shape <strong>of</strong> the surface <strong>of</strong> theearth.Transpiration: the evaporation <strong>of</strong> water fromthe aerial parts <strong>of</strong> plants, especially theleaves, but also stems, flowers and roots.Ungulate: a ho<strong>of</strong>ed mammal such as an elk ordeer.Variety [pl. varieties]: one <strong>of</strong> the categoriesused in naming and classifying organisms(e.g., phylum, class, order, family, genus,species, subspecies, variety). see Taxon.Vascular plant: a plant with specialized tissuesfor conducting water and nutrients (e.g., tree,shrub, grass, etc.).Vertebrate: an animal with a backbone (e.g.,mammal, bird, reptile, amphibian, fish).
the biodiversity atlas <strong>of</strong> british columbia12Notes1 Environment Canada. No date. Canadian<strong>Biodiversity</strong> Strategy website. Available at: www.eman-rese.ca/eman/reports/publications/rt_biostrat/intro.html.2 Warman, L. and G.G.E. Scudder. 2007. SpeciesRichness and Summed Irreplaceability in B.C.<strong>Biodiversity</strong> <strong>BC</strong>, Victoria, <strong>BC</strong>. Available at: www.biodiversitybc.org.3 B.C. Ministry <strong>of</strong> Environment. No date.Ecoregions <strong>of</strong> <strong>British</strong> <strong>Columbia</strong>. Availableat: www.env.gov.bc.ca/ecology/ecoregions/ecoclass.html.4 B.C. Ministry <strong>of</strong> Forests and Range. No date.Biogeoclimatic Ecosystem ClassificationProgram. Available at: www.for.gov.bc.ca/hre/becweb.5 B.C. Ministry <strong>of</strong> Environment. No date. 1:50,000<strong>BC</strong> Watershed <strong>Atlas</strong>: Freshwater. Available at:www.env.gov.bc.ca/fish/watershed_atlas_maps/index.html.6 Strahler, A.N. 1957. Quantitative analysis forwatershed geomorphology. Transactions –American Geophysical Union 38: 913-920.7 Hectares<strong>BC</strong> application. Available at: www.hectaresbc.org.8 <strong>The</strong> <strong>Atlas</strong> <strong>of</strong> Canada. No date. Government <strong>of</strong>Canada, Natural Resources Canada, CanadaCentre for Remote Sensing, GeoAccess Division.Available at: atlas.nrcan.gc.ca/sites/english/dataservices/free_data.html#canada.9 B.C. Integrated Land Management Bureau.No date. Baseline <strong>The</strong>matic Mapping website.Available at: ilmbwww.gov.bc.ca/cis/initiatives/ias/btm/index.html.10 B.C. Integrated Land Management Bureau.No date. Terrain Resources InformationManagement Mapping website. Available at:ilmbwww.gov.bc.ca/bmgs/products/mapdata/trim_enhanced_map.htm.11 Meidinger, D. and J. Pojar. 1991. Ecosystems<strong>of</strong> <strong>British</strong> <strong>Columbia</strong>. B.C. Ministry <strong>of</strong> Forests,Research Branch, Victoria, B.C. Special ReportSeries No.6. 330pp. Available at: www.for.gov.bc.ca/hfd/pubs/Docs/Srs/Srs06.htm12 B.C. Integrated Land Management Bureau. Nodate. Marine Planning Office. Integrated LandManagement Bureau, Victoria, <strong>BC</strong>. Available at:ilmbwww.gov.bc.ca/slrp/marine/index.html.13 Meidinger, D. and J. Pojar. 1991. Ecosystems<strong>of</strong> <strong>British</strong> <strong>Columbia</strong>. B.C. Ministry <strong>of</strong> Forests,Research Branch, Victoria, B.C. Special ReportSeries No.6. 330pp. Available at: www.for.gov.bc.ca/hfd/pubs/Docs/Srs/Srs06.htm14 T. Button, B.C. Ministry <strong>of</strong> Environment,personal communication.15 Kremsater, L. 2007. Draft S Ranks and SurrogateG Ranks for BEC Zones and Draft S Ranks forEcoprovinces and Major Drainage Units <strong>of</strong>B.C.: Preliminary Rankings for Informing the<strong>Biodiversity</strong> Status Report and Action Plan.<strong>Biodiversity</strong> <strong>BC</strong>, Victoria, <strong>BC</strong>. 64pp. Available at:www.biodiversitybc.org.16 Grassland Conservation Council <strong>of</strong> <strong>British</strong><strong>Columbia</strong>. Available at: www.bcgrasslands.org.17 B.C. Ministry <strong>of</strong> Sustainable ResourceManagement and Ministry <strong>of</strong> Water, Land andAir Protection. 2004. Ecosystems At Risk in<strong>British</strong> <strong>Columbia</strong>: Grasslands <strong>of</strong> the SouthernInterior. Brochure. 6pp. Available at: www.env.gov.bc.ca/wld/documents/grasslands_si.pdf.18 Wetland dependent species and subspecies ascompiled by D. Buffett, Ducks Unlimited Canadafrom B.C. Conservation Data Centre. 2008. B.C.Species and Ecosystems Explorer: Red and BluelistedSpecies and Subspecies. Available at: www.env.gov.bc.ca/atrisk/toolintro.html.19 Clark, D.A., S. Brown, D.W. Kicklighter, J.Q.Chambers, J.R. Thomlinson, J. Ni and E.A.Holland. 2001. Net primary production in tropicalforests: an evaluation and synthesis <strong>of</strong> existingfield data. Ecological Applications 11(2): 371–384.20 Leith, H. and Whittaker, R.H. 1975. PrimaryProductivity <strong>of</strong> the Biosphere. New York:Springer-Verlag.21 Gillman, L.N. and S.D. Wright. 2006. <strong>The</strong>influence <strong>of</strong> productivity on the species richness<strong>of</strong> plants: a critical assessment. Ecology 87(5):1234-1243.22 Clark, D.A., S. Brown, D.W. Kicklighter, J.Q.Chambers, J.R. Thomlinson, J. Ni and E.A.Holland. 2001. Net primary production intropical forests: an evaluation and synthesis <strong>of</strong>existing field data. Ecological Applications 11(2):371–384.23 Cao, M. and F.I. Woodward. 1998. Dynamicresponses <strong>of</strong> terrestrial ecosystem carboncycling to global climate change. Nature 393:249-252.24 Spittlehouse, D. 2008. Climate change andimplications for Douglas-fir. Research Branch,B.C. Ministry <strong>of</strong> Forests and Range, Victoria, <strong>BC</strong>.Available at: soilslab.cfr.washington.edu/nwfsc/NWFSC-08Winter/7Spittlehouse.pdf.25 Melillo, J.M., A.D. McGuire, D.W. Kicklighter,B. Moore, C.J. Vorosmarty and A.L. Schloss.1993. Global climate change and terrestrial netprimary production. Nature 363: 234-240.26 Kurz, W.A., C. C. Dymond, G. Stinson, G. J.Rampley, E. T. Neilson, A. L. Carroll, T. Ebataand L. Safranyik. 2008. Mountain pine beetleand forest carbon feedback to climate change.Nature 452: 987-990.27 Del Grosso, S., W. Parton, T. Stohlgren, D. Zheng,D. Bachelet, S. Prince, K. Hibbard and R. Olson.2008. Global potential net primary productionpredicted from vegetation class, precipitation,and temperature. Ecology 89 (8): 2117-2126.28 B.C. Ministry <strong>of</strong> Environment. No date.Ecoregions <strong>of</strong> <strong>British</strong> <strong>Columbia</strong>. Availableat: www.env.gov.bc.ca/ecology/ecoregions/ecoclass.html.
128 the biodiversity atlas <strong>of</strong> british columbia29 B.C. Ministry <strong>of</strong> Forests and Range. No date.Biogeoclimatic Ecosystem ClassificationProgram. Available at: www.for.gov.bc.ca/hre/becweb.30 Kremsater, L. 2007. Draft S Ranks and SurrogateG Ranks for BEC Zones and Draft S Ranks forEcoprovinces and Major Drainage Units <strong>of</strong>B.C.: Preliminary Rankings for Informing the<strong>Biodiversity</strong> Status Report and Action Plan.<strong>Biodiversity</strong> <strong>BC</strong>, Victoria, <strong>BC</strong>. 64pp. Available at:www.biodiversitybc.org.31 Hamann, A. and T. Wong. 2006. Potentialeffects <strong>of</strong> climate change on ecosystems andtree species distribution in <strong>British</strong> <strong>Columbia</strong>.Ecology 87(11): 2733-2786.32 Kremsater, L. 2007. Draft S Ranks and SurrogateG Ranks for BEC Zones and Draft S Ranks forEcoprovinces and Major Drainage Units <strong>of</strong>B.C.: Preliminary Rankings for Informing the<strong>Biodiversity</strong> Status Report and Action Plan.<strong>Biodiversity</strong> <strong>BC</strong>, Victoria, <strong>BC</strong>. 64pp. Available at:www.biodiversitybc.org.33 Austin, M.A., D.A. Buffett, D.J. Nicolson, G.G.E.Scudder and V. Stevens (eds.). 2008. TakingNature’s Pulse: <strong>The</strong> Status <strong>of</strong> <strong>Biodiversity</strong> in<strong>British</strong> <strong>Columbia</strong>: Section 2.2.1.3, p. 37. Availableat: www.biodiversitybc.org.34 B.C. Conservation Date Centre. 2007. <strong>BC</strong> Speciesand Ecosystems Explorer. Available at: www.env.gov.bc.ca/atrisk/toolintro.html.35 C. Cadrin, B.C. Ministry <strong>of</strong> Environment,personal communication.36 W. MacKenzie, B.C. Ministry <strong>of</strong> Forests andRange, personal communication.37 Erwin, C. 2008. Ecosystem Mapping Issues. Draftinterim summary document, 2008 Aug 21. <strong>BC</strong>Ministry <strong>of</strong> Environment, Ecosystems Branch,Victoria, B.C.38 D. Clark, B.C. Ministry <strong>of</strong> Environment, personalcommunication.39 Ibid.40 B.C. Ministry <strong>of</strong> Environment. 2006. Standardfor Mapping Ecosystems at Risk in <strong>British</strong><strong>Columbia</strong>: An Approach to Mapping Ecosystemsat Risk and other Sensitive Ecosystems., v.1.0Resources Information Standards Committee.Victoria, B.C. 88pp. Available at: ilmbwww.gov.bc.ca/risc/pubs/teecolo/habitat/assets/standards_for_mapping_ear_version1.pdf.41 Ciruna, K.A., B. Butterfield, J.D. McPhail andB.C. Ministry <strong>of</strong> Environment. 2007. EAU <strong>BC</strong>:Ecological Aquatic Units for <strong>British</strong> <strong>Columbia</strong>.Nature Conservancy <strong>of</strong> Canada, Toronto. ON,200pp. plus DVD-ROM.42 McAllister, D.E., A.L. Hamilton and B. Harvey.1997. Global freshwater biodiversity: Striving forthe integrity <strong>of</strong> freshwater ecosystems. Sea Wind11(3):1-140.43 Environment Canada. No date. <strong>The</strong> world’swater supply. Available at: www.ec.gc.ca/Water/images/nature/prop/a2f1e.htm.44 B.C. Ministry <strong>of</strong> Water, Land and Air Protection.2002. Status and Trends in Surface Water Quality.In Environmental Trends in <strong>British</strong> <strong>Columbia</strong>2002. State <strong>of</strong> Environment Reporting Office,Victoria, <strong>BC</strong>. Available at: www.env.gov.bc.ca/soerpt/6surfacewater/quality.html.45 Environment Canada. 2004. A primer and freshwater: questions and answers. 5 th ed.46 Austin, M.A., D.A. Buffett, D.J. Nicolson, G.G.E.Scudder and V. Stevens (eds.). 2008. TakingNature’s Pulse: <strong>The</strong> Status <strong>of</strong> <strong>Biodiversity</strong> in<strong>British</strong> <strong>Columbia</strong>: Section 2.3.2.1, p. 59. Availableat: www.biodiversitybc.org.47 Water Management Branch. 1988. <strong>The</strong> Guide tothe Hierarchical Watershed Coding System for<strong>British</strong> <strong>Columbia</strong>. B.C Ministry <strong>of</strong> Environmentand Parks. Victoria, B.C. 33pp.48 IUCN World Commission on Protected Areas.No date. Available at: www.iucn.org.49 Parks Canada. No date. National Parks <strong>of</strong>Canada. Available at: www.pc.gc.ca/progs/nppn/index_e.asp.50 Government <strong>of</strong> Canada. 2000. Canada NationalParks Act (2000,c32). Available at: http://laws.justice.gc.ca/en/showtdm/cs/N-14.01.51 Province <strong>of</strong> <strong>British</strong> <strong>Columbia</strong>. 1996. EcologicalReserve Act. Bill 1996-103. Available at: www.bclaws.ca/Recon/document/freeside/--E--/Ecological Reserve Act RS<strong>BC</strong> 1996 c.103/00_96103_01.xml?siteId=freeside&docId=00_96103_01.52 Province <strong>of</strong> <strong>British</strong> <strong>Columbia</strong>. 1996.Environment and Land Use Act. Bill 1996-117.Available at: www.bclaws.ca/Recon/document/freeside/-- E --/Environment and Land Use ActRS<strong>BC</strong> 1996 c. 117/00_96117_01.xml?siteId=freeside&docId=00_96117_01.53 Province <strong>of</strong> <strong>British</strong> <strong>Columbia</strong>. 1996. Park Act. Bill1996-344. Available at: www.bclaws.ca/Recon/document/freeside/-- --/17_Park Act RS<strong>BC</strong>1996 c. 344/00_96344_01.xml?siteId=freeside&docId=00_96344_01.54 Province <strong>of</strong> <strong>British</strong> <strong>Columbia</strong>. 2000. Protected Areas<strong>of</strong> <strong>British</strong> <strong>Columbia</strong> Act. Bill 2000-17. Available at:www.bclaws.ca/Recon/document/freeside/-- P --/Protected Areas <strong>of</strong> <strong>British</strong> <strong>Columbia</strong> Act S<strong>BC</strong> 2000c. 17/00_Act/00017_00.htm.55 Province <strong>of</strong> <strong>British</strong> <strong>Columbia</strong>. 1996. WildlifeAct. Bill 1996-488. Available at: www.bclaws.ca/Recon/document/freeside/-- W --/Wildlife ActRS<strong>BC</strong> 1996 c. 488/00_96488_01.xml?siteId=freeside&docId=00_96488_01.56 Environment Canada. No date. WildlifeManagement Areas. Available at: http://www.pnr-rpn.ec.gc.ca/nature/whp/nwa/df06s00.en.html .57 Environment Canada. No date. Migratory BirdSanctuaries. Available at: http://www.pnr-rpn.ec.gc.ca/nature/whp/sanctuaries/dc01s00.en.htm .58 Canadian Endangered Species ConservationCouncil. 2006. Wild Species 2005: <strong>The</strong> GeneralStatus <strong>of</strong> Species in Canada. Minister <strong>of</strong> PublicWorks and Government Services Canada.Ottawa ON.
the biodiversity atlas <strong>of</strong> british columbia1259 Cannings, R. and S. Cannings. 1996. <strong>British</strong><strong>Columbia</strong>: A Natural History. Greystone Books,Vancouver, <strong>BC</strong>. 310pp.60 Asquith, A., J.D. Lattin and A.R. Moldenke. 1990.Arthropods: the invisible diversity. NorthwestEnvironmental Journal 6:404-405.61 Fred Bunnell, University <strong>of</strong> <strong>British</strong> <strong>Columbia</strong>,personal communication.62 Austin, M.A., D.A. Buffett, D.J. Nicolson, G.G.E.Scudder and V. Stevens (eds.). 2008. TakingNature’s Pulse: <strong>The</strong> Status <strong>of</strong> <strong>Biodiversity</strong> in<strong>British</strong> <strong>Columbia</strong>. <strong>Biodiversity</strong> <strong>BC</strong>, Victoria, B.C.Available at: www.biodiversitybc.org.63 Kremsater, L. 2007. Draft S Ranks and SurrogateG Ranks for BEC Zones and Draft S Ranks forEcoprovinces and Major Drainage Units <strong>of</strong>B.C.: Preliminary Rankings for Informing the<strong>Biodiversity</strong> Status Report and Action Plan.<strong>Biodiversity</strong> <strong>BC</strong>, Victoria, <strong>BC</strong>. Section 2.2.2.1, 34.Available at: www.biodiversitybc.org.64 Anions, M. 2006. Global and Provincial Status<strong>of</strong> Species in <strong>British</strong> <strong>Columbia</strong>: 2007 Update.<strong>Biodiversity</strong> <strong>BC</strong>, Victoria, B.C. 16pp. Available at:www.biodiversitybc.org.65 Cannings, S., M. Anions, R. Rainer and B. Stein.2005. Our Home and Native Land: CanadianSpecies <strong>of</strong> Global Conservation Concern.NatureServe Canada. 39pp.66 Austin, M.A., D.A. Buffett, D.J. Nicolson, G.G.E.Scudder and V. Stevens (eds.). 2008. TakingNature’s Pulse: <strong>The</strong> Status <strong>of</strong> <strong>Biodiversity</strong> in<strong>British</strong> <strong>Columbia</strong>: Section 3.2.1, p. 160. Availableat: www.biodiversitybc.org.67 Anions, M. 2006. Global and Provincial Status<strong>of</strong> Species in <strong>British</strong> <strong>Columbia</strong>: 2007 Update.<strong>Biodiversity</strong> <strong>BC</strong>, Victoria, B.C. 16pp. Available at:www.biodiversitybc.org.68 Lea, T. 2006. Historical Garry oak ecosystems<strong>of</strong> Vancouver Island, <strong>British</strong> <strong>Columbia</strong>, pre-European contact to the present. Davidsonia17(2): 34-35. Available at: www.davidsonia.org/bc_garryoak.69 Garry Oak Ecosystem Recovery Team. 2004.Brochure. Available at: www.goert.ca/documents/GOERTbroch_Jan6-2004.pdf.70 Erickson, W. 1993. Ecosystems at Risk in <strong>British</strong><strong>Columbia</strong>: Garry Oak Ecosystems. B.C. Ministry<strong>of</strong> Environment. Lands and Parks, WildlifeBranch, Victoria, <strong>BC</strong>. 6pp. Available at: wlapwww.gov.bc.ca/wld/documents/garryoak.pdf.71 Bunnell, F., L. Kremsater and I. Houde.2006. Applying the Concept <strong>of</strong> StewardshipResponsibility in <strong>British</strong> <strong>Columbia</strong>: 2007 Update.<strong>Biodiversity</strong> <strong>BC</strong>, Victoria, <strong>BC</strong>. 188p. Available at:www.biodiversitybc.org.72 Ibid.73 B.C. Conservation Data Centre. 2008. B.C.Species and Ecosystems Explorer – Amphibians.Available at: a100.gov.bc.ca/pub/eswp/search.do.74 Cannings, S., M. Anions, R. Rainer and B. Stein.2005. Our Home and Native Land: CanadianSpecies <strong>of</strong> Global Conservation Concern.NatureServe Canada. 39pp.75 Bunnell, F., L. Kremsater and I. Houde.2006. Applying the Concept <strong>of</strong> StewardshipResponsibility in <strong>British</strong> <strong>Columbia</strong>: 2007 Update.<strong>Biodiversity</strong> <strong>BC</strong>, Victoria, <strong>BC</strong>. 188p. Available at:www.biodiversitybc.org.76 Bunnell, F., L. Kremsater and I. Houde.2006. Applying the Concept <strong>of</strong> StewardshipResponsibility in <strong>British</strong> <strong>Columbia</strong>: 2007 Update.<strong>Biodiversity</strong> <strong>BC</strong>, Victoria, <strong>BC</strong>. 188p. Available at:www.biodiversitybc.org.77 B.C. Conservation Data Centre. 2008. B.C. Speciesand Ecosystems Explorer – Birds. Available at:a100.gov.bc.ca/pub/eswp/search.do.78 Christmas Bird Count. Managed by theAudubon Society and the Cornell Laboratory <strong>of</strong>Ornithology. Available at: www.birdsource.org.79 Breeding Bird Survey. Coordinated by theCanadian Wildlife Federation. Available at:www.cwf-fcf.org/pages/wildresources/surveys/survey07.htm80 McPhail, D. 2007. Freshwater fishes <strong>of</strong> <strong>British</strong><strong>Columbia</strong>. University <strong>of</strong> Alberta Press. 624pp.81 Don McPhail, University <strong>of</strong> <strong>British</strong> <strong>Columbia</strong>,personal communication.82 Anions, M. 2006. Global and Provincial Status<strong>of</strong> Species in <strong>British</strong> <strong>Columbia</strong>: 2007 Update.<strong>Biodiversity</strong> <strong>BC</strong>, Victoria, B.C. 16pp. Available at:www.biodiversitybc.org.83 Bunnell, F., L. Kremsater and I. Houde.2006. Applying the Concept <strong>of</strong> StewardshipResponsibility in <strong>British</strong> <strong>Columbia</strong>: 2007 Update.<strong>Biodiversity</strong> <strong>BC</strong>, Victoria, <strong>BC</strong>. 188p. Available at:www.biodiversitybc.org.84 Anions, M. 2006. Global and Provincial Status<strong>of</strong> Species in <strong>British</strong> <strong>Columbia</strong>: 2007 Update.<strong>Biodiversity</strong> <strong>BC</strong>, Victoria, B.C. 16pp. Available at:www.biodiversitybc.org.85 IUCN Red List. 2008. Website. Summarystatistics for globally threatened species: Table1. Available at: http://www.iucnredlist.org/documents/2008RL_stats_table_1_v1223294385.pdf86 B.C. Conservation Data Centre. 2008. B.C. Speciesand Ecosystems Explorer – Mammals. Availableat: a100.gov.bc.ca/pub/eswp/search.do.87 Austin, M.A., D.A. Buffett, D.J. Nicolson, G.G.E.Scudder and V. Stevens (eds.). 2008. TakingNature’s Pulse: <strong>The</strong> Status <strong>of</strong> <strong>Biodiversity</strong>in <strong>British</strong> <strong>Columbia</strong>: Section 2.5.1.2, p. 100.Available at: www.biodiversitybc.org.88 Anions, M. 2006. Global and Provincial Status<strong>of</strong> Species in <strong>British</strong> <strong>Columbia</strong>: 2007 Update.<strong>Biodiversity</strong> <strong>BC</strong>, Victoria, B.C. 16pp. Available at:www.biodiversitybc.org.89 Bunnell, F., L. Kremsater and I. Houde.2006. Applying the Concept <strong>of</strong> StewardshipResponsibility in <strong>British</strong> <strong>Columbia</strong>: 2007 Update.<strong>Biodiversity</strong> <strong>BC</strong>, Victoria, <strong>BC</strong>. 188p. Available at:www.biodiversitybc.org.90 Anions, M. 2006. Global and Provincial Status<strong>of</strong> Species in <strong>British</strong> <strong>Columbia</strong>: 2007 Update.<strong>Biodiversity</strong> <strong>BC</strong>, Victoria, B.C. 16pp. Available at:www.biodiversitybc.org.
10the biodiversity atlas <strong>of</strong> british columbia91 Gregory , P. and R.W. Campbell. 1984. <strong>The</strong>Reptiles <strong>of</strong> <strong>British</strong> <strong>Columbia</strong>. Royal <strong>British</strong><strong>Columbia</strong> Museum Handbook, Victoria, B.C.102pp.92 B.C. Conservation Data Centre. 2008. B.C.Species and Ecosystems Explorer – Reptiles.Available at: a100.gov.bc.ca/pub/eswp/search.do.93 Cannings, S., M. Anions, R. Rainer and B. Stein.2005. Our Home and Native Land: CanadianSpecies <strong>of</strong> Global Conservation Concern.NatureServe Canada. 39pp.94 Haggard, P. and J. Haggard. 2006. Insects <strong>of</strong> thePacific Northwest. Timber Press Field Guide.Timber Press, Portland, Oregon. 295pp.95 Government <strong>of</strong> Canada. 2007 website.<strong>The</strong> Ground Beetles <strong>of</strong> Canada. Canadian<strong>Biodiversity</strong> Information Facility. Available at:www.cbif.gc.ca/spp_pages/carabids/phps/index_e.php#introduction.96 Haggard, P. and J. Haggard. 2006. Insects <strong>of</strong> thePacific Northwest. Timber Press Field Guide.Timber Press, Portland, Oregon. 295pp.97 B.C. Conservation Data Centre. 2008. B.C. Speciesand Ecosystems Explorer – Butterflies. Availableat: a100.gov.bc.ca/pub/eswp/search.do.98 Bunnell, F., L. Kremsater and I. Houde.2006. Applying the Concept <strong>of</strong> StewardshipResponsibility in <strong>British</strong> <strong>Columbia</strong>: 2007 Update.<strong>Biodiversity</strong> <strong>BC</strong>, Victoria, <strong>BC</strong>. 188p. Available at:www.biodiversitybc.org.99 Haggard, P. and J. Haggard. 2006. Insects <strong>of</strong> thePacific Northwest. Timber Press Field Guide.Timber Press, Portland, Oregon. 295pp.100 B.C. Conservation Data Centre. 2008. B.C.Species and Ecosystems Explorer – Dragonflies/Damselflies. Available at: a100.gov.bc.ca/pub/eswp/search.do.101 Bunnell, F., L. Kremsater and I. Houde.2006. Applying the Concept <strong>of</strong> StewardshipResponsibility in <strong>British</strong> <strong>Columbia</strong>: 2007 Update.<strong>Biodiversity</strong> <strong>BC</strong>, Victoria, <strong>BC</strong>. 188p. Available at:www.biodiversitybc.org.102 Anions, M. 2006. Global and Provincial Status<strong>of</strong> Species in <strong>British</strong> <strong>Columbia</strong>: 2007 Update.<strong>Biodiversity</strong> <strong>BC</strong>, Victoria, B.C. 16pp. Available at:www.biodiversitybc.org.103 Smithsonian Museum <strong>of</strong> Natural History. Nodate. <strong>The</strong> World <strong>of</strong> Copepods. Available at: www.nmnh.si.edu/iz/copepod.104 Wilson, M.S. and Yeatman, H.C. 1959. Free-livingCopepods. Pp. 735-861 In Edmonson, W.T. (ed.)Ward & Whipple Freshwater Biology, 2 nd edition,John Wiley & Sons, Inc., New York.105 Holt, R. 2007. Special Elements <strong>of</strong> <strong>Biodiversity</strong> in<strong>British</strong> <strong>Columbia</strong>. <strong>Biodiversity</strong> <strong>BC</strong>. Victoria, <strong>BC</strong>.30pp. Available at: www.biodiversitybc.org.106 Anions, M. 2006. Global and Provincial Status<strong>of</strong> Species in <strong>British</strong> <strong>Columbia</strong>: 2007 Update.<strong>Biodiversity</strong> <strong>BC</strong>, Victoria, B.C. 16pp. Available at:www.biodiversitybc.org.107 B.C. Conservation Data Centre. 2008. B.C.Species and Ecosystems Explorer – Vascularplants. Available at: a100.gov.bc.ca/pub/eswp/search.do.108 Bunnell, F., L. Kremsater and I. Houde.2006. Applying the Concept <strong>of</strong> StewardshipResponsibility in <strong>British</strong> <strong>Columbia</strong>: 2007 Update.<strong>Biodiversity</strong> <strong>BC</strong>, Victoria, <strong>BC</strong>. 188p. Available at:www.biodiversitybc.org.109 Anions, M. 2006. Global and Provincial Status<strong>of</strong> Species in <strong>British</strong> <strong>Columbia</strong>: 2007 Update.<strong>Biodiversity</strong> <strong>BC</strong>, Victoria, B.C. 16pp. Available at:www.biodiversitybc.org.110 Bunnell, F., L. Kremsater and I. Houde.2006. Applying the Concept <strong>of</strong> StewardshipResponsibility in <strong>British</strong> <strong>Columbia</strong>: 2007 Update.<strong>Biodiversity</strong> <strong>BC</strong>, Victoria, <strong>BC</strong>. 188p. Available at:www.biodiversitybc.org.111 Ibid.112 Anions, M. 2006. Global and Provincial Status<strong>of</strong> Species in <strong>British</strong> <strong>Columbia</strong>: 2007 Update.<strong>Biodiversity</strong> <strong>BC</strong>, Victoria, B.C. 16pp. Available at:www.biodiversitybc.org.113 Bunnell, F., L. Kremsater and I. Houde.2006. Applying the Concept <strong>of</strong> StewardshipResponsibility in <strong>British</strong> <strong>Columbia</strong>: 2007 Update.<strong>Biodiversity</strong> <strong>BC</strong>, Victoria, <strong>BC</strong>. 188p. Available at:www.biodiversitybc.org.114 Pojar, J. and A. MacKinnon (eds.). 1994. Plants <strong>of</strong>Coastal <strong>British</strong> <strong>Columbia</strong> including Washington,Oregon and Alaska. B.C. Ministry <strong>of</strong> Forests andLone Pine Publishing. 528pp.115 B.C. Conservation Data Centre. 2008. B.C.Species and Ecosystems Explorer – Mosses.Available at: a100.gov.bc.ca/pub/eswp/search.do.116 Anions, M. 2006. Global and Provincial Status<strong>of</strong> Species in <strong>British</strong> <strong>Columbia</strong>: 2007 Update.<strong>Biodiversity</strong> <strong>BC</strong>, Victoria, B.C. 16pp. Available at:www.biodiversitybc.org.117 Bunnell, F., L. Kremsater and I. Houde.2006. Applying the Concept <strong>of</strong> StewardshipResponsibility in <strong>British</strong> <strong>Columbia</strong>: 2007 Update.<strong>Biodiversity</strong> <strong>BC</strong>, Victoria, <strong>BC</strong>. 188p. Available at:www.biodiversitybc.org.118 Dr. G.G.E. Scudder, <strong>The</strong> Nature Trust <strong>of</strong> <strong>British</strong><strong>Columbia</strong>, personal communication.119 Pojar, J. and A. MacKinnon (eds.). 1994. Plants <strong>of</strong>Coastal <strong>British</strong> <strong>Columbia</strong> including Washington,Oregon and Alaska. B.C. Ministry <strong>of</strong> Forests andLone Pine Publishing. 528pp.120 Rhoades, F.M. 1995. Nonvascular epiphytesin forest canopies: worldwide distribution,abundance and ecological roles. Pp. 353-408. InM.D. Lowman, M.D. and N. M. Nadkarni (eds.).Forest Canopies. Academic Press, San Diego, CA.121 B.C. Ministry <strong>of</strong> Environment, Lands and Parks.2000. Caribou in <strong>British</strong> <strong>Columbia</strong>: Ecology,Conservation and Management. Province <strong>of</strong><strong>British</strong> <strong>Columbia</strong>. Available at: www.env.gov.bc.ca/wld/documents/caribou_fs.pdf.122 Warman, L. and G.G.E. Scudder. 2007. SpeciesRichness and Summed Irreplaceability in B.C.<strong>Biodiversity</strong> <strong>BC</strong>, Victoria, <strong>BC</strong>. Available at: www.biodiversitybc.org.123 Holt, R. 2007. Special Elements <strong>of</strong> <strong>Biodiversity</strong> in<strong>British</strong> <strong>Columbia</strong>. <strong>Biodiversity</strong> <strong>BC</strong>. Victoria, <strong>BC</strong>.30pp. Available at: www.biodiversitybc.org.124 Ibid.125 Anions, M. 2006. Global and Provincial Status<strong>of</strong> Species in <strong>British</strong> <strong>Columbia</strong>: 2007 Update.<strong>Biodiversity</strong> <strong>BC</strong>, Victoria, B.C. 16pp. Available at:www.biodiversitybc.org.
the biodiversity atlas <strong>of</strong> british columbia11126 Kremsater, L. 2007. Draft S Ranks and SurrogateG Ranks for BEC Zones and Draft S Ranks forEcoprovinces and Major Drainage Units <strong>of</strong>B.C.: Preliminary Rankings for Informing the<strong>Biodiversity</strong> Status Report and Action Plan.<strong>Biodiversity</strong> <strong>BC</strong>, Victoria, <strong>BC</strong>. 64pp. Available at:www.biodiversitybc.org.127 Austin, M.A., D.A. Buffett, D.J. Nicolson, G.G.E.Scudder and V. Stevens (eds.). 2008. TakingNature’s Pulse: <strong>The</strong> Status <strong>of</strong> <strong>Biodiversity</strong> in<strong>British</strong> <strong>Columbia</strong>: Section 3.2, p. 156. Availableat: www.biodiversitybc.org.128 Long, G. 2007. <strong>Biodiversity</strong> Safety Net GapAnalysis <strong>Biodiversity</strong> <strong>BC</strong>, Victoria, <strong>BC</strong>. 66pp.Available at: www.biodiversitybc.org.129 Holt, R.F., G. Utzig, M. Carver and J. Booth.2003. <strong>Biodiversity</strong> Conservation in B.C. : AnAssessment <strong>of</strong> Threats and Gaps. VeridianEcological Consulting. South Slocan, B.C.130 Noss, R.F. and R.L. Peters. 1995. EndangeredEcosystems: A Status Report on America’sVanishing Habitat and Wildlife. Defenders <strong>of</strong>Wildlife, Washington, DC.131 Murdock, T.Q., A.T. Werner and D. Bronaugh.2007. Preliminary Analysis <strong>of</strong> <strong>BC</strong> Climate Trendsfor <strong>Biodiversity</strong>. <strong>Biodiversity</strong> <strong>BC</strong>, Victoria, <strong>BC</strong>.24pp. Available at: www.biodiversitybc.org.132 Compass Resource Management. 2007.Major Impacts: Climate Change. <strong>Biodiversity</strong><strong>BC</strong>, Victoria, <strong>BC</strong>. 41pp. Available at: www.biodiversitybc.org.133 B.C. Stats. 2007. <strong>British</strong> <strong>Columbia</strong> Population1867 to 2008. Available at: www.bcstats.gov.bc.ca/DATA/pop/pop/bc1867on.csv.134 Gayton, D. 2007. Major impacts to <strong>Biodiversity</strong>in <strong>British</strong> <strong>Columbia</strong> (excluding climate change).<strong>Biodiversity</strong> <strong>BC</strong>, Victoria, <strong>BC</strong>. 28pp. Available at:www.biodiversitybc.org.135 Long, G. 2007. <strong>Biodiversity</strong> Safety Net GapAnalysis <strong>Biodiversity</strong> <strong>BC</strong>, Victoria, <strong>BC</strong>. 66pp.Available at: www.biodiversitybc.org.136 Kremsater, L. 2007. Draft S Ranks and SurrogateG Ranks for BEC Zones and Draft S Ranks forEcoprovinces and Major Drainage Units <strong>of</strong>B.C.: Preliminary Rankings for Informing the<strong>Biodiversity</strong> Status Report and Action Plan.<strong>Biodiversity</strong> <strong>BC</strong>, Victoria, <strong>BC</strong>. 64pp. Available at:www.biodiversitybc.org.137 C. Rankin and Associates. 2004. Invasive AlienSpecies Framework for B.C.: Identifying andAddressing Threats to <strong>Biodiversity</strong>. B.C. Ministry<strong>of</strong> Water, Land and Air Protection, <strong>Biodiversity</strong>Branch, Victoria, <strong>BC</strong>. 109pp. Available at: www.env.gov.bc.ca/wld/documents/alien_species_framework_<strong>BC</strong>_0205.pdf.138 Ibid.139 Menge, B.A. and G.M. Branch. 2001. Rockyintertidal communities. Pp. 221-250 in M.D.Bertness, S.D. Gaines and M.E. Hay (eds.).Marine community ecology. Sinaurer AssociatesInc., Sunderland, MA.140 Richard Hebda, Royal <strong>British</strong> <strong>Columbia</strong>Museum, personal communication.141 Ciruna, K., L.A. Meyerson, A.T. Gutierrez andE. Watson. 2004. Information Document onthe Ecological and Socio-Economic Impacts<strong>of</strong> Invasive Alien Species on Inland WaterEcosystems: A Report to the Convention onBiological Diversity. Convention on BiologicalDiversity Available at: www.cbd.int/doc/meetings/sbstta/sbstta-10/information/sbstta-10-inf-04-en.doc.142 Gayton, D. 2007. Major impacts to <strong>Biodiversity</strong>in <strong>British</strong> <strong>Columbia</strong> (excluding climate change).<strong>Biodiversity</strong> <strong>BC</strong>, Victoria, <strong>BC</strong>. 28pp. Available at:www.biodiversitybc.org.143 Wind, E. 2005. Effects <strong>of</strong> Non-native Predatorson Aquatic Ecosystems. <strong>Biodiversity</strong> Branch,B.C. Ministry <strong>of</strong> Water, Land and Air Protection.118pp.144 B.C. Conservation Date Centre. 2007. <strong>BC</strong> Speciesand Ecosystems Explorer. Available at: www.env.gov.bc.ca/atrisk/toolintro.html.145 Scudder, G.G.E. <strong>The</strong> Nature Trust <strong>of</strong> <strong>British</strong><strong>Columbia</strong>, personal communication.146 Bosquet, Y. (ed.) 1991. Checklist <strong>of</strong> Beetles<strong>of</strong> Canada and Alaska. Research Branch,Agriculture Canada, Publication 1861/E:430.147 Maw, H.E.L., R.G. Foottit, K.G.A. Hamiltonand G.G. E. Scudder. 2000. Checklist <strong>of</strong> theHemiptera <strong>of</strong> Canada and Alaska, NRC ResearchPress, Ottawa, ON. 220pp.148 Foottit, R.G., S.E. Halberd, G.L. Miller, E. Mawand L.M. Russell. 2006. Adventive aphids(Hemiptera: Aphididae) <strong>of</strong> America north <strong>of</strong>Mexico. Proceedings <strong>of</strong> the EntomologicalSociety <strong>of</strong> Washington 108: 583-610.149 Gayton, D. 2005. Native and non-nativeplant species on grazed grasslands <strong>of</strong> <strong>British</strong><strong>Columbia</strong>’s southern interior. Journal <strong>of</strong>Ecosystems and Management 5(1): 51-59.Available at: www.forrex.org/publications/jem/ISS25/vol5_no1_art6.pdf.150 C. Rankin and Associates. 2004. Invasive AlienSpecies Framework for B.C.: Identifying andAddressing Threats to <strong>Biodiversity</strong>. B.C. Ministry<strong>of</strong> Water, Land and Air Protection, <strong>Biodiversity</strong>Branch, Victoria, <strong>BC</strong>. 109pp. Available at: www.env.gov.bc.ca/wld/documents/alien_species_framework_<strong>BC</strong>_0205.pdf..151 Hatfield, T. and S. Pollard. 2007. Non-nativeFreshwater Fish Species in <strong>British</strong> <strong>Columbia</strong>.Biology, Biotic Effects, and PotentialManagement Actions. Freshwater FisheriesSociety <strong>of</strong> <strong>British</strong> <strong>Columbia</strong> and B.C. Ministry <strong>of</strong>Environment, Victoria B.C.152 D. McPhail, University <strong>of</strong> <strong>British</strong> <strong>Columbia</strong>,Emeritus, personal communication.153 Macdonald, I.A.W., L.L. Loope, M.B. Usher andO. Hamann. 1989. Wildlife conservation andthe invasion <strong>of</strong> nature reserves by introducedspecies: a global perspective. Pp. 215-255 InDrake, J.A., H.A. Mooney, F. di Castri, R.H.Groves, F.J. Kruger, M. Rejmanek, and M.Williamson, M. (eds.). Biological Invasions: AGlobal Perspective. Scope 37. John Wiley andSons, New York, NY.
12the biodiversity atlas <strong>of</strong> british columbia154 Vitousek, P.M. 1988. Diversity and biologicalinvasions <strong>of</strong> oceanic islands. pp. 181-189In Wilson, E.O. (ed.) <strong>Biodiversity</strong>. NationalAcademy Press, Washington, DC.155 Meidinger, D. and J. Pojar. 1991. Ecosystems<strong>of</strong> <strong>British</strong> <strong>Columbia</strong>. B.C. Ministry <strong>of</strong> Forests,Research Branch, Victoria, B.C. Special ReportSeries No.6. 330pp. Available at: www.for.gov.bc.ca/hfd/pubs/Docs/Srs/Srs06.htm156 Intergovernmental Panel on Climate Change(IPCC). 2001. In Houghton, J.T., Y. Ding, D.J.Griggs, M. Noguer, P.J. van der Linden, ,X. Dai,K. Maskell, and C.A. Johnson (eds.). ClimateChange 2001: <strong>The</strong> Scientific Basis. (Contribution<strong>of</strong> Working Group I) In J.T. Houghton, Y. Ding,D.J. Griggs, M. Noguer, P.J. van der Linden, X.Dai, K. Maskell and C.A. Johnson (eds.). ThirdAssessment Report <strong>of</strong> the IPCC. CambridgeUniversity Press, Cambridge, U.K. and New York,NY, 881pp.157 Hebda, R. J. 1995. <strong>British</strong> <strong>Columbia</strong> vegetationand climate history with focus on 6 KA BP.Géographie Physique et Quaternaire 49:55-79.158 Zhang, Q-B. and R.J. Hebda. 2004. Radial growthpatterns <strong>of</strong> Pseudotsuga menziesii along anelevational gradient on the central coast <strong>of</strong><strong>British</strong> <strong>Columbia</strong>, Canada. Canadian Journal <strong>of</strong>Forest Research 34:1946-1954.159 Compass Resource Management. 2007.Major Impacts: Climate Change. <strong>Biodiversity</strong><strong>BC</strong>, Victoria, <strong>BC</strong>. 41pp. Available at: www.biodiversitybc.org.160 Fischlin, A, G.F. Midgely, J.T. Price, R. Leemans,B. Gopal, C. Turley, M.D.A. Rounsevell, O.P.Dube, J. Tarazona and A.A.Velichko. 2007.Ecosystems, their properties, goods andservices. Pp. 211-272. In Parry, M.L., Canziani,O.F., Palutik<strong>of</strong>, J.P., van der Linden, P.J. andHanson, C.E., (eds.). Climate Change 2007:Impacts, Adaptation and Vulnerability.Contribution <strong>of</strong> Working Group II to the FourthAssessment Report <strong>of</strong> the IntergovernmentalPanel on Climate Change. Cambridge UniversityPress UK. 973pp.161 IPCC. 2007. Summary for Policymakers. InClimate Change 2007: <strong>The</strong> Physical ScienceBasis. Contribution <strong>of</strong> Working Group Ito the Fourth Assessment Report <strong>of</strong> theIntergovernmental Panel on Climate Change[Solomon, S., D. Qin, M. Manning, Z. Chen, M.Marquis, K.B. Averyt, M.Tignor and H.L. Miller(eds.)]. Cambridge University Press, Cambridge,United Kingdom. Available at: www.ipcc.ch/pdf/assessment-report/ar4/wg1/ar4-wg1-spm.pdf.162 Fischlin, A, G.F. Midgely, J.T. Price, R. Leemans,B. Gopal, C. Turley, M.D.A. Rounsevell, O.P.Dube, J. Tarazona and A.A.Velichko. 2007.Ecosystems, their properties, goods andservices. Pp. 211-272. In Parry, M.L., Canziani,O.F., Palutik<strong>of</strong>, J.P., van der Linden, P.J. andHanson, C.E., (eds.). Climate Change 2007:Impacts, Adaptation and Vulnerability.Contribution <strong>of</strong> Working Group II to the FourthAssessment Report <strong>of</strong> the IntergovernmentalPanel on Climate Change. Cambridge UniversityPress UK. 973pp163 Field, C.B., L.D. Mortsch, M. Brklacich, D.L. Forbes,P. Kovacs, J.A. Patz, S.W. Running and M.J. Scott.2007. North America. Pp. 617-652. In Parry, M.L.,Canziani, O.F., Palutik<strong>of</strong>, J.P., van der Linden,P.J. and Hanson, C.E., (eds.). Climate Change2007: Impacts, Adaptation and Vulnerability.Contribution <strong>of</strong> Working Group II to the FourthAssessment Report <strong>of</strong> the Intergovernmental Panelon Climate Change. Cambridge University Press,Cambridge, UK. 973pp.164 Murdock, T.Q., A.T. Werner and D. Bronaugh.2007. Preliminary Analysis <strong>of</strong> <strong>BC</strong> Climate Trendsfor <strong>Biodiversity</strong>. <strong>Biodiversity</strong> <strong>BC</strong>, Victoria, <strong>BC</strong>.24pp. Available at: www.biodiversitybc.org.165 Holt, R.F., G. Utzig, M. Carver and J. Booth.2003. <strong>Biodiversity</strong> Conservation in B.C. : AnAssessment <strong>of</strong> Threats and Gaps. VeridianEcological Consulting. South Slocan, B.C.166 B.C. Ministry <strong>of</strong> Water, Land and Air Protection.2002. Environmental Trends in <strong>British</strong> <strong>Columbia</strong>2002. State <strong>of</strong> Environment Reporting Office,B.C. 64 pp.167 Ibid.168 Ibid.169 B.C. Ministry <strong>of</strong> Environment. 2007.Environmental Trends 2007. State <strong>of</strong>Environment Reporting Office, Victoria, <strong>BC</strong>.Available at: www.env.gov.bc.ca/soe/et07/index.html.170 Ibid.171 Murdock, T.Q., A.T. Werner and D. Bronaugh.2007. Preliminary Analysis <strong>of</strong> <strong>BC</strong> Climate Trendsfor <strong>Biodiversity</strong>. <strong>Biodiversity</strong> <strong>BC</strong>, Victoria, <strong>BC</strong>.24pp. Available at: www.biodiversitybc.org.172 Carroll, A.L., J. Régnière, J.A. Logan, S.W. Taylor,B.J. Bentz, and J.A. Powell. 2006. Impacts <strong>of</strong>climate change on range expansion by themountain pine beetle. Natural ResourcesCanada, Canadian Forest Service, PacificForestry Centre, Victoria, <strong>BC</strong>. Mountain PineBeetle Initiative Working Paper 2006-14.173 Canadian Forest Service. 2007 . Mountain PineBeetle Biology. Available at: mpb.cfs.nrcan.gc.ca/biology/index_e.html.174 Carroll, A.L., J. Régnière, J.A. Logan, S.W. Taylor,B.J. Bentz, and J.A. Powell. 2006. Impacts <strong>of</strong>climate change on range expansion by themountain pine beetle. Natural ResourcesCanada, Canadian Forest Service, PacificForestry Centre, Victoria, <strong>BC</strong>. Mountain PineBeetle Initiative Working Paper 2006-14.175 Safranyik, L. and A. L. Carroll. 2006. <strong>The</strong> biologyand epidemiology <strong>of</strong> the mountain pine beetlein lodgepole pine forests. <strong>The</strong> mountain pinebeetle: a synthesis <strong>of</strong> biology, management, andimpacts on lodgepole pine. Natural ResourcesCanada, Canadian Forest Service, PacificForestry Centre, Victoria, B. C. 304 pp.176 Unger, L. 1993. Mountain Pine Beetle. ForestPest Leaflet. Canada-<strong>BC</strong> Partnership Agreementon Forest Resource Development. FRDA II.Fo29-6/76-1993E.177 Walton, A, J. Hughes, M. Eng, A. Fall, T. Shore, B.Riel and P. Hall. 2008. Provincial-Level Projection<strong>of</strong> the Current Mountain Pine Beetle Outbreak:Update <strong>of</strong> the Infestation Projection Based on the
the biodiversity atlas <strong>of</strong> british columbia12007 Provincial Aerial Overview <strong>of</strong> Forest Healthand Revisions to the “Model” (<strong>BC</strong>MPB.v5). B.C.Ministry <strong>of</strong> Forests and Range. 11pp. Available at:http://www.for.gov.bc.ca/HRE/<strong>BC</strong>MPB/<strong>BC</strong>MPB.v5.BeetleProjection.Update.pdf .178 E. L<strong>of</strong>roth, B.C. Ministry <strong>of</strong> Environment,personal communication.179 Martin, K., A. Norris and M. Drever. 2006. Effects<strong>of</strong> bark beetle outbreaks on avian biodiversityin the <strong>British</strong> <strong>Columbia</strong> interior: implicationsfor critical habitat management. B.C. Journal<strong>of</strong> Ecosystems and Management 7(3):10-24.Available at: www.forrex.org/publications/jem/ISS38/vol7_no3_art2.pdf.180 Anonymous. 2007. Beetle studies investigateeffects on forest hydrology. Natural ResourcesCanada. Information Forestry. 3pp.181 Helie, D.F., D.L. Peters, K.L. Tattrie and J.J.Gibson. 2005. Review and synthesis <strong>of</strong> potentialhydrologic impacts <strong>of</strong> mountain pine beetle andrelated harvesting activities in <strong>British</strong> <strong>Columbia</strong>.Natural Resources Canada. Report No. 2005-23.182 Bunnell, F.L., K.A. Squires and I. Houde. 2004.Evaluat ing the effects <strong>of</strong> large-scale salvagelogging for moun tain pine beetle on terrestrialand aquatic vertebrates. Natural ResourcesCanada, Canadian Forest Service, PacificForestry Centre, Victoria, <strong>BC</strong>. Mountain PineBeetle Initiative Working Paper 2004-2. Availableat: warehouse.pfc.forestry.ca/pfc/25154.pdf.183 Boon, S. 2006. Determining the impact <strong>of</strong> MPBkilledforest and elevated harvesting on snowaccumulation and the projected impacts onmelt and peak flow. Forest Investment Account(FIA) Report, FIA Project M065006 (2005/06)Abstract available at: www.for.gov.bc.ca/hfd/library/fia/html/FIA2006MRunp001.htm.184 Forest Practices Board. 2007. <strong>The</strong> effect <strong>of</strong>mountain pine beetle attack and salvageharvesting on streamflows. Special Investigation.FPB/SIR/16. 27pp. Available at: www.fpb.gov.bc.ca/s_investigations.htm.185 Martin, K., A. Norris and M. Drever. 2006. Effects<strong>of</strong> bark beetle outbreaks on avian biodiversityin the <strong>British</strong> <strong>Columbia</strong> interior: implicationsfor critical habitat management. B.C. Journal<strong>of</strong> Ecosystems and Management 7(3):10-24.Available at: www.forrex.org/publications/jem/ISS38/vol7_no3_art2.pdf.186 B.C. Ministry <strong>of</strong> Forests. No date. MountainPine Beetle in B.C. Available at: http://www.llbc.leg.bc.ca/public/PubDocs/bcdocs/365905/mountain_pine_beetle_2003.pdf.187 Filmon, G. 2003. Firestorm: A Provincial Review.Province <strong>of</strong> <strong>British</strong> <strong>Columbia</strong>. 100 pp. Availableat: http://www.2003firestorm.gov.bc.ca/firestormreport/FirestormReport.pdf.188 Carroll, A.L., J. Régnière, J.A. Logan, S.W. Taylor,B.J. Bentz, and J.A. Powell. 2006. Impacts <strong>of</strong>climate change on range expansion by themountain pine beetle. Natural ResourcesCanada, Canadian Forest Service, PacificForestry Centre, Victoria, <strong>BC</strong>. Mountain PineBeetle Initiative Working Paper 2006-14.189 B.C. Ministry <strong>of</strong> Forests. State <strong>of</strong> <strong>British</strong> <strong>Columbia</strong>’sForests. 2006. <strong>BC</strong> Ministry <strong>of</strong> Forest and RangeAvailable at: www.for.gov.bc.ca/hfp/s<strong>of</strong>/2006.190 Gayton, D. 2007. Major impacts to <strong>Biodiversity</strong>in <strong>British</strong> <strong>Columbia</strong> (excluding climate change).<strong>Biodiversity</strong> <strong>BC</strong>, Victoria, <strong>BC</strong>. 28pp. Available at:www.biodiversitybc.org.191 B.C. Ministry <strong>of</strong> Forests. 2007. State <strong>of</strong> <strong>British</strong><strong>Columbia</strong>’s Forests 2006. Available at: www.for.gov.bc.ca/hfp/s<strong>of</strong>/2006.192 Newmaster, S.G., R.J. Belland, A. Arsenault andD.H. Vitt. 2003. Patterns <strong>of</strong> bryophyte diversity inhumid coastal and inland cedar hemlock forests<strong>of</strong> <strong>British</strong> <strong>Columbia</strong>. Environmental Reviews11(Supplement 1):159-185.193 Winchester, N.N. 2006. Ancient TemperateRainforest Research in <strong>British</strong> <strong>Columbia</strong>:A Tribute to Dr. Richard A. Ring. CanadianEntomologist 138: 72-83.194 Winchester, N.N. and L.L. Fagan, 2000. Canopyarthropods <strong>of</strong> montane forests on VancouverIsland, <strong>British</strong> <strong>Columbia</strong>, Canada. Journal <strong>of</strong>Sustainable Forestry 10: 355-361.195 Blood, D.A. 1998. Marbled Murrelet. B.C.Ministry <strong>of</strong> Environment, Lands and Parks,Wildlife Branch, Victoria, B.C. 6pp.196 McPhee, M. 2000. Sensitive EcosystemsInventory: East Vancouver Island and GulfIslands 1993-1997. Volume 2: ConservationManual. Canadian Wildlife Service, Pacific andYukon Region. 284 pp.197 Iverson, K. and Cadrin, C. 2003. SensitiveEcosystems Inventory: Central Okanagan2000-2001. Volume 1: Methodology, EcologicalDescriptions, Results and Conservation Tools.Canadian Wildlife Service, Pacific and YukonRegion. 238 pp.198 Gayton, D. 2007. Major impacts to <strong>Biodiversity</strong>in <strong>British</strong> <strong>Columbia</strong> (excluding climate change).<strong>Biodiversity</strong> <strong>BC</strong>, Victoria, <strong>BC</strong>. 28pp. Available at:www.biodiversitybc.org.199 Rombulak, S.C. and C.A. Frissell. 2000. Review <strong>of</strong>ecological effects <strong>of</strong> roads on terrestrial and aquaticcommunities. Conservation Biology 14: 18-30.200 Reed, R.A., J. Johnson-Barnard and W.L.Baker. 1996. Contribution <strong>of</strong> roads to forestfragmentation in the Rocky Mountains.Conservation Biology 14: 57-63.201 Ito, T.Y., N. Miura, B. Lhagvasuren, D. Enkhbileg,S. Takatsuki, A. Tsunekawa and Z. Jiang. 2005.Preliminary evidence <strong>of</strong> a barrier effect <strong>of</strong> arailroad on the migration <strong>of</strong> Mongolian gazelles.Conservation Biology 19: 945-948.202 Marsh, D.M., G.S. Milam, N.P. Gorham andN.B. Beckman. 2005. Forest roads as partialbarriers to terrestrial salamander movement.Conservation Biology 19: 2005-2008.203 Epps, C.W., P.J. PalsbØll, J.D. Wehausen, G.K.Roderick, R.R. Ramey III and D.R. McCullough.2005. Highways block gene flow and causea rapid decline in genetic diversity <strong>of</strong> desertbighorn sheep. Ecology Letters 8: 1029-1038.
14the biodiversity atlas <strong>of</strong> british columbia204 Forman, R.T.T. 2000. Estimate <strong>of</strong> the areaaffected ecologically by the road system in theUnited States. Conservation Biology 14: 31-35.205 B.C. Ministry <strong>of</strong> Environment. 2007.Environmental Trends 2007. State <strong>of</strong> EnvironmentReporting Office, Victoria, <strong>BC</strong>. Available at: www.env.gov.bc.ca/soe/et07/index.html.206 Ibid.207 Kremsater, L. 2007. Draft S Ranks and SurrogateG ranks for BEC Zones and Draft S Ranks forEcoprovinces and Major Drainage Units <strong>of</strong>B.C.: Preliminary Rankings for Informing the<strong>Biodiversity</strong> Status Report and Action Plan.<strong>Biodiversity</strong> <strong>BC</strong>, Victoria, <strong>BC</strong>. 64pp. Available at:www.biodiversitybc.org.208 B.C. Ministry <strong>of</strong> Water, Land and Air Protection.2002. Environmental Trends in <strong>British</strong> <strong>Columbia</strong>2002. State <strong>of</strong> Environment Reporting Office,B.C. 64 pp.209 Gayton, D. 2007. Major impacts to <strong>Biodiversity</strong>in <strong>British</strong> <strong>Columbia</strong> (excluding climate change).<strong>Biodiversity</strong> <strong>BC</strong>, Victoria, <strong>BC</strong>. 28pp. Available at:www.biodiversitybc.org.210 B.C. Ministry <strong>of</strong> Environment. 2007.Environmental Trends 2007. State <strong>of</strong>Environment Reporting Office, Victoria, <strong>BC</strong>.Available at: www.env.gov.bc.ca/soe/et07/index.html.211 B.C. Ministry <strong>of</strong> Environment. 2007. Ecosystems:Trends in Number <strong>of</strong> Road Crossings <strong>of</strong>Streams. In Environmental Trends 2007. State<strong>of</strong> Environment Reporting Office, Victoria, <strong>BC</strong>.Available at: www.env.gov.bc.ca/soe/et07/06_ecosystems/stream_crossings.html.212 National Forest Inventory Photo Database.Analysed by B.C. Ministry <strong>of</strong> Forests and Range,Forest Analysis and Inventory Branch, Victoria,<strong>BC</strong>.213 B.C. Ministry <strong>of</strong> Environment, B.C. Ministry <strong>of</strong>Forests and Range, and Federal Department <strong>of</strong>Fisheries and Oceans. 2008. Culvert Fish PassageTechnical Working Group Internal GIS AnalysisResults. Unpublished report.214 B.C. Ministry <strong>of</strong> Environment, B.C. Ministry <strong>of</strong>Forests and Range, and Department <strong>of</strong> Fisheriesand Oceans Canada. 2008. Culvert Fish PassageTechnical Working Group Strategic Plan.215 Larkin, G.A. and P.A. Slaney. 1996. Trends inMarine-Derived Nutrient Sources to SouthCoastal <strong>British</strong> <strong>Columbia</strong> Streams: ImpendingImplications to Salmonid Production. WatershedRestoration Management Report No.3.216 Thompson, R. and C. Mount. 2007. Fish passageand culverts: why did the fish cross the road?Poster presented to B.C. Ministry <strong>of</strong> EnvironmentEcosystem Program Meeting, Sun Peaks, B.C.217 Forest Practices Board. 2009. Fish Passage atStream Crossings: Special Investigation Report.FPB/SIR/25. 25pp. Available at: www.fpb.gov.bc.ca/special/investigations/SIR25/SIR25ml.pdf.218 Gayton, D. 2007. Major impacts to <strong>Biodiversity</strong>in <strong>British</strong> <strong>Columbia</strong> (excluding climate change).<strong>Biodiversity</strong> <strong>BC</strong>, Victoria, <strong>BC</strong>. 28pp. Available at:www.biodiversitybc.org.219 T. Hatfield, A. Lewis and D. Ohlson. 2002. <strong>British</strong><strong>Columbia</strong> Instream Flow Standards for FishPhase 1 - Initial Review and Consultation. B.C.Ministry <strong>of</strong> Water, Land, and Air Protection,Victoria, <strong>BC</strong>.220 T. Hatfield, A. Lewis, D. Ohlson and M. Bradford.2003. Development <strong>of</strong> instream flow thresholdsas guidelines for reviewing proposed water uses.Report for: B.C. Ministry <strong>of</strong> Sustainable ResourceManagement, and B.C. Ministry <strong>of</strong> Water, Land,and Air Protection, Victoria, <strong>BC</strong>221 Gayton, D. 2007. Major impacts to <strong>Biodiversity</strong>in <strong>British</strong> <strong>Columbia</strong> (excluding climate change).<strong>Biodiversity</strong> <strong>BC</strong>, Victoria, <strong>BC</strong>. 28pp. Available at:www.biodiversitybc.org.222 Ibid.223 B.C. Hydro. 2008. Generation System. Availableat: www.bchydro.com/about/our_system/generation.html.224 Gayton, D. 2007. Major impacts to <strong>Biodiversity</strong>in <strong>British</strong> <strong>Columbia</strong> (excluding climate change).<strong>Biodiversity</strong> <strong>BC</strong>, Victoria, <strong>BC</strong>. 28pp. Available at:www.biodiversitybc.org.225 B.C. Hydro. 2008. Our Facilities. Available at:www.bchydro.com/info/system/system15274.html.226 Gayton, D. 2007. Major impacts to <strong>Biodiversity</strong>in <strong>British</strong> <strong>Columbia</strong> (excluding climate change).<strong>Biodiversity</strong> <strong>BC</strong>, Victoria, <strong>BC</strong>. 28pp. Available at:www.biodiversitybc.org.227 Northcote, T.G. 1998. Inland waters and aquatichabitats In G.G.E. Scudder and I.M. Smith (eds.).Assessment <strong>of</strong> Species Diversity in the MontaneCordillera Ecozone. Ecological Monitoring andAssessment Network, Burlington, ON. Availableat: www.naturewatch.ca/eman/reports/publications/99_montane/intro.html.228 Fearnside, P.M. 2004. Greenhouse gas emissionsfrom hydroelectric dams: controversies providea springboard for rethinking a supposedly ‘cleanenergy source’-an editorial comment. ClimaticChange 66: 1-8.229 B.C. Hydro. 2008. Our Facilities. Available at:www.bchydro.com/info/system/system15274.html.230 Holt, R. and T. Hatfield. 2007. Key Elements<strong>of</strong> <strong>Biodiversity</strong> in <strong>British</strong> <strong>Columbia</strong>: SomeExamples From the Terrestrial and FreshwaterAquatic Realm: Lake-Level Patterns. <strong>Biodiversity</strong><strong>BC</strong>. Victoria, <strong>BC</strong>. 70pp. Available at: www.biodiversitybc.org.231 B.C. Hydro. 2008. Our Facilities. Available at:www.bchydro.com/info/system/system15274.html.232 T. Down, B.C. Ministry <strong>of</strong> Environment, personalcommunication.233 B.C. Outdoor Recreation Council. 2001 website.River Recovery: Restoring dams throughdecommissioning. Available at: www.recovery.bcit.ca/index.html.234 <strong>The</strong> Energy and <strong>Biodiversity</strong> Initiative. 2003.Integrating <strong>Biodiversity</strong> Conservation intoOil and Gas Development. 58pp. Available at:www.celb.org/ImageCache/CELB/content/energy_2dmining/ebi_2epdf/v1/ebi.pdf.
the biodiversity atlas <strong>of</strong> british columbia1235 Holt, R.F., G. Utzig, M. Carver and J. Booth.2003. <strong>Biodiversity</strong> Conservation in B.C. : AnAssessment <strong>of</strong> Threats and Gaps. VeridianEcological Consulting. South Slocan, B.C.236 M. Winfield-Lesk, B.C. Ministry <strong>of</strong> Environment,personal communication.237 B.C. Ministry <strong>of</strong> Environment. 2006. <strong>British</strong><strong>Columbia</strong> Coast and Marine EnvironmentProject: 2005. State <strong>of</strong> Environment ReportingOffice, Victoria, <strong>BC</strong>. Available at: http://www.env.gov.bc.ca/soe/bcce/index.html.238 Ibid.239 Ibid.240 Ibid.241 B.C. Ministry <strong>of</strong> Environment. 2006.Contaminated sites registry.242 Burns Bog Conservation Society. Available at:www.burnsbog.org.243 B.C. Ministry <strong>of</strong> Environment. 2008.Contaminated sites registry.244 Chambers P.A., M. Guy, E.S. Roberts, M.N.Charlton, R. Kent, C. Gagnon, G. Grove, andN.Foster. 2001. Nutrients and their impact onthe Canadian environment. Agriculture andAgri-Food Canada, Environment Canada,Fisheries and Oceans Canada, Health Canadaand Natural Resources Canada. 241pp.245 Chambers P.A., M. Guy, E.S. Roberts, M.N.Charlton, R. Kent, C. Gagnon, G. Grove, andN.Foster. 2001. Nutrients and their impact onthe Canadian environment. Agriculture andAgri-Food Canada, Environment Canada,Fisheries and Oceans Canada, Health Canadaand Natural Resources Canada. 241pp.246 B.C. Ministry <strong>of</strong> Water, Land and Air Protection(<strong>BC</strong>WLAP). 2005 (revision). 2000 <strong>British</strong><strong>Columbia</strong> Emissions Inventory <strong>of</strong> Criteria AirContaminants. Water, Air and Climate ChangeBranch. Available at: http://www.env.gov.bc.ca/air/airquality/pdfs/2000_em_inv_highlights.pdf.247 Michael Rensing, B.C. Ministry <strong>of</strong> Environment,personal communication.248 Ibid.249 B.C. Ministry <strong>of</strong> Water, Land and Air Protection(<strong>BC</strong>WLAP). 2005 (revision). 2000 <strong>British</strong><strong>Columbia</strong> Emissions Inventory <strong>of</strong> Criteria AirContaminants. Water, Air and Climate ChangeBranch. Available at: http://www.env.gov.bc.ca/air/airquality/pdfs/2000_em_inv_highlights.pdf.250 M. Rensing, B.C. Ministry <strong>of</strong> Environment,personal communication.251 Government <strong>of</strong> <strong>British</strong> <strong>Columbia</strong>. 2004 WasteDischarge Act. Environmental Management Act.Environmental Protection Division. Ministry <strong>of</strong>Environment. www.qp.gov.bc.ca/statreg/reg/E/EnvMgmt/320_2004.htm#section2.252 B.C. Ministry <strong>of</strong> Environment (<strong>BC</strong>MOE). 2005.A User’s Guide to Working In and Around Water:Understanding the Regulation around <strong>British</strong><strong>Columbia</strong>’s Water Act. Water StewardshipDivision. Victoria, <strong>BC</strong>. www.env.gov.bc.ca/wsd/water_rights/water_rights.html.253 Government <strong>of</strong> <strong>British</strong> <strong>Columbia</strong>. 1996. WaterAct. www.qp.gov.bc.ca/statreg/stat/W/96483_01.htm#section9.
16the biodiversity atlas <strong>of</strong> british columbia