A Random Number Generator Test Suite for the C++ ... - ETH Zürich
A Random Number Generator Test Suite for the C++ ... - ETH Zürich
A Random Number Generator Test Suite for the C++ ... - ETH Zürich
- No tags were found...

You also want an ePaper? Increase the reach of your titles
YUMPU automatically turns print PDFs into web optimized ePapers that Google loves.
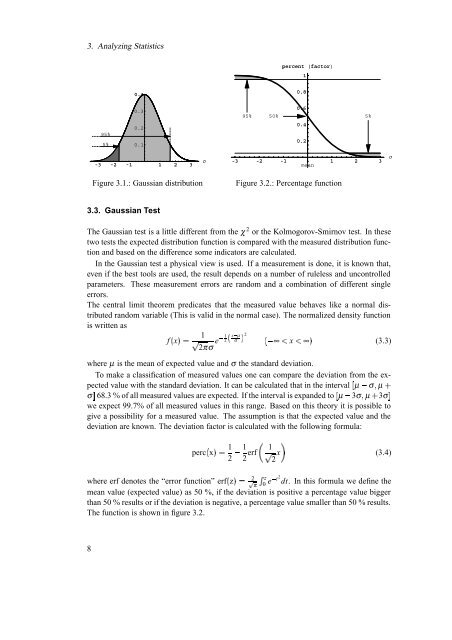
3. Analyzing Statisticspercent factor10.40.895%5%0.30.20.195%0.650% 5%0.40.2-3 -2 -1 1 2 3Σ-3 -2 -1 1 2 3meanΣFigure 3.1.: Gaussian distributionFigure 3.2.: Percentage function3.3. Gaussian <strong>Test</strong>The Gaussian test is a little different from <strong>the</strong> χ 2 or <strong>the</strong> Kolmogorov-Smirnov test. In <strong>the</strong>setwo tests <strong>the</strong> expected distribution function is compared with <strong>the</strong> measured distribution functionand based on <strong>the</strong> difference some indicators are calculated.In <strong>the</strong> Gaussian test a physical view is used. If a measurement is done, it is known that,even if <strong>the</strong> best tools are used, <strong>the</strong> result depends on a number of ruleless and uncontrolledparameters. These measurement errors are random and a combination of different singleerrors.The central limit <strong>the</strong>orem predicates that <strong>the</strong> measured value behaves like a normal distributedrandom variable (This is valid in <strong>the</strong> normal case). The normalized density functionis written as1 1 µ2§xσ¨2 2πσ§ e£ ¢¥ f§x¨¡ x ¡ ∞¨ (3.3)∞where µ is <strong>the</strong> mean of expected value and σ <strong>the</strong> standard deviation.To make a classification of measured values one can compare <strong>the</strong> deviation from <strong>the</strong> expectedvalue with <strong>the</strong> standard deviation. It can be calculated that in <strong>the</strong> interval σ µ¤ µ ¢68.3 % of all measured values are expected. If <strong>the</strong> interval is expanded to 3σ µ µ¤ 3σ£σ£we expect 99.7% of all measured values in this range. Based on this <strong>the</strong>ory it is possible togive a possibility <strong>for</strong> a measured value. The assumption is that <strong>the</strong> expected value and <strong>the</strong>deviation are known. The deviation factor is calculated with <strong>the</strong> following ¢ <strong>for</strong>mula:1 1 1erf perc§x¨2where erf denotes <strong>the</strong>¥2“error ¤ function”2z t 2π 0 dt. In this <strong>for</strong>mula we define <strong>the</strong>mean value (expected value) as 50 %, if <strong>the</strong> deviation is positive a percentage value biggererf§z¨¥than 50 % results or if <strong>the</strong> deviation is negative, a percentage value smaller than 50 % results.The function is shown in e£ figure 3.2.¥(3.4)¢ 2x8