THE 2010 UK SOFT DRINKS REPORT - British Soft Drinks Association
THE 2010 UK SOFT DRINKS REPORT - British Soft Drinks Association
THE 2010 UK SOFT DRINKS REPORT - British Soft Drinks Association
- No tags were found...
Create successful ePaper yourself
Turn your PDF publications into a flip-book with our unique Google optimized e-Paper software.
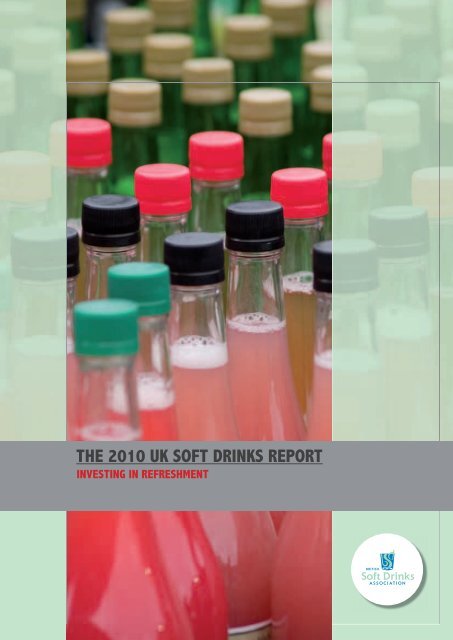
<strong>THE</strong> <strong>2010</strong> <strong>UK</strong> <strong>SOFT</strong> <strong>DRINKS</strong> <strong>REPORT</strong>INVESTING IN REFRESHMENT
<strong>SOFT</strong> <strong>DRINKS</strong> – INVESTING IN REFRESHMENT<strong>REPORT</strong> METHODOLOGY/BACKGROUNDSpecialist food and drink consultancy, Zenith International, has been commissioned to producethis <strong>2010</strong> BSDA <strong>UK</strong> <strong>Soft</strong> <strong>Drinks</strong> Report. All data and insights contained in this report wereproduced using Zenith’s internal market databases and primary research.In compiling its research, Zenith relies on thegoodwill and cooperation of companies activein the marketplace. During Zenith’s annualresearch into the <strong>UK</strong> soft drinks industry,over 250 soft drinks producers are regularlycontacted. This includes larger brandedoperators, retailer own label specialists, contractpackers and a signifi cant number of smallerindependent companies.Based on individual producer volumes for theyear, market, sector and segment totals arecalculated from the ‘bottom up’. At a sector andsegment level, adjustments are then made forany double counting of contract and licensedbottling. Estimates for unauthorised soft drinkimports sold through the ‘grey market’ are alsoincluded. This is more pronounced in categoriessuch as energy drinks rather than dilute to tastedrinks, for example.A complete picture of the <strong>UK</strong> soft drinks marketacross all sales channels is produced, throughZenith’s extensive study of the largest softdrinks companies, alongside small to mediumsized operators and own label specialists. Themarket fi gures presented therefore encompassall aspects of the market including: take home,impulse and on premise; water cooler volumesfor the offi ce; home dispense carbonated softdrinks; and pump dispense carbonates in thelicensed trade.To this end, a considerable amount of time andeffort is spent contacting industry players andstriving to analyse the complexities of the <strong>UK</strong>soft drinks arena. Zenith would like to expressits sincere gratitude to BSDA and the entire <strong>UK</strong>soft drinks industry for its continued help andsupport during the research process.2 • The <strong>2010</strong> <strong>UK</strong> <strong>Soft</strong> <strong>Drinks</strong> Report
<strong>THE</strong> <strong>UK</strong> <strong>2010</strong> <strong>SOFT</strong> <strong>DRINKS</strong> <strong>REPORT</strong>INVESTING IN REFRESHMENTCONTENTS4 OVERALL <strong>SOFT</strong> <strong>DRINKS</strong> CONSUMPTION6 BOTTLED WATER8 CARBONATES10 DILUTABLES12 FRUIT JUICE AND SMOOTHIES14 STILL AND JUICE <strong>DRINKS</strong>16 SPORTS AND ENERGY <strong>DRINKS</strong>18 OUTLOOK AND CONCLUSIONS19 ABOUT BSDAInvesting in refreshment:The people behindthe productPeopleProfiles:The logistics manager page 6The brand manager page 8The category manager page 10The general manager page 12The educationcentre manager page 14The directorgeneral page 5The engineers page 16The <strong>2010</strong> <strong>UK</strong> <strong>Soft</strong> <strong>Drinks</strong> Report • 3
OVERALL<strong>SOFT</strong> <strong>DRINKS</strong>CONSUMPTION<strong>UK</strong> soft drinks consumption, 2003 - 2009Year 2003 2004 2005 2006 2007 2008 2009Million litres 13845 13600 13720 14175 14060 13905 14140% change +6.8 -1.8 +0.9 +3.3 -0.8 -1.1 +1.7Litres per person 231.5 226.3 227.1 233.4 230.3 226.5 229.1Value, £ million 12130 12145 12415 12830 12892 12936 13224% change +8.1 +0.1 +2.2 +3.3 +0.5 +0.3 +2.2Value per litre, £ 0.88 0.89 0.90 0.91 0.92 0.93 0.94Source: Zenith International£13.224 billionVALUE OF <strong>UK</strong> <strong>SOFT</strong> <strong>DRINKS</strong> INDUSTRYIN 2009. UP 2.2% ON PREVIOUS YEAR<strong>UK</strong> soft drinks sectors annual percentage change, 2003 - 200920Bottled water15Carbonates10Dilutables5Fruit juice0Still & juice drinks-5Total-102003200420052006200720082009Source: Zenith International4 • The <strong>2010</strong> <strong>UK</strong> <strong>Soft</strong> <strong>Drinks</strong> Report
<strong>UK</strong> soft drinks consumption, 2003 - 2009000 million litres15PeopleProfile:12963<strong>UK</strong> soft drinks, lowcalorie & no addedsugar vs regular, 2009Low calorie 61%Regular 39%Source: Zenith International020032004Source: Zenith International<strong>UK</strong> soft drinkssectors, 2009Carbonates 43%Dilutables 24%2005Bottled water 15%Fruit juice 9%Still & juice drinks 10%Source: Zenith International2009 0 was a year of trials andtribulations. The <strong>UK</strong> economy continuedto be deeply impacted by recession,theworst for decades. Meanwhile, the‘barbecue summer’, originally forecastbythe Met Office, failed to deliver ameteoric surge for the industry. Yet,despite these challenges, soft drinksregistered an impressive 1.7%growth in volume and 2.2% gain invalue to stand at 14140 million litresand£13.224 billion respectively.2009 0 could best be summarised as a year of‘softrebound’. On the back of two poor summers,Mayto July 2009 saw average sunshinelevels el consistently higher than previous years;and August 2009 was notably brighter thanAugust 2008.So, while heat wave conditions remain moreof adistant memory, 2009 delivered a fewraysof sunshine. Coupled with this, amidst2006200720082009economic turmoil and low consumer confi dence,promotional activity helped the industry recoversome lost ground.Bottled water re-engaged with the consumer, withpromotions a major theme. Carbonates showeda resurgence, providing an affordable treat intough times. Dilutables consumption was boostedby double concentrated variants increasing inpopularity. The worst performing category waspure juice and smoothies, which faced a battlewith reduced disposable income. Still and juicedrinks remained in favour for their easy drinking.Sports and energy drinks continued their stronggrowth path in 2009, albeit at a lower rate thanin previous years.2009 showed that consumers have remained loyalto the soft drinks category but are more concernedthan ever with value. Issues such as health,wellbeing and naturalness continue to overlapwith pleasure and indulgence in consumers’minds, leaving the soft drinks market awashwith opportunity.<strong>THE</strong> DIRECTORGENERALThe soft drinks industry has hadsome disappointing years lately,but 2009 saw overall consumptionreturn to growth once more. Our<strong>2010</strong> <strong>UK</strong> <strong>Soft</strong> <strong>Drinks</strong> Report tellsthe story of how the industry didthis; it also tells the story of thepeople in the industry who madeit happen.The industry’s success is based onserving the demanding,price-conscious consumer.If the public wants value for money,we have to deliver value. If thepublic is concerned about healthand wellbeing, we have to offer achoice of drinks that meets theirneeds. If the public is thinkingabout sustainability, we have toshow how our environmental impactis being reduced.And of course, we have to be readyto meet our consumers’ needsbefore the consumers themselveseven have them. We have tothink ahead.Our industry’s success is based onits plans for the future, investing innew products, new ways of workingand in the skills of its people. Inmore ways than one, the soft drinksindustry plays a role in the life ofthe nation.Jill ArdaghDirector general :<strong>British</strong> <strong>Soft</strong> <strong>Drinks</strong> <strong>Association</strong>DEFINITION: soft drinksCarbonated drinks, still and dilutabledrinks, fruit juices, smoothies andbottled waters, including sports andenergy drinks.The <strong>2010</strong> <strong>UK</strong> <strong>Soft</strong> <strong>Drinks</strong> Report • 5
BOTTLEDWATER<strong>UK</strong> bottled water consumption, 2003 - 2009Year 2003 2004 2005 2006 2007 2008 2009Million litres 2070 2060 2150 2275 2175 2055 2090% change +17.6 -0.5 +4.4 +5.8 -4.4 -5.5 +1.7Litres per person 34.6 34.3 35.6 37.5 35.6 33.5 33.9% of all soft drinks 15.0 15.1 15.7 16.0 15.5 14.8 14.8Value, £ million 1405 1435 1535 1650 1557 1418 1404% change +19.1 +2.1 +7.0 +7.5 -5.6 -8.9 -1.0Value per litre, £ 0.68 0.70 0.71 0.73 0.72 0.69 0.67Source: Zenith International1.7%WATER SALESINCREASE BYVOLUME SINCE 2008In 2009, the bottled water categorysaw a return to growth, albeit withoverall volumes still below those of2005. Volume sales increased by 1.7%to 2090 million litres, whilst valuedeclined by 1% to £1404 million. Plainunflavoured bottled water’s share ofthe total soft drinks market remainedunchanged from 2008 at 14.8%.Unfortunately the ‘barbecue summer’ predictedby the Met Offi ce did not materialise. Yet in keyconsumption months, such as August, consumersonce again turned to bottled water during spellsof sunshine. Meanwhile, a number of companiesran deep promotions – further striking a chordwith consumers. On-the-go outlets and majorretail saw a strengthening, particularly in thesecond half of the year, while the on-tradechannel was held back amidst economic woes.Consumption of water in smaller retail packsizes (of 10 litres and below) increased by4.7% to 1775 million litres as opposed to watercoolers, which witnessed a 12.5% decline. Underthese circumstances and following two yearsof declining consumption, the growth shownby the bottled water category is all the moreimpressive and shows that there is further roomfor improvement.<strong>THE</strong> LOGISTICSMANAGERI am in charge of a small team that looksafter the warehousing and transport ofDanone Waters from our bottling locationsthrough three distribution sites to the finalcustomer. Transportation and warehousingis undertaken by specialist contractors, somy role is to manage our relationships withthose companies: I don’t actually drive atruck myself!My responsibilities include making sure thatthe right product gets through to the rightcustomer at the right time, keeping costsand waste to the minimum. For example,we have to manage the stock rotationto minimise the amount that has to bedestroyed because it reaches its use by datebefore being sold.In addition to this, I also champion themeasurement and reduction of the carbonfootprint of our business. This extrarole is formally only a part of my overallresponsibilities, but in practice it extends intoall of them. When you think about it, that ishow it should be. These days, improving ourenvironmental performance and improvingour business performance go hand in hand,and we have to think in those terms.6 • The <strong>2010</strong> <strong>UK</strong> <strong>Soft</strong> <strong>Drinks</strong> Report
<strong>UK</strong> bottled water consumption, 2003 - 2009Million litres250020001500100050002003200420052006200720082009Source: Zenith International<strong>UK</strong> bottled watercategories, 2009<strong>UK</strong> bottled watertypes, 2009<strong>UK</strong> bottled waterpackaging, 2009<strong>UK</strong> bottled waterorigins, 2009Still bottled 72%Natural mineral water 61%Plastic 93%<strong>UK</strong> produced 78%Sparkling bottled 13%Spring water 27%Glass / other 7%France 17%Still water cooler 15%Bottled drinking water 11%Others 5%Source: Zenith InternationalSource: Zenith InternationalSource: Zenith InternationalSource: Zenith InternationalPeople Profile:I havefound thatit doesn’ttake alot ofcomplicatedtechnologyto getstarted: justawillingness tomeasure carefully and findout where the biggest environmental impactsare. Then you can work on reducing them.We have the benefit of substantial in-houseexpertise but we also drew on some externaladvice in order to draw up our first mapof our carbon footprint. I work with mycolleagues in other European countries toshare ideas and learn from each other, and Ican then bring some of those ideas home forimplementation here.A good example of what we are trying to domore of is to move more of our transport onto the railways and off the roads. We comeup against limits in rail capacity, but we areworking with the rail companies to see whatmore we can do.We are also working with our third partycontractors to help them reduce their carbonfootprint. At first, it might have seemed tosome of them like a burden – it takes timeand effort and no company has got staffwith spare time to devote to new things, butthey are seeing the benefits now and evengetting excited about it.Knowledge and awareness on environmentalissues are continually changing. Nobodyshould stop to pat themselves on the backand think they have done enough, becausethere is always more that canbe done.Rebecca WilliamsPhysical Logistics Manager :Danone WatersDEFINITION: Bottled waterStill, sparkling water and lightlycarbonated water; natural mineralwater, spring water, bottled drinkingwater; packaged water in sizesof 10 litres and below; water forcoolers in sizes of 10.1 litresand above.The <strong>2010</strong> <strong>UK</strong> <strong>Soft</strong> <strong>Drinks</strong> Report • 7
<strong>UK</strong> carbonates consumption, 2003 - 2009CARBONATES Year 2003 2004 2005 2006 2007 2008 2009Million litres 6525 6195 6065 5915 5835 5935 6065% change +4.6 -5.1 -2.1 -2.5 -1.4 +1.7 +2.2Litres per person 109.1 103.1 100.4 97.4 95.6 96.7 98.3% of all soft drinks 47.1 45.6 44.2 41.7 41.5 42.7 42.9Value, £ million 7060 6930 6850 6800 6880 7140 7470% change +5.8 -1.8 -1.2 -0.7 +1.2 +3.8 +4.6Value per litre, £ 1.08 1.12 1.13 1.15 1.18 1.20 1.23Source: Zenith International43%:CARBONATES SHAREOF <strong>THE</strong> <strong>SOFT</strong><strong>DRINKS</strong> MARKETThe largest of the soft drinks sectors,carbonates, edged ahead of the marketaverage despite the ongoing economicdownturn. Consumption rose 2.2% to6065 million litres while retail valueperformed even better, growing by4.6% to £7470 million.Cola remained the most popular variant – furtherstrengthening its position at the expense oflemonade, mixers and fruit fl avoured carbonates.Brands outperformed private label on the backof promotional activity and as private labelcarbonates fell out of taste with consumers.With a consistent and recognisable taste profi le,branded carbonates offered an inexpensive treatto cash-strapped consumers.Diet colas performed better than regular variants,delivering consumers choice whether on themove or at leisure. Low and zero sugar carbonateshave paved the way forward in recent years– supported by a blend of industry ‘push’ andconsumer ‘pull’. Overall, carbonates continued todefy the prevailing economic conditions – furtherconfi rming the <strong>British</strong> consumers’ taste for fi zz.<strong>THE</strong> BRANDMANAGERI’m responsible for the management of theVimto brand in the <strong>UK</strong>, from developingmarketing strategy and plans that help togrow the brand, through to implementingthose plans.I’m the guardian of the brand and thereforelook after all our communication that isconsumer facing. This can include everythingfrom advertising, (whether on TV, radio,press or online) through to packaging,promotions, new product development andPR. It’s a really varied and exciting job andno two days are ever the same.We have just launched a cherry-flavouredextension to our brand. The product wasdeveloped on the back of extensive researchthat identified a huge opportunity and anoverwhelming positive response to ournew recipe. It’s been on the market sinceJanuary and sales are already exceeding ourexpectations.As part of every new product developmentproject we undertake, we always seekto minimise packaging waste as muchas possible. This can include a range ofmeasures, from reducing the weight of8 • The <strong>2010</strong> <strong>UK</strong> <strong>Soft</strong> <strong>Drinks</strong> Report
<strong>UK</strong> carbonates consumption, 2003 - 2009Million litres8000700060005000400030002000DEFINITION: CarbonatesReady to drink including draughtdispense; home dispense; regularincluding sparkling juice; low calorieand zero calorie; cola; lemonincluding lemonade; lemon-lime;mixers including tonic and bitterdrinks; orange; shandy; othersincluding other carbonated fruitfl avours, energy drinks, sparklingfl avoured water, health drinks andherbal drinks.100002003 2004Source: Zenith International20052006200720082009<strong>UK</strong> carbonates regularvs low calorie, 2009<strong>UK</strong> carbonatesflavours, 2009<strong>UK</strong> carbonatespackaging, 2009Regular 63%Low calorie 37%Cola 53%Fruit 14%Lemonade 14%Energy 6%Other 13%PET 57%Can 26%Dispense 11%Glass 3%Other 3%Source: Zenith InternationalSource: Zenith InternationalSource: Zenith InternationalPeople Profile:our PETbottles orusing partrecycledPET, toeliminatingtheneed forcardboardouter trays. Our pouch pack, which welaunched in 2009, is a perfect example ofthis. It is recyclable, uses less packagingmaterial and is lightweight (thus reducingtransport costs and carbon footprint).Understanding consumers and their needsis central to what we do as it enables usto develop the right products. Thereforewe use a variety of research techniques tocheck our consumers’ attitudes to healthand diet. We offer a range of Vimto productsto meet our customers’ needs, includinglower and no added sugar alternatives. And,through our R&D team and manufacturingpartners, maintain up to date information onnew ingredients coming to the market tohelp us continually improve our products.I don’t only have to think about newproducts but also new technologies. Theproliferation of media and the rise in useof digital technologies makes it easier andmore efficient to identify and engage targetaudiences for marketing, but the new mediahasn’t replaced the traditional media justyet. I therefore still need to use a mix ofmedia to reach audiences effectively formarketing and to provide information.Emma HuntBrand Manager : VimtoThe <strong>2010</strong> <strong>UK</strong> <strong>Soft</strong> <strong>Drinks</strong> Report • 9
<strong>UK</strong> dilutables consumption, 2003 - 2009DILUTABLES Year 2003 2004 2005 2006 2007 2008 2009Million litres 3175 3125 3100 3350 3350 3250 3350% change +4.1 -1.6 -0.8 +8.1 - -3.0 +3.1Litres per person 53.1 52.0 51.3 55.2 54.9 52.9 54.3% of all soft drinks 22.9 23.0 22.6 23.6 23.8 23.4 23.7Value, £ million 790 780 775 805 805 795 850% change +3.9 -1.3 -0.6 +3.9 - -1.2 +6.9Value per litre, £ 0.25 0.25 0.25 0.24 0.24 0.24 0.25Source: Zenith International54.3Dilutable litres perperson drunk in <strong>UK</strong>in 2009Consumption of dilute to taste drinksbounced back to 2007 levels withconsumed volume increasing by 3.1%to 3350 million litres in 2009. Theretail value enjoyed higher growth of6.9% to reach £850 million. Dilutablesretained their second place position inthe <strong>UK</strong> by volume consumed,remaining steady on 23.7% of the softdrink market.In a sector familiar with reinvigoration andrebranding, the wider introduction of doubleconcentrate dilutables, typically mixed nine partswater to one part squash, as opposed to fourparts water to one part squash, has been themost notable development. This added even moreaffordability to an already popular drink of choicefor value conscious consumers.Demand for new and ever more elaborate fl avourshas caused blends to increase their share of thedilutables market slightly. Favoured by adults andchildren alike, low and no added sugar dilutablesreached 70% of the sector delivering a low calorierefreshment on tap. In a sustained economicdownturn, dilutables remain concentrated in thehearts and minds of <strong>UK</strong> consumers.<strong>THE</strong> CATEGORYMANAGERMy role as a Britvic category manageris to work with one of Britain’s leadingsupermarkets to help them manage theirsoft drinks portfolio. I work with them toensure that soft drinks (wherever the shopperencounters the category) have the best andmost relevant offering.We base this on detailed research into howshoppers behave and what they want instore – it’s not just an aesthetic exercise. Thiscan inform many aspects of our relationshipwith our retailers: from high-level contact todrive category growth strategically throughto working in our retailer’s merchandisingcentres, where we have essentially a mockupshop with practice shelves where we canexperiment with different formats and layoutsto see what works. What you see when you gointo a supermarket doesn’t arise by accident –there’s a lot of careful planning behind it.We’re not the only soft drinks company towork like this – a number of the others alsohave category management teams and thereis a strong commercial rivalry between usall. We want to be the best strategic partnerfor the supermarkets providing the best andmost executable advice on anything to dowith soft drinks. This might be answeringdetailed questions about long-term strategies10 • The <strong>2010</strong> <strong>UK</strong> <strong>Soft</strong> <strong>Drinks</strong> Report
<strong>UK</strong> dilutables regular vslow calorie, 2009<strong>UK</strong> dilutables consumption, 2003 - 2009Million litres35003000250020001500100050002003 2004Source: Zenith International<strong>UK</strong> dilutablesflavours, 20092005200620072008<strong>UK</strong> dilutablespackaging, 20092009DEFINITION: DilutablesSquashes, cordials, powders andother concentrates for dilution totaste by consumers, normally adding4 parts water to 1 part product;high juice (minimum 40% fruitcontent as sold); regular includingsquashes and cordials (minimum25%); low sugar including no addedsugar and sugar free; (dilutables areexpressed as ready to drink for easeof comparison where measuringoverall soft drinks marketfi gures/shares).Low sugar / NAS 70%Regular 23%High juice 7%Source: Zenith InternationalBlends 51%Orange 29%Blackcurrant 11%Lemon 5%Lime 2%Others 2%Source: Zenith InternationalPlastic up to 1 litre 56%Plastic over 1 litre 35%Others 9%Source: Zenith InternationalPeople Profile:and markettrends orfinding outsimple factsthat thesupermarketwants toknow.Who benefitsfrom all this?Theshopper. We ewwant to makeiteasy forpeople to find the things they want in store,which means stocking the right products,arranging them so that people can easilyfind what they are looking for and promotingthem in the optimal way. That’s why we needthe research, to give us the best possibleknowledge of the marketplace and consumertrends. That way, we can help stores meetshoppers’ needs better.One recent project has been to rethink thestocking and presentation of drinks forchildren. Obviously, this is an area whichneeds particular care because we have gotto ensure that parents are able to make theright decisions on behalf of their children.We have a qualified nutritionist working withus to ensure that everything we do and sayis scientifically correct. Helping parents andteaching kids about the importance of abalanced diet is absolutely crucial.We want to make it easy for parents to makedecisions, and make the right decisions, onbehalf of their children. Part of that ismaking the shopping experience a bit morefun for the kids, too – that way, parents canfind it a bit easier to make the right choicesrather than being rushed into somethingwithout being able to think about it properly.The soft drinks industry is one of the fastestmoving parts of the FMCG sector, with newproducts and new ideas coming along all thetime. That means we’ve got to keep up withnew research and new advice for our partnersin the supermarkets. I suppose if there’s aphrase that sums up category management,its “inspiring shoppers by adapting to theirever-changing needs”.Chris StokesCategory Manager : BritvicThe <strong>2010</strong> <strong>UK</strong> <strong>Soft</strong> <strong>Drinks</strong> Report • 11
FRUIT JUICE& SMOOTHIES<strong>UK</strong> fruit juice consumption, 2003 - 2009Year 2003 2004 2005 2006 2007 2008 2009Million litres 1090 1130 1215 1305 1330 1285 1245% change +6.3 +3.7 +7.5 +7.4 +1.9 -3.4 -3.1Litres per person 18.2 18.8 20.1 21.5 21.8 20.9 20.1% of all soft drinks 7.9 8.3 8.9 9.2 9.5 9.2 8.8Value, £ million 1660 1675 1815 1960 1980 1900 1815% change +9.4 +0.9 +8.4 +8.0 +1.0 -4.0 -4.5Value per litre, £ 1.52 1.48 1.49 1.50 1.49 1.48 1.46Source: Zenith International<strong>UK</strong> smoothies consumption, 2003 - 2009Year 2003 2004 2005 2006 2007 2008 2009Million litres 19 22 33 52 75 60 40% change +11.8 +15.8 +50.0 +57.6 +44.2 -20.0 -34.2Litres per person 0.3 0.4 0.5 0.9 1.2 0.9 0.6% of all soft drinks 0.1 0.2 0.2 0.4 0.5 0.4 0.3Source: Zenith International8.8%FRUIT JUICES AS % OFTOTAL <strong>SOFT</strong> <strong>DRINKS</strong>The fruit juice category was the worstperforming sector of all soft drinks in2009, witnessing a 3.1% fall in volumeto 1245 million litres coupled with a4.5% drop in retail value to£1815 million.Worst affected were premium products, withconsumers trading down to cheaper alternatives.This led to strong growth of not from concentrate(NFC) ambient juice, albeit from a small base andat the expense of chilled NFC offerings. In a similarvein, branded juices suffered more than ownlabel. Smoothies, meanwhile, had a rough ride in2009 with sector volume suffering a double digitdecline against the economic backdrop.Apple juice and grapefruit juice experiencedsmall increases in their market sharebut orange remains the dominant fruitas both a single fl avour and as part ofblended choices.Health awareness and ongoing5-a-day messages should supportpure juice and smoothies in the future.As consumers feel more secure withthe money in their pockets, a fallingtrend should be reversed.<strong>THE</strong> GENERALMANAGERMy role as General Manager at Pepsi is toset a strategy and guide the business forthe long-term. For example, we have justlaunched, alongside our parent companyPepsiCo <strong>UK</strong>, a ten-year vision for futurebusiness growth and profitability to comefrom healthier products. As part of this, wehave committed to encouraging consumersto opt for healthier choices, with the goalthat by 2015, 65% of our can and bottlesales will come from no-sugar drinks.Central to achieving this goal, together withour bottling partner, we recently launchedthe <strong>UK</strong>’s first single-serve 600ml bottleacross our no-sugar range. Regular drinksremain in the standard 500ml bottles. Togive consumers further incentive to opt forno-sugar drinks, we’ve set the RRP for the600ml bottle at the same level as the 500mlformat, meaning that our no-sugar rangeoffers even greater value.Not only do we believe that the new strategywill play a role in helping encouragingconsumers transition to healthier options,we also believe that the new format willplay a role in unlocking the potential of theon-the-go market. The launch of the 600ml12 • The <strong>2010</strong> <strong>UK</strong> <strong>Soft</strong> <strong>Drinks</strong> Report
STILL & JUICE<strong>DRINKS</strong><strong>UK</strong> still and juice drinks consumption, 2003 - 2009Year 2003 2004 2005 2006 2007 2008 2009Million litres 985 1090 1190 1330 1370 1380 1390% change +11.3 +10.7 +9.2 +11.8 +3.0 +0.7 +0.7Litres per person 16.5 18.1 19.7 21.9 22.4 22.5 22.6% of all soft drinks 7.1 8.0 8.7 9.4 9.7 9.9 9.9Value, £ million 1215 1325 1440 1615 1670 1684 1685% change +11.5 +9.1 +8.7 +12.2 +3.4 +0.8 +0.1Value per litre, £ 1.23 1.22 1.21 1.21 1.22 1.22 1.21Source: Zenith International42%6 YEAR INCREASEIN SALES OF STILL& JUICE <strong>DRINKS</strong>Despite continued economicuncertainty across the country, stilland juice drinks experienced growth involume sales, up 0.7% to 1390 millionlitres, and retail value, up 0.1% to£1685 million.In line with other sectors, low calorie optionscontinued to increase their share at the expenseof regular variants. From 1 litre chilled juice drinksin retail, to still fl avoured water, sports drinks andother niche offerings, still and juice drinks tappedinto a consumer desire for healthier alternatives.Cartons moved ever closer to taking half of thetotal category share, as consumers reached outto stay-at-home options rather than going out topubs and restaurants. This effectively put a dentin sales of glass and other packaging types.Still and juice drinks continue to offer a perceivedhealthier option, deliver fl avour variety and benefi tfrom continual innovation, with products aimed atspecifi c segments and consumption occasions.From regular refreshment, to fun and functionality– the category performed strongly in the wake ofthe credit crunch.<strong>THE</strong> EDUCATIONCENTRE MANAGERI work as an Education Centre Manager forCoca-Cola Enterprises Ltd and am basedat our operations in North London wherewe host about 225 visits each year fromsecondary schools, colleges and universities.As well as a tour of our factory, visitingstudents enjoy activities and a presentationthat is tailored to support the curriculum. Allkinds of academic courses find an interestin what goes on here, including engineering,design and technology, and business studies.As a qualified teacher myself, I have agood understanding of how work-basedprogrammes can bring subjects to life and,typically, I will work with teachers to makethe experience as worthwhile for theirstudents as possible.In addition we run our Real BusinessChallenge as a competition between schoolsthat gets students to think about businessissues in an engaged and active way. Wehold regional finals where each student teamis allocated a business mentor, and peoplefrom sales, marketing and operations allget involved in helping. In this way we areengaging our employees as well as showing14 • The <strong>2010</strong> <strong>UK</strong> <strong>Soft</strong> <strong>Drinks</strong> Report
<strong>UK</strong> still and juice drinks consumption, 2003 - 2009Million litres15001200900DEFINITION: Still & juice drinksNectars (25-99% fruit content); juicedrinks (5-25% fruit content); otherstill drinks (0-5%) including iced tea,sports drinks, still fl avoured waterand non-fruit drinks.60030002003200420052006200720082009Source: Zenith International<strong>UK</strong> still and juicedrinks regular vs lowcalorie, 2009<strong>UK</strong> still and juice drinkcategories, 2009<strong>UK</strong> still and juice drinkpackaging, 2009Regular 57%Low calorie 43%Stills / juice drinks 63%Nectars 13%Still fl avoured water 14%Water 10%Carton 49%Plastic 25%Glass / other 27%Source: Zenith InternationalSource: Zenith InternationalSource: Zenith InternationalPeople Profile:studentsa bit moreabout whatworking lifeis really like.Of course,everyonehas heard ofour companybefore they take part in one of oureducational programmes, and often theyhave preconceived ideas about what wedo and what we are like, so it is reallyimportant that we can open our doors sothat they can see for themselves. We’re notsecretive – we’re really proud of what weare doing and what we have achieved.For example, a big part of what we haveto do is to show how a manufacturingindustry like ours can reduce the amountof resources it uses. Sometimes teacherssay they find it hard to bring environmentalissues to life, but a visit to our factorydemonstrates what can be done in a reallyvivid way. For instance, students learnabout how we have reduced our waterand energy usage and about our wastemanagement programme as well asinitiatives such as the Recycle Zones we aresetting up across the country. Improvingour environmental performance is anintegral part of what our company standsfor, and it is good to be able to show tostudents what this means in practice.Our investment in educational initiativesimproves the visibility of our operationsand, in doing so, helps build trust in ourbusiness and its products. Internally,educational initiatives can provide a usefulplatform for employee engagement and,hopefully, there is a broader benefit to theeconomy as the initiatives help to increaseemployability and outcomes in learners.Bill MuirheadEducation Centre Manager :Coca-Cola Enterprises LtdThe <strong>2010</strong> <strong>UK</strong> <strong>Soft</strong> <strong>Drinks</strong> Report • 15
SPORTS &ENERGY<strong>DRINKS</strong><strong>UK</strong> sports and energy drinks consumption, 2003 - 2009Year 2003 2004 2005 2006 2007 2008 2009Million litres 275 320 365 405 455 505 530% change +17.0 +16.4 +14.1 +11.0 +12.3 +11.0 +5.0Litres per person 4.6 5.3 6.0 6.7 7.5 8.2 8.6% of all soft drinks 2.0 2.4 2.7 2.9 3.2 3.6 3.8Sports drinks, million litres 75 85 95 110 125 135 140% change +36.4 +13.3 +11.8 +15.8 +13.6 +8.0 +3.7Litres per person 1.3 1.4 1.6 1.8 2.0 2.2 2.3% of all soft drinks 0.5 0.6 0.7 0.8 0.9 1.0 1.0Energy drinks, million litres 200 235 270 295 330 370 390% change +11.1 +17.5 +14.9 +9.3 +11.9 +12.1 +5.4Litres per person 3.3 3.9 4.5 4.9 5.4 6.0 6.3% of all soft drinks 1.4 1.7 2.0 2.1 2.3 2.7 2.8Source: Zenith International390MILLION LITRES OFENERGY <strong>DRINKS</strong>SOLD IN 2009Sports and energy drinks continued toshow growth in 2009, although at aslower rate than in previous years. Thecombined category raced ahead by 5%in volume to reach 530 million litres.This represents 8.6 litres per person,up from 8.2 litres in 2008.Sports drinks – comprised of isotonic, hypotonicand hypertonic drinks – and energy with glucoseand stimulant drink variants – saw their respectivesegment shares remain practically unchangedin 2009.Sports drinks are targeted at an array of sportingand outdoor pursuits – replenishing the ‘weekendwarrior’ through to the casual gym-goer. Energydrinks, which represent 74% of the combinedsports and energy category, continued to fl extheir muscle in 2009.Offering a solo or social pick-me-up, energy drinkshelped keep consumers alert whilst studying orbehind the wheel and provided a sales boostacross the <strong>UK</strong>’s pubs and clubs. Energy shots,delivering a concentrated energy dose, usuallypackaged in 50ml bottles, also proved successfulin 2009.Increasingly for everyday use, for a wide rangeof consumers and occasions, sports and energydrinks have forged a defi ned role. From energyshots, to brands targeting specifi c sports – this isa heartland area of innovation that is set to keepthe pulse racing in the years ahead.<strong>THE</strong>ENGINEERSWe are both trainees at A G Barr’sCumbernauld factory, and are justabout to enter into the final year of ourapprenticeships sponsored by the <strong>British</strong> <strong>Soft</strong><strong>Drinks</strong> Industry Foundation. (The BSDIFis an independent charity which supportseducation and learning within the food anddrink industry.)We work at the heart of the manufacturingprocess, supporting our line engineersand ensuring that the machines are keptin operation.We are responsible for fault-finding,diagnosing, repairing, maintaining andbringing back into service equipment that isused for producing our carbonated drinks.We have PET, glass and can lines. Our aimis to minimise the amount of downtime tomaximise production efficiency.During <strong>2010</strong>, we will be investing in newplant and equipment, with new machinesbeing introduced into our workplace toincrease efficiencies and boost output. Wehave to learn about this new kit to ensure itoperates at peak efficiency. This is how thecompany can keep pace with technological16 • The <strong>2010</strong> <strong>UK</strong> <strong>Soft</strong> <strong>Drinks</strong> Report
<strong>UK</strong> sports and energy drinks consumption, 2003 - 2009Million litres600500400300200100DEFINITION: Sports drinks<strong>Drinks</strong> that enhance physicalperformance before, during or afterphysical/sporting activity. Sportsdrinks replace fl uids and electrolytes/minerals lost by sweating and supplya boost of carbohydrate: isotonic(fl uid, electrolytes and 6 to 8%carbohydrate), hypotonic (fl uids,electrolytes and a low level ofcarbohydrate) and hypertonic (highlevel of carbohydrate).<strong>UK</strong> sports and energydrinks, 200902003 2004Source: Zenith International<strong>UK</strong> sports drinktypes, 20092005200620072008<strong>UK</strong> energy drinktypes, 20092009DEFINITION: Energy drinksTraditional glucose based energydrinks; functional or stimulationenergy drinks which claim aparticular energy boost from caffeine,guarana, taurine and ginseng orother herbs or some combination ofthese ingredients.Sports 26%Isotonic 91%Glucose 59%Energy 74%Hypotonic 9%Stimulant 41%Hypertonic
OUTLOOK &CONCLUSIONS<strong>UK</strong> soft drinks forecast, 2009 - 2014Year 2009 <strong>2010</strong> 2011 2012 2013 2014Million litres 14140 14235 14320 14795 14835 14910% change +1.7 +0.7 +0.6 +3.3 +0.3 +0.5Litres per person 229.1 229.4 229.6 235.9 235.3 235.3Source: Zenith InternationalThe green shoots of economic recoveryshould hopefully favour the soft drinksmarket and help it grow further inthe coming years. A cautious forecastfor a new government, coupled withuncertainty on consumer purchasingpower, should still see <strong>2010</strong> pass the14200 million litre barrier.With an Olympic year in 2012, the <strong>UK</strong> should bebolstered by in-bound tourism – whatever theweather. Presuming average weather conditionsin the intervening years to 2014, the marketcould reach close to 15000 million litres, withper person consumption hitting 235 litres.Healthier living and positive lifestyle changesshould once again be at the forefront of consumers’minds, should money pressures lessen.products, sustainability and ethical endeavourhave already helped to build engagement andconsumer loyalty.Tapping into the rapid evolution of onlinesocial networks and the opportunity for a moredirect dialogue with consumers, the pace ofchange within the soft drinks industry should beunrelenting. A fl urry of new product developmentshould be on the horizon – giving renewed vigourto the industry in the years ahead.<strong>UK</strong> soft drinks forecast, 2009 - 2014000 million litres15Innovation will continue to be of paramountimportance if companies are to offer somethingfor everyone, with products adding functionalbenefi ts to specifi c types of consumers as well asoffering value for money. All products will need toensure that any claims they make are scientifi callyproven, honest and true, as any innovation willneed to be trusted to succeed.14131211Corporate social responsibility is likely to reaffi rmits importance to consumers. For a number of102009<strong>2010</strong>2011201220132014Source: Zenith International18 • The <strong>2010</strong> <strong>UK</strong> <strong>Soft</strong> <strong>Drinks</strong> Report
About BSDAThe <strong>British</strong> <strong>Soft</strong> <strong>Drinks</strong> <strong>Association</strong> is the national trade associationrepresenting the collective interests of producers and manufacturers ofsoft drinks including carbonated soft drinks, still and dilutable drinks, fruitjuices and smoothies, and bottled waters.BSDA is based in central London with an experienced, professional staff andis governed by an Executive Council of directors elected from its members. Itprovides a central meeting point for the industry and a range of services tohelp the industry and its manufacturers to be at the leading edge.Main membership benefi ts include:• Information, advice and advance warning on all aspects ofthe industry, including technical standards, best practice andlegislation to ensure good compliance and planning• Participation in the development of Codes of Practiceand initiatives to promote the industry’s reputation anddemonstrate social responsibility• Assistance and advice on incident management• Inclusion in BSDA’s online listing of manufacturersand suppliers• Free access to the Members’ website with its information,advice and publications• A range of training courses tailored to the industry withsubstantial discounts for members• The opportunity to network with industry colleagues at BSDAmeetings and events and infl uence BSDA policy-makingThe <strong>British</strong> <strong>Soft</strong> <strong>Drinks</strong><strong>Association</strong> for:-• Media & public affairs• Regulatory issues• Sustainability• Education & skillsFor more information aboutBSDA and its activities contact<strong>British</strong> <strong>Soft</strong> <strong>Drinks</strong> <strong>Association</strong>20-22 Stukeley StreetLondonWC2B 5LRTelephone: +44 (0) 20 7430 0356Fax: +44 (0) 20 7831 6014Email: bsda@britishsoftdrinks.comWebsite: www.britishsoftdrinks.comThe <strong>2010</strong> <strong>UK</strong> <strong>Soft</strong> <strong>Drinks</strong> Report • 19
<strong>British</strong> <strong>Soft</strong> <strong>Drinks</strong> <strong>Association</strong>20-22 Stukeley StreetLondonWC2B 5LRTelephone: +44 (0) 20 7430 0356Fax: +44 (0) 20 7831 6014Email: bsda@britishsoftdrinks.comWebsite: www.britishsoftdrinks.com


