pdf full text - Rob Phillips Group - California Institute of Technology
pdf full text - Rob Phillips Group - California Institute of Technology
pdf full text - Rob Phillips Group - California Institute of Technology
- No tags were found...

You also want an ePaper? Increase the reach of your titles
YUMPU automatically turns print PDFs into web optimized ePapers that Google loves.
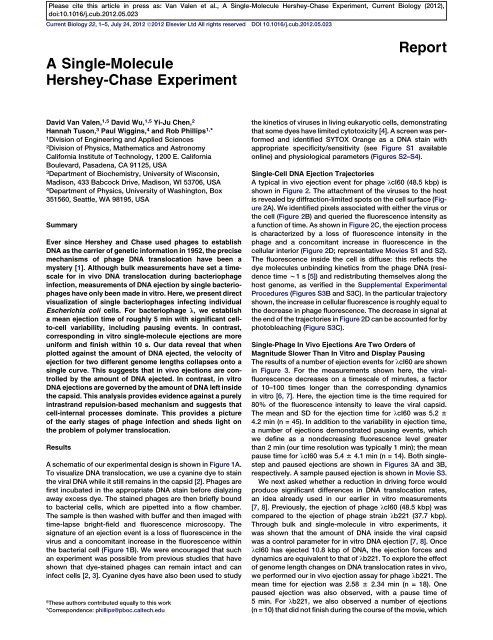
Please cite this article in press as: Van Valen et al., A Single-Molecule Hershey-Chase Experiment, Current Biology (2012),doi:10.1016/j.cub.2012.05.023Current Biology Vol 22 No 142Afluorescence intensityphage capsidcell interiorFigure 1. A Schematic for Monitoring DNA Translocation with Pre-EjectionLabeling(A) The DNA is stained while still in the capsid. During ejection, the phageDNA carries its complement <strong>of</strong> cyanine dye with it, transferring fluorescenceintensity from the virus to the cellular interior. Eventually, the dye falls <strong>of</strong>f thephage DNA and rebinds to the bacterium’s genome.(B) The timing <strong>of</strong> ejection is determined by measuring the loss <strong>of</strong> fluorescenceintensity from the capsid; the concomitant increase in intensity inthe cellular interior serves to verify that phage DNA has entered the cell.See also Figures S1–S3.we term a ‘‘stall.’’ Stalled ejections were not observed forlcI60. One possibility is that stalling events are related tolb221’s shorter genome and the consequent loss <strong>of</strong> a potentialbinding site that assists in entry. Stalled ejections were notincluded in the averages given earlier. The <strong>full</strong> set <strong>of</strong> trajectoriesfor lcI60 and lb221 are online at http://www.rpgroup.caltech.edu/publications.An Ensemble View <strong>of</strong> In Vivo Ejection Shows that theAmount <strong>of</strong> DNA in the Viral Capsid Is Not the GoverningControl ParameterMeasurements on both the wild-type and shortened genomesprovide an opportunity to quantitatively examine the DNAtranslocation kinetics. One quantity <strong>of</strong> interest is the firstpassagetime for ejection: for each trajectory, we extractedBtthe first-passage time for 20%, 50%, and 80% <strong>of</strong> completion,as determined by the decrease in the starting phage fluorescence.The first-passage time distributions for lcI60 andlb221 are shown in Figure 4A. By taking the mean <strong>of</strong> this distribution,we obtain the mean first-passage time (Figure 4B). Wenote that the mean first-passage time is a quantity that isamenable to theoretical calculations [9]. Another way to viewthe mean first-passage time is as an ‘‘average’’ ejection trajectory.When viewed in this way, one interpretation <strong>of</strong> Figure 4Bis that, within the error <strong>of</strong> the measurement, the ‘‘average’’trajectories for lcI60 and lb221 have considerable overlap.For both lcI60 and lb221, the velocities plateau after w50%<strong>of</strong> the genome length (Figures 4C and 4D).We also plotted the mean velocity at different amounts<strong>of</strong> DNA remaining in the capsid during an ejection (Figure4C). There is little overlap between the two curves, andfor lower amounts <strong>of</strong> DNA remaining in the capsid, the velocityfor lb221 is higher than lcI60. This is to be contrastedwith in vitro measurements where there is significant overlapbetween the two curves, with the ‘‘data collapse’’ in thatcase signifying that the dynamics are equivalent after lcI60has ejected its first 10.8 kbp [7]. An alternative way to visualizethese data is to plot the mean velocity versus the amount <strong>of</strong>DNA ejected into the cell (Figure 4D). When plotted in thisfashion, there is considerable overlap between the two curves,with a small difference observed for the first 20 kbp <strong>of</strong> ejection.This analysis is consistent with the mean first-passage timeanalysis, which showed considerable overlap when the firstpassagetime was also plotted against the amount <strong>of</strong> DNAejected.DiscussionFor bacterial viruses, genome delivery is at the heart <strong>of</strong> the virallife cycle, yet this critical process remains enigmatic as doesthe in vivo process <strong>of</strong> polymer translocation more generally.Beyond a purely intellectual understanding <strong>of</strong> this process,phage-mediated transfer <strong>of</strong> nucleic acids has medical andevolutionary implications [10–13]. Our objective was to designand perform an experiment with sufficient temporal resolutionthat would permit us to measure single-molecule DNA transferAC0 min 2 min 4 minejection startsD300250Fluorescence vs. TimeCell SignalPhage SignalBnon-ejecting6 min 8 min 10 minFluorescence (au)20015010012 min 14 min 16 min50ejecting00 5 10 15 20 25 30Time (minutes)Figure 2. Dynamics <strong>of</strong> DNA Ejection(A) Viruses attached to the cell surface in this fluorescence image merged with its bright-field counterpart.(B) Segmentation masks <strong>of</strong> the cell (white), the phage that ejects its DNA (green), and the phages that do not eject their DNA (red).(C) Time sequence <strong>of</strong> the fluorescence in the cell is shown. The edge <strong>of</strong> the cell is outlined for reference.(D) Fluorescence intensity as a function <strong>of</strong> time is presented. The intensity <strong>of</strong> the phage segmented region and the cell segmented region are each plottedseparately. The fluorescence intensity inside the nonejecting phage mask is stable; this is shown in Figure S4A. Note that in this ejection there appear to besteps and pauses.The scale bars in (A) and (C) are 2 mm.
Please cite this article in press as: Van Valen et al., A Single-Molecule Hershey-Chase Experiment, Current Biology (2012),doi:10.1016/j.cub.2012.05.023A Single-Molecule Hershey-Chase Experiment3AAmount <strong>of</strong> DNA in the capsid (kbp)BAmount <strong>of</strong> DNA in the capsid (kbp)5040302010Single−Step Ejections00 5 10 15Paused Ejections5040302010Cell SignalPhage Signal00 5 10 15 20Time (minutes)Figure 3. Ejection Trajectories from Single-Cell Infections for lcI60The red trajectories show the time history <strong>of</strong> the DNA intensity within thevirus, and the blue trajectories show the concomitant increase in the fluorescencein the cellular interior. The solid-red color highlights a characteristicejection, and the lighter-red color displays other ejection events for reference.The conversion between arbitrary units and kilobase pairs (kbp) wasdone by first subtracting each trace’s minimum observed fluorescencefrom itself. Each trace was then normalized by the maximum drop in thephage fluorescence and then multiplied by the genome length, which is48.5 kbp for lcI60. Only two representative traces for the intensity withinthe cell are shown, with the remaining trajectories available online. Multiplelysate preparations from a single stock <strong>of</strong> CsCl-purified phages were usedwith similar results.(A) Trajectories displaying a rapid and continuous ejection are illustrated.(B) Trajectories that exhibit pausing events are demonstrated.See also Figures S3 and S4.in real time; we accomplished this for both WT (48.5 kbp) andmutant (37.7 kbp) l phage using SYTOX Orange and fluorescencemicroscopy. These experiments reveal that the DNAtranslocation process is subject to strong cell-to-cell variability(1–20 min). A number <strong>of</strong> ejections also exhibited pausesand stalls. Our single-molecule measurements are consistentwith earlier estimates <strong>of</strong> a minute timescale for in vivo genomedelivery <strong>of</strong> phage l from bulk experiments [14, 15].A number <strong>of</strong> different hypotheses have been formulated forthe actual translocation mechanism for phage l. In addition tothe driving force due to the packaged DNA, these modelspropose that thermal fluctuations, hydrodynamic drag, andactive molecular motors might each play a role in bringingthe viral DNA into the bacterial cell [9, 15–18]. Our resultsprovide both surprises and useful insights that constrain thespace <strong>of</strong> possible models and will guide future modelingefforts. One key result is that the length <strong>of</strong> DNA remaininginside the capsid is not the sole control parameter that governsthe ejection dynamics, as it is in vitro. In the in vitro experiments,the approximate collapse <strong>of</strong> the data from the differentgenome lengths on a single curve revealed that the DNA withinthe capsid is driving the kinetics <strong>of</strong> ejection [7, 8]. By way<strong>of</strong> contrast, in the in vivo ejection experiments reported here,an approximate data collapse is only revealed when thevelocity is plotted with respect to how much DNA is out <strong>of</strong>the capsid and in the cell rather than how much DNA remainswithin the capsid. Data collapse has been previously used toidentify control parameters for in vitro DNA ejection as wellas the lysis-lysogeny decision [7, 8, 19].No collapse is seen when the velocity is plotted against theamount <strong>of</strong> DNA remaining inside the capsid. This has significantimplications for the role energy stored in the compactedDNA plays during the in vivo ejection. If some significantportion <strong>of</strong> the ejection process were governed solely by theenergy in the compacted DNA, then during that portion wewould expect the dynamics <strong>of</strong> lcI60 and lb221 to be identicalwhen the amount <strong>of</strong> DNA remaining in the capsid is identical.This is the in vitro case as studied in [7, 8]. Because theDNA-DNA repulsion inside the capsid is highest when thecapsid contains more DNA, such a period would likely be atthe beginning <strong>of</strong> the ejection process. As seen in Figure 4C,however, there exists no period <strong>of</strong> overlap between thevelocity curves for the two phage strains and, hence, no periodduring the ejection process where the length <strong>of</strong> DNA in thecapsid and, hence, intrastrand repulsion, is the sole controlparameter. Two-step models in which the first half <strong>of</strong> thegenome is delivered by the energy stored in the compactedDNA and the remainder is delivered by another mechanismare also not consistent with our data.Another consequence <strong>of</strong> the data collapse (Figure 4D) is thepossibility that the amount <strong>of</strong> DNA ejected (as opposed to theamount <strong>of</strong> DNA in the capsid) is a key control parameter for thissystem. This picture is consistent with models in which themechanism is internal to the cell because the only informationsuch a mechanism would utilize is the amount <strong>of</strong> DNA that hasbeen brought inside the cell. One limitation to applying thisargument is that only two genome lengths have been testedhere. Such reasoning also does not exclude a mixed picture,as mentioned above.The origin <strong>of</strong> the apparent pauses might provide informationabout the ejection mechanism, because DNA-based motorsacting against a load have been observed to pause [20, 21].However, the pauses observed here are much longer thanthe pauses observed for motors, and it is possible that theycould simply be a reflection <strong>of</strong> the cell-to-cell variabilityin turgor pressure. Postpause resuming <strong>of</strong> DNA entry couldthus indicate a secondary mechanism in conjunction withpressure, for high turgor cells. Another possibility is that thepauses observed here might also be related to mechanismsproposed for pauses observed in vitro for phage T5 [22, 23].However, this is unlikely because pauses are not observedfor phage l in vitro [6, 7].Our results are contrary to what was shown in T7, in which aconstant DNA ejection rate was seen with bulk measurements