Jupiter Merlin Portfolios - Jupiter Asset Management
Jupiter Merlin Portfolios - Jupiter Asset Management
Jupiter Merlin Portfolios - Jupiter Asset Management
- No tags were found...
Create successful ePaper yourself
Turn your PDF publications into a flip-book with our unique Google optimized e-Paper software.
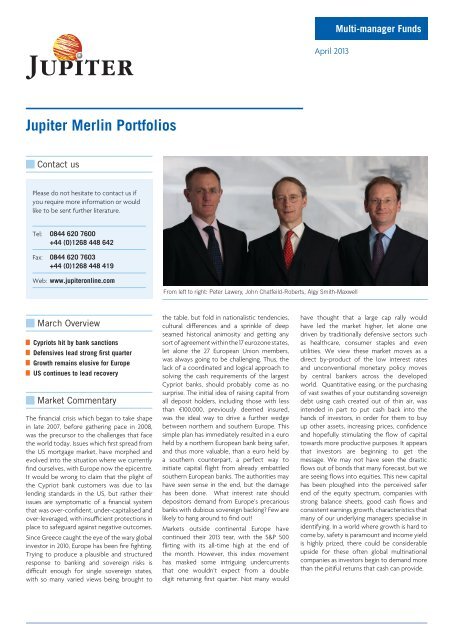
April 2013Multi-manager Funds<strong>Jupiter</strong> <strong>Merlin</strong> <strong>Portfolios</strong>Contact usPlease do not hesitate to contact us ifyou require more information or wouldlike to be sent further literature.Tel: 0844 620 7600+44 (0)1268 448 642Fax: 0844 620 7603+44 (0)1268 448 419Web: www.jupiteronline.comFrom left to right: Peter Lawery , John Chatfeild-Roberts , Algy Smith-MaxwellMarch OverviewCypriots hit by bank sanctionsDefensives lead strong fi rst quarterGrowth remains elusive for EuropeUS continues to lead recoveryMarket CommentaryThe financial crisis which began to take shapein late 2007, before gathering pace in 2008,was the precursor to the challenges that facethe world today. Issues which first spread fromthe US mortgage market, have morphed andevolved into the situation where we currentlyfind ourselves, with Europe now the epicentre.It would be wrong to claim that the plight ofthe Cypriot bank customers was due to laxlending standards in the US, but rather theirissues are symptomatic of a financial systemthat was over-confident, under-capitalised andover-leveraged, with insufficient protections inplace to safeguard against negative outcomes.Since Greece caught the eye of the wary globalinvestor in 2010, Europe has been fire fighting.Trying to produce a plausible and structuredresponse to banking and sovereign risks isdifficult enough for single sovereign states,with so many varied views being brought tothe table, but fold in nationalistic tendencies,cultural differences and a sprinkle of deepseamed historical animosity and getting anysort of agreement within the 17 eurozone states,let alone the 27 European Union members,was always going to be challenging. Thus, thelack of a coordinated and logical approach tosolving the cash requirements of the largestCypriot banks, should probably come as nosurprise. The initial idea of raising capital fromall deposit holders, including those with lessthan €100,000, previously deemed insured,was the ideal way to drive a further wedgebetween northern and southern Europe. Thissimple plan has immediately resulted in a euroheld by a northern European bank being safer,and thus more valuable, than a euro held bya southern counterpart, a perfect way toinitiate capital flight from already embattledsouthern European banks. The authorities mayhave seen sense in the end, but the damagehas been done. What interest rate shoulddepositors demand from Europe’s precariousbanks with dubious sovereign backing? Few arelikely to hang around to find out!Markets outside continental Europe havecontinued their 2013 tear, with the S&P 500flirting with its all-time high at the end ofthe month. However, this index movementhas masked some intriguing undercurrentsthat one wouldn’t expect from a doubledigit returning first quarter. Not many wouldhave thought that a large cap rally wouldhave led the market higher, let alone onedriven by traditionally defensive sectors suchas healthcare, consumer staples and evenutilities. We view these market moves as adirect by-product of the low interest ratesand unconventional monetary policy movesby central bankers across the developedworld. Quantitative easing, or the purchasingof vast swathes of your outstanding sovereigndebt using cash created out of thin air, wasintended in part to put cash back into thehands of investors, in order for them to buyup other assets, increasing prices, confidenceand hopefully stimulating the flow of capitaltowards more productive purposes. It appearsthat investors are beginning to get themessage. We may not have seen the drasticflows out of bonds that many forecast, but weare seeing flows into equities. This new capitalhas been ploughed into the perceived saferend of the equity spectrum, companies withstrong balance sheets, good cash flows andconsistent earnings growth, characteristics thatmany of our underlying managers specialise inidentifying. In a world where growth is hard tocome by, safety is paramount and income yieldis highly prized, there could be considerableupside for these often global multinationalcompanies as investors begin to demand morethan the pitiful returns that cash can provide.
April 2013Multi-manager Funds<strong>Jupiter</strong> <strong>Merlin</strong> <strong>Portfolios</strong>OutlookEurope, and to a lesser extent the UK, remainin very challenging macro-economic positions.The significant burden of sovereign debt seenacross the region, when married up with thehuge social security obligations that havebuilt up over time, has left Europe with aheavy yoke, making the uphill struggle backto prosperity even more difficult, painful andtime-consuming than many had foreseen.Those who thought that the world hadrecovered from its troubles are sadly mistakenand we could be some years and a largeamount of political upheaval away from timesone might class as ‘normal’.Fortunately however, the European subcontinentis not an island and is instead partof a now highly globalised world, allowingcompanies to reach for growth whereverit can be found. One particular bright spotwhich we have favoured previously, and stillbelieve is set to shine for some time to come,is the United States. Having let the housingmarket plummet and find clearing prices, ithas now regained traction having risen over7% in aggregate during 2012. This increase inhouse prices has a multiplier effect, bringingmany out of negative equity, increasingconfidence and spurring on house building,which itself increases employment, stimulatescredit growth and creates consumer demand.Add into the melting pot cheap energy fromshale reserves, a recapitalised banking systemready to provide finance and a culture ofentrepreneurialism, and we can see scope forgrowth. This has to some degree been pricedin by the market so far this year, with the USDollar rallying strongly versus Sterling and, to alesser extent, against the Euro, but we remainhappy holders of our significant weighting toUS Equities and the US Dollar.The world we are faced with is one wheremanipulation abounds, bond yields areextremely low, cash pays nothing and inflationconcerns lurk around the corner. Add to thisthe undoubtedly huge cash piles sitting onthe side lines and a thirst for both yield andreal return, then one could create a prettybullish view for equities. The flows we haveseen into equities in the first quarter of theyear may be but the tip of the iceberg. If themacro-economic picture was a little rosier,then 2013 could be quite the vintage year. Weare structurally long equities across the <strong>Jupiter</strong><strong>Merlin</strong> <strong>Portfolios</strong>, but retain a keen eye ondownside protection, favouring the securityof solid balance sheets, cash flows and inmany cases dividend yields. We have alwaysviewed risk not as market volatility but as thepermanent loss of capital. This may be a timewhen embracing some volatility will providehandsome rewards for the patient, sensibleand opportunistic investor.Thank you for your continued support.<strong>Jupiter</strong> Independent Funds TeamTeam AwardsWINNERBest Multi <strong>Asset</strong> ProviderHONOURS 2011
Multi-manager FundsAs at 31.03.2013Fund Value:£4,696 mLaunch Date 14.09.92April 2013<strong>Jupiter</strong> <strong>Merlin</strong> Income PortfolioObjective †To achieve a high and rising income with somepotential for capital growth by investingpredominantly in unit trusts, OEICs, ExchangeTraded Funds and other collective investmentschemes across several management groups. Theunderlying funds invest in equities, fixed intereststocks, commodities and property, principally inthe UK.Fund FactsIMA Sector** Mixed Investment 20-60% SharesSedol codes 0362937 (Acc) 0362948 (Inc)B4N2L74 (I Acc) B6QMDC4 (I Inc)Unit typeIncome & Accumulation unitsQuoted spread max (Inc/Acc) 6.25%Historic yield (Inc) 3.1%Historic yield (Acc) 3.1%Historic yield (I Inc) 3.1%Historic yield (I Acc) 3.1%XD date 16/1 16/4 16/7 16/10Payment date 15/3 15/6 15/9 15/12Holdings – As at 31.03.2013UK Equities 31.5%Artemis IncomeInvesco Perpetual High IncomeInvesco Perpetual Income<strong>Jupiter</strong> Income Trust<strong>Jupiter</strong> UK Special SituationsFixed Interest 34.5%<strong>Jupiter</strong> Strategic BondKames High Yield BondLiontrust Global Strategic BondM&G Strategic Corporate BondThreadneedle Emerging Market BondOther 32.5%ETF Securities - Physical Gold ETFFirst State Asian Equity PlusM&G Global DividendNewton Asian IncomeCash* 1.5%100%* This includes an unrealised loss of -0.01% made from positions hedgingexchange rate fluctuations.**Investment <strong>Management</strong> AssociationThe Historic Yield reflects distributions paid or declared over the pasttwelve months as a percentage of the mid-market unit price as at thedate shown. It does not include any initial charge and investors may besubject to tax on their distributions.All of the Fund’s expenses are charged to capital. This has had the effectof increasing the distributions paid on an annualised basis on RetailUnits by up to 1.72% of the class’ average Net <strong>Asset</strong> Value and constrainingthe class’ capital performance to an equivalent extent.Ratings/AwardsFor further explanations of terms and ratings please also visitthe glossary in the help section of our website:www.jupiteronline.comPerformance – As at 31.03.20135 year percentage change and sector ranking to 31.03.2013Position in Percentage Quartilesector growth rankingPerformance 5/90 47.2% 15 year performance vs IMA Mixed Investment 20-60% Shares sector average50%40%<strong>Jupiter</strong> <strong>Merlin</strong> Income PortfolioIMA Mixed Investment 20-60% SharesYear on Year % Growth ending 31.03.201308-09 09-10 10-11 11-12 12-13PercentageGrowth -11.4% 31.0% 5.5% 4.9% 14.7%Rank 25/90 46/117 69/129 17/146 11/153Percentage Change30%20%10%0%-10%Source: FE, bid to bid, net income reinvested.All performance in this factsheet is based on accumulation units in GBP.†With effect from 17th July 2006.Past performance should not be seen as a guide to future performance.-20%Mar 08 Mar 09 Mar 10 Mar 11 Mar 12 Mar 13Source: FE , bid to bid, net income reinvested.
Multi-manager FundsAs at 31.03.2013Fund Value:£1,551 mLaunch Date 01.10.02April 2013<strong>Jupiter</strong> <strong>Merlin</strong> Balanced PortfolioObjective †Holdings – As at 31.03.2013Ratings/AwardsTo achieve long-term capital growth withincome by investing predominantly in unittrusts, OEICs, Exchange Traded Funds and othercollective investment schemes across severalmanagement groups. The underlying funds investin international equities, fixed interest stocks,commodities and property.Fund FactsIMA Sector** Mixed Investment 40-85% SharesSedol codes 3184514 (Acc) 3191075 (Inc)B4351D9 (I Acc) B3X5X81 (I Inc)Unit typeIncome & Accumulation unitsQuoted spread max (Inc/Acc) 6.25%Historic yield (Inc) 2.1%Historic yield (Acc) 2.1%Historic yield (I Inc) 2.1%Historic yield (I Acc) 2.1%XD date 01/6 01/12Payment date 31/7 31/1UK Equities 25.8%Artemis IncomeAXA Framlington UK Select OppsInvesco Perpetual Income<strong>Jupiter</strong> Growth & IncomeUS Equities 12.6%Findlay Park American<strong>Jupiter</strong> North American IncomeEuropean Equities 5.1%Threadneedle European SelectJapanese Equities 2.2%<strong>Jupiter</strong> Japan IncomeFar East Equities 15.3%First State Asian Equity PlusPrusik Asian Equity IncomeFixed Interest 13.6%JGF - <strong>Jupiter</strong> Dynamic Bond<strong>Jupiter</strong> Strategic BondKames High Yield BondThreadneedle Emerging Market BondOther 23.2%ETF Securities - Physical Gold ETFFindlay Park Latin AmericanFundsmith EquityM&G Global DividendCash* 2.2%100%* This includes an unrealised loss of -0.01% made from positions hedging**Investment <strong>Management</strong> Associationexchange rate fluctuations.The Historic Yield reflects distributions paid or declared over the past twelve months as a percentage of the mid-market unit price as at the dateshown. It does not include any initial charge and investors may be subject to tax on their distributions.With effect from 1 December 2005 all of the Fund’s expenses have been charged to capital. This has had the effect of increasing the distributions paidon an annualised basis on Retail Units by up to 2.41% of the class’ average Net <strong>Asset</strong> Value and constraining the class’ capital performance to anequivalent extent.For further explanations of terms and ratings please also visitthe glossary in the help section of our website:www.jupiteronline.comPerformance – As at 31.03.20135 year percentage change and sector ranking to 31.03.20135 year performance vs IMA Mixed Investment 40-85% Shares sector averagePosition in Percentage Quartilesector growth rankingPerformance 7/99 46.5% 1Year on Year % Growth ending 31.03.201308-09 09-10 10-11 11-12 12-13PercentageGrowth -14.1% 35.7% 6.2% 2.2% 15.9%Rank 10/99 68/115 81/126 26/137 12/143Percentage Change50%40%30%20%10%0%-10%-20%<strong>Jupiter</strong> <strong>Merlin</strong> Balanced PortfolioIMA Mixed Investment 40-85% SharesSource: FE, bid to bid, net income reinvested.All performance in this factsheet is based on accumulation units in GBP.†With effect from 17th July 2006.Past performance should not be seen as a guide to future performance.-30%Mar 08 Mar 09 Mar 10 Mar 11 Mar 12 Mar 13Source: FE, bid to bid, net income reinvested.
Multi-manager FundsAs at 31.03.2013Fund Value:£1,913 mLaunch Date 14.09.92April 2013<strong>Jupiter</strong> <strong>Merlin</strong> Growth PortfolioObjective †To achieve long-term capital growth by investingpredominantly in unit trusts, OEICs, ExchangeTraded Funds and other collective investmentschemes across several management groups. Theunderlying funds invest in international equities,fixed interest stocks, commodities and property,with a core in the UK.Fund FactsIMA Sector**Sedol codesUnit typeFlexible Investment0362926 (Acc) 0362915 (Inc)B6QGLF5 (I Acc)Income & Accumulation unitsQuoted spread max (Inc/Acc) 6.25%XD date 01/3 01/9Payment date 30/4 31/10**Investment <strong>Management</strong> AssociationHoldings – As at 31.03.2013UK Equities 33.1%AXA Framlington UK Select OppsCazenove - UK OpportunitiesInvesco Perpetual Income<strong>Jupiter</strong> Growth & Income<strong>Jupiter</strong> UK Special SituationsUS Equities 24.7%AXA Framlington American GrowthFindlay Park AmericanHermes US SMID Equity Fund<strong>Jupiter</strong> North American IncomeEuropean Equities 7.6%Threadneedle European SelectJapanese Equities 4.5%CF Morant Wright Japan B<strong>Jupiter</strong> Japan IncomeFar East Equities 13.6%First State Asia Pacific Leaders BOther 15.1%ETF Securities - Physical Gold ETFFindlay Park Latin AmericanMorgan Stanley Global BrandsCash* 1.4%100%Ratings/AwardsFor further explanations of terms and ratings please alsovisit the glossary in the help section of our website:www.jupiteronline.com* This includes an unrealised loss of -0.01% made from positions hedgingexchange rate fluctuations.Performance – As at 31.03.20135 year percentage change and sector ranking to 31.03.2013Position in Percentage Quartilesector growth rankingPerformance 6/90 49.9% 1Year on Year % Growth ending 31.03.201308-09 09-10 10-11 11-12 12-13PercentageGrowth -13.5% 37.5% 9.3% 1.2% 14.0%Rank 13/90 69/107 30/114 25/124 45/129Source: FE, bid to bid, net income reinvested.All performance in this factsheet is based on accumulation units in GBP.†With effect from 17th July 2006.Past performance should not be seen as a guide to future performance.5 year performance vs IMA Flexible Investment sector averagePercentage Change60%50%40%30%20%10%0%-10%-20%<strong>Jupiter</strong> <strong>Merlin</strong> Growth PortfolioIMA Flexible Investment-30%Mar 08 Mar 09 Mar 10 Mar 11 Mar 12 Mar 13Source: FE, bid to bid, net income reinvested.
Multi-manager FundsAs at 31.03.2013Fund Value:£870 mLaunch Date 17.06.93April 2013<strong>Jupiter</strong> <strong>Merlin</strong> Worldwide PortfolioObjective †To achieve long-term capital growth by investingpredominantly in unit trusts, OEICs, ExchangeTraded Funds and other collective investmentschemes across several management groups. Theunderlying funds invest in international equities,fixed interest stocks, commodities and property.Fund FactsIMA Sector*Sedol codesUnit typeGlobal3166783 (Acc) 0369983 (Inc)B53LG95 (I Acc)Income & Accumulation unitsQuoted spread max (Inc/Acc) 6.25%XD date 01/6Payment date 31/7*Investment <strong>Management</strong> AssociationHoldings – As at 31.03.2013US Equities 31.1%Findlay Park AmericanHermes US SMID Equity FundJGF - <strong>Jupiter</strong> North American EquitiesEuropean Equities 11.8%JGF - <strong>Jupiter</strong> European OpportunitiesThreadneedle European SelectJapanese Equities 9.6%CF Morant Wright Japan BJGF - <strong>Jupiter</strong> Japan SelectFar East Equities 17.4%First State Asia Pacific Leaders BOther 29.5%ETF Securities - Physical Gold ETFFindlay Park Latin AmericanFundsmith Equity<strong>Jupiter</strong> Global EnergyCash 0.6%100%Ratings/AwardsFor further explanations of terms and ratings please alsovisit the glossary in the help section of our website:www.jupiteronline.comPerformance – As at 31.03.20135 year percentage change and sector ranking to 31.03.2013Position in Percentage Quartilesector growth rankingPerformance 44/181 48.2% 1Year on Year % Growth ending 31.03.201308-09 09-10 10-11 11-12 12-13PercentageGrowth -12.8% 37.3% 9.8% -0.6% 13.6%Rank 13/181 164/196 59/208 85/224 174/243Source: FE, bid to bid, net income reinvested.All performance in this factsheet is based on income units in GBP.†With effect from 17th July 2006.Past performance should not be seen as a guide to future performance.5 year performance vs IMA Global sector averagePercentage Change50%40%30%20%10%0%-10%-20%<strong>Jupiter</strong> <strong>Merlin</strong> Worldwide PortfolioIMA Global-30%Mar 08 Mar 09 Mar 10 Mar 11 Mar 12 Mar 13Source: FE, bid to bid, net income reinvested.
Multi-manager FundsAs at 31.03.2013Fund Value:£18 mLaunch Date 28.09.12April 2013<strong>Jupiter</strong> <strong>Merlin</strong> Conservative PortfolioObjectiveTo achieve long term capital growth withincome by investing predominantly in in unittrusts, OEICs, Exchange Traded Funds and othercollective investment schemes across severalmanagement groups (where the underlyingfunds invest in fixed interest stocks, equities,commodities and property internationally); anddirectly in international fixed interest securities(including investment grade bonds, high yieldbonds, government bonds, preference shares andconvertible bonds), together with cash depositsand money market instruments.Fund FactsIMA Sector** Mixed Investment 0-35% SharesSedol codes B8GDMB3 B8GDMD5B8GDLS3 (I Acc) B8GDLV6 (I Inc)Unit typeIncome & Accumulation unitsQuoted spread max (Inc/Acc) 6.25%Historic yield (Inc) 3.5%Historic yield (Acc) 3.5%Historic yield (I Inc) 3.5%Historic yield (I Acc) 3.5%XD date 01/12 01/03 01/06 01/09Payment date 31/01 30/04 31/07 31/10Holdings – As at 31.03.2013UK Equities 15.6%Invesco Perpetual High Income<strong>Jupiter</strong> UK Special SituationsFixed Interest 59.1%CG Dollar Portfolio<strong>Jupiter</strong> Corporate Bond<strong>Jupiter</strong> Strategic BondKames High Yield BondLiontrust Global Strategic BondThreadneedle Emerging Market BondOther 19.0%ETF Securities - Physical Gold ETFM&G Global DividendMorgan Stanley Global BrandsNewton Asian IncomeCash* 6.3%100%* This includes an unrealised loss of -0.01% made from positions hedgingexchange rate fluctuations.**Investment <strong>Management</strong> AssociationThe Historic Yield reflects distributions paid or declared over the pasttwelve months as a percentage of the mid-market unit price as at thedate shown. It does not include any initial charge and investors may besubject to tax on their distributions.All of the Fund’s expenses are charged to capital. This will have theeffect of increasing the distributions paid on an annualised basis onRetail Units by up to 2.00% of the class’ average Net <strong>Asset</strong> Value andconstraining the class’ capital performance to an equivalent extent. .Ratings/AwardsFor further explanations of terms and ratings please also visitthe glossary in the help section of our website:www.jupiteronline.comImportant Information:Due to the <strong>Jupiter</strong> <strong>Merlin</strong> Conservative Portfolio’s recent launch, past performance data will not be available until the fund has been running for a year.
April 2013Multi-manager Funds<strong>Jupiter</strong> <strong>Merlin</strong> <strong>Portfolios</strong>Fund <strong>Management</strong> TeamJohn Chatfeild-Roberts is head of the <strong>Jupiter</strong> <strong>Jupiter</strong> Independent Funds Team and is a Main Board Directorof <strong>Jupiter</strong>. Peter Lawery joined John in 1997 and Algy Smith-Maxwell completed the team in 1999.ChargesInitialchargeInitial chargeI Classes AMCAMC IClassesOngoingchargesOngoing chargesI Classes<strong>Jupiter</strong> <strong>Merlin</strong> Balanced 5.25% 0.00% 1.50% 0.75% 2.41% 1.66%<strong>Jupiter</strong> <strong>Merlin</strong> Conservative* 5.25% 0.00% 1.25% 0.50% 2.00% 1.25%<strong>Jupiter</strong> <strong>Merlin</strong> Growth 5.25% 0.00% 1.50% 0.75% 2.56% 1.81%<strong>Jupiter</strong> <strong>Merlin</strong> Income 5.25% 0.00% 1.50% 0.75% 2.36% 1.61%<strong>Jupiter</strong> <strong>Merlin</strong> Worldwide 5.25% 0.00% 1.50% 0.75% 2.56% 1.81%*Estimated OCF. Ongoing charges figures inlcude the Annual <strong>Management</strong> Charge.Regular withdrawal facilityThis is available for all the <strong>Jupiter</strong> <strong>Merlin</strong> <strong>Portfolios</strong> with a minimum lump sum investment of £5,000per portfolio. You can choose the amount paid to you each month or quarterly. Any such withdrawalswhich exceed investment returns will result in an erosion of capital.Enhanced ReportingWe provide in-depth reporting tokeep you informed, not confused.Portfolio statements include Manager’sCommentary as at 5 April and 5 Octoberplus six monthly Manager’s Reports.Minimum Investments*Lump sum Top-up MonthlyUnit Trust £500 £250 £50ISA investment £500 £250 £50Initial Investment I Classes £5,000,000* RWF not available under £5,000 for investments inthe <strong>Jupiter</strong> <strong>Merlin</strong> <strong>Portfolios</strong>. For more informationvisit www.jupiteronline.comRisksPast performance should not be seen as a guide to future performance. The value of an investment and the income from it may fall as well as riseand may be affected by exchange rate variations and you may not get back the amount invested. Charges tend to be higher than for conventionalUnit Trusts to allow for a portion of the charges applicable to underlying funds. On average this works out at around 0.7% of the net asset value perannum. These funds can invest more than 35% of their value in securities issued or guaranteed by an EEA state. The NURS Key Investor InformationDocument (KIID), Supplementary Information Document (SID) and Scheme Particulars are available from <strong>Jupiter</strong> on request.3rd Party LinksThe <strong>Jupiter</strong> <strong>Merlin</strong> <strong>Portfolios</strong>are available via a wide range ofplatforms, wraps, and Life andPension companies both onshoreand offshore. www.<strong>Jupiter</strong>online.comredefiningWEALTHstandards1227-03.13The outlook expressed in this factsheet represents the views of the fund manager at the time of preparation and are not necessarilythose of the <strong>Jupiter</strong> Group as a whole. They may be subject to change and should not be interpreted as investment advice. The managerhas the power to use derivatives but it is intended that these will only be used for the purpose of efficient portfolio management and notfor investment purposes. <strong>Jupiter</strong> Unit Trust Managers Limited is authorised and regulated by the Financial Conduct Authority whose addressis 25 The North Colonnade, Canary Wharf, London E14 5HS. Registered address: 1 Grosvenor Place, London SW1X 7JJ. Quoted yields are notguaranteed. Current tax levels and reliefs will depend on your individual circumstances. For your security we may record or randomly monitorall telephone calls. If you are unsure of the suitability of this investment please contact your Financial Adviser. Copies of the half-yearly andannual reports may be obtained from <strong>Jupiter</strong> <strong>Asset</strong> <strong>Management</strong> Ltd., 1 Grosvenor Place, London SW1X 7JJ. NURS Key Investor InformationDocument (KIID), Supplementary Information Document (SID) and Scheme Particulars may also be obtained from that address.Customer ServicesTelephone: 0844 620 7600Freephone: 0500 0500 98Fax: 0844 620 7603Website: www.jupiteronline.comBroker Sales TeamTelephone: 020 7314 7699Email: brokerdesk@jupiter-group.co.uk


