

The California Report on Coronary Artery Bypass Graft Surgery
The California Report on Coronary Artery Bypass Graft Surgery
The California Report on Coronary Artery Bypass Graft Surgery
- No tags were found...

Create successful ePaper yourself
Turn your PDF publications into a flip-book with our unique Google optimized e-Paper software.
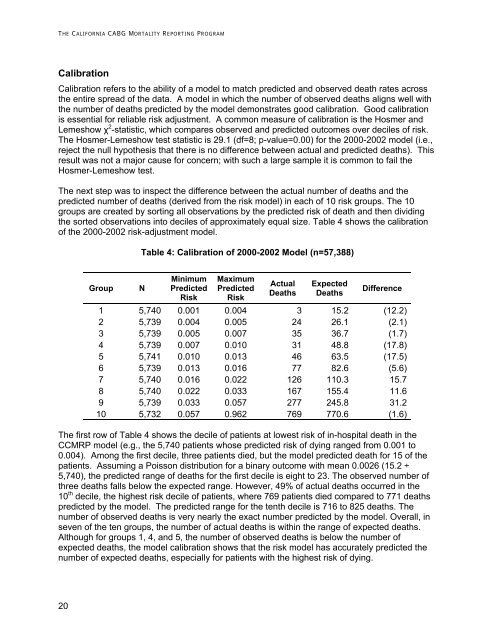
THE CALIFORNIA CABG MORTALITY REPORTING PROGRAMCalibrati<strong>on</strong>Calibrati<strong>on</strong> refers to the ability of a model to match predicted and observed death rates acrossthe entire spread of the data. A model in which the number of observed deaths aligns well withthe number of deaths predicted by the model dem<strong>on</strong>strates good calibrati<strong>on</strong>. Good calibrati<strong>on</strong>is essential for reliable risk adjustment. A comm<strong>on</strong> measure of calibrati<strong>on</strong> is the Hosmer andLemeshow χ 2 -statistic, which compares observed and predicted outcomes over deciles of risk.<str<strong>on</strong>g>The</str<strong>on</strong>g> Hosmer-Lemeshow test statistic is 29.1 (df=8; p-value=0.00) for the 2000-2002 model (i.e.,reject the null hypothesis that there is no difference between actual and predicted deaths). Thisresult was not a major cause for c<strong>on</strong>cern; with such a large sample it is comm<strong>on</strong> to fail theHosmer-Lemeshow test.<str<strong>on</strong>g>The</str<strong>on</strong>g> next step was to inspect the difference between the actual number of deaths and thepredicted number of deaths (derived from the risk model) in each of 10 risk groups. <str<strong>on</strong>g>The</str<strong>on</strong>g> 10groups are created by sorting all observati<strong>on</strong>s by the predicted risk of death and then dividingthe sorted observati<strong>on</strong>s into deciles of approximately equal size. Table 4 shows the calibrati<strong>on</strong>of the 2000-2002 risk-adjustment model.Table 4: Calibrati<strong>on</strong> of 2000-2002 Model (n=57,388)GroupNMinimumPredictedRiskMaximumPredictedRiskActualDeathsExpectedDeathsDifference1 5,740 0.001 0.004 3 15.2 (12.2)2 5,739 0.004 0.005 24 26.1 (2.1)3 5,739 0.005 0.007 35 36.7 (1.7)4 5,739 0.007 0.010 31 48.8 (17.8)5 5,741 0.010 0.013 46 63.5 (17.5)6 5,739 0.013 0.016 77 82.6 (5.6)7 5,740 0.016 0.022 126 110.3 15.78 5,740 0.022 0.033 167 155.4 11.69 5,739 0.033 0.057 277 245.8 31.210 5,732 0.057 0.962 769 770.6 (1.6)<str<strong>on</strong>g>The</str<strong>on</strong>g> first row of Table 4 shows the decile of patients at lowest risk of in-hospital death in theCCMRP model (e.g., the 5,740 patients whose predicted risk of dying ranged from 0.001 to0.004). Am<strong>on</strong>g the first decile, three patients died, but the model predicted death for 15 of thepatients. Assuming a Poiss<strong>on</strong> distributi<strong>on</strong> for a binary outcome with mean 0.0026 (15.2 ÷5,740), the predicted range of deaths for the first decile is eight to 23. <str<strong>on</strong>g>The</str<strong>on</strong>g> observed number ofthree deaths falls below the expected range. However, 49% of actual deaths occurred in the10 th decile, the highest risk decile of patients, where 769 patients died compared to 771 deathspredicted by the model. <str<strong>on</strong>g>The</str<strong>on</strong>g> predicted range for the tenth decile is 716 to 825 deaths. <str<strong>on</strong>g>The</str<strong>on</strong>g>number of observed deaths is very nearly the exact number predicted by the model. Overall, inseven of the ten groups, the number of actual deaths is within the range of expected deaths.Although for groups 1, 4, and 5, the number of observed deaths is below the number ofexpected deaths, the model calibrati<strong>on</strong> shows that the risk model has accurately predicted thenumber of expected deaths, especially for patients with the highest risk of dying.20
