Introductory Chapters - Amphibian Specialist Group
Introductory Chapters - Amphibian Specialist Group
Introductory Chapters - Amphibian Specialist Group
- No tags were found...

Create successful ePaper yourself
Turn your PDF publications into a flip-book with our unique Google optimized e-Paper software.
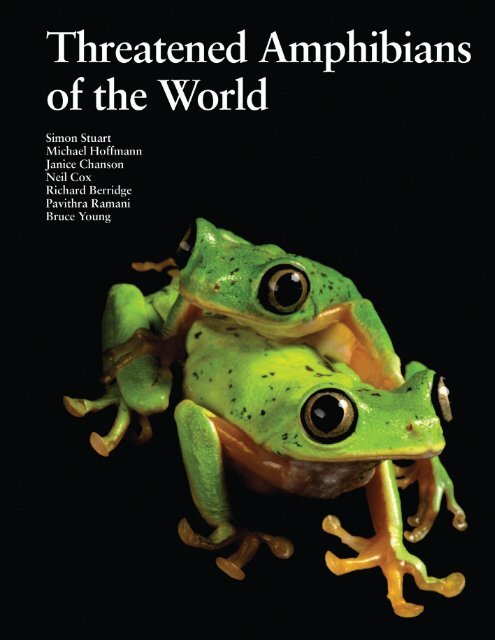
THREATENED AMPHIBIANS OF THE WORLD
S.N. Stuart, M. Hoffmann, J.S. Chanson, N.A. Cox, R.J. Berridge, P. Ramani, and B.E. Young (eds.)THREATENED AMPHIBIANS OF THE WORLD
Cover: Hylomantis lemur, Endangered. © Joel Sartore / www.joelsartore.comBack cover: Agalychnis callidryas, Least Concern. © Kenji NishidaPage 1: Ichthyophis kohtaoensis, Least Concern. © Danté FenolioPage 135: Atelopus ignescens, Extinct. © Michael and Patricia FogdenPage 145: Leptopelis vermiculatus, Vulnerable. © Maik DobieyPage 609: Epipedobates bassleri, Near Threatened © Maik DobieyRecommended citation:Stuart, S.N., Hoffmann, M., Chanson, J.S., Cox, N.A., Berridge, R.J., Ramani, P., and Young, B.E. (eds.) (2008). Threatened <strong>Amphibian</strong>s of the World. Lynx Edicions, Barcelona, Spain;IUCN, Gland, Switzerland; and Conservation International, Arlington, Virginia, USA.Published as a partnership between IUCN, Conservation International and Lynx Edicions.First edition: July 2008© Lynx Edicions – Montseny 8, 08193 Bellaterra, Barcelona (Spain)© Texts: introductory matter: authors / IUCN and Conservation International; species accounts: IUCN, Conservation International and NatureServe© Photographs: credited photographersPrinted by Ingoprint S.A.DL: B-32.689-2008ISBN: 978-84-96553-41-5All rights reserved. No form of reproduction, distribution, public communication or transformation of this work may be carried out without the authorization of its copyrights holders, except that foreseen by the law. Thoseneeding to photocopy or electronically scan any part of this work should contact Lynx Edicions.
Threatened <strong>Amphibian</strong>s of the World is dedicated toThe 500 herpetologists from around the worldwho devoted their knowledge, intellect and timeto the Global <strong>Amphibian</strong> Assessment, and withoutwhom this book could not have been writtenand especially toGeorge Rabb for his visionary leadershipand commitment to confronting theamphibian extinction crisis, which gives ushope in an otherwise bleak situation.Dendrobates azureus, Vulnerable. © Albert Popalis
CONTENTSFOREWORDSPREFACESACKNOWLEDGEMENTSIXXIXIIIINTRODUCTORY CHAPTERS 1Chapter 1. An Introduction to the <strong>Amphibian</strong>s 2Chapter 2. Why Save <strong>Amphibian</strong>s? 23Chapter 3. The Global <strong>Amphibian</strong> Assessment (GAA): History, Objectives and Methodology 30Chapter 4. The State of the World’s <strong>Amphibian</strong>s 33Chapter 5. <strong>Amphibian</strong>s of the Afrotropical Realm 53Chapter 6. <strong>Amphibian</strong>s of the Australasian Realm 65Chapter 7. <strong>Amphibian</strong>s of the Indomalayan Realm 74Chapter 8. <strong>Amphibian</strong>s of the Nearctic Realm 85Chapter 9. <strong>Amphibian</strong>s of the Neotropical Realm 92Chapter 10. <strong>Amphibian</strong>s of the Palaearctic Realm 106Chapter 11. <strong>Amphibian</strong> Conservation – Responding to the Global Decline of <strong>Amphibian</strong>s 114EXTINCT AND EXTINCT IN THE WILD AMPHIBIAN SPECIES 135GLOBALLY THREATENED AMPHIBIAN SPECIES 145NEAR THREATENED AMPHIBIAN SPECIES 609BIBLIOGRAPHY 645APPENDICES 693Appendix Ia. The IUCN Red List Categories (IUCN 2001) 693Appendix Ib. Summary of the five criteria (A-E) used to evaluate if a species belongsin a Category of Threat (Critically Endangered, Endangered or Vulnerable) 693Appendix II. Definitions for the initial data collection regions 694Appendix III. A summary of IUCN Red List status by genus 694Appendix IV. List of rapidly declining species 696Appendix V. Species listed by territory 699Appendix VI. <strong>Amphibian</strong> Conservation Summit Declaration:an <strong>Amphibian</strong> Conservation Action Plan 702Appendix VIIa. The scale of conservation required for globally threatened amphibians 703Appendix VIIb. The nature of the ecological process for whichlandscape-scale conservation action is required 723Appendix VIII. List of Critically Endangered and Endangered species for whichcaptive breeding is an immediately necessary ex-situ conservation action 725Appendix IX. <strong>Amphibian</strong>s listed as Critically Endangered (Possibly Extinct)on the 2007 IUCN Red List of Threatened Species 727Appendix X. <strong>Amphibian</strong>s listed as Vulnerable D2 on the 2007 IUCN Red Listof Threatened Species 728Appendix XI. List of Least Concern species listed on the 2007 IUCN Red Listof Threatened Species, with country of occurrence 729Appendix XII. List of Data Deficient species, with country of occurrence 739Appendix XIII. The differences in IUCN Red List Status for some Brazilian species 744Appendix XIV. Glossary of some key terms used 745Appendix XV. Websites and amphibian-related resources 745INDEX OF EXTINCT, THREATENED AND NEAR THREATENEDSPECIES ACCOUNTS 747
IXFOREWORDSThe first signs of trouble for amphibians arose around three decades ago. IUCN, Conservation International andNatureServe made great efforts to understand what was happening, and in 2004, the Global <strong>Amphibian</strong> Assessmentwas produced with this shocking result: one-third of amphibian species are threatened with extinction. In addition,we were lacking data on many species which are potentially threatened. New studies show that many of the speciesthat are listed as ‘Data Deficient’ on the IUCN Red List of Threatened Species are indeed threatened. One-third ofan entire distinct group of species at risk of extinction is not a trivial figure.This book is another step in our attempt to alert the world about the extinction crisis that toads, frogs, salamandersand caecilians are currently facing. It is a landmark book comprising all what needs to be known about amphibianconservation, and as such I am very happy to see its publication and to write this foreword. I would, however, beeven happier if the amphibian extinction crisis was not taking place. I am concerned that the size of this book is areflection of the number of threatened species that it comprises. When reading it one should not forget that onlythreatened amphibians are included in the species accounts that occupy the bulk of its length.Many of us probably do not give much attention to amphibians and will probably be surprised to see how diverse,unique, colourful, and fascinating they are. Many species have developed very specifi c evolutionary characteristicsand adaptations. We might think that they all lay eggs in water, but some give birth to live young, some do not needwater, some species carry their eggs, others carry their young. Two Australian frogs incubated their eggs in theirstomachs and both are already Extinct. As a result, an entire evolutionary lineage has been lost, along with up to164 other species. These reproductive traits are the results of millions of years of evolution. Who knows if suchadaptations would not have been key to the survival of species in response to climate change?<strong>Amphibian</strong>s are sending us a very strong signal that something is seriously wrong with the way we take care ofour environment. They have been considered as the ‘canaries in the coal mine’; their permeable skin makes themsensitive to many forms of pollution; they are also extremely sensitive to climate change and diseases. The sharpdecline in amphibian populations could prefigure, if we are not careful, what other groups of species might undergoin the future. <strong>Amphibian</strong>s provide us with a critical challenge if we are to meet the target that all countries agreedupon: a significant reduction in the rate of biodiversity loss by 2010.<strong>Amphibian</strong>s are a key part of ecosystems and the food chain; they control the number of many invertebrates, andare prey for many species of birds or mammals. Some species are also a source of revenue for human communitieswho eat them, use them as medicines, or supply them to the international pet trade. The skins of certain speciescontain molecules that are very promising in terms of developing new medicines for people. Who knows, a little froghiding in the understorey of a tropical rainforest might bring the solution to the AIDS pandemic?After reading this book and contemplating all these pictures, no one will look at amphibians with the same eyesagain.Julia Marton-LefèvreDirector GeneralIUCN, the World Conservation UnionEight years ago, I was invited to write a foreword to BirdLife International’s landmark publication Threatened Birdsof the World. At the time, I commented how encouraging it was that at least one organization had managed to honeits focus down to the level of sites and species across the planet. Writing this foreword for what is, in essence, thesister publication to BirdLife’s earlier work, I am struck by our progress since then.In 2003, at the Fifth World Parks Congress in Durban, South Africa, the results of a global analysis revealed thetremendous gaps in coverage of the existing protected areas network. While not all threats to biodiversity can bemitigated via habitat protection, habitat loss remains the overwhelming threat to our planet’s unique life forms. It isencouraging, then, to see the expansion of the Important Bird Areas concept, pioneered by BirdLife International, toall taxa under the umbrella of the Key Biodiversity Areas approach, which aims to identify globally important sitesfor the conservation of biodiversity. Such initiatives, aided by the efforts of the Alliance for Zero Extinction, whichprioritizes that subset of sites known to hold the last remaining population of a highly threatened species, provideconservation planners, funders and practitioners with a valuable lens on where, and what form of, conservation actionis most appropriate in order to avoid the loss of global biodiversity.Such fine-scale resolution would be impossible without the foundation provided by the data in the IUCN Red List,the recognized authority for the conservation status of global biodiversity. Before the launch of the Global <strong>Amphibian</strong>Assessment in September 2004, only a few hundred hand-picked frogs, toads and salamanders appeared on theIUCN Red List. Today, we have detailed, up-to-date information on the distribution, population status, threats, andconservation status of nearly 6,000 amphibians.Threatened <strong>Amphibian</strong>s of the World is a visual exploration of the results of the Global <strong>Amphibian</strong> Assessment– a compelling synthesis of herpetological knowledge and a yardstick for amphibian conservation. In tandem with the<strong>Amphibian</strong> Conservation Action Plan, produced by the IUCN/SSC <strong>Amphibian</strong> <strong>Specialist</strong> <strong>Group</strong>, it puts the amphibianagenda center-stage. And it does so with tremendous visual impact, presenting us with a face on an unfolding crisislike nothing that has gone before.The plight of the world’s amphibians is not just theirs, but ours as well. We should care that one-third of amphibiansstand a high risk of extinction in the wild – and probably many more – because the threats that imperil them are thosethat stem from our actions and will be no less detrimental to our own livelihoods: pollutants, invasive species anddisease, global climate change, and rampant habitat loss. Responding to these threats must be a societal concern.Let us hope that a second edition of this book does not require two volumes…“Round up the usual suspects,” as Captain Renault famously said in the film Casablanca, did not seem to apply. Somethingappeared to be going on with amphibians that could not be wholly explained by the standard litany of ecologicalthreats, such as habitat degradation and loss. The declines that were fi rst noticed in earnest in the late 1980s andearly 1990s raised the possibility that something was seriously amiss: a crisis that might start with environmentallysensitive creatures such as amphibians, but ultimately affect other strands of life, including humans.NatureServe is a non-profi t organization dedicated to providing the scientifi c basis for effective conservationaction, with a deep appreciation for the role that research plays in addressing environmental challenges. We werepleased to join with IUCN and Conservation International in carrying out the Global <strong>Amphibian</strong> Assessment (GAA) asa way to document and draw attention to the amphibian declines now underway.NatureServe scientists began seriously delving into the plight of amphibians through our coordination of RANA(Research and Analysis Network for Neotropical <strong>Amphibian</strong>s), a U.S. National Science Foundation-funded effort.Through RANA, researchers with an interest in understanding amphibian declines in Latin America came together toshare information, approaches, and results, and to train a new generation of Latin American herpetology students.The project has also helped to document some of the causes that appear to be behind these declines, including fungaldiseases and shifts in climate. Building on our work with RANA, as well as our long history of assessing conservationstatus for North American and Latin American species, I am pleased that NatureServe was able to contribute to theGAA by coordinating the Western Hemisphere portion of the initiative, and creating a website for disseminating theproject’s data and results to the broader community (www.globalampihibians.org).The GAA partnership has succeeded admirably in bringing the dire condition of the world’s amphibian species intofocus, and in motivating the scientifi c and conservation communities to take action. The present volume provides animportant summary of what is known about amphibians around the world, and what will be required to ensure theirfuture. While the work to do so will be diffi cult, and success is not assured, only by committing to the approachesoutlined in the recent <strong>Amphibian</strong> Conservation Action Plan will we have a hope for preserving the many and variedfaces of this ancient lineage.Mary L. KleinPresident and CEO, NatureServe<strong>Amphibian</strong>s, be they frogs, toads, salamanders or caecilians, are thought to be amongst the most sensitive ecologicalindicators, warning us of unsafe environmental conditions that are not only impacting our health, but that ofthe global ecosystem. With at least 32% of the described amphibian species threatened with extinction, and 500species probably beyond the point of no return, the global amphibian extinction crisis represents one of the greatestconservation challenges of our times.A direct result of mankind’s insatiable appetite for natural resources, the rapid decline in amphibian numbersdemonstrates the sensitivity of not only species, but of entire ecosystems. The current crisis exemplifi es how, ifunmanaged, actions of every-day human consumption and waste can compound to form ripple-like reactions resultingin entire populations disappearing, and all within our lifetime. In 2004, a global collaboration of work from 500 of theworld’s most respected amphibian specialists from over 60 nations was released: the Global <strong>Amphibian</strong> Assessment.Citing the possible loss of 122 species since 1980 alone, this unprecedented collaborative research effort highlightedthe pace of modern amphibian declines. Since the fi rst release of the Global <strong>Amphibian</strong> Assessment, there has beenconstant updating of information, including the addition of 160 new species to the IUCN Red List of ThreatenedSpecies TM nine of which are Critically Endangered, 17 Endangered, and 12 Vulnerable. However, a large percentageof species remain in the Data Defi cient category, emphasizing the need for more amphibian assessment work.At present, little is known of the deadly fungal disease that is wiping out some amphibians faster than can berecorded. With fears that this could worsen with global climate change, there is no better time than the present toact with the knowledge we have, improve shortcomings in our knowledge, and continue work with our current andfuture collaborative efforts to raise the awareness for amphibian conservation. The recent release of the <strong>Amphibian</strong>Conservation Action Plan by IUCN/SSC’s <strong>Amphibian</strong> <strong>Specialist</strong> <strong>Group</strong> and the publication of this book, are tributes tothe enormous efforts dedicated teams are undertaking to tackle the global loss of species. Onwards to 2008, aptlynamed “the Year of the Frog”.Holly T. DublinChair, IUCN Species Survival CommissionRussell A. MittermeierPresident, Conservation InternationalSteering Committee member, IUCN Species Survival CommissionIUCN Council member 2004-2008, IUCN – World Conservation Union
XIPREFACESImagine a world without frogs. No spring choruses of calling males. No tadpoles for kids to play with. No brightlycoloured jewels perched on rocks and leaves throughout the world’s tropical forests. We are currently witnessing theglobal extinction of amphibians – they are facing extinctions at levels unprecedented in any other group of organisms inhuman history. In light of this, we have some serious questions to address: How extensive is the amphibian extinctioncrisis? How much worse can it get? Why is this happening now? Will it affect humans? Is there any hope?As early as 1989, researchers exchanged anecdotal reports of declines and disappearances of amphibian speciesfrom many areas around the world. Species, such as Costa Rica’s Golden Toad (Bufo periglenes), went missing frompristine protected areas, often in the absence of familiar threats such as habitat loss and pollution (e.g., Crump et al.1992). Further complicating matters, data on species distributions and population fluctuations were lacking for mostamphibian species, thus preventing our ability to make accurate estimates of endangerment. In response, the IUCNSpecies Survival Commission formed The Declining <strong>Amphibian</strong> Population Task Force (DAPTF; and see Essay 11.1) toguide, sponsor, and fund crucial research into the phenomenon of global amphibian declines.There are currently (as of the time of writing) just over 6,000 recognized species of amphibians and this numberhas increased by 48% in the past 20 years (Frost et al. 2006). This refl ects both increased access to, and ease ofcollecting data in, remote locations, as well as the growth of active scientifi c communities in a few megadiversecountries (see Essay 1.1). Unfortunately, this increase in knowledge of amphibian diversity is offset by massivepopulation declines and growing numbers of species extinctions (Stuart et al. 2004; Lips et al. 2005). Simplyput, amphibian species are disappearing from the planet perhaps faster than we can discover them. Accordingto the results of the Global <strong>Amphibian</strong> Assessment (GAA; Stuart et al. 2004), some 43% of amphibian speciesare declining in abundance, 32% of amphibians (one-third of all species) are threatened with extinction, and 122species likely have become extinct since 1980 (with 34 species confi rmed Extinct). Worse yet, these numbers arecertainly underestimates because 23% of all known species are so poorly known that their threat status could notbe classifi ed at all. Statistics of this sort represent a near-categorical extinction event perhaps on the scale of thedisappearance of the dinosaurs.The GAA also reviewed causes of declines, and identified familiar threats such as habitat loss, chemical contamination,and over-harvesting as being involved in some cases. However, the terrifying realization was that novelthreats related to emerging infectious diseases and climate change accounted for many of the disappearances.Conservationists have worked for decades to limit habitat loss, pollution, and over-harvesting in natural areas, butour current well-intentioned conservation programmes are insufficient to prevent extinctions from such insidiousthreats as emerging infectious diseases and climate change.<strong>Amphibian</strong> declines and extinctions are real and the recently discovered chytrid fungal pathogen (Batrachochytriumdendrobatidis) is a primary cause of many catastrophic losses (Lips et al. 2006). We can detect the pathogen usinga non-lethal skin swab (Annis et al. 2004), predict its potential ecogeographical distribution (Ron 2005), predict localmovement, and foresee the catastrophic effects on local amphibian faunas (Lips et al. 2006). Species most threatenedwith disease-induced extinction are those in high-elevation, riparian habitats, with small geographic ranges (Lipset al. 2003). High endemism of amphibians in upland areas throughout the tropics suggests that climate changeswith or without associations with chytrid may also be devastating amphibians. The scope of the amphibian crisis ismassive, and the local and global effects of these losses are numerous and widespread (Whiles et al. 2006). Whenamphibians disappear, we lose their roles in maintaining ecosystem function, and also any potential benefi ts theymay offer to humans.Important questions remain: How can ecosystems continue to function in the absence of amphibians? What canbe done to preserve some amphibian species for future generations? How can we stop these extinctions? Researchand conservation organizations do not have the answers to these questions at this time. Nevertheless, a large-scalecommitment to truly maverick, but coordinated, conservation efforts is in order (Mendelson et al. 2006). Becausemultiple causes are involved, diverse and innovative solutions must be implemented. For those species affected byhabitat loss, we need to continue current efforts aimed at safeguarding important sites. Understanding direct andindirect effects of chemicals on amphibians requires extensive additional levels of attention, as do contaminantmonitoringprogrammes. While over-harvesting does not affect most amphibian species, it represents a real problemfor some, such as the Asian giant salamanders (Andrias spp.; see Essay 4.5). Unfortunately, effective solutions toglobal problems, such as climate change and emerging infectious diseases, do not currently exist. Responses tothreats related to climate change will require global commitment to alternative fuels and reduced emissions, andreconfiguring protected areas to encompass broad elevational ranges, in order to account for potential shifts in speciesdistributions. Solutions to emerging infectious diseases will require significant levels of funding and aggressiveresearch to better understand the epidemiology and pathology of the diseases, and to develop vaccines and/orresistance in wild populations.Creating and implementing global solutions to these global threats requires signifi cant levels of commitment,organization, funding, and – especially – time. In cases of predicted catastrophic losses, the only conservation toolwe have at our disposal is the establishment of ex-situ survival assurance colonies (Mendelson and Rabb 2006).Captive programmes are not a solution to the actual problems, but they may preserve living colonies of individuals,increase numbers through breeding, and potentially serve as research colonies to enable timely studies of pathologyand evolution of resistance. The challenge again is a matter of scale: there are currently fewer than 40 amphibianspecies in managed ex-situ programmes (Zippel 2005), yet at least five times that number require urgent ex-situconservation action (Appendix VII). These numbers represent a major challenge for zoos, gardens, and aquariums(see Essay 11.5).Many species need immediate attention to prevent their extinction, and potentially thousands of others remain tobe discovered or described. It is not uncommon to encounter several new species per trip to certain regions of LatinAmerica, especially upland areas, which are most affected by threats related to climate and disease. As a result, weare losing species we never knew existed. Among the current authors, JRM has described about 40 new species ofLatin American amphibians in the past 15 years, but already half of them are likely extinct. Similarly, KRL has observedthe annihilation of the amphibian faunas at five different sites in Latin America in the past 15 years. Of course, wehope our experiences are the exceptions, or even inaccurate, but we’re very afraid that they are close to reality.ReferencesKaren R. Lips and Joseph R. Mendelson IIIAnnis, S.L., Dastoor, F., Ziel, H., Daszak, P. and Longcore, J.E. 2004. A DNA-based assay identifi es Batrachochytrium dendrobatidis inamphibians. Journal of Wildlife Diseases 40:420-428.Crump, M.L., Hensley, F.R. and Clark, K.L. 1992. Apparent declines of the golden toad: underground or extinct? Copeia 1992:413-420.Frost, D.R., Grant, T., Faivovich, J., Bain, R., Haas, A., Haddad, C.F.B., de Sá, R.O., Donnellan, S.C., Raxworthy, C.J., Wilkinson, M., Channing,A., Campbell, J.A., Blotto, B.L., Moler, P., Drewes, R.C., Nussbaum, R.A., Lynch, J.D., Green, D. and Wheeler, W.C. 2006. Theamphibian tree of life. Bulletin of the American Museum of Natural History 297:1-370Lips, K.R., Reeve, J. and Witters, L. 2003. Ecological factors predicting amphibian population declines in Central America. ConservationBiology 17:1078-1088.Lips, K.R., Brem, F., Brenes, R., Reeve, J.D., Alford, R.A., Voyles, J., Carey, C. and Collins, J.P. 2006. Infectious disease and global biodiversityloss: pathogens and enigmatic amphibian extinctions. Proceedings of the National Academy of Sciences USA 103:3165-3170.Mendelson, J.R., III, Lips, K.R., Gagliardo, R.W., Rabb, G.B., Collins, J.P., Diffendorfer, J.E., Daszak, P., Ibanez D, R., Zippel, K.C., Lawson,D.P., Wright, K.M., Stuart, S.N., Gascon, C., da Silva, H.R., Burrowes, P.A., Joglar, R.L., La Marca, E., Lotters, S., du Preez, L.H., Weldon,C., Hyatt, A., Rodriguez-Mahecha, J.V., Hunt, S., Robertson, H., Lock, B., Raxworthy, C.J., Frost, D.R., Lacy, R.C., Alford, R.A., Campbell,J.A., Parra-Olea, G., Bolanos, F., Domingo, J.J.C., Halliday, T., Murphy, J.B., Wake, M.H., Coloma, L.A., Kuzmin, S.L., Price, M.S.,Howell, K.M., Lau, M., Pethiyagoda, R., Boone, M., Lannoo, M.J., Blaustein, A.R., Dobson, A., Griffi ths, R.A., Crump, M.L., Wake, D.B.and Brodie Jr, E.D. 2006. BIODIVERSITY: Confronting <strong>Amphibian</strong> Declines and Extinctions. Science 313(5783):48.Mendelson, J.R., III and G.B. Rabb. 2006. Global amphibian extinctions and the role of living-collections institutions. World Associationof Zoos and Aquariums. Proceedings WAZA Conferences: Proceedings of the 60 th Annual Meeting, New York City, USA, 2-6October 2005: 179-181.Ron, S. 2005. Predicting the distribution of the amphibian pathogen Batrachochytrium dendrobatidis in the New World. Biotropica37:209-221.Stuart, S.N., Chanson, J.S., Cox, N.A., Young, B.E., Rodrigues, A.S.L., Fischman, D.L. and Waller, R.W. 2004. Status and trends of amphibiandeclines and extinctions worldwide. Science 306:1783-1786.Whiles, M.R., Lips, K.R., Pringle, C., Kilham, S.S., Brenes, R., Connelly, S., Colon Guad, J.C., Hunte-Brown, M., Huryn, A.D., Montgomery,C. and Peterson, S. 2006. The consequences of amphibian population declines to the structure and function of neotropical streamecosystems. Frontiers in Ecology and the Environment 4:27-34.Zippel, K.C. 2005. Zoos play a vital role in amphibian conservation. AmphibiaWeb: http://amphibiaweb.org/.The Global <strong>Amphibian</strong> Assessment sharpened the scientific community’s focus on both the nature and extent of threatsto amphibians worldwide. Now is the time to act on new knowledge regarding the causes of an ongoing amphibianextinction event. Clear and internationally coordinated options for thwarting further extinctions of threatenedamphibians must be developed with parties capable of implementing actions. The <strong>Amphibian</strong> Conservation Summitwas called in September 2005 to design and promote a response to this global crisis. To this end, the participantsin the summit and now the newly formed IUCN/SSC <strong>Amphibian</strong> <strong>Specialist</strong> <strong>Group</strong> (ASG) commends the <strong>Amphibian</strong>Conservation Action Plan (ACAP) to governments, the business sector, civil society, and the scientifi c community forurgent and immediate adoption and implementation.Participants in the <strong>Amphibian</strong> Conservation Summit set priorities for conservation and research actions within 12areas relevant to amphibian conservation: 1) Designing a network of conservation sites for amphibians – Key BiodiversityAreas; 2) Freshwater resources and associated terrestrial landscapes; 3) Climate change, biodiversity loss, andamphibian declines; 4) Infectious diseases; 5) Over-harvesting of amphibians; 6) Evaluating the role of environmentalcontamination in amphibian population declines; 7) Captive programmes; 8) Reintroductions; 9) The continuing needfor assessments, making the Global <strong>Amphibian</strong> Assessment an ongoing process; 10) Systematics and conservation;and 11) Bioresource banking efforts in support of amphibian conservation. The ACAP embodies this work, althoughwe recognize that additional themes may need to be addressed in future versions of the document.A declaration (Appendix VI) was released following the Summit urging four kinds of intervention that are neededto conserve amphibians, all of which should be initiated with immediate effect: 1) Expanding our understanding ofthe causes of declines and extinctions; 2) Continuing to document amphibian diversity, and how it is changing; 3)Developing and implementing long-term conservation programmes; and 4) Responding to emergencies and immediatecrises. The full text of the Amphbian Conservation Summit Declaration and ACAP is at (www.amphibians.org).The amphibian extinction crisis requires a global response at an unprecedented scale. The ACAP requires theinternational community to enter uncharted territory and to take great risks. But the risks of inaction are evengreater. The ACAP calls on all governments, corporations, civil society, and the scientifi c community to respond.There needs to be unparalleled commitment to developing and implementing the ACAP with accompanying changesin international and local environmental policies that affect this class of vertebrate animals – as they truly are theproverbial canaries in the global coal mine. This document offers practical, large-scale, creative, innovative andrealistic actions that will be required to halt the present tide of extinctions of amphibian species and includes anambitious yet realistic budget.A unified global strategy incorporating survival assurance colonies, disease research, and habitat protection formsthe focus of this new plan to save amphibians. We must, of course, also remain vigilant and act on other threats,including climate change, over-harvesting, and toxins. Lessons learned from confronting the amphibian crisis will betransferable to other groups and ecosystems. We have many other potential crises-in-the-making, such as coral reefcollapses, fi sheries collapses, emerging human diseases such as Ebola, SARS (Severe Acute Respiratory Syndrome),Nipah virus, and our poor record of managing freshwater resources that will certainly lead to global shortages ofclean drinking water with great negative consequences. Many, if not all, of these environmental challenges are theresult to varying degrees of the same human footprint that our species is leaving on this planet.The road to success must include a broad set of stakeholders who help implement the ACAP. This is importantbecause there are many issues that are beyond the simple realm of “amphibian conservation work.” Addressingmany of the underlying causes of this crisis will help us avert the next global environmental challenge. Helping curbunsustainable wildlife use would not only decrease some of the threats to particular amphibian species, but alsohelp us apply these same solutions to other species. Similarly, tackling climate change, although a huge task in itsown right, will make a major contribution to the continued survival of all species as well as to the sustainability ofecosystems in general.Claude GasconCo-Chair IUCN/SSC <strong>Amphibian</strong> <strong>Specialist</strong> <strong>Group</strong> SecretariatExecutive Vice President, Conservation International, VirginiaJames P. CollinsCo-Chair IUCN/SSC <strong>Amphibian</strong> <strong>Specialist</strong> <strong>Group</strong> SecretariatProfessor, School of Life Sciences, Arizona State University, Arizona
XIIIACKNOWLEDGEMENTSThis book is a product of the Global <strong>Amphibian</strong> Assessment, and therefore owes everything to those who contributeddirectly to that process, and indeed who continue to do so. In particular, this product would not have been possiblewithout the expertise, knowledge and enthusiasm of the more than 500 herpetologists who contributed their timeto the data collation and review process. This book is a testimony to the dedicated efforts of these individuals andtheir unstinting passion for amphibian conservation.Although we once again express our sincere thanks to the many individuals that contributed to the GAA below, itis also necessary here to extend particular thanks to those who helped make publication of Threatened <strong>Amphibian</strong>sof the World a reality. Undertaking and producing a book of this scope has relied greatly on the dedicated help andwillingness of a very large number of people, as borne out by the acknowledgements that follow.Firstly, as with any enterprise of this nature, the publication of Threatened <strong>Amphibian</strong>s of the World would nothave been possible without the support of Conservation International providing generous fi nancial support, in largepart through the Gordon and Betty Moore Foundation, to IUCN – The International Union for the Conservation ofNature to cover staff time in the Biodiversity Assessment Unit. In particular we thank Gustavo Fonseca and RussellMittermeier for their courage and vision in making this happen.It is necessary to extend a special word of thanks to several individuals for their help, time and advice in the planningand production of this book. Ali Stattersfield, Stuart Butchart and Martin Sneary provided initial useful insightsinto the production of this book, based on their own experiences producing its sister publication, Threatened Birdsof the World. Our fellow staff in the IUCN Species Programme, particularly Jane Smart, Jean-Christophe Vié and JimRagle, provided much needed network support, and often had to shoulder the burden on other projects while we wereediting amphibian species accounts. We trust they are as happy to see this project completed as we are! In particular,we take this opportunity to single out the heroic efforts of the staff in the IUCN Red List Unit, Craig Hilton-Taylor andCaroline Pollock, for their efforts in ensuring the quality of the data feeding into the IUCN Red List. Vineet Katariya isthanked for her assistance with a number of GIS-related tasks and analyses, including producing Figures 7 and 10 inChapter 4. We also extend thanks to The Shared Earth Foundation and its President and CEO, Caroline D. Gabel, andto George Meyer and Maria Semple, for making valuable contributions to the printing costs of this book.At Conservation International (CI), the real herpetologists, Don Church, Claude Gascon and Robin Moore, providedmuch valued advice and suggestions and also wrote several essays and contributed their expertise to several chapters.Conservation International provided valuable network support through the entire duration of the project, and we areparticularly indebted to a number of current and former staff in CI’s Center for Applied Biodiversity Science for ideas,fruitful discussions and help in other ways, including: Charlotte Boyd, Daniel Brito, Thomas Brooks, Naamal de Silva,Graham Edgar, Matt Foster, David Knox, Thomas Lacher, Penny Langhammer, John Pilgrim, Ana Rodrigues, Will Turnerand Peter Paul van Dijk. Noura Bakkour kindly helped with translations of several materials from French to English, andvice versa. Noura and Sarah Wyatt provided support with several cumbersome administrative tasks. Kellee Koenigprovided valuable cartographic help with the production of the maps for essays 7.2 and 11.3.Our thanks, too, to Julia-Marton Lefèvre, Russell Mittermeier, Mary Klein and Holly Dublin for agreeing to writethe forewords, and to Jim Collins, Claude Gascon, Karen Lips and Joseph Mendelson III for writing the prefaces.A number of colleagues kindly agreed to review drafts of the introductory chapters, and their comments andinput helped improve the overall content and accuracy of these chapters immeasurably. In particular, we would liketo thank: Darrel Frost, Taran Grant, Ron Heyer, David Wake and George Zug (Introduction to <strong>Amphibian</strong>s); TeresaMulliken (Why Save <strong>Amphibian</strong>s?); and Ariadne Angulo, Charlotte Boyd, Peter Riger, Lee Hannah and Michael WaiNeng Lau (<strong>Amphibian</strong> Conservation). Several people also provided useful inputs into the regional chapters, and theyare acknowledged accordingly at the end of each chapter. Notwithstanding these valued and important inputs, westress that any errors in fact or judgment remain ours alone. The editors would also like to thank all the authors of theregional chapters for their hard work, for keeping to the deadlines, and for their constructive comments in reviewingthe drafts – we hope that the final product meets the approval of all!In addition to the regional chapter authors, several people devoted time to writing essays to draw attention toparticular issues or to highlight particular themes or trends. We wish to extend our thanks to the following for theirexcellent contributions:Alan Channing, Alex Ngari, Ana S.L. Rodrigues, Andrés R. Acosta-Galvis, Andrew A. Cunningham, Andrew Turner,Angel Alcala, Annika Hiller, Arvin Diesmos, Ben D. Bell, Bhoopathy, Bryan l. Stuart, Catherine H. Graham, Célio F.B.Haddad, Christopher J. Schneider, Claude Gascon, Claude Miaud, Claudia Corti, David B. Wake, David J. Gower, DavidKnox, Débora Leite Silvano, Djoko T. Iskandar, Don R. Church, Enrique La Marca, Esteban O. Lavilla, Feng Xie, FrancoAndreone, Frank Glaw, Franky Bossuyt, G.K. Bhatta, Gabriela Parra-Olea, Geoffrey A. Hammerson, Gerry Marantelli,Gracia Syed, Graeme R. Gillespie, Herilala Randriamahazo, Ian G. Bride, Ignacio De la Riva, Indraneil Das, Ismail Ugurtas,James Hanken, James P. Collins, Jean-Louis Amiet, Jeanne E. McKay, Jelka Crnobrnja Isailovic, Jen M. Germano,Jodi J.L. Rowley, Johannes Penner, John D. Lynch, Jörn Köhler, Joseph C. Mitchell, Joseph R. Mendelson III, JuliánFaivovich, Justin Gerlach, Karen R. Lips, Kelum Manamendra-Arachchi, Kevin Buley, Kevin Zippel, Kim Howell, LouiseA. Rollins-Smith, Madhava Meegaskumbura, Maj de Poorter, Mark Wilkinson, Mark-Oliver Rödel, Martin Wegmann,Masafumi Matsui, Matt Foster, Melizar V. Duya, Michael J. Tyler, Michael Wai Neng Lau, Michele Menegon, MichelleS. Koo, Miguel Vences, Mirza D. Kusrini, Naamal de Silva, P. Joël Adeba, Pablo A. Menéndez-Guerrero, Penny Langhammer,Peter Daszak, Peter Paul van Dijk, Petros Lymberakis, Philip J. Bishop, Rachunliu G Kamei, Rafael Marquez,Rafe M. Brown, Raffael Ernst, Raoul H. Bain, Richard A. Griffiths, Richard Gibson, Rick Relyea, Robert C. Lacy, RobertF. Inger, Robert Johnson, Robert Puschendorf, Robin D. Moore, Robinson Mugo, Rohan Pethiyagoda, Ross A. Alford,Ruth Grace Ambal, S.D. Biju, S. Blair Hedges, S. Gilles A. Nago, Santiago R. Ron, Sherif Baha el Din, Stefan Lötters,Steve Richards, Susanne Schick, Tahar Slimani, Taran Grant, Thomas S.B. Akre, Tim Davenport, Tim Halliday, Vance T.Vredenburg, Varad Giri, Vineet Katariya, Wang Xiaoming, Wolfgang Böhme, Yehudah Werner, and Zhang Ke-jia.Don Church and Kevin Zippel led the valuable analysis of Appendix VIII that forms part of Chapter 11; AppendixVIIa and VIIb are products of an analysis by Charlotte Boyd and colleagues recently published in the journal ConservationLetters.That this book is anywhere near as colourful as we intended is largely a tribute to the 350-odd people andinstitutions who generously provided or made available use of photographs of threatened amphibians to bring thespecies accounts to life, as well as those persons who provided images for use elsewhere in the book. We receivedmany more images than we could use, and in some cases we had difficult decisions to make regarding which imagewould be most appropriate. For anyone who contributed a photograph hoping that it would be used, and who fi ndsthis not to be the case, we hope you will not hold this against us! We have not been successful in securing imagesfor every threatened species. That we were able to secure as many as we did, owes a great deal to the generosityand understanding of those who helped out. We would especially like to thank Esteban Lavilla, Vanessa Verdade,Simon Chan, Andres Charrier, Federico Bolaños, Jahson Alemu, and Sergio Potsch de Carvalho e Silva for their helpin sourcing photographs from friends and colleagues.Despite having been meticulous in the copyrighting of photographs, we apologize for any errors and omissionsregarding photo credits and hope that any instances in this regard are minimal. We emphasize that the identifi cationof the species in the photographs is the responsibility of the photographers, and we claim no expertise of our own inensuring that these are correct. The names of the photographers are provided alongside each photograph, and are notlisted here. However, we must mention the following people who provided particularly large numbers of images thatwere used in the book: Jean-Louis Amiet, Franco Andreone, Marion Anstis, César Luis Barrio-Amorós and FundaciónAndígenA, S.D. Biju, Thomas Bille, Rafe Brown, Tim Burkhardt, Ignacio de la Riva, Bill Duellman, S. Blair Hedges,Frank Glaw, K. Jayaram, Twan Leenders, John Lynch, Kelum Manamendra-Arachchi, Madhava Meegaskumbura,Rohan Pethiyagoda, and Miguel Vences.Throughout the compilation of Threatened <strong>Amphibian</strong>s of the World, we have been collaborating with ARKive– www.arkive.org, to source images of threatened amphibian species in order to illustrate the book and increase thenumber of species profiled by ARKive. ARKive is a not-for-profit initiative of Wildscreen, a UK-based charity, gatheringtogether fi lms and photographs of the world’s threatened fauna and fl ora into one centralized digital library. ARKiveis leading the ‘virtual’ conservation effort, compiling comprehensive and enduring multi-media species profiles for the16,000-plus species threatened with extinction, according to the IUCN Red List of Threatened Species. We encourageany photographers who would like to make their images of threatened species available for educational and awarenessraising purposes to contact ARKive directly. We would also like to say a special thank you to Michelle Lindley, ARKiveMedia Researcher, for her enthusiasm and assistance in locating, cataloguing and ensuring the smooth passage ofimages between the photographers, ARKive and the GAA; and to Harriet Nimmo, Wildscreen Chief Executive, forsuggesting this exciting and valuable collaboration, and for eagerly supporting it.Doan Nguyen provided tremendous support by helping scan many slides that were sent to us for use in the book,while David A. Sanchez took on the formidable task of going through the immense slide collection of John Lynchand scanning slides of threatened species for the book. Breck Bartholomew, at Bibliomania, kindly made availablehigh-resolution scans of the images of Craugastor milesi and Craugastor chrysozetetes by James McCranie, whichappear in Guia de Campo de los Anfi bios de Honduras by James R. McCranie & Franklin Castañeda. We also extendthanks to the following photographers for making their superb images available for use on the front and back covers,as well as the half-title pages: Joel Sartore (cover); Kenji Nishida (back cover); Danté Fenolio, Michael and PatriciaFogden, and Maik Dobiey (Half-title pages).In addition, we would also like to acknowledge Kraig Adler and the Society for the Study of <strong>Amphibian</strong>s and Reptilesfor their permission to reproduce selected paintings by David M. Dennis from the excellent “Hylid Frogs of MiddleAmerica”, by William E. Duellman. Likewise, we were kindly granted permission to reproduce illustrations from the“Atlas of <strong>Amphibian</strong>s of China” by Fei et al. (1999), for which we acknowledge the permission of Prof. Liang Fei, andthe two artists who contributed to the book, Yisheng Wang and Jian Li. Finally, we would also like to acknowledgeTed Kahn and César Landazábal for permission to use their illustrations published in Ranas Arlequines, publishedby Conservation International, and we thank José Vicente Rodriguez Machecha of CI-Colombia for making theseillustrations available to us, and for his assistance in securing permission to reproduce other images that appearin this publication.A project of this magnitude is never without sacrifi ces made by family and loved ones. Simon Stuart thanks hiswife Ann, and daughters Claire and Jyoti, for all their love and support throughout the Global <strong>Amphibian</strong> Assessmentproject, and the writing of this book, even though it took him away from home far too often. Michael Hoffmann wouldlike to thank his parents, Francois and Cheryl, for their unstinting support and prayers, particularly over the last fouryears while being 8,000 miles from home, and also his fellow editors for putting up with his continuous harassmentto meet project deadlines. Janice Chanson is extremely grateful for the love and support of her husband John(including moving continents twice), and the happiness and love that baby Sacha whom arrived midway through thewriting of this book brings to our lives. Neil Cox thanks his parents and grandparents for giving him a love of both thecountryside and traditional natural history, and he thanks Kerry and Megan for their love, patience and understandingwhile he spent far too much time away from home. Richard Berridge thanks his parents (and especially his mum,Eileen) for supporting his interest in mantellas, including putting up with a house that smells like a brewery (on accountof breeding fruit fl ies in the laundry cupboard), and for rescuing frogs on the stairs during dinner parties; andalso to his much loved grandfather, Norman, for starting off his interest in natural history in the fi rst place. PavithraRamani thanks her family and friends for their tremendous support during the production of this book. They have allkept an open mind and have shown an eagerness to learn, which she heartfully appreciates. Bruce Young is gratefulfor the tremendous kindness and patience shown by his wife Cynthia and daughters Emily and Amanda during thecompilation of the Global <strong>Amphibian</strong> Assessment.Finally, the last word of thanks must go to the ever remarkable publication house that is Lynx Edicions, andparticularly to Josep del Hoyo for constant guidance, encouragement and patience, and Susanna Silva for leadingon the production side with great effi ciency and creativity.GLOBAL AMPHIBIAN ASSESSMENT ACKNOWLEDGEMENTSDonorsThe Moore Family Foundation and the Gordon and Betty Moore Foundation, through Conservation International, providedthe core fi nancial support for the Global <strong>Amphibian</strong> Assessment. The MAVA Foundation, the US Department of State,the Regina Bauer Frankenberg Foundation for Animal Welfare, the National Science Foundation (DEB-0130273 andINT-0322375), the Critical Ecosystem Partnership Fund, George Meyer, the European Commission, Ben Hammett, andthe Disney Foundation provided additional major support. The Kadoorie Farm and Botanic Garden, WWF Australia, theTaipei Zoological Foundation, the Chicago Zoological Society, the Society for Wildlife and Nature, the Columbus Zoo andthe IUCN Centre for Mediterranean Cooperation also provided generous support. Claude Gascon and Jorgen Thomsenin particular assisted us with fundraising. Any opinions, fi ndings, and conclusions or recommendations expressed inthis material are entirely those of the authors and do not necessarily refl ect the views of any donor.Conservation PartnersSpecial mention must be made of George Rabb, who was the fi rst to recognize the enormity of the global amphibianconservation crisis, and who has mobilized both scientists and conservationists to address this challenge. Out ofrespect for his visionary leadership, we dedicate this book to him.Darrel Frost of the American Museum of Natural History provided extensive assistance on taxonomic and nomenclaturalissues, without which it would have been much more difficult to implement the Global <strong>Amphibian</strong> Assessment.David Wake of the Museum of Vertebrate Zoology at the University of California at Berkeley gave us privileged accessto the AmphibiaWeb database. We are most grateful to both of these people for their unfailing support.We received assistance and advice in ways too numerous to mention from the IUCN/SSC <strong>Amphibian</strong> <strong>Specialist</strong><strong>Group</strong> (formerly the IUCN/SSC Declining <strong>Amphibian</strong> Populations Task Force), in particular from Don Church, Jim Collins,Claude Gascon, Tim Halliday, Jim Hanken, Jeanne McKay, Robin Moore and John Wilkinson.The following people provided local logistical support for the GAA workshops: Jean-Marc Hero (Australia), ZhongShengxian (China), Barasa Johnson (Kenya), Sanjay Molur and Sally Walker (India), Rosa Mary Saengsanthitham(Thailand), Enrique Lahmann (Costa Rica), Sabrina Cowan and Allen Allison (Hawaii), Adriano Paglia, Jose MariaCardoso da Silva and Luis Paulo de Souza Pinto (Brazil), Paul and Sara Salaman and José Vicente Rodríguez (Ecuador),Doreen Zivkovic (Switzerland), Esteban Lavilla (Argentina), Juan Carlos Ortiz (Chile), David Gower and Mark Wilkinson(UK), Sixto Inchaustegui (Dominican Republic), and Sonsoles San Román and Jamie Skinner (Spain). We also thankCraig Hilton-Taylor, Sanjay Molur, Bob Inger, Arvin Diesmos, Matt Foster, Mike Hoffmann, Penny Langhammer, DonChurch and David Knox who assisted in facilitating working groups during GAA workshops.John Pilgrim worked diligently on adding all the amphibians that were described since the 2004 release of thedata, including creating range maps for each of these species.Gustavo Fonseca, Claude Gascon, Russell Mittermeier, Tom Lacher, Tom Brooks, Larry Master, Bruce Stein andGeorgina Mace provided guidance and encouragement throughout the project, and we wish to express a special debt
13 Anzeige KalenderSolarkraftwerke in 2010 nach PlanFür fünf Solarkraftwerke des WattnerSolarfonds SunAsset 2 liegen nun dieErtragszahlen des Betriebsjahrs 2010 vor.Demnach haben die Anlagen im vergangenenJahr Strom und Einnahmen nach Plangeliefert und funktionierten selbst bei eisigenTemperaturen und Schnee reibungslos.Damit ist die Rendite für die Anlegerdes Wattner SunAsset 2 gesichert. Weitere5 neue Kraftwerke nahmen im Dezember2010 ihren Dienst auf.Anleger können noch bis 30. Juni 2011Anteile am SunAsset 2 zeichnen.Die Mindestbeteiligung beträgt 10.000,- €als Einmalanlage.Sie möchten mehr darüber wissen:Ulrich Schipporeit e.K.FinanzdienstleistungenSandwelle 14, 59494 SoestTelefon: 02921 - 15845ulrich@schipporeit.comwww.schipporeit.comIhr Spezialist für alternative InvestmentsTermine & Veranstaltungenim AprilDonnerstag, 31.03.2011Soest16:30 Vorlesestunde i. d. Bücherei, Thema: Popstar-Geschichten, m. M. Bange-Ohrmann, kostenlos18:00 Offener Treff f. Frauen m. gyn. Krebserkrankungen,Klinikum Stadt Soest, Haus im Park19:00 Reiki kennen lernen und praktizieren in Ampen,Anmeldung bei Brigitte Jansen 02921 94358819:00 Umgang m. d. Diagnose Psychose: Wem erzähleich davon? Gespr., Phönix, Alter Schlachthof19:30 Haltung u. Verhalten i. Kindesalter, Vortr. v. Chr.Schräder, Brunoschule, VBH, 02921-319313Werl17:00 DRK-Blutspendetermin: DRK-Heim, Kurfürstenring31Freitag, 01.04.2011Soest00:00 Ehrenamtswochenende, Schützenhalle Bremen,für alle Enser VereineWelver10:00 Sprechstunde für Blinde, Rathaus Welver, FrauZawidzki, 10.00-12.00 Uhr, 02384-51402Werl12:00 DRK-Blutspendetermin: Werl, DRK-Heim Kurfürstenring31Samstag, 02.04.2011Ense11:00 Ehrenamtswochenende in der Gemeinde Ense,Schützenhalle in Ense-BremenMöhnesee16:00 Entspannen, Stress abb., Auftanken, WE-Worksh. 2 x 3 Std., 32 €, VHS, 02921-32103-0Soest09:00 Kurs Brain Gym II, 2 Tage, Alter Schlachthof,Gerda M. Kolf, 160,-€, Tel. 02921/66 62 6409:00 Lebensrettende Sofortmaßnahmen, 6 h, 20 €,DRK, Oststr. 20, 0 2943-871 32009:30 Feng Shui, Grundkurs, Mensch, Haus u. Garten,Tages-Sem., 18 €, VHS, 02921-32103-015:00 Feldenkrais-Wochenende f. Anfänger u. Fortgeschrittene,24 €, VHS, 02921-32103-015:00 Entdecke d. Clown in dir, Worksh. m. Phönix,Selbsthilfegr. f. psych. Kranke, Schlachthof19:30 Tanzwerkstatt, Revue, Soester Balletstudio +Tanzstudio Alberti, Alter Schlachthof, 8,40€Wickede09:00 Lebensrettende Sofortmaßnahmen, 6 h, 20€,DRK, Oststr. 20, 0 2943-871 320Montag, 04.04.2011Soest08:00 Erste Hilfe Grundlehrgang, 2 Tg, 8-16:00, 30 €,DRK, Höggenstr. 30, 0 2943-871 32019:00 "Potenziale entdecken d. energ. Feng Shui",Vortrag, Kloster Paradiese, kostenlos19:00 Prüfungsangst verabschieden mit Kinesiologie,Alter Schlachthof, 20,- €, Tel. 02921/66 62 6420:00 Die Lebenskraft in Gräsern, Algen u. Keimen,Vortr. M. Kieserling, VHS, 5 €, 02921-1031313Arnsberg18:00 Russische Heilweisen, Basisseminar,Leitung: Angelika Gahmann, 02903-85088Werl17:00 DRK-Blutspendetermin: Werl, DRK-Heim Kurfürstenring31Dienstag, 05.04.2011Soest20:00 Jesus - zentr. Person d. Weltgeschichte? Vortr.v. Prof. Dr. Haudel, 5 €, VHS, 02921-1031313Wickede19:30 Mein Kind kommt in die Schule, Vortrag, VHSWerl, Bürgerhaus, 02922/9724-0
<strong>Introductory</strong> <strong>Chapters</strong>
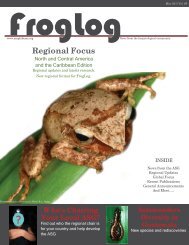
CHAPTER 1. AN INTRODUCTION TO THE AMPHIBIANSNeil Cox, Simon Stuart, Janice Chanson, Michael Hoffmann,David Gower, Mark Wilkinson, Don Church and Robin MooreFigure 1. Species richness map for amphibians in the Order Anura, with dark red colours corresponding to regions of higher richness. Colourscale based on 10 quantile classes. Maximum richness equals 142 species.Figure 2. Species richness map for amphibians in the Order Caudata, with dark red colours corresponding to regions of higher richness. Colourscale based on 10 quantile classes. Maximum richness equals 23 species.Figure 3. Species richness map for amphibians in the Order Gymnophiona, with dark red colours corresponding to regions of higher richness.Colour scale based on 8 quantile classes. Maximum richness equals 8 species.AN OVERVIEW OF AMPHIBIAN CLASSIFICATIONAND DIVERSITY<strong>Amphibian</strong>s are familiar to most people as frogs and toads, salamanders and newts, and toa much smaller group of people as caecilians. All amphibians are members of the tetrapodvertebrate Class Amphibia. There are more than 6,000 currently recognized species of extantamphibians, with representatives present in virtually all terrestrial and freshwater habitats,but absent from the coldest and driest regions, and from the most remote oceanic islands.The number of recognized species of amphibians has grown enormously in recent years,with a nearly 50% increase between 1985 and 2004 (Frost 1985, 2004) and an increasein species numbers of 25% in the years between 1992 and 2003 (Köhler et al. 2005) (andsee Essay 1.1). This unprecedented growth largely refl ects an increase in collecting workin previously remote locations, a signifi cant growth of active herpetological communitiesin a few megadiverse countries, and the application of complementary techniques, such asmolecular genetics, to support more traditional taxonomic methods. Even countries suchas Sri Lanka, in which biodiversity inventories were deemed to be relatively complete (seeEssay 1.2), are revealing startling levels of previously undocumented and unsuspecteddiversity. Unfortunately, as this book demonstrates, our rapid increase in the knowledgeof amphibian species diversity and biology is coincident with a massive global decline inamphibian populations.Frogs, Salamanders and Caecilians –the <strong>Amphibian</strong> OrdersThe <strong>Amphibian</strong>s are divided between three higher-level ranks or Orders: Gymnophiona,Anura and Caudata, with Anura and Caudata being more closely related to each other thaneither is to the Gymnophiona.Anura is comprised of the frogs (and their subgroup, the toads), and is by far the largestOrder, with 5,208 living species currently recognized 1 . Anurans are globally distributed,being found on every continent with the exception of Antarctica (Figure 1). While tropicalhabitats are richest in anuran diversity, frogs and toads may be encountered in manydifferent environments ranging from dry deserts, through tropical and temperate regionsto areas as far north as the Arctic Circle and as far south as Tierra del Fuego at the tip ofSouth America. The elevation at which frogs have been recorded ranges from sea level(or even below it in some cases) to as high as 5,244m asl in the Peruvian Andes (Seimonet al. 2006). Although anurans have a wide variety of body shapes, adult frogs and toadsare always tailless and have four limbs. The have a constrained and specialized bodyform including a very short body, an elongated pelvis, relatively large head, and twowell-developed hind legs used for jumping and/or swimming. The frogs and toads rangegreatly in size. The giant Goliath Frog Conraua goliath of West Africa may grow to over30cm (snout-vent length), while mature adults of the Flea-frog Brachycephalus didactylusof south-eastern Brazil and Eleutherodactylus iberia and E. limbatus of Cuba may be lessthan 1cm (snout-vent length). Virtually all species have external fertilization and mosthave aquatic larvae (tadpoles).The Caudata (salamanders and newts) contains 535 described living species and is thesecond largest of the three amphibian Orders, although representing only about 10% ofthe number of species as frogs. Salamanders and newts are less widely distributed thanthe frogs and toads, with families mostly concentrated in the north temperate regions(Figure 2); but about 40% of the species occur in the New World tropics. There are nosalamander or newt species in Sub-Saharan Africa, Madagascar, the Indian Subcontinentsouth of the Himalayas, insular Southeast Asia, and Australasia, and only a few in SouthAmerica and mainland Southeast Asia. The southern Appalachian Mountains of the easternUnited States is the centre of species diversity for the Caudata (see Essay 8.1). Around 60species of the family Plethodontidae (lungless salamanders) are found in this mountainrange, including many locally restricted species. Most salamanders and newts have theprimitive tetrapod body shape, with four limbs and a long fl attened tail, but there is alsoa tendency for body elongation and limb reduction or loss. They generally move over landby walking and aquatic species use their long tail for rapid swimming in water. Withinthe Caudata there are many well-known paedomorphic forms (sexually mature animalsretaining juvenile characteristics). The highly threatened Axolotl Ambystoma mexicanumof the Valley of Mexico is probably the most familiar paedomorphic species. The largestof the Caudata, and indeed of modern amphibians, is the rapidly declining Chinese GiantSalamander Andrias davidianus, which may grow to around 200cm in total length; thesmallest may be the salamander Thorius arboreus of Mexico, which has an average totallength of only around 1.7cm. Most salamanders have internal fertilization via a spermatophoreand aquatic larvae, but direct development of terrestrial eggs without an aquaticlife-stage whatsoever is also common.The Gymnophiona (caecilians) occur in the tropics of the Americas, Africa and Asia(Figure 3). In addition, caecilians are present on the Seychelles, but absent from Madagascar,New Guinea and Australasia; their apparent absence from much of the Congo Basin maybe due to lack of survey effort. With only 172 described species, this is the smallest of thethree amphibian Orders, even though the group is at least as old as all of the diversity ofsalamanders and frogs taken together. Because they tend to be rare animals in collections,the taxonomic status of many caecilian species is uncertain. According to our currentunderstanding of caecilian taxonomy, the two most species-rich genera are Ichthyophis(34 species) of South and Southeast Asia, and Caecilia (33 species) occurring mainly inSouth America. Caecilians are elongated and limbless, and they are sometimes mistakenfor snakes, eels or earthworms. The largest of the caecilians is the poorly known Caeciliathompsoni of Colombia, which may exceed 150cm in length. The smallest caecilian is probablythe threatened Grandisonia brevis of the Seychelles Islands, which grows little largerthan 11cm. In general, caecilians are ‘burrowing’ species and are most often encounteredin leaf-litter or under soil. A few are aquatic species (such as the Rubber Eel Typhlonectesnatans). Caecilian species show a relatively wide range of reproductive modes. All speciesseem to have internal fertilization and at least 31 of the known species are live-bearing.Oviparous caecilians lay their eggs on land have either direct development or an aquaticlarva (and see Essay 1.3).
Chapter 1. An Introduction to the <strong>Amphibian</strong>s 3<strong>Amphibian</strong> classification at the family levelAt a slightly finer taxonomic level, amphibians are divided up among 48 families, some ofwhich, like the recently named Nasikabatrachidae (Biju and Bossuyt 2003), are monotypic (includingonly a single species), whereas others, particularly the Hylidae and Leptodactylidae,are represented by hundreds of species, the latter including the genus Eleutherodactylus,the most speciose vertebrate genus with more than 600 species (see Essay 1.4). <strong>Amphibian</strong>classification was relatively stable for much of the 20 th century, but the very roots of theamphibian tree have been shaken by a new classification proposed by Frost et al. (2006).Frost and associates showed that a number of traditionally recognized groups (includingentire families) are para- or polyphyletic (in other words, they are not natural groups in termsof evolutionary history). The new classification proposed by Frost et al. (2006) appearedwhile this book was in preparation. Thus, we use the traditional classification of amphibianfamilies (following Frost 2004). However, in this chapter, we outline the new classification ofFrost et al. (2006), as amended by Grant et al. (2006) and Glaw and Vences (2006), to showsome of the major taxonomic changes that are now under discussion. We also discuss theimplications of Frost et al. (2006) in the regional introductory chapters.The Traditional View of <strong>Amphibian</strong> FamiliesScolecomorphidae. This poorly known family of caecilians comprises two genera, theWest African Crotaphatrema and East African Scolecomorphus, with three species ineach. We know very little about Crotaphatrema, as only seven individuals have ever beenseen, all from western Cameroon. The diversity of the genus Scolecomorphus is centredon eastern Tanzania. Two of the species are known to be live-bearing, and the third ispresumed to be so.This section presents the traditionally recognized amphibian families, alphabetically withineach order.Caecilians – GymnophionaCaeciliidae. This is the largest of the caecilian families, containing 113 species, distributedwithin 21 genera. Many of these species are known from fewer than 10 specimens and littleis known of species ranges and biological attributes. In this treatment, the semi-aquaticto aquatic species of South America, often recognized as the Family Typhlonectidae, areincluded in the Caeciliidae. Representatives are widely, but disjunctly, distributed throughoutmuch of the tropics, being found in South and Central America, West and East Africa, on theIndian Subcontinent and also on the Seychelles Islands (uniquely, there are more caecilianspecies in the Seychelles than there are frogs). Although the breeding biology of mostcaeciliid species remains poorly known at present, larval-developing, direct-developingand live-bearing species have all been recorded.Uraeotyphlidae. This small family of caecilians contains only fi ve species all of whichare in the genus Uraeotyphlus. The family is entirely restricted to the Western Ghats andsurrounding parts of southern India. The breeding biology of the family is poorly known, butthey are probably all oviparous species with terrestrial eggs and aquatic larvae.Salamanders and Newts – CaudataIchthyophiidae. This poorly known family of caecilians is widely distributed in SouthAsia and Southeast Asia. The 39 recognized species are divided between the two verypoorly delimited genera Ichthyophis and Caudacaecilia. However, many of the currentlynamed species are poorly circumscribed and require taxonomic confirmation. All taxa areegg-layers. The eggs are deposited in underground chambers and they are guarded by themother at least until hatching. The larvae may be encountered in waterlogged soil, streams,ponds and other waterbodies.Ambystomatidae – Mole Salamanders. This family of 30 species (all within the genusAmbystoma) is strictly North American (occurring south to central Mexico), where they rangewidely throughout much of the continent. Animals are largely terrestrial and breed in slowor still waters but some are stream-dwellers; all species undergo larval development. Thefamily includes a number of paedomorphic species that retain larval characteristics (suchas gills) as adults, including the famous Axolotl Ambystoma mexicanum.Rhinatrematidae. This poorly known family of caecilians is restricted to northern SouthAmerica, with most species known from the tropical Andes. The genus Epicrionops haseight species and Rhinatrema one. All species are presumed to lay eggs on land, with thelarvae living in waterbodies.Amphiumidae – Amphiumas. This family contains three species, all in the genusAmphiuma, and is endemic to the coastal plain of the eastern and south-eastern UnitedStates. These are relatively large, eel-like salamanders, which are specialized for a mostlyaquatic lifestyle. The eggs of these species are laid in a moist cavity on land close to thewater; the female guards the nest until the larvae hatch and are washed into the adjacentwater. An interesting feature of the larvae is their external gills, which disappear oncethe lungs develop.
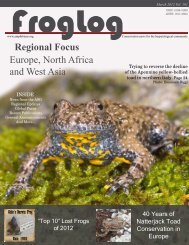
4Threatened <strong>Amphibian</strong>s of the WorldHynobiidae – Asian Salamanders. These salamanders are Asian with a centre of diversityin Japan, with only the very widespread Siberian Salamander Salamandrella keyserlingii alsopresent in extreme eastern Europe. There are 46 species divided between the seven genera,with Hynobius being the most speciose (27 species; see Essay 10.1). The salamanders of thisfamily are highly aquatic, living mostly in streams and pools, and have external fertilization,and the eggs are laid in two egg-sacs attached to rocks or submerged vegetation. In somespecies, the male is known to guard the eggs.The Pickerel Frog Rana palustris (Least Concern), found over much of eastern North America,is a typical representative of the very diverse amphibian Order Anura, which includes thefrogs and toads. © Don ChurchPlethodontidae – the Lungless Salamanders. This is the largest of the salamanderfamilies, with the vast majority of the 365 species being found in the New World (seeEssay 9.3). Outside of this region there are seven species known from Europe, and a single,recently discovered Asian species (Karsenia koreana) currently known only from the middleof the Korean Peninsula. Plethodontids are the only salamanders that have a substantialpresence in the New World tropics, where more than 60% of the species are found, mostof them in Central America. The family is generally present in a wide variety of habitatsincluding damp terrestrial areas, waterbodies (both stagnant and fl owing), cave and similarhabitats, and arboreal sites (such as within bromeiliads). Most of the species have directdevelopment, unique to this family among salamanders; however, at least 50 speciesundergo larval development.Cryptobranchidae – Giant Salamanders. This small family is entirely aquatic. Cryptobranchidaeare very large salamanders placed in three species in two genera (Andrias andCryptobranchus). The family has a disjunct distribution with species present only in East Asiaand the eastern United States. The species undergo larval development, with paired stringsof externally fertilized eggs deposited under stones or between rocks within streams andother waterbodies. This family contains the largest (~200cm) and the heaviest (~50kg) of themodern day amphibians, the Chinese Giant Salamander Andrias davidianus.Proteidae – Mudpuppies and Waterdogs. This small family of salamanders comprisesfi ve species in the genus Necturus, found in the streams of eastern North America, and thesingle strange species, the Olm Proteus anguinus, which is restricted to subterranean aquatichabitats within the Dinaric Alps of south-eastern Europe. All of the species are both aquaticand paedomorphic. The breeding biology of this family is poorly known; however, female Olmshave been recorded laying ~70 eggs on rocks, and, in addition, the species is occasionallylive-bearing with fully formed young born after a period of about two years.Dicamptodontidae – Pacific Mole Salamanders. This small family of relatively large,larval-developing salamanders is restricted to western parts of the United States, withone species occurring marginally in Canada. All four members are in the single genusDicamptodon. The eggs are deposited in clear streams, where they are attached singly torocks and other cover. The stream-adapted larvae take between 2 and 4.5 years to reachmetamorphosis and may achieve sexual maturity without metamorphosing. One species,Dicamptodon copei, is exclusively paedomorphic.Rhyacotritonidae – Torrent Salamanders. This small family of four species, all in thegenus Rhyacotriton, is endemic to the Coastal and Cascade Ranges of the western UnitedStates. Populations of these salamanders are usually closely associated with cold streamsin old-growth coniferous forest. All four species undergo larval development.
Chapter 1. An Introduction to the <strong>Amphibian</strong>s 5Salamandridae – Newts and Relatives. This family is widespread with representativespresent in Europe, North Africa, Asia and North America. Most of the species withinSalamandridae are aquatic breeders, laying eggs in ponds, streams and other suitablewaterbodies. A small number of the species, including the well-known Fire SalamanderSalamandra salamandra, are live-bearing.Ascaphidae – Tailed Frogs. The small family Ascaphidae contains only two species, bothin the genus Ascaphus. The family exhibits a number of primitive characteristics, and isunique among the frogs and toads in that animals posses a copulatory organ (the eponymous“tail”) that allows internal fertilization to take place in the fast-flowing streams they inhabit.The unpigmented eggs are attached as strings to the underside of rocks within the stream;the larvae also develop within this environment. The family is endemic to North America,where it is distributed in the north-western USA and south-western Canada.Sirenidae – the Sirens. This small family has two genera (Siren and Pseudobranchus)with four species, and is restricted to the south-eastern United States and northern Mexico.Animals are mostly aquatic; the eggs are deposited singly or in small numbers, and areattached to submerged vegetation.Astylosternidae. This family of stream-associated, larval-developing frogs has its centreof diversity in Cameroon, with a few species occurring more widely within the equatorialforest belt. Two genera, Astylosternus (11 species) and Leptodactylodon (15 species)dominate the family, with three monotypic genera, one of which, Trichobatrachus, is thefamous Hairy Frog.Frogs and Toads – AnuraAllophrynidae. This monotypic family is generally widespread in northern South America,where it ranges from Venezuela, through much of the Guiana region and into north andeastern Brazil 2 . The single species is largely associated with water bodies, where explosivebreeding and larval development take place. The classification of the family, and the singlerecognized species, Allophryne ruthveni, has been problematic. Allophryne has previouslybeen assigned to a number of families, including Allophrynidae, Bufonidae, Centrolenidae,Hylidae and Leptodactylidae.Bombinatoridae – Fire-bellied Toads. This small family of only 10, often colourful,species is widely distributed in Europe and Asia. There are two genera, Bombina (eightspecies), which mostly ranges from Western Europe into East Asia, and the poorly knowngenus Barbourula, that has only two known species, one present in the Philippines and onein Borneo. Bombina are all believed to undergo larval development; the reproductive mode ofBarbourula is currently unknown, but they are suspected to be direct-developing species.Arthroleptidae – Squeakers or Screaming Frogs. This family is dominated by thedirect-developing genus Arthroleptis (34 species), which is widely distributed in moremesic environments of the African mainland. Together with Schoutedenella, it is one ofthe most taxonomically confused groups of frogs in the world, with many species in Sub-Saharan Africa being of uncertain identity, and with large numbers of species remainingto be described. The third genus in the family, Cardioglossa (16 species), is represented bystream-associated, larval-developing frogs in West and Central Africa, with the centre ofknown diversity in Cameroon.Brachycephalidae – Saddle-back Toads or Pumpkin Toadlets. This small family oftoads is restricted to the humid forests of the Atlantic coast of south-eastern Brazil. There isa single genus, Brachycephalus, containing the eight known species 3 - fi ve of these havingbeen described since 1998. These small toads live in leaf litter on the forest floor, and are allbelieved to deposit a few large, terrestrial eggs and to undergo direct development.
6Threatened <strong>Amphibian</strong>s of the WorldBufonidae – True Toads. Members of the Bufonidae are near global in occurrence, being absentnaturally from Madagascar, New Guinea, Australia and surrounding islands. Species occupy awide variety of habitats, from very arid conditions to humid tropical rainforest. It is a speciosefamily and although the vast majority of the species have larval development, there are somedirect-developing and live-bearing species. The genus Nimbaphrynoides (two species), includes theonly fully viviparous frog species (with the embryos being nourished internally by the female).Heleophrynidae – Ghost Frogs. This small relict family of stream-associated, larvaldevelopingfrogs is endemic to southern Africa. All members are in the genus Heleophryne.These frogs are dependent on permanent streams because their tadpoles require twoyears to develop.This Spotted Salamander Hynobius naevius(Least Concern) is one of sixteen Hynobiussalamander species found only in Japan.The only other representatives of the FamilyHynobiidae are found in mainland China (sixspecies), the island of Taiwan (three), and theKorean Peninsula (three). © Henk WallaysCentrolenidae – Glass Frogs. This speciose Neotropical family ranges from southernMexico to Bolivia and north-eastern Argentina. The family is overwhelmingly concentratedin the tropical Andean countries (Colombia, Ecuador, Peru and Venezuela), where 124 species(90% of the total) occur. Most species are arboreal to some degree, and typically lay smallclutches of eggs on vegetation or rocks overhanging water. On hatching, the larvae fall intothe water below and complete their development. Members of this family are unusual, inthat the dorsal part of the body is commonly a shade of green, whereas the ventral side isoften transparent, allowing many of the internal organs to be seen.Hemisotidae – Snout-burrowers. This small family is widespread through much ofthe Sub-Saharan African mainland. All members are in the genus Hemisus. Eggs are laidunderground in a nest cavity, and the tadpoles subsequently move into water where theycomplete their development (the females sometimes digging channels for them to movefrom the nest to water).Dendrobatidae – Poison Frogs. The dendrobatids are almost exclusively confi ned tothe tropics of Central and South America. The greatest diversity is in the tropical Andeancountries, where 190 species (81% of the total) occur. A single species occurs in the LesserAntilles (on Martinique). Only a few species are the familiar brightly coloured animals oftenseen in the pet trade (especially in the genera Dendrobates, Epipedobates and Phyllobates);the majority are less colourful, including most species of the largest genus Colostethus (131species). Nearly all species have a larval phase. In some species an adult guards the eggsat the deposition site (such as a bromeliad), before carrying the hatched larvae on its backto water (usually a stream) where development is completed.Hylidae – True Treefrogs. This family is the second largest clade of amphibians and consistsof three subfamilies: Hylinae (Americas and northern Eurasia); Phyllomedusinae (tropical Americas);and Pelodryadinae (Australia, New Guinea and other islands). The family is particularlydiverse in the New World, with only a few hylid genera occurring elsewhere (see Essay 1.5).Hylids occur throughout the Americas (with the exception of the extreme north and south),and are also widespread in Australia and New Guinea. Elsewhere, there are a few speciesin Europe and northern Asia, but the family is absent from most of tropical Asia, and all ofSub-Saharan Africa and Madagascar. Many species are arboreal, although there are exceptions,with terrestrial and aquatic species also. The vast majority of species undergo larvaldevelopment. The subfamily Hemiphractinae, which included only species that undergo directdevelopment, was recently shifted to the family Leptodactylidae (Faivovich et al. 2005).Discoglossidae – Painted Frogs and Midwife Toads. This small family has its distributioncentred on the western Mediterranean Basin, with one species extending as far northas northern Germany, and a single species known from Israel (the now extinct Hula PaintedFrog Discoglossus nigriventer). The 12 species are divided between two genera, Alytes andDiscoglossus. Frogs of both genera undergo larval development in suitable waterbodies. Thebreeding behaviour of the genus Alytes is notable in that the males carry the strings of eggswrapped around their back legs, taking them to the water when they are ready to hatch.Hyperoliidae – African Treefrogs and Reed Frogs. This large family comprises 18genera, including Hyperolius (125 species), Leptopelis (51 species), Afrixalus (32 species) andKassina (13 species). Hyperoliids can be found in most habitats throughout the Afrotropicalregion, including Madagascar and the Seychelles Islands. Nearly all the members of thefamily undergo larval development, but a wide variety of reproductive strategies occurwithin the family. Under certain conditions, females of at least one species, Hyperoliusviridifl avus, can change into fully functional males (Grafe and Linsenmair 1989). Hyperoliidsare closely related to arthroleptids and astylosternids (with some authors suggestingthat Leptopelis is, in fact, closer to these groups than to other hyperoliids), sharing manycharacteristics with them.
Chapter 1. An Introduction to the <strong>Amphibian</strong>s 7Leiopelmatidae – New Zealand Frogs. This endemic New Zealand family comprisesfour largely terrestrial species in the single genus Leiopelma. The female lays large unpigmentedeggs in damp locations on the ground, which undergo direct development. Themales of three of the species (Leiopelma archeyi, L. hamiltoni and L. pakeka) actively guardthe eggs and transport the developing young. Leiopelmatidae is particularly interesting inthe apparent retention of a number of primitive characteristics for frogs (see Essay 6.2),mostly shared with Ascaphidae.Megophryidae – Asian Spadefoots. These often-large Asian frogs range from India andPakistan through much of Southeast Asia, to the Philippines, Borneo and the Sunda Islands.The family is quite diverse with 10 genera, the most species-rich of these being Xenophrys(31 species). All of the species undergo larval development in streams or similar habitats.Leptodactylidae – the Southern Frogs. This is by far the most speciose of all theamphibian families, with the genus Eleutherodactylus alone containing 610 species (andsee Essay 1.4). The Leptodactylidae are found throughout South and Central America, witha few species ranging as far north as the southern United States. The family is diversemorphologically, with some species exclusively adapted to terrestrial, arboreal or aquaticlifestyles. Even though the largest group in the family (Eleutherodactylinae) breed by directdevelopment, many are larval developing and at least one species, the Critically EndangeredGolden Coqui Eleutherodactylus jasperi, is live-bearing.Microhylidae – Narrow-mouthed Toads. This diverse, large Anuran family is globallywidely distributed, and may be encountered in many different habitats. The 69 recognizedgenera include many highly specialized forms, with a number of species adapted to eithera largely fossorial or arboreal lifestyle. Both larval-developing and direct-developmentreproductive modes have been recorded. Although many of the direct-developing speciesare found on New Guinea, there are direct-developing genera outside of this region suchas Breviceps in Africa and Myersiella in Brazil.Limnodynastidae. This family of 50 species is distributed from the Aru Islands of Indonesia,through New Guinea and much of Australia, to the island of Tasmania. Five genera(Adelotus, Heleiporus, Neobatrachus, Notaden and Philoria) are endemic to Australia, andonly five species occur outside of Australia, with four endemic to New Guinea. All of theeight genera are larval developing, with some genera (such as Limnodynastes) depositingeggs in floating foam nests. The Tusked Frog, Adelotus brevis, is unusual in that adultshave small tusk-like teeth sticking up from the bottom jaw; these might possibly be used indefence of the nest (Duellman and Trueb 1994).Hemiphractus fasciatus (Near Threatened) from Panama, Colombia and Ecuador, is one of sixspecies contained within in the newly proposed Family Hemiphractidae (currently includedin Leptodactylidae). All species are highly specialized treefrogs from primary rainforest thatfeed only on other frog species. © Edgargo Griffi thMantellidae. This family is endemic to Madagascar, and is dominated by the generaMantidactylus (86 species) and Boophis (53 species). However, by far the best-knownmembers of the family are the brightly coloured Madagascar poison frogs of the genusMantella (15 species). There are two other smaller genera. The family includes both larvalanddirect-developing species.
8Threatened <strong>Amphibian</strong>s of the WorldMyobatrachidae. This family is distributed in southern New Guinea and much of Australia,including the island of Tasmania. The family comprises 71 species and 11 genera, with thethree largest genera being Uperoleia (24 species), Crinia (15 species) and Pseudophryne(13 species). All species are endemic to Australia except for Crinia remota, which is foundin northern Australia as well as the southern lowlands of New Guinea (both Indonesia andPapua New Guinea), and Uperoleia lithomoda which occurs in northern Australia as wellas the southern lowlands of Papua New Guinea. Members are for the most part terrestrial,with a number of burrowing species (e.g., Arenophryne). There are both larval-developingand direct-developing species within the family. The monotypic genus Assa is unusual inthat the hatching larvae are carried in brood pouches on the hips of the male.Pelobatidae – Western Palaearctic Spadefoots. This small family consists of only fourspecies, all in the genus Pelobates, ranging from Morocco and Iberia in the west, throughEurope, Southwest Asia and the Caucasus Mountains to western Kazakhstan. All four speciesare larval developing, with adults generally spawning in stagnant temporary waterbodies.The adults are adapted to digging in soil, spending much of the year underground, andgenerally require uncultivated sandy habitats.Pelodytidae – Parsley Frogs. This small family, consisting of three species all in the singlegenus Pelodytes, has a disjunct distribution in south-western Europe and the CaucasusMountains. All species undergo larval development, with eggs laid in short strings.Nasikabatrachidae – Indian Burrowing Frog. This recently described, currently monotypic,family is known only from a few localities in the Western Ghats of southern India. Formuch of the year animals are fossorial, living up to 3.7m below ground. The species undergoeslarval development, with the adults coming to the surface for a few weeks each year tobreed and deposit their eggs in both temporary and permanent waterbodies. This new familyappears to be most closely related to the Sooglossidae of the Seychelles Islands.Petropedetidae. This family is widespread in Africa, and is dominated by the puddle frogsof the genus Phrynobatrachus (66 species). There are 13 genera in total, eight of whichare monotypic. Other genera are Cacosternum (10 species), Arthroleptella (7 species),Petropedetes (7 species) and Arthroleptides (3 species). The family exhibits a wide rangeof reproductive modes, although the great majority are larval developers.The most familiar of amphibian larvae arethe free-swimming ‘tadpoles’ of the frogsand toads. The body shape is roughly ovoid,with a long laterally compressed tail used forswimming. Pictured here is a larval WoodFrog Rana sylvatica (Least Concern). © TwanLeenders
Chapter 1. An Introduction to the <strong>Amphibian</strong>s 9Pipidae – Tongueless Frogs. This small, distinct family of highly aquatic frogs is restrictedto South America and Sub-Saharan Africa. The Pipidae is unique among frogs in that speciesdo not have a tongue. In African genera, such as Xenopus, small pigmented eggs are laidin water and undergo larval development. In the South American genus Pipa, the eggs arelaid into the females back and in some cases (such as in the Surinam Toad Pipa pipa) theseeggs develop directly into frogs without a larval stage.Rhinodermatidae – Darwin’s Frogs. This small terrestrial family from the temperateforests of Chile and neighbouring southern Argentina contains only two species, both withinthe genus Rhinoderma. The small clutches of unpigmented eggs are laid in leaf litter. InRhinoderma rufum, the male takes up the hatching larvae in its mouth and transfers themto water to complete their development. In Darwin’s Frog, Rhinoderma darwinii, the malenot only takes the larvae into its mouth, but also broods the larvae in the vocal sacs untildevelopment into froglets is completed.Ranidae – True Frogs. This is the third largest Anuran family, and with a few exceptions,for instance most of Australia and New Zealand, it has a very cosmopolitan distribution.Members of this family may be found in a wide variety of arid, temperate and humid tropicalhabitat types. While most reproduce through larval development, there are a number ofdirect-developing genera such as Platymantis. The Ranidae contains the largest living anuran,the Goliath Frog Conraua goliath, which can grow to over 30cm and weigh over 3kg.Rhinophrynidae – Burrowing Toad. This monotypic family is largely restricted to thecoastal lowlands of Central America. The single species, Rhinophrynus dorsalis, is for themost part fossorial, coming only to the surface to mate during the rainy season; the eggsand larvae develop in temporary pools formed by heavy rains.Rhacophoridae – Asian Treefrogs. This large family of mostly arboreal frogs is widelydistributed in Asia and Africa. Of the nine genera, the most species-rich are Philautus (146species) and Rhacophorus (64 species), both of which are restricted to Asia. The familyincludes a diversity of both larval- and direct-developing species. Some species of the genusRhacophorus have extensively webbed toes that enable them to glide between trees.Scaphiopodidae – North American Spadefoots. This small family of seven species,divided between the two genera Scaphiopus and Spea, has been included by some authors inthe family Pelobatidae. All of the species tend to burrow in loose soil, with adults emergingto breed in temporary pools during the rainy season. In general, the larvae develop quicklybefore the seasonal desiccation of their habitat.Rheobatrachidae – Gastric-brooding Frogs. This family was restricted to easternQueensland, Australia, and is now considered to be extinct. There were only two speciesin the family, Rheobatrachus silus and R. vitellinus, both of which shared a uniquereproductive mode. The eggs and larvae were brooded within the stomach of the female,with the larvae feeding off of the egg yolk before emerging from their mother’s mouth asfully formed frogs (see Essay 6.1). The status of this family has long been controversial,with a number of authors including it as a subfamily within either the Limnodynastidae orthe Myobatrachidae.Sooglossidae – Seychelles Frogs. This family is endemic to the Seychelles Islands, andcomprises four species in two genera. Three species breed by direct development, and inone the larvae are carried on the adults’ backs.
10Threatened <strong>Amphibian</strong>s of the WorldIchthyophiidae. Frost et al. (2006) include the Uraeotyphlidae in this Indomalayan family,but its content is otherwise unchanged.Direct development is one of the three basicamphibian breeding strategies. In this photograph,the young of the Bornean shrub-frogPhilautus amoenus (Vulnerable) can be seendeveloping into frogs without undergoing afree-living larval stage. © Andreas & ChristelNöllertThe Proposed Revisions to <strong>Amphibian</strong> FamiliesFor some time it has been recognized that the traditional classification of amphibian families,especially among the frogs, does not refl ect their evolutionary relationships (e.g., Darst andCannatella 2004; Faivovich et al. 2005; Grant et al. 2006). Frost et al. (2006) proposed a newtaxonomy of living amphibians, based on analysis of the interrelationships of 522 speciesselected to the best of their ability to refl ect the entire amphibian tree, using moleculargenetic data and also taking into account anatomical features, especially of larvae, followingHaas (2003). The hypothesized evolutionary tree of amphibians, which was modifi edsomewhat by Grant et al. (2006) is summarized to the level of families in Essay 1.6. Themerits and demerits of this new taxonomy are currently the subject of considerable debateamong herpetologists. One group (e.g., Frost et al. 2006) emphasizes the need to move toa monophyletic taxonomy but retain traditional nomenclature which has been more-or-lessuniversally employed for 250 years. The other group (e.g., Cannatella and Hillis 2004; Hillis2007) emphasize the need for a monophyletic taxonomy, but promote abandoning traditionalnomenclature for a new approach that they argue better reflects understanding of phylogeny,while simultaneously arguing that caution is needed before adopting any changes prior tomore thorough investigation. Frost et al. (2006) acknowledge that their proposal will be subjectto changes as more information becomes available, as has already happened in the caseof Grant et al. (2006). In addition, there are differences of opinion among authors regardinghow data are to be analysed, probably the most serious issue at hand. Although this willbe a period of intense instability, the end result should be a much improved understandingof amphibian evolutionary relationships and a taxonomy that refl ects this. Whatever theoutcome of this debate, it is clear that: a) the traditional classification of amphibian families,which forms the basis of the analysis in this book, will not survive; and b) although therewill certainly be some changes to our understanding of the amphibian tree in coming years,much of what is proposed by Frost et al. (2006) is likely to be adopted.Much of the current debate concerning Frost et al. (2006) is focused on the generic, ratherthan the family level. This debate focuses in particular on the splitting up of three largegenera, Eleutherodactylus, Bufo and Rana, but we do not discuss this further. It should benoted that the genus Craugastor was separated from Eleutherodactylus by Crawford andSmith (2005), and we do follow this change. In addition, the formerly large genus Hyla wassplit by Faivovich et al. (2005), a change that we have included.Below, we go through the Frost et al. (2006) proposed new family structure for amphibians,as amended by Grant et al. (2006), in the order of the amphibian tree (Essay 1.6). Althoughthere are many changes at the family level, the most far-reaching and complex have to dowith the splitting up the Leptodactylidae and Ranidae, and the changes to these two familiesalso impact several families that were previously recognized.Caecilians – GymnophionaCaeciliidae. Frost et al. (2006) include the Scolecomorphidae in this pantropical family,but its content is otherwise unchanged.Rhinatrematidae. This family remains unchanged.Salamanders and Newts – CaudataCryptobranchidae. This family remains unchanged.Hynobiidae. This family remains unchanged.Rhyacotritonidae. This family remains unchanged.Amphiumidae. This family remains unchanged.Plethodontidae. This family remains unchanged.Proteidae. This family remains unchanged.Sirenidae. This family remains unchanged.Ambystomatidae. Frost et al. (2006) include the Dicamptodontidae in this North Americanfamily, but its content is otherwise unchanged.Salamandridae. This family remains unchanged.Frogs and Toads – AnuraLeiopelmatidae. Frost et al. (2006) include the Ascaphidae in this family, returning to thetaxonomy prior to Ford and Cannatella (1993), but its content is otherwise unchanged. Asa result, this family now contains six species, and its distribution is in New Zealand andthe Pacifi c Northwest of North America, with the New Zealand species breeding by directdevelopment, and the North American ones by larval development.Pipidae. This family remains unchanged.Rhinophrynidae. This family remains unchanged.
Chapter 1. An Introduction to the <strong>Amphibian</strong>s 11Alytidae. This is the revised name for the family Discoglossidae, the content of whichotherwise remains unchanged.Myobatrachidae. Frost et al. (2006) include the Rheobatrachidae in this family, and transferthe genus Mixophyes to this family from the Limnodynastidae. There are almost 80 describedspecies from Australia and New Guinea.Bombinatoridae. This family remains unchanged.Megophryidae. This family remains unchanged.Pelobatidae. This family remains unchanged.Pelodytidae. This family remains unchanged.Hemiphractidae. Frost et al. (2006) separate this family from the Leptodactylidae andpartitioned it further to address its non-monophyly as also suggested by Darst and Cannatella(2004). It consists of one small genus, Hemiphractus (comprising six species), ranging fromPanama to the upper Amazon Basin. These species are highly specialized treefrogs fromprimary rainforest that feed only on other species of frog. They breed by direct development,with the eggs being carried on the female’s back.Scaphiopodidae. This family remains unchanged.Heleophrynidae. This family remains unchanged.Sooglossidae. Frost et al. (2006) include the Nasikabatrachidae in this family, consistentwith the phylogenetic placement of this taxon by Biju and Bossuyt (2003), but its content isotherwise unchanged. As a result, this primitive family now contains five species, and itsdistribution is in the Seychelles Islands and the Western Ghats of southern India.Batrachophrynidae. Frost et al. (2006) separate this family from the Leptodactylidae(consistent with work by San Mauro et al. 2005). It consists of three small genera (collectivelycomprising just six species), Batrachophrynus, Caudiverbera and Telmatobufo, from southernChile and north into southern Andean Peru and Bolivia. These species are highly aquatic andbreed by larval development. Frost et al. (2006) suggested that Batrachophrynus might notbe in this group; should Batrachophrynus be found to be close to Telmatobius, the name forthis family will become Calyptocephalellidae.Brachycephalidae. The nomenclatural effect of Frost et al. (2006) showing that Brachycephalus(Brachycephalidae) is imbedded within the Eleutherodactylinae (genera Adelophryne,Atopophrynus, Barycholos, Dischidodactylus, Craugastor, Eleutherodactylus, Euparkerella,Geobatrachus, Holoaden, Ischnocnema, Phrynopus, Phyllonastes and Phyzelaphryne) isthat the name of the combined large group becomes Brachycephalidae, a new groupingof nearly 800 species covering all of South and Central America (except Chile and most ofArgentina, Paraguay and Uruguay) and the Caribbean islands, with a few species rangingas far north as the southern United States. With the exception of Eleutherodactylus jasperi,which is live-bearing, all members of this family so far examined lay eggs that developdirectly without a larval stage.Cryptobatrachidae. Frost et al. (2006) separate this family from the Leptodactylidae. Itconsists of two genera (collectively comprising 21 species), Cryptobatrachus and Stefaniaconfined to moderate to high elevations in northern South America (the Colombian Andes, theSierra Nevada de Santa Marta, and the Guianan Shield in Guyana, Venezuela and northernBrazil). They exhibit direct development, with the eggs being carried on the female’s back.Limnodynastidae. Frost et al. (2006) transfer the genus Mixophyes from this family tothe Myobatrachidae, but otherwise this family is unchanged. There are about 45 describedspecies from Australia and New Guinea.
12Threatened <strong>Amphibian</strong>s of the WorldOreophryne wapoga (Data Deficient) is amicrohylid frog from New Guinea in whichthe eggs develop directly without a free-livinglarval stage. The male parent guards the eggson the ground, and transports the juveniles onits back, as shown here. © Rainer GüntherLeptodactylidae 4 . Frost et al. (2006) split the Leptodactylidae into nine families (alsocomprising the traditionally recognized Brachycephalidae and Rhinodermatidae). These ninefamilies are: Amphignathodontidae; Batrachophrynidae; Brachycephalidae; Ceratophryidae;Cryptobatrachidae; Cycloramphidae; Hemiphractidae; Leptodactylidae; and Thoropidae. However,Grant et al. (2006) merged the Thoropidae into the Cycloramphidae, split the Hylodidaeout of the Cycloramphidae, and split the remaining Leptodactylidae into Leptodactylidaeand Leiuperidae. Under this arrangement, the Leptodactylidae contains just four genera(Hydrolaetare, Leptodactylus [including former Adenomera and Lithodytes], Paratelmatobiusand Scythrophrys) and about 75 species that breed in water with larval development (withsome species building foam nests). The family ranges widely in South and Central Americaand the Caribbean islands, north to the southern United States, but is absent from Cuba,Chile and southern Argentina.Amphignathodontidae. Frost et al. (2006) separated this family from the Hemiphractidae.It consists of two genera, Flectonotus and Gastrotheca (collectively comprising around60 species), ranging from Costa Rica south to northern Argentina, southern Brazil, andTrinidad and Tobago. These species, collectively termed marsupial frogs, possess a dorsalpouch for brooding their eggs (which can develop with or without a free-living larval stage,depending on the species).Cycloramphidae. Frost et al. (2006) separate this family from the Leptodactylidae, and torender it monophyletic included the traditionally recognized Rhinodermatidae within it. Subsequently,Grant et al. (2006) added the genus Thoropa to this family, but removed the generaCrossodactylus, Hylodes, and Megaelosia to the family Hylodidae. With these changes, theCycloramphidae consists of 12 genera (collectively comprising around 90 species), Alsodes,Crossodactylodes, Cycloramphus, Eupsophus, Hylorina, Limnomedusa, Macrogenioglottus,Odontophrynus, Proceratophrys, Rhinoderma, Thoropa and Zachaenus, occurring in southerntropical and temperate South America. Most species breed by larval development, though insome cases the larvae are terrestrial, or live in the splash zones of waterfalls.Hylidae. This family remains unchanged.Centrolenidae. Frost et al. (2006) include the Allophrynidae in this family, but its contentand overall distribution is otherwise unchanged.Leiuperidae. Grant et al. (2006) separate this family from the Leptodactylidae. It consistsof fi ve genera (collectively comprising around 70 species), Edalorhina, Physalaemus,Pleurodema, Pseudopaludicola and Somuncuria, ranging from Mexico south to Argentina.They breed by larval development, and some species make foam nests.Ceratophryidae. Frost et al. (2006) separate this family from the Leptodactylidae. It consistsof seven genera (collectively comprising around 80 species), namely Atelognathus, Batrachyla,Ceratophrys, Chacophrys, Insuetophrynus, Lepidobatrachus, and Telmatobius, rangingfrom Colombia south to Chile and Argentina. They breed by larval development.Bufonidae. This family remains unchanged.Hylodidae. Grant et al. (2006) separate this family from the Cycloramphidae. It consistsof three genera (collectively comprising nearly 40 species), Crossodactylus, Hylodes, andMegaelosia, mainly restricted to southern Brazil, but ranging into nearby Argentina andParaguay. They undergo larval development.
Chapter 1. An Introduction to the <strong>Amphibian</strong>s 13Aromobatidae. Grant et al. (2006) separate this family from the Dendrobatidae. Grant et al.’srevision of the Dendrobatidae and Aromobatidae results in great changes in the allocation ofspecies to the traditionally recognized genera. The Aromobatidae consists of nearly 90 speciesin five genera and three subfamilies, occurring in tropical South America, north to Nicaragua,with one species on Martinique in the Lesser Antilles. The reproductive modes of these speciesare the same as described for the traditionally recognized Dendrobatidae above.Hyperoliidae. Frost et al. (2006) remove the genus Leptopelis from this family from Africa,Madagascar and the Seychelles, but its content is otherwise unchanged.Dendrobatidae. Grant et al. (2006) separate the Aromobatidae from this family, leavingnearly 160 species in 11 genera and three subfamilies, occurring widely in tropical SouthAmerica, north to Nicaragua. The reproductive strategies of these species are the same asdescribed for the traditionally recognized Dendrobatidae above.Brevicipitidae. Frost et al. (2006) separate this family from the Microhylidae, followingLoader et al. (2004). There are five genera (Balebreviceps, Breviceps, Callulina, Probreviceps,and Spelaeophryne) and 24 species occurring in eastern and southern Africa, from Ethiopiasouth to South Africa. Where known, all species breed by direct development.Hemisotidae. This family remains unchanged.Microhylidae. Frost et al. (2006) removed the African family, Brevicipitidae, from thisfamily, but otherwise its content remains unchanged, though it is now much less diverse inAfrica. The Microhylidae consists of at least seven very distinct subfamilies: Asterophryninae(southern Philippines and Sulawesi to northern Australia; direct developing); Cophylinae(Madagascar; non-feeding larvae); Dyscophinae (Madagascar; larval developing); Gastrophryninae(the Americas; larval developing); Melanobatrachinae (Eastern Arc Mountains ofTanzania and the Western Ghats of India; larval developing); Microhylinae (South, Southeastand East Asia; larval developing); Scaphiophryninae (Madagascar; larval developing), withseveral genera still unassigned in Africa and Asia.Ptychadenidae. Frost et al. (2006) separate this family from the Ranidae. There are threegenera (Hildebrandtia, Lanzarana, Ptychadena) and 51 species occurring widely in Sub-SaharanAfrica and Madagascar. All species reproduce by larval development in water.Ceratobatrachidae. Frost et al. (2006) separate this family from the Ranidae as phylogeneticallydistinct. There are six genera (Batrachylodes, Ceratobatrachus, Discodeles, Ingerana,Palmatorappia, Platymantis) and almost 80 species occurring from southern China, thoughMyanmar, adjacent Thailand, Peninsular Malaysia, northern Borneo, the Philippines, NewGuinea, the Admiralty and Bismarck Archipelagos, the Solomon Islands, Fiji and Palau. Allspecies breed by direct development.Arthroleptidae. Frost et al. (2006) merge the Astylosternidae into this family, and alsotransfer the genus Leptopelis from the Hyperoliidae to this family, which consists ofaround 130 species, widely distributed in Sub-Saharan Africa. It includes both direct- andlarval-developing species.
14Threatened <strong>Amphibian</strong>s of the WorldMicrixalidae. Frost et al. (2006) separate this family from the Ranidae. There is a singlegenus (Micrixalus) and 11 species restricted to the Western Ghats of southern India. Allspecies exhibit larval development.Dicroglossidae. Frost et al. (2006) establish this new family from genera previouslyassigned to Ranidae, but found to be distantly related to that group. It includes 11 genera(Annandia, Eripaa, Euphlyctis, Fejervarya, Hoplobatrachus, Limnonectes, Minervarya, Nannophrys,Nanorana, Occidozyga, Ombrana, Quasipaa, and Sphaerotheca) and 143 speciesthat are widely distributed in South, East and Southeast Asia (as far east as the Philippinesand the Lesser Sunda Islands), with one species in Sub-Saharan Africa and another on theArabian Peninsula. All species breed by larval development.Phrynobatrachidae. Frost et al. (2006) separate this family from the Petropedetidae asphylogenetically distant. There is one genus Phrynobatrachus (including Dimorphognathusand Phrynodon and excluding Ericabatrachus, which Scott [2005] transferred to what isnow Pyxicephalidae) and almost 70 species occurring widely in Sub-Saharan Africa. Mostspecies breed by larval development.Nyctibatrachidae. Frost et al. (2006) establish this new family from genera previouslyassigned to Ranidae. It is composed of two genera (Nyctibatrachus, Lankanectes) and 13species that are endemic to Sri Lanka and the Western Ghats of southern India. All speciesbreed in water with larval development.Petropedetidae. Frost et al. (2006) make major changes to the content of this family. All theexisting genera in the family, except for Petropedetes and Arthroleptides, are moved to twonew families endemic to the Afrotropics, Phrynobatrachidae and Pyxicephalidae. However,two genera are transferred from Ranidae to Petropedetidae: Conraua, and Indirana (thislast genus of 10 species occurring only in the Western Ghats of southern India). Under thisarrangement, Petropedetidae becomes a small family of just 26 species, 16 in tropical Africaand 10 in India. All species breed by larval development, and many have larvae associatedwith the splash zones of waterfalls.Ranidae. Frost et al. (2006) split the Ranidae into eight families (also comprising the traditionallyrecognized Petropedetidae) to remedy the polyphyly of the Ranidae as traditionallyrecognized. These eight families are: Ceratobatrachidae; Dicroglossidae; Micrixalidae;Nyctibatrachidae; Petropedetidae; Ptychadenidae; Pyxicephalidae; and Ranidae. Underthis arrangement, the Ranidae contains just eight genera (Amnirana, Amolops, Huia,Meristogenys, Pseudoamolops, Pterorana, Rana and Staurois, though Frost et al. [2006]redelimited and recognized several new genera) and 310 species that breed in water withlarval development. The family ranges widely throughout Eurasia and tropical Asia, to northernAustralia and the Solomon Islands, throughout North America south to northern SouthAmerica, and also in tropical Africa. It is absent from the Caribbean islands, Madagascarand New Zealand, and from most of southern Africa, Australia and most of South Americasouth of the Amazon basin.Pyxicephalidae. Frost et al. (2006) establish this new family from genera previouslyassigned to Petropedetidae and Ranidae, largely consistent with a monophyletic groupfi rst recognized by Van der Meijden et al. (2005). It comprises 13 genera (Amietia, Afrana,Anhydrophryne, Arthroleptella, Aubria, Cacosternum, Ericabatrachus [transferred to thisgroup by Scott 2005], Microbatrachella, Natalobatrachus, Nothophryne, Poyntonia, Pyxicephalus,Strongylopus, and Tomopterna) and 61 species that are widely distributed inSub-Saharan Africa. Most of the species breed by larval development, but some aredirect developers.Mantellidae. This family remains unchanged, although Glaw and Vences (2006) haverecently provided a completely revised taxonomy that bears little resemblance to whatpreceded it.Rhacophoridae. This family remains unchanged.In summary, under the revisions of Frost et al. (2006) and Grant et al. (2006), nine traditionallyrecognized families disappear (Scolecomorphidae, Uraeotyphlidae, Dicamptodontidae,Ascaphidae, Nasikabatrachidae, Rheobatrachidae, Allophrynidae, Rhinodermatidae,Astylosternidae), and 17 new families are established (Batrachophrynidae, Hemiphractidae,Cryptobatrachidae, Amphignathodontidae, Ceratophryidae, Cycloramphidae, Leiuperidae,Hylodidae, Aromobatidae, Brevicipitidae, Ptychadenidae, Ceratobatrachidae, Micrixalidae,Phrynobatrachidae, Pyxicephalidae, Dicroglossidae, Nyctibatrachidae). The number ofamphibian families increases from 48 to 56.Reproduction, Parental Care, and MetamorphosisThe characteristic most closely associated with amphibians is their ability to live in bothterrestrial and freshwater environments – they are amphibious. Movement of amphibiansbetween land and water is commonly linked to breeding activity. Adults move from terrestrialhabitats to spawn in water, the resulting free-living larvae are aquatic, and fully developedyoung return to land following the process of metamorphosis. However, there are many ex-
Chapter 1. An Introduction to the <strong>Amphibian</strong>s 15ceptions to this lifestyle, including species that complete their entire live cycles in terrestrialhabitats (such as many caecilians and the Puerto Rican Coqui Frog Eleutherodactylus coqui);species that are wholly aquatic (e.g., frogs of the genus Pipa); and many species that undergodirect development or are live-bearing, bypassing the free-living larval stage.<strong>Amphibian</strong>s use either internal or external fertilization. With very few exceptions, thefertilization of eggs in frogs and toads is external, while the vast majority of salamandersand newts, and probably all caecilians, have internal fertilization. Among the frogs and toads,the only species known to exhibit forms of internal fertilization are members of the familyAscaphidae, the live-bearing African toad genera Nimbaphrynoides and Nectophrynoides,the African toad species Mertensophryne micranotis and the live-bearing frog from PuertoRico Eleutherodactylus jasperi. Within the salamanders and newts, the families Hynobiidae,Cryptobranchidae, and possibly the Sirenidae, have external fertilization (Duellmanand Trueb 1994).The eggs of amphibians are commonly formed of one or several semi-permeablegelatinous membranes surrounding the ovum. These membranes allow gasses and waterto pass freely through the egg and also protect the egg against damage, desiccation,infection and predation. Eggs are most often deposited (oviposition) in water bodies or indamp sites (such as underneath moist leaf-litter) where desiccation is unlikely to preventsuccessful development.The most familiar of amphibian larvae are the free-swimming ‘tadpoles’ of frogsand toads. The body shape of most anuran larvae is roughly ovoid, with a long laterallycompressed tail used for swimming. The mouthparts are generally formed of upper andlower horny beak-like jaws, with surrounding oral papillae. Anuran larvae are commonlyherbivorous with a gut that is often quite long in order to process plant matter. The larvaeof salamanders and newts tend to have a very similar morphology to that of the adults, withnoticeable external differences being their smaller size, external filamentous gills, flattenedtail fin, and the lack of a true tongue. The young of larval-developing caecilians are eel-likeand superficially similar in form to the adult animals. Caecilian larvae differ from the adultsin having a tail fin, a spiracle and gill slits, lateral line organs and expanded lips for suctionfeeding. While some caecilians hatch with external gills, these are generally reabsorbedinto the body or shed within a few days.Reproductive modesWhile most amphibian species lay eggs (oviparous), there are in general three main breedingmodes: those that lay eggs and have a free-living larval stage; those that lay eggs andundergo direct development, circumventing the larval stage; and the non-egg laying livebearing(viviparous and ovoviviparous) species, in which the young develop completely, orto some large degree, within the female.Having a larval stage is by far the most common, and perhaps the most familiar, amphibianreproductive mode. This mode of reproduction has been recorded in more than two-thirdsof the world’s ~6,000 amphibian species (see Chapter 4), perhaps being completely absentonly from the families Brachycephalidae, Leiopelmatidae, Typhlonectidae and Scolecomorphidae(though in several families, such as Arthroleptidae, Leptodactylidae, Microhylidae,Plethodontidae and Rhacophoridae, many species do not have a larval stage). In the majorityof species, the eggs are laid within a suitable water-body, which may range in size from aleaf-axil to a large lake, and hatch into free-living aquatic larvae (tadpoles) that completetheir development and undergo metamorphosis before leaving the water.In the majority of direct-developing species, a reproductive mode that is particularlycommon within the families Arthroleptidae, Caeciliidae, Leptodactylidae, Microhylidae,Plethodontidae and Rhacophoridae, the eggs are deposited in a damp or moist terrestrialsite (such as underneath leaf-litter, bark or rocks), where they complete development,sometimes under the umbrella of paternal care, and hatch as fully formed young. Advantagesto a direct-development strategy include reduced vulnerability to aquatic predators and todrying up of wetlands.A very few amphibian species (less than 2% of all species) have a live-bearing reproductivemode. Ovoviviparous species include all species in which the young undergodevelopment within the female obtaining nourishment from the yolk alone. In viviparousspecies the developing young obtain additional nourishment from the female. In mostovoviviparous or viviparous species very few well-developed young are born. Many ofthe known live-bearing amphibian species are caecilians of the families Caeciliidae (28species) and Scolecomorphidae (three species). Within the salamanders and newts thereare 12 live-bearing species in the genera Salamandra and Lyciasalamandra (some speciesof Salamandra give birth to free-living larvae that complete their development in water).There are few known live-bearing frog and toad species (14 species in total), relative to thediversity of the Order as a whole. Most of these species, such as the Critically EndangeredKihansi Spray Toad Nectophrynoides asperginis and Golden Coqui Eleutherodactylus jasperiare ovoviviparous, with the equally highly threatened Nimbaphrynoides liberiensis andNimbaphrynoides occidentalis being the only known truly viviparous frogs.For the purposes of analysis in this book, amphibian reproductive modes have beencombined into three general groups: larval developing - species that lay eggs, from whichfree-living larvae hatch; direct developing – species that lay eggs in which the young developinto the adult form, and undergo any metamorphosis prior to hatching; and live-bearing– species that do not lay eggs, and give birth to young animals.Parental CareWhile most amphibian species show very little or no parental care after initial egg deposition,there are a number of instances where the care of both eggs and larvae is highly developed.Parental care can include the production of foam nests in which the eggs develop (Anura),driving away predators (including conspecifics), moistening and aeration of the eggs, oscillation(or turning) of eggs, the removal of damaged or infected eggs from the clutch, andpossibly the application of protective skin secretions to prevent pathogen growth (Duellmanand Trueb 1994; Stebbins and Cohen 1995). Some well-known examples of protection include:the African Bullfrog Pyxicephalus adspersus that will attack much larger animals andpeople that come close to the nest site; the construction and guarding of shallow nestingbasins by males of the frog Hypsiboas rosenbergi; the large aquatic Hellbender SalamanderCryptobranchus alleganiensis that defends eggs against predation; and, where known, theterrestrial eggs of oviparous caecilians are attended by the female until they hatch intoaquatic larvae (Duellman and Trueb 1994; Stebbins and Cohen 1995).In some instances the eggs or larvae are actively transported by one of the adults. Followingamplexus, the strings of eggs of midwife toads (Alytes spp.) are collected on thehind legs of the male, which are carried (with periodic moistening in water) until the larvaebegin to hatch. The male then transports them to water where they hatch and completetheir development. Many of the species of dendrobatid frogs from the Neotropics (includinga number of the well-known Poison Frogs) show quite advanced parental care. In additionto the adults guarding the terrestrial site of egg deposition, the larvae upon hatching aretypically transported on the back of one of the adults to a stream or water-fi lled bromeliadwhere development is completed. Similar behaviour has also been recorded in two ranid frogs(Limnonectes fi nchi and L. palavanensis) from Borneo, the sooglossid Sooglossus seychellensis(in which larval development is completed on the adults’ back), in the Leiopelmatidae(in which the males of Leiopelma archeyi, L. hamiltoni and L. pakeka transport the young ontheir back), and most recently in the New Guinea microhylids Liophryne schlaginhaufeni,Sphenophryne cornuta, Oreophryne cf. wapoga and the newly described Callulops pullifer(Inger et al. 1986; Inger and Voris 1988; Duellman and Trueb 1994; Stebbins and Cohen 1995;Günther et al. 2001; Bickford 2002; Günther 2006).Forms of brooding developing eggs within pouches or body cavities have evolvedin a number of amphibian species. For example, the eggs of the well-known aquatictoads of the genus Pipa develop on the back of the female, with either larvae or toadletsemerging from under the skin. Several leptodactylid genera (Hemiphractus, Gastrotheca,Flectonotus, Stefania) contain species in which the eggs are carried in pouches, or areglued to the back of the adult. Depending on the species, the eggs either develop directlyinto froglets, or are released from the adult as well-developed non-feeding larvae. Thehatching larvae of the monotypic Australian genus Assa climb into hip pouches on the male,where they may remain for around two months feeding on the yolk sac before emergingas fully developed froglets.The two species of the genus Rhinoderma from southern Argentina and Chile are theonly known examples of vocal sac brooding amphibians. The male Darwin’s Frog Rhinodermadarwinii collects recently hatched larvae into the vocal sac where they complete theirdevelopment, eventually emerging from the male’s mouth as froglets. Similarly, the two,now extinct gastric-brooding species of Rheobatrachus from eastern Australia were uniquein that the female picked up the eggs that then completed their development to frogletsentirely within the female’s stomach (see Essay 6.1). As with Darwin’s Frog, Rheobatrachusfroglets emerged from the mouth once fully developed.There are a few instances known of amphibians actively providing nourishment to thedeveloping larvae. Females of a number of species in the genus Dendrobates regularly layunfertilized eggs into the bromeliads and leaf axils in which their larvae are developing.The larvae rely on these eggs as a source of nutrition, and may not survive if the eggsare not deposited. The developing larvae of the Critically Endangered Mountain ChickenLeptodactylus fallax feed exclusively on unfertilized eggs provided by the female; with asmany as 10,000 to 25,000 unfertilized eggs deposited in total (Gibson and Ley 2004). Theyoung of the caecilian Boulengerula taitana have recently been found to nourish themselvesby stripping and eating the outer layer of their mother’s skin. This form of parental caremight be common in direct-developing caecilians, but is not known from other amphibians(Kupfer et al. 2006).MetamorphosisThe process of metamorphosis from the larval stage to adult form is often dramatic inamphibians. In general, an internal release of the hormone thyroxine prepares the organsand tissues of the larval amphibian for metamorphosis. The timing of the thyroxine releaseis largely determined by both environmental factors (such as overcrowding or predationlevels) and chemical factors, including a reduction in the corticoid hormones that inhibitthyroxine release (Zug et al. 2001).The transformation is most striking in the frogs and toads. During metamorphosis, thelarvae begin to develop all their limbs (including the strong hind legs), larval mouthpartsare replaced by true jaws and teeth, the tail is reabsorbed, the glandular outer skin of theadult develops, the gut changes to process a more carnivorous diet, the lungs continue theirdevelopment, and the skeleton hardens. As salamander young often closely resemble theadults, metamorphosis appears to be less remarkable. However, significant changes do takeplace, including the reabsorbtion of the external gills and the tail fi n, and the developmentof a true tongue. In some salamanders and newts, adults may retain juvenile characteristics(such as external gills); this phenomenon is termed paedomorphism. Caecilian larvae aresuperficially similar to adult animals, but metamorphic changes may be substantial includingThe young of the caecilian Boulengerulataitana (Least Concern) have been foundto nourish themselves by stripping andeating the outer layer of the mother’s skin.© Alexander Kupfer
16Threatened <strong>Amphibian</strong>s of the WorldThis image of a larval Marbled SalamanderAmbystoma opacum (Least Concern) showsclearly the large fi lamentous gills used forrespiration. © Henk Wallaystend to have modifi ed skin and kidneys to prevent or compensate for excessive osmosisfrom the surrounding environment.Because of the loss of body water through osmosis in saltwater, there are no truly marineamphibians. The frog Fejervarya cancrivora from Southeast Asia occurs in the brackish waterof mangrove forest, and is the closest to a marine amphibian.Dieta thickening of the skin and development of scales, changes in the cranium and glossalskeleton and associated musculature, loss of labial folds and gill slits, and the growth ofsensory tentacles.Skin, Respiration and ThermoregulationThe distinctive semi-permeable skin of amphibians performs a number of important biologicalfunctions. The outer skin (epidermis) is covered with mucous glands and serous granularglands. The mucous glands help to keep the skin moist and slippery by secreting mucus.The granular glands secrete alkaloids or other chemicals that are often toxic to potentialpredators. The skin helps to protect the animal against physical damage (such as abrasion),and antimicrobial peptides covering the skin prevent infection by pathogens (further detailsof the possible values of these skin secretions are discussed in Chapter 2).<strong>Amphibian</strong>s occur in a wide variety of colours, ranging from the subtle shades of green,brown and black used to camouflage animals, to the bright warning colours of the familiarposion frogs. Pigmentation cells within the skin largely determine colour and shading. Pigmentsmay be dispersed or concentrated through hormonal action, allowing skin colour andpatterns to quickly change in response to the animal’s environment.The skin can be an important respiratory organ. Most amphibians have a semi-permeableskin with both a low level of keratinization, and an extensive network of below-skinblood capillaries adapted to cutaneous gas exchange (oxygen absorption through the skin).The importance of this varies between species, but for some groups, such as the lunglessplethodontid salamanders, cutaneous gas exchange may account for 85-90% of total gasexchange (Duellman and Trueb 1994; Stebbins and Cohen 1995). Some amphibians, such asthe giant salamanders of China and Japan (Andrias spp.), have evolved skin folds that mayenhance gas exchange through an increased skin surface area. Hair-like fi laments developon the body of male Hairy Frogs Trichobatrachus robustus during the breeding season,and these may aid oxygen uptake during times of increased demand. A single species ofcaecilian is entirely lungless; the enigmatic Atretochoana eiselti is a giant aquatic speciesknown from only two specimens.Most amphibians at some point in their development use gills for gas exchange. Larvalamphibians often have filamentous gills that are the primary means of respiration. These gillsare usually reabsorbed into the body during metamorphosis, while the adult lungs develop.The lungs of amphibian species are ventilated by a buccopharyngeal pump accompanied byexaggerated ‘gulping’ movements of the fl oor of the mouth. Lungs vary greatly in size andstructure, and this variation may be related to a number of factors including the importanceof other respiratory organs (such as the skin), thermal characteristics, activity, and habitatand evolutionary characteristics (Stebbins and Cohen 1995). In general, amphibians inhabitingwell-oxygenated cold environments (for instance, mountain streams) are more likely tohave smaller or reduced lungs; species from warmer habitats with low oxygen levels morecommonly have larger lungs with a more complex structure. Some aquatic caecilians havevery well-developed lungs extending almost the entire length of their bodies that may beimportant in buoyancy as well as in respiration. Gas exchange across the lining of the buccalcavity and pharynx (mouth and throat) appears to be particularly important to a number ofsalamanders, most especially the lungless species.Unlike ‘warm-blooded’ birds and mammals (endotherms), amphibians are ectotherms or‘cold-blooded’ animals, with the outside environment largely determining body temperature.Both behavioural and physiological mechanisms regulate body temperature. Behaviouralmechanisms are mostly associated with movements to warmer or cooler sites, or microhabitats,within the animal’s environment. This includes moving to basking sites where the animalcan raise its body temperature through exposure to the sun, or movements to shaded areasaway from the heat. Physiological adaptations include increasing or decreasing evaporativecooling through the skin; changes in skin pigmentation in response to UV exposure; and possiblychanges in the amount of blood flow to the skin. While very few amphibians can persistat temperatures above 43ºC (110ºF), several species, such as the North American WoodFrog Rana sylvatica, can tolerate freezing conditions through conversion of liver glycogen toglucose in response to extracellular ice formation. Animals recover when milder temperaturesarrive by greatly increasing blood glucose levels (Stebbins and Cohen 1995).As with thermoregulation, body water regulation in amphibians is controlled by bothbehavioural and physiological mechanisms. The generally highly water permeable skinof amphibians allows movement of water both into the body through osmosis whenthe animal enters the water or is exposed to a moist surface, and away from the bodythrough evaporative transpiration when the animal is outside a wet or damp environment.Individual animals can control the intake of water through the skin by entering or leavingwater, and many animals regularly move between terrestrial and wet or damp sites torehydrate themselves.Body water regulation is most commonly associated with preventing water loss, ratherthan coping with an excess of water. <strong>Amphibian</strong>s have developed several strategies toprevent water loss, including: having a largely nocturnal lifestyle; inhabiting moist placeswhen away from water; burrowing or undergoing periods of aestivation to avoid dry periodswhen desiccation is a possibility; a reduction of the body area available for evaporativetranspiration; the retention of urea in plasma (especially among species from arid habitats);and, in a few species, the excretion of nitrogenous waste as up to 80% uric acid (uricotelicspecies). In some instances, amphibians have to adapt to excess, rather than a loss, ofwater. <strong>Amphibian</strong>s that are largely, or wholly, aquatic in freshwater for a lengthy periodWith few exceptions, the diet of adult amphibians consists of a wide range of freshwaterand terrestrial invertebrates. Most amphibians appear to be opportunistic feeders,with the types of prey captured often dependent on availability and seasonality. Whilemost adult amphibians only consume invertebrates, some larger amphibians, such asthe African Bullfrog Pyxicephalus adspersus, can also catch small vertebrates such asmice, birds, reptiles or other amphibians. <strong>Amphibian</strong>s have also been recorded feedingopportunistically on dead carrion, pet food, organic waste, and similar scraps. There are afew well-recorded instances of amphibians in which the adult also consumes vegetablesor fruits. Adults of the treefrog Xenohyla truncata regularly consume small fruits, and assome of the defecated seeds germinate it seems possible that this frog may contribute toplant dispersal (da Silva et al. 1989).<strong>Amphibian</strong> larvae have a greater diversity of feeding mechanisms and diet than adultamphibians. The larvae of most frogs and toads are highly specialized fi lter feeders, usingorgans called the branchial food traps and gill fi lters to collect food. Trapped food istransported from these traps to the oesophagus by mucal threads. Anuran larvae typicallyfall into two groups, those that feed on microscopic matter (microphagous), and those thatfeed on much larger objects (macrophagous). Microphagous larvae feed on food items suchas suspended algae or protists, and tend to have large branchial food traps. Macrophagouslarvae generally have both reduced branchial food traps and keratinized mouthparts adaptedto scraping and biting food, including algal mats or animal prey (including other amphibianlarvae). In contrast to the frogs and toads, the vast majority of salamander and newt larvaeand probably all caecilian larvae are carnivorous, and feed on aquatic invertebrates.Movement and MigrationIn general, the daily movement of amphibian species is mostly restricted to the vicinityof the animals’ home range. Although the home range size of most amphibian speciesremains unstudied or poorly known, in many cases it is believed that home range sizes aretypically quite small, being a total of only a few square metres in size. However, it shouldbe noted that amphibians have a wide range of dispersal abilities, and in some instancesare known to move greater distances than previously anticipated (Smith and Green 2005).Possibly the most commonly recognized amphibian movements are the more substantialseasonal migrations of large numbers of animals from their individual home territories toand from breeding sites. The sight of mass breeding congregations of amphibians in ponds,lakes and other water bodies is generally familiar to most people, and may often be theirfi rst encounter with amphibians. Seasonal breeding migrations tend to be triggered by anumber of environmental conditions; these can include changes in daylight, temperature, orin moisture and precipitation levels. For example, Gascon et al. (2003) mention a breedingaggregation of more than 5,000 adults of the Marbled Salamander Ambystoma opacum ina cluster of three ponds at the base of the Blue Ridge Mountains following the torrentialrains of Hurricane Dennis in September of 1999; the breeding event gave rise to over 12,000metamorphic salamanders that emigrated en masse from ponds in the following May.Movements most often take place at night, probably reducing the risk of predation by birdsand other diurnal predators (Zug et al. 2001).While many amphibians may move only relatively short distances from the surroundingterrestrial habitat to and from the breeding site, it is possible for some species to travellonger distances to their traditional breeding site. Experiments with displaced individualsof Red-bellied Newts Taricha rivularis have demonstrated that animals were able to locatetheir breeding sites from as far as eight kilometres away (Twitty et al. 1967).<strong>Amphibian</strong> movements and migrations are guided by a number of homing and orientationmechanisms (Zug et al. 2001). Visual landmarks within the home territory or migration routehelp to direct individual animals, especially to familiar escape routes when disturbed. Manyspecies are guided by olfactory cues, including the characteristic scents, smells or odoursof the home territory or breeding site. The sounds of calling conspecifi cs provide auditorycues for frogs defending territories or trying to locate a mate. Variation in polarized lightallows amphibians to differentiate between wet and dry areas; in addition, salamandersare able to orient themselves through the use of the pineal body which acts as a polarizedlight receptor (Zug et al. 2001). Many amphibians are sensitive to magnetic fi elds, and anumber of studies into this interesting fi eld have demonstrated that animals can orientatethemselves through the use of a light sensitive magnetic compass (including Phillips 1977,1986a,b; Sinsch 1987; Deutschlander 2000; Freake and Phillips 2005). Two magnetoreceptionsystems have been found: the first measures spatial variation in the magnetic field and usesthis information to derive a geographic map of the area, while the second system is sensitiveto the horizontal alignment (azimuth) of the magnetic field and is used for compass alignment(Freake and Phillips 2005). Recent studies have confi rmed the presence of orientation bymagnetic fi elds in both the Caudata and Anura (Freake and Phillips 2005).Communication<strong>Amphibian</strong>s generally communicate through vocal, chemical or visual means, or througha combination of these three systems. Of the three Orders of amphibian, only the frogsand toads tend to make signifi cant vocalizations. While some species of caecilians andsalamanders can produce soft clicking, squeaking or hissing sounds, in general there arevery few voluntary sounds made. Although there are a few exceptions, most species of frogsand toads tend to force air from the lungs over the larynx where the vocal cords vibratecreating sound. In many cases the calls are transmitted via vocal sacs, with some externalvocal sacs having a balloon-like appearance. While further research is needed into the roleof the vocal sacs, these are often considered to both intensify or modify the acoustic signaland assist in radiating calls in all directions.The volume and intensity of calls can vary greatly by species, and this often depends onwhether the call is intended for nearby conspecifi cs or for those that are far away. Environmentalconditions may also determine the volume and intensity of the call. For example,the threatened species Amolops tormotus from eastern China has recently been discoveredto emit calls in ultrasonic frequencies; this is possibly an adaptation to the loud torrentialstream habitats in which the animal lives (Feng et al. 2006). The Bornean frog Metaphrynellasundana has been shown to actively exploit the acoustic properties of partially water-fi lledtree cavities (Lardner and bin Lakim 2002). By tuning their vocalizations to the resonantfrequency of the hole, the calling males enhance their chances of attracting a female.
Chapter 1. An Introduction to the <strong>Amphibian</strong>s 17Most communication between individual caecilians and salamanders appears to belargely through chemical secretions and visual signs. Perhaps the most commonly employedchemical signals are pheromones produced by courtship glands, which may be used todistinguish between species and also to locate conspecifics (Zug et al. 2001). Visual ortactile signals in amphibians have been observed in all three Orders and can include animalsbiting, nudging or butting their partner, tail-whipping (especially in some European newts),or using a foot-flagging display and colour displays especially where vocalizations may noteasily be heard (Zug et al. 2001; Hödl 2000).<strong>Amphibian</strong> communication methods are very diverse and have several different functions.Advisement calls and signals are used to attract a mate, to aggressively warn others of territorialboundaries, or are made in response to encountering other males. Reciprocation callsand signals are made by females willing to mate in response to the courtship of a particularmale. Unreceptive females give release calls or signals during attempts at amplexus, as domales that have been mistakenly identified as females. Distress signals may be low-pitchedshrieks or shrill cries, or specific movements or chemicals, which are produced by either sexin response to disturbance or fright.FURTHER GENERAL READING ON AMPHIBIANSDuellman, W.E. and Trueb, L. 1994. Biology of <strong>Amphibian</strong>s. McGraw-Hill, New York, USA.Hofrichter, R (ed.) 2000. The Encyclopedia of <strong>Amphibian</strong>s. Key Porter Books Limited, Toronto, Canada.Stebbins, R.C. and Cohen, N.W. 1995. A Natural History of <strong>Amphibian</strong>s. Princeton University Press,Princeton, New Jersey, USA.Zug, G., Vitt, L.J. and Caldwell, J.P. 2001. Herpetology: An <strong>Introductory</strong> Biology of <strong>Amphibian</strong>s and Reptiles,Second Edition. Academic Press, San Diego, USA.REFERENCESBickford, D. 2002. Male parenting of New Guinea froglets. Nature 418:601-602.Biju, S.D. and Bossuyt, F. 2003. New frog family from India reveals an ancient biogeographical link withthe Seychelles. Nature 425:711-714.Cannatella, D.C. and Hillis, D.M. 2004. <strong>Amphibian</strong>s: leading a life of slime. In: J. Cracraft and M.J. Donoghue(eds.), Assembling the tree of life, pp. 430-450. Oxford University Press, Oxford, U.K.Crawford, A.J. and Smith, E.N. 2005. Cenozoic biogeography and evolution in direct-developing frogs ofCentral America (Leptodactylidae: Eleutherodactylus) as inferred from a phylogenetic analysis of nuclearand mitochondrial genes. Molecular Phylogenetics and Evolution 35:536-555.da Silva, H.R., Britto-Pereira, M.C. and Caramaschi, U. 1989. Frugivory and seed dispersal by Hyla truncata,a Neotropical treefrog. Copeia 1989:781-783.Darst, C.R. and Cannatella, D.C. 2004. Novel relationships among hyloid frogs inferred from 12S and 16Smitochondrial DNA sequences. Molecular Phylogenetics and Evolution 31:462-475.Deutschlander, M.E., Phillips, J.B. and Borland, S.C. 2000. Magnetic compass orientation in the Easternred-spotted newt, Notophthalmus viridescens: rapid acquisition of the shoreward axis. Copeia2000:413-419.Duellman, W.E. and Trueb, L. 1994. Biology of <strong>Amphibian</strong>s. McGraw-Hill, New York, USA.Faivovich, J., Haddad, C.F.B., Garcia, P.C.A., Frost, D.R., Campbell, J.A. and Wheeler, W.C. 2005. Systematicreview of the frog family Hylidae, with special reference to Hylinae: a phylogenetic analysis andtaxonomic revision. Bulletin of the American Museum of Natural History 294:1-240.Feng, A.S., Marins, P.M., Xu, C-H., Lin W-Y., Yu, Z-L., Qui, Q., Xu, Z-M. and Shen, J-X. 2006. Ultrasoniccommunication in frogs. Nature 440:333-336.Ford, L.S. and Cannatella, D.C. 1993. The major clades of frogs. Herpetological Monographs 7:94-117.Freake, M.J. and Phillips, J.B. 2005. Light-dependent shift in bullfrog tadpole magnetic compasss orientation:evidence for a common magnetoreception mechanism in anuran and urodele amphibians.Ethology 111:241-254.Frost, D.R. (ed.). 1985. <strong>Amphibian</strong> species of the world. A taxonomic and geographical reference. Associationof Systematics Collections and Allen Press, Lawrence, Kansas, USA.Frost, D.R. 2004. <strong>Amphibian</strong> Species of the World: an Online Reference. Version 3.0 (22 August, 2004).Electronic Database accessible at http://research.amnh.org/herpetology/amphibia/index.html. AmericanMuseum of Natural History, New York, USA.Frost, D.R. 2007. <strong>Amphibian</strong> Species of the World: an Online Reference. Version 5.0 (1 February, 2007).Electronic Database accessible at http://research.amnh.org/herpetology/amphibia/index.php. AmericanMuseum of Natural History, New York, USA.Frost, D.R., Grant, T., Faivovich, J.N., Bain, R.H., Haas, A., Haddad, C.F.B., de Sá, R.O., Channing, A.,Wilkinson, M., Donnellan, S.C., Raxworthy, C.J., Campbell, J.A., Blotto, B.L., Moler, P., Drewes, R.C.,Nussbaum, R.A., Lynch, J.D., Green, D.M. and Wheeler, W.C. 2006. The amphibian tree of life. Bulletinof the American Museum of Natural History 297:1-370.Gascon, C., Stuart, S. and Church, D. 2003. Frogs, Toads, and Salamanders. In: R.A. Mittermeier, P. Robles-Gil,C.G. Mittermeier, T.M. Brooks, M. Hoffmann, G. Fonseca, W.R. Konstant and R. Mast (eds.), WildlifeSpectacles, pp. 239-241. Mexico City, Mexico.Gibson, R.C. and Ley, K.R.B. 2004. Maternal care and obligatory oophagy in Leptodactylus fallax: a newreproductive mode in frogs. Copeia 2004(1):128-135.Glaw, F. and Vences, M. 2006. Phylogeny and genus-level classification of mantellid frogs (Amphibia, Anura).Organisms, Diversity and Evolution 6:236-253.Grafe, T.U. and Linsenmair, K.E. 1989. Protogynous sex change in the reed frog Hyperolius viridifl avus.Copeia 1989:1024-1029.Grant, T., Frost, D.R., Caldwell, J.P., Gagliardo, R., Haddad, C.F.B., Kok, P.J.R., Means, D.B., Noonan, D.P.,Schargel, W.E. and Wheeler, W.C. 2006. Phylogenetic systematics of dart-poison frogs and theirrelatives (Amphibia: Athesphatanura: Dendrobatidae). Bulletin of the American Museum of NaturalHistory 299:1-262.Günther, R. 2006. Derived reproductive modes in New Guinean anuran amphibians and description of a newspecies with paternal care in the genus Callulops (Microhylidae). Journal of Zoology 268:153-170.Günther, R., Kapisa, M. and Tetzlaff, I. 2001. Ein seltenes Brutpfl egeverhalten bei Froschlurchen: Männchenvon Sphenophryne cornuta transportiest Jungtiere auf seinem Rücken (Anura, Microhylidae).Herpetofauna 23:14-24.Haas, A. 2003. Phylogeny of frogs as inferred from primarily larval characters (Amphibia: Anura). Cladistics19:23-90.Hillis, D.M. 2007. Constraints in naming parts of the Tree of Life. Molecular Phylogenetics and Evolution42:331-338.Hödl, W. 2000. Visual Signalling in Frogs. In: R. Hofrichter (ed.), The Encyclopedia of <strong>Amphibian</strong>s, pp.164-165. Key Porter Books Limited, Toronto, Canada.Hofrichter, R (ed.) 2000. The Encyclopedia of <strong>Amphibian</strong>s. Key Porter Books Limited, Toronto, Canada.Inger, R.F., Voris, H.K. and Walker, P. 1986. Larval transpost in a Bornean ranid frog. Copeia 1986:523-525.Inger, R.F. and Voris, H.K. 1988. Taxonomic status and reproductive biology of Bornean tadpole-carryingfrogs. Copeia 1988:1060-1061.Köhler, J., Vieites, D.R., Bonett, R.M., Garcia, F.H., Glaw, F., Steinke, D. and Vences, M. 2005. New <strong>Amphibian</strong>sand Global Conservation: A Boost in Species Discoveries in a Highly Endangered Vertebrate<strong>Group</strong>. BioScience 55:693-696.Kupfer, A., Müller, H., Antoniazzi, M.M., Jared, C., Greven, H., Nussbaum, R.A. and Wilkinson, M. 2006.Parental investment by skin feeding in a caecilian amphibian. Nature 440:926-929.Lardner, B. and bin Lakim, M. 2002. Tree-hole frogs exploit resonance effects. Nature 420:475.Loader, S.P., Gower, D.J., Clarke, B.T., Howell, K.M., Doggart, N., Rödel, M.-O., de Sá, R.O., Cohen, B.L. andWilkinson, M. 2004. Phylogenetic relationships of African microhylid frogs inferred from DNA sequencesof mitochondrial 12S and 16S ribosomal rRNA genes. Organisms Diversity and Evolution 4:227-235.Phillips, J.B. 1977. Use of the earth’s magnetic fi eld by orienting cave salamanders (Eurycea lucifaga).Journal of Comparative Physiology A. 121:273-288.Phillips, J.B. 1986a. Magnetic compass orientation in the Eastern red-spotted newt, Notophthalmusviridescens. Journal of Comparative Physiology A. 158:103-109.Phillips, J.B. 1986b. Two magnetoreception pathways in a migratory salamander. Science 233:765-767.Pitman, N., Vriesendorp, C. and Moskovits, D. (eds.). 2003. Perú: Yavarí. Rapid Biological Inventories Report11. The Field Museum, Chicago, Illinois, USA.Pombal, J.P., Jr. and Gasparini, J.L. 2006. A new Brachycephalus (Anura: Brachycephalidae) from the Atlanticrainforest of Espírito Santo, southeastern Brazil. South American Journal of Herpetology 1(2):87-93.San Mauro, D., Vences, M., Alcobendas, M., Zardoya, R. and Meyer, A. 2005. Initial diversifi cation of livingamphibians predated the break-up of Pangaea. American Naturalist 165:590-599.Scott, E. 2005. A phylogeny of ranid frogs (Anura: Ranoidea: Ranidae), based on a simultaneous analysisof morphological and molecular data. Cladistics 21:507-574.Seimon, T.A., Seimon, A., Daszak, P., Halloys, S.R.P., Schloegel, L.M., Aguilar, C.A., Sowell, P., Hyatt, A.D.,Konecky, B. and Simmons, J.E. 2006. Upward range extension of Andean anurans and chytridiomycosisto extreme elevations in response to tropical deglaciation. Global Change Biology 12:1-12.Sinsch, U. 1987. Orientation behavior of toads (Bufo bufo) displaced from breeding sites. Journal ofComparative Physiology A. 161:715-727.Smith, M.A. and Green, D.M. 2005. Dispersal and the metapopulation paradigm in amphibian ecology andconservation: are all amphibian populations metapopulations? Ecography 28:110-128.Stebbins, R.C. and Cohen, N.W. 1995. A Natural History of <strong>Amphibian</strong>s. Princeton University Press,Princeton, New Jersey, USA.Twitty V., Grant, D. and Anderson, O. 1967. Initial homeward orientation after long-distance displacementsin the newt Taricha rivularis. Proceedings of the National Academy of Sciences 57:342-348.Van der Meijden, A., Vences, M., Hoegg, S. and Meyer, A. 2005. A previously unrecognized radiationof ranid frogs in southern Africa revealed by nuclear and mitochondrial DNA sequences. MolecularPhylogenetics and Evolution 37:674-685.Zug, G., Vitt, L.J. and Caldwell, J.P. 2001. Herpetology: An <strong>Introductory</strong> Biology of <strong>Amphibian</strong>s and ReptilesSecond Edition. Academic Press, San Diego, USA.Endnotes1 Based on the results of the Global <strong>Amphibian</strong>Assessment, as of December 2006. At the time ofgoing to press (February 2008), there were 6,184species recognized on <strong>Amphibian</strong> Species of theWorld (Frost 2007), including 5,453 anurans, 560Caudata, and 171 Gymnophiona.2 Recently also collected in Peru by Pitman et al.(2003).3 During 2006 three new Brachycephalus specieswere described (B. ferruginus, B. pombali, and B.alipioi), increasing the number of recognized speciesin the family Brachycephalidae to 11 (PombalJr. and Gasparini 2006).4 The enigmatic genus Rupirana Heyer, 1999,formerly included within the Leptodactylidae isnot allocated to any family by Frost et al. (2006).These authors remark that they did not study it,and that its position remains to be elucidated.Paratelmatobius lutzii is an example of aBrazilian frog that is currently listed as DataDefi cient, but which should probably be consideredas Critically Endangered. It was oncecommon in an area of a few square metres onthe Alto do Itatiaia, at 2,200m asl in the Serrada Mantiqueira, on the border of the states ofMinas Gerais and Rio de Janeiro. However, ithas not been seen since 1978, despite suitablehabitat remaining and signifi cant surveyefforts. © Ivan Sazima
18Threatened <strong>Amphibian</strong>s of the WorldESSAY 1.1. TRENDS IN RATES OF AMPHIBIAN SPECIES DESCRIPTIONSSince the offi cial implementation of zoological nomenclature by Carl vonLinné in 1758 there has been a steady increase in the number of recognizedextant amphibian species. However, rates of species descriptions over timehave been neither constant nor decreasing – as one would expect whenassuming that the number of undiscovered species decreases with a longerperiod of scientific investigation. Unlike other, well-known, vertebrate groupssuch as mammals and birds,, amphibians are a class where species numbershave increased exponentially, especially in recent decades (Glaw and Köhler1998, AmphibiaWeb 2006).Since the early times of amphibian classification, the major works of afew active taxonomists contributed significantly to descriptions of novel taxa,specifically Josephus N. Laurenti, François Daudin, Johann Baptist von Spix,André M. Constant Duméril and Gabriel Bibron, Albert C. L. G. Günther, EdwardD. Cope, Wilhelm Peters, George A. Boulenger and Oskar Boettger. With theincreasing number of researchers dealing with the classification of amphibiansand the intensified exploration of tropical regions, taxonomic work onamphibians experienced its first major boost and description rates of speciesper period steadily increased until the end of the 19 th century. For example,about 260 species of amphibians were described in the last decade of the 19 thcentury, many of which are still considered to represent valid taxa.Subsequently, a decrease in species description rates occurred duringtwo periods of the last century. These periods correlate with the First andSecond World Wars, respectively, with obviously low research activity (Glawand Köhler 1998). However, the general long-term trend was still an increasein description rates.More recently, a second major boost of new species discoveries anddescriptions has been in evidence. Whereas at the end of 1992, the numberof amphibians recognized stood at only 4,533 species (Duellman 1993, Glawet al. 1998), as of July 2006, this total stood at 6,041 species (AmphibiaWeb2006). This equates to an increase of more than 32% in only 13 years. Theabsolute number of newly described amphibian species per decade (not onlythe cumulative number of valid and described species) has been steadilyincreasing since the 1960s, with especially steep increases since the 1990s(Glaw and Köhler 1998, Köhler et al. 2005). No fewer than 810 amphibianspecies were described in the last decade of the 20 th century; this is moreNumber of species1,6001,200800400than three times the number of species descriptions compared with the sameperiod 100 years earlier. The average annual number of amphibians describedduring the 1990s was about 81 species; the number of described species in2005 alone exceeds 200, a record that was never reached before. One factorcontributing to this high rate of description was the publication of at least35 new species from Sri Lanka (Manamendra-Arachi and Pethiyagoda 2005,Meegaskumbura and Manamendra-Arachi 2005).New species descriptions can be attributed, in part, to known populationsof described species that have been found to be genetically or bioacoustically(in frogs) distinct, and may in many cases be recognized as different species.Modern molecular and bioacoustic techniques that provide increased‘resolution’ have revealed that in many cases several morphologicallysimilar, and hence, cryptic species may be concealed within a single taxonname. However, compared with true fi rst-hand discoveries in amphibians,removal from synonymy constitutes a relatively small portion (~14%) ofnewly recognized species (Köhler et al. 2005). Indeed, a large proportionof new species are genuine new discoveries, as exemplifi ed by the recentspectacular fi ndings of a new frog family, genus and species in India,the Nasikabatrachidae (Biju and Bossuyt 2003), and of a new genus andspecies of plethodontid salamander, Karsenia, in Korea – the fi rst Asianrepresentative of this family (Min et al. 2005). A case study of mantellid frogsin Madagascar indicated that newly discovered species since 1990 wereas genetically divergent as those described in previous research periods.Additionally, most had not been collected previously, indicating that theincrease in new amphibian species on this island of endemism is not a signof taxonomic infl ation due to exaggerated splitting approaches or differentspecies concepts (Köhler et al. 2005).If the current trend in species descriptions continues, we probably facea decade (2000-2009) in which more than 1,500 amphibian species could bedescribed. This raises the interesting question of just how long will this trendcontinue and how many amphibian species are there on earth? Of course,nobody knows the fi nal number and there is no available method to give anexact estimate. We suspect that at least several hundred new species remainto be described from throughout the tropical regions (including Madagascar,India, Sri Lanka, Indonesia, Philippines, New Guinea, and South America). Forexample, 223 species are officially known from Madagascar (December 2005),yet we have clear evidence (from morphology, bioacoustics and genetics) forthe existence of at least 282 species and know of 45 further forms whichare likely to represent new species as well, indicating that about 100 newMadagascan species still await their description at the current time.Given this situation, and the strongly increasing description rates in manytropical areas of the world, we believe that an eventual doubling of the currentnumber of known amphibian species to around 12,000 is not inconceivable,though this global amphibian inventory may still require an additional 50 yearsto be completed. In the meantime, since many of our currently recognizedamphibian “species” may actually prove to represent species complexes, thiswill have practical relevance for conservation. Taxonomic revisions will likelyhave an important bearing on the Red List status of many species, particularlyif formerly widespread non-threatened species complexes are actually shownto represent a number of smaller-ranged threatened species. In addition, thenon-cryptic ‘real’ discoveries of the future are far more likely to be taxa havingrestricted ranges, with the result that these species are more likely to qualifyas threatened. These two factors suggest that future estimates of the degreeof threat among amphibians will be much higher due to factors unrelated tohabitat destruction and other human-induced declines.ReferencesJörn Köhler, Frank Glaw and Miguel VencesAmphibiaWeb: Information on amphibian biology and conservation. [web application].2006. Berkeley, California: AmphibiaWeb. Available: http://amphibiaweb.org/.Biju, S.D. and Bossuyt, F. 2003. New frog family from India reveals an ancient biogeographicallink with the Seychelles. Nature 425:711-714.Duellman, W.E. 1993. <strong>Amphibian</strong> species of the world: additions and corrections. Universityof Kansas Museum of Natural History, Special Publications 21:1-372.Glaw, F. and Köhler, J. 1998. <strong>Amphibian</strong> species diversity exceeds that of mammals.Herpetological Review 29:11-12.Glaw, F., Köhler, J., Lötters, S. and Vences, M. 1998. Preliminary list and referencesof newly described amphibian species and subspecies between 1993 and 1997.Elaphe 6:1-24.Köhler, J., Vietes, D.R., Bonett, R.M., Hita Garcia, F., Glaw, F., Steinke, D. and Vences, M.2005. New amphibians and global conservation: a boost in species discoveries in ahighly endangered vertebrate group. BioScience 55:693-696.Manamendra-Arachi, K. and Pethiyagoda, R. 2005. The Sri Lankan shrub-frogs of the genusPhilautus Gistel, 1848 (Ranidae: Rhacophorinae), with description of 27 new species.Raffl es Bulletin of Zoology. Supplement No. 12:163-303.Meegaskumbura, M. and Manamendra-Arachi, K. 2005. Description of eight new speciesof shrub frogs (Ranidae: Rhacophorinae: Philautus) from Sri Lanka. Raffl es Bulletin ofZoology. Supplement No. 12:305-338.Min, M.S., Yang, S.Y., Bonett, R.M., Vieites, D.R., Brandon, R.A. and Wake, D.B. 2005.Discovery of the fi rst Asian plethodontid salamander. Nature 435:87-90.01758-591760-691770-791780-891790-991800-091810-191820-291830-391840-491850-591860-691870-791880-891890-99Research periodActual Predicted1900-091910-191920-291930-391940-491950-591960-691970-791980-891990-992000-09Figure 1. Descriptions of new amphibian species per decade until July2006 on a global scale (including taxa considered to be valid species todayonly). A steady increase of the numbers is recognizable since 1940. Theyellow bar shows the expectation for the period 2000-2009 if the rate of2000-2006 continues.ESSAY 1.2. AMPHIBIAN DIVERSITY AND THE CASE OF SRI LANKA’S BURGEONING INVENTORYBiodiversity exploration in Sri Lanka, a 65,000-km 2 continental island situatedimmediately south of India, began with the arrival of Portuguese colonists in1505. The country had, from pre-Roman times, been an important source ofspices, including black pepper and cardamom. European demand for medicinalplants and spices was growing, and sporadic botanical investigations werenot long in getting under way. Natural history studies gathered momentumwith transfer of the island to the Netherlands in the early 17th century, thefirst botanic gardens being established in 1669. In 1747, Carolus Linnaeuswrote Flora Zeylanica (1747), his only tropical fl ora, on the then-knownplants of the island. Inheriting the island from the Dutch in 1796, the Britishinstitutionalized biodiversity exploration by establishing a botanic garden atPeradeniya in 1822, and a natural-history museum in 1877.By 1993, when the Wildlife Heritage Trust (WHT) – a non-profit organizationdedicated to the scientifi c exploration and documentation of SriLanka’s biodiversity – began a survey of the island’s amphibian populations,the island’s vertebrate fauna was generally regarded as well known. Everygroup had benefited from taxonomic reviews – Kirtisinghe (1957), the majortaxonomic work on amphibians before the WHT explorations, recognized35 species – and there was no hint in the regularly published checkliststhat significant novelties were to be expected. Indeed, the accretion of newamphibian species had slowed to a trickle, just four having been discoveredin the previous half-century (Figure 1).The initial purpose of the WHT survey was to identify key habitats foramphibian conservation, with the knowledge that by 1993 Sri Lanka’s rapidlygrowing human population was causing ever-increasing expanses of forest tobe converted to agriculture. However, within just a short period of time, theWHT team began uncovering many novelties, and in 1998 announced that theisland’s amphibian fauna could reach an unprecedented 250 species (Pethiyagodaand Manmendra-Arachchi 1998), an estimate since revised downwardto ~140 by Meegaskumbura et al. (2002). Between 1993 and the present, 42of these new species have been formally named (e.g., Manamendra-Arachchiand Pethiyagoda 2005; Meegaskumbura and Manamendra-Arachchi 2005)and as many as 50 more are in the process of description.The vast majority of the novelties discovered in Sri Lanka belong to theOriental shrub-frog genus Philautus. These small frogs are ubiquitous in thevery humid forests of tropical Asia, and their tinkling vocalizations fi gureprominently in the nocturnal forest chorus. Philautus are direct-developingfrogs: their eggs, deposited on leaves or in shallow nests excavated in theforest fl oor, hatch directly into near-fully metamorphosed froglets, bypassingthe ‘conventional’ aquatic tadpole stage. Although direct-development rarelyfeatures in popular texts on amphibian biology, about 20% of the world’s anuranspecies are reported to show this developmental mode (Thibaudeau andAltig 1999). Many Sri Lankan Philautus appear to have remained undiscoveredfor so long because they had been assumed to belong to a small number ofpolymorphic species. However, the WHT studies have shown that the newspecies were consistently distinct, not only in morphology, but also withrespect to bioacoustics and genetics (Meegaskumbura and Manamendra-Arachchi 2005) (Figure 2).The island’s species count presently stands at 103, of which 19 arecategorized as Extinct, 11 Critically Endangered, 35 Endangered and 6Vulnerable. While loss of habitat is clearly the most immediate threat,habitat fragmentation combined with on-going climatic change is likely toresult in many more species being considered threatened, especially thoserestricted to high altitudes. Although there is no evidence of Sri Lankanamphibians having been victim to the synergistic effects of climate changeand disease (e.g., Pounds et al. 2006), on-going climatic change could stressshrub-frog populations. Bahir et al. (2005) showed that Philautus breed onlyduring periods of sustained rainfall and continuously high relative humidity(80-100%). However, meteorological data from across Sri Lanka show clearwarming and desiccation trends. For example, at Nuwara Eliya (1,800 mNumber of species described504030201001758-1799 1800-1849 1850-1899 1900-1949 1950-1992 1993-2005Research PeriodsFigure 1. Number of descriptions of new amphibian species from Sri Lankafrom the time of Linnaeus to the present.asl) in the central mountains, average annual temperature increased by1.3°C and average annual precipitation decreased by ~20% in the period1869-1995 (Schaefer 1998).The irony of so many new amphibian species being discovered whenamphibian populations worldwide are declining has not escaped attention(e.g., Hanken 1999): some 1,000 newly discovered species were describedworldwide in the period 1992-2003 (Köhler et al. 2005; and see Essay 1.1).
Chapter 1. An Introduction introduction to the <strong>Amphibian</strong>s amphibians 19Figure 2. Although Philautus hoffmanni (A,C) and P. asankai (B,D) are distinctivelycoloured, these ‘sister species’ are morphologically so similar that theykey out as a single species. Philautus hoffmanni is restricted to altitudes ofabout 1,250m in Sri Lanka’s Knuckles Hills, while P. asankai occurs only at altitudesof 800-1,800m in the central massif, about 100km to the south. The twopopulations are separated by a deep valley. Despite their superficial similarity,the species are distinguished by their vocalizations (E,F), which differ in calllength, pulse rate, dominant frequency, fundamental frequency, pulse length,and the number of pulses per call. They also differ from each other by a 12Sand 16S mt-DNA divergence of 1.01%, a cytochrome-b divergence of 6.04%,and a suite of subtle, but consistent, morphological characters.A.E.kU3020100-10-20The case of Sri Lanka suggests that much amphibian diversity, which israpidly becoming impoverished, remains to be discovered, even in thoseregions deemed to be historically ‘well studied’. This is already evidenced byongoing studies in other megadiverse tropical countries, such as the Philippines(e.g. Brown and Guttman 2002; and see Essay 7.3). There is an urgentneed, therefore, for further exploration and survey work in under-sampledregions, re-analysis of old museum collections, the application of newtaxonomic methodologies, including molecular and vocalization analyses,and for the much-needed rejuvenation of neglected taxonomic collections(and see Essay 11.10).B.kHz-3015100.4 0.50 0.1 0.2 0.3 0.6Rohan Pethiyagoda, Madhava Meegaskumbura, KelumManamendra-Arachchi and Christopher J. Schneider5References00.4 0.50 0.1 0.2 0.3 0.6Bahir, M.M., Meegaskumbura, M., Manamendra-Arachchi, K., Schneider, C.J. andPethiyagoda, R. 2005. Reproduction and terrestrial direct development in Sri Lankanshrub frogs (Ranidae: Rhacophorinae: Philautus). The Raffl es Bulletin of Zoology,Supplement No. 12:339-350.Brown, R.M. and Guttman, S.I. 2002. Phylogenetic systematics of the Rana signata complexof Philippine and Bornean stream frogs: reconsideration of Huxley’s modifi cation ofWallace’s Line at the Oriental-Australian faunal zone interface. Biological Journal ofthe Linnaean Society 76:393-461.Hanken, J. 1999. Why are there so many new amphibian species when amphibians aredeclining? Trends in Ecology and Evolution 14:7-8.Kirtisinghe, P. 1957. The amphibian of Ceylon. Published by the author, Colombo, Ceylon.Köhler, J., Vieites, D.R., Bonett, R.M., García, F.H., Glaw, F. Skeinke, D. and Vences, M.2005. New amphibians and global conservation: a boost in species discoveries in ahighly endangered vertebrate group. BioScience 55:693-696.Manamendra-Arachchi, K. and Pethiyagoda, R. 2005. The Sri Lankan shrub-frogs of thegenus Philautus Gistel, 1848 (Ranidae: Rhacophorinae), with description of 27 newspecies. The Raffl es Bulletin of Zoology, Supplement No. 12:163-303.Meegaskumbura, M., Bossuyt, F., Pethiyagoda, R., Manamendra-Arachchi, K., Bahir,M.M., Schneider, C.J. and Milinkovitch, M.C. 2002. Sri Lanka: an amphbian hotspot.Science 298:379.Meegaskumbura, M. and Manamendra-Arachchi, K. 2005. Description of eight new speciesof shrub frogs (Ranidae: Rhacophorinae: Philautus) from Sri Lanka. The Raffles Bulletinof Zoology, Supplement No. 12:305-338.Pethiyagoda, R. and Manamendra-Arachchi, K. 1998. Evaluating Sri Lanka’s amphibiandiversity. Occasional Papers of the Wildlife Heritage Trust 2:1-12.Pounds, J.A., Bustamante, M.R., Coloma, L.A., Consuegra, J.A., Fogden, M.P.L., Foster, P.N.,La Marca, E., Masters, K.L., Merino-Viteri, A., Puschendorf, R., Ron, S.R., Sánchez-Azofeifa, G.A., Still, C.J. and Young, B.E. 2006. Widespread amphibian extinctions fromepidemic disease driven by global warming. Nature 439:161-167.Schaefer, D. 1998. Climate change in Sri Lanka? Statistical analyses of long-term temperatureand rainfall records. In: M. Domroes and H. Roth (eds), Sri Lanka: past andpresent—archaeology, geography, economics—selected papers on German research,pp. 102-117. Margraf Verlag, Weikersheim, Germany.Thibaudeau, G. and Altig, G. 1999. Endotrophic anurans: development and evolution. In:R.W. Mcdiarmid and G. Altig (eds.), Tadpoles: the biology of anuran larvae, pp. 170-188.University of Chicago Press, Chicago, USA.C.D.F.kUkHz3020100-10-20-301510500.3 0.3 0.6 0.7 0.80 0.1 0.2 0.3 0.90.3 0.3 0.6 0.7 0.80 0.1 0.2 0.3 0.9ESSAY 1.3. CAECILIANSOf the three orders of living amphibians, caecilians (Gymnophiona) are theleast familiar to both amateur and professional biologists. Caecilians arefound in most moist tropical regions of the world except in Madagascar andAustralasia, and they extend into some adjacent subtropical areas in Indochinaand South America. There are c. 170 recognized caecilian species in three,four or six families, according to alternative taxonomies. Species taxonomyis still dominated by the work of E.H. Taylor (e.g., Taylor 1968). Subsequentwork relegated many of Taylor’s taxa to synonyms, but also increased therate of description of new species (e.g., Wilkinson and Nussbaum 2006).The current taxonomy of many caecilians is confused, and unpublished workindicates the need for further synonymy, but also justifies the expectation ofan eventual rise in the number of caecilian species once taxonomic revisionsare complete and as discoveries and descriptions of new species continue(Gower and Wilkinson 2005; Wilkinson and Nussbaum 2006).All caecilians lack limbs and limb girdles, and tails are very short or absent.Other notable external features include annulated skin, eyes covered withskin and sometimes also bone, and a pair of, sensory tentacles in front ofthe eyes. The name Gymnophiona (‘naked snakes’) seems like a rather appropriatedescription given their superficial snake- (or worm-) like form andlack of external scales. However, many species produce scales in pocketsassociated with the skin’s annulation (Zylberberg et al. 1980).Despite their superficial uniformity, caecilians are intriguingly diverse inmorphology and ecology, as might be expected from a group that may haveits origins in the Mesozoic. For example, adult caecilians range from lessthan 10 cm to more than 150 cm in total length, with fewer than 70 to morethan 270 vertebrae. This refl ects the substantial variation in the degree ofelongation of caecilians. They can be dull or vividly coloured, uniform, stripedor mottled. There are also notable variations in dentition, annulation, thepresence and distribution of scales, and in the structure of the skull, trunkmusculature, and sensory, urogenital and cardiovascular systems. The adultsof the vast majority of known caecilian species are terrestrial and burrowin soil and/or leaf litter. Some are dedicated subterranean burrowers, whileothers are more surface-cryptic (e.g., Gower et al. 2004b). In addition, thereare semi-aquatic and fully aquatic forms (replete with fi ns for swimming),and one aquatic species, Atretochoana eiselti (DD), is the largest lunglesstetrapod (Nussbaum and Wilkinson 1995).Caecilian reproductive modes include terrestrial oviparity, with aquaticlarvae or direct development, and viviparity. Aquatic larvae have a small tailfin, lateral-line organs, labial folds and spiracles, and they undergo substantialmetamorphosis. As far as is known, all male caecilians have the cloacamodified into an eversible copulatory organ (e.g., Gower and Wilkinson 2002),fertilization is internal, and the mothers of all oviparous species guard eggclutches in subterranean chambers. Different types of viviparity have beendistinguished by the degree of dependence of newborns, and the amount andtype of any post-parturition maternal care (Loader et al. 2003). The foetusesof some viviparous species are thought to feed on the lining of their mother’soviducts (Parker 1956), while the young of some species peel and eat theirmothers’ specially modifi ed skin (Kupfer et al. 2006).Caecilians are generally not as well studied as frogs and salamanders.This unfortunate lack of attention is perhaps primarily a consequence oftheir largely tropical distribution and cryptic habits. Another impediment toprogress is that the distribution of experts and active researchers in caecilianbiology rarely coincides with that of their study taxa. Perhaps only in Indiaare there more than a couple of caecilian biologists studying native taxa, andthis situation has underpinned the relatively recent and rapid advancementsin knowledge of this fauna (Gower et al. 2004a).An astonishing two-thirds of all caecilian species are classifi ed as DataDefi cient, according to IUCN Red list categories and criteria (Gower andWilkinson 2005). The majority of these taxa are Data Defi cient by virtue oftheir poorly characterized taxonomy, and a lack of data on distribution, ecology,abundance, and response to threats. Caecilian ecology often demandsspecial fi eld techniques that are rarely employed by vertebrate biologists,but substantial progress has been made in recent years (see Gower andWilkinson 2005; Gower et al. 2006). However, with a handful of notableexceptions (e.g., Kupfer et al. 2004, 2006; Measey 2004; Measey et al. 2003),there have been no detailed studies of reproductive ecology and population
20Threatened <strong>Amphibian</strong>s of the Worlddensity - important parameters for accurate and precise conservation assessments.To underpin their scientific conservation, further studies are neededof caecilian reproduction and ecological requirements, and their response tohabitat alteration and climate change. Simultaneously, remaining taxonomicproblems must be resolved.Many caecilians are thought to inhabit moist forests, and it is known thatsome species have a biphasic life history with aquatic larvae. Thus, these speciesmight be thought of as vulnerable to chytridiomycosis (not yet studied incaecilians) and deforestation – factors that threaten some other amphibians.Some caecilians are known to thrive in certain agricultural landscapes, but itis likely that others are adversely affected by habitat alteration and changingland use (Gower and Wilkinson 2005).At present, no caecilians are known to have become extinct (at least thosespecies described in the last few hundred years), and only five species areconsidered threatened. The taxonomy of these five taxa seems relativelystable, and they all occur in relatively small regions (an isolated KenyanMountain, Sri Lanka, and the Seychelles). The extent of occurrence is animportant parameter in conservation assessments, but what sets the fivethreatened caecilians apart from other sympatric species is that they arerelatively infrequently recorded, and/or their known habitats (native forestand agricultural plots) are threatened by habitat loss or pollution. Three ofthe five species are believed to have larvae that are dependent on water.Although the majority of caecilians are classified as Data Deficient, there isno room for complacency, and the group as a whole is threatened by lackof knowledge.ReferencesDavid J. Gower and Mark WilkinsonGower, D.J. and Wilkinson, M. 2002. Phallus morphology in caecilians and its systematicutility. Bulletin of the Natural History Museum, Zoology Series 68:143-154.Gower, D.J. and Wilkinson, M. 2005. Conservation biology of caecilian amphibians.Conservation Biology 19:45-55.Gower, D.J., Bhatta, G., Giri, V., Oommen, O.V., Ravichandran, M.S. and Wilkinson, M.2004a. Biodiversity in the Western Ghats: the discovery of new species of caecilianamphibians. Current Science 87:739-740.Gower, D.J., Loader, S.P., Moncrieff, C.B. and Wilkinson, M. 2004b. Niche separation andcomparative abundance of Boulengerula boulengeri and Scolecomorphus vittatus(Amphibia: Gymnophiona) in an East Usambara forest, Tanzania. African Journal ofHerpetology 53:183-190.Gower, D.J., Oommen, O.V. and Wilkinson, M. 2006. Marking amphibians with alphanumeric fl uorescent tags – caecilians lead the way. Herpetological Review 37: 302Kupfer, A., Nabhitabhata, J. and Himstedt, W. 2004. Reproductive ecology of femalecaecilians (genus Ichthyophis): a baseline study. Biological Journal of the LinneanSociety 83:207-217.Kupfer, A., Müller, H., Antoniazzi, M.M., Jared, C., Greven, H., Nussbaum, R.A. andWilkinson, M. 2006. Parental investment by skin feeding in a caecilian amphibian.Nature 440:926-929.Loader, S.P., Wilkinson, M., Gower, D.J. and Msuya, C.A. 2003. A remarkable youngScolecomorphus vittatus (Amphibia: Gymnophiona: Scolecomorphidae) from the NorthPare Mountains, Tanzania. Journal of Zoology 259:93-101.Measey, G.J. 2004. Are caecilians rare? An East African perspective. Journal of EastAfrican Natural History 93:1-19.Measey, G.J., Gower, D.J., Oommen, O.V. and Wilkinson, M. 2003. A pilot mark-recapturestudy of the caecilian amphibian Gegeneophis ramaswamii (Amphibia: Gymnophiona:Caeciliidae) in southern India. Journal of Zoology 261:129-133.Nussbaum, R.A. and Wilkinson, M. 1995. A new genus of lungless tetrapod: a radicallydivergent caecilian (Amphibia: Gymnophiona). Proceedings of the Royal Society.Ser. B 261:331-335.Parker, H.W. 1956. Viviparous caecilians and amphibian phylogeny. Nature 178:250-252.Taylor, E.H. 1968. The Caecilians of the world: a taxonomic review. University of KansasPress, Lawrence, Kansas, USA.Wilkinson M, and Nussbaum, R.A. 2006. Phylogeny and classifi cation of caecilians. In:J.-M. Exbrayat (ed.), Reproductive Biology and Phylogeny of Gymnophiona, pp 39-78.Science Publishers, Inc., Enfi eld, New Hampshire, USA.Zylberberg, L., Castanet, J., and de Ricqles. A. 1980. Structure of the dermal scales inGymnophiona (Amphibia). Journal of Morphology 165:41-54.Typhlonectes compressicauda (Least Concern) is a member of a SouthAmerican group of aquatic and semi-aquatic caecilians. This species has awide distribution across Amazonian Venezuela, Colombia, Peru, Brazil andthe Guyanas. © Alexander KupferIchthyophis cf. tricolor. Species of the two genera (Ichthyophis and Caudacaecilia)of ichthyophiid caecilians are distributed across South and SoutheastAsia, west of Wallace’s Line, and are the only caecilians occurring in thelatter region. Taxonomic diffi culties mean that the precise identifi cationof this specimen is unclear. As far as is known, all ichthyophiids retain thepresumably ancestral caecilian reproductive mode of oviparity with aquaticlarvae that metamorphose into terrestrial adults. © Ashok CaptainHerpele squalostoma (Least Concern) is a member of the Caeciliidae, thelargest and most taxonomically confused family of caecilians. This specieshas its eyes covered by skin and bone, and probably spends the vast majorityof its life underground. H. squalostoma is one of the few caecilian species toappear occasionally in the pet trade in the West. © Alexander KupferESSAY 1.4. THE MEGADIVERSE GENUS ELEUTHERODACTYLUSThe genus Eleutherodactylus, once the most speciose radiation of vertebrates onearth, is beginning to be dismembered. The dismemberment is partially drivenby new molecular data showing that some other genera are intercalated withinEleutherodactylus sensu lato (Brachycephalus and Phrynopus being the initial twocases). However, the urge to dismember Eleutherodactylus is also driven by itsvery large size and a desire to have smaller genera at hand. Most recently, therehas been a trend to recognize the genus Craugastor, which is largely restrictedto Middle America, contains more than 100 species, and has been viewed asmonophyletic for about twenty years (confirmed by more recent molecular work;Crawford and Smith 2005; Darst and Cannatella 2004; Frost et al. 2006).Figure 1. Richness map of amphibian species in the genera Eleutherodactylusand Craugastor, with dark red colours corresponding to regions of higherrichness. Colour scale based on 10 quantile classes. Maximum richnessequals 48 species.In its larger sense, Eleutherodactylus species are natively distributedfrom the south-western part of the United States (the southernmost parts ofArizona, New Mexico, and Texas) and from the Bahamas and Cuba to the southand east in an unbroken tapestry until the northernmost (both north-east andnorth-west) parts of Argentina. Species are known from sea level to at least4,350m asl (in the Central Cordillera of Colombia). Some taxonomic discontinuity/fragmentation is apparent across this broad distribution. Some speciesfrom Texas to Guatemala are assigned to the subgenus Syrrhophus (about 25species of small frogs). From the south-western United States south and eastto western Colombia, Ecuador, and Venezuela one finds the frogs of the genusCraugastor. These two generic groupings account for nearly all species ofEleutherodactylus sensu lato known from Middle America except for perhapsa dozen species of another group found in Lower Middle America (but betterrepresented in South America). From the Bahamas and Cuba through all ofthe Greater Antilles, one fi nds a different group (subgenus Euhyas), whichscarcely even enters the Lesser Antilles. Human intervention has delivereda few species of Euhyas onto the mainland (south-eastern United States,Mexico, Nicaragua). Another group of a half-dozen species (subgenus Pelorius)is restricted to Hispaniola. The third grouping in the Antilles (subgenusEleutherodactylus) includes species on all of the major islands and throughthe Lesser Antilles. Some of these are widely introduced elsewhere (Bermuda,Hawaii, northern South America). In spite of being the most notable Neotropicalradiation, few works have treated the genus (sensu lato or sensu stricto)as a whole (Lynch 1976, 2001; Lynch and Duellman 1997)In South America, Eleutherodactylus species abound in the northern Andes,but barely penetrate Peru except as an assortment of species distributedalong the eastern fl anks of the Andes that then continues south to northernArgentina. These frogs are abundant in the western lowlands of Colombiaand Ecuador, patchily in the inter-Andean valleys of Colombia, and are onceagain diverse in the western part of the Amazon Basin. However, east of thewestern fringe of the Amazon Basin, Eleutherodactylus becomes a scarcebiological component (or even disappears entirely in the Llanos of Colombiaand Venezuela as well as in the Cerrado formations of Brazil), with only a minorflare-up in the Guianas. In the once-forested Atlantic domain of eastern Brazil(and south to north-eastern Argentina) there is another focus of diversity, insharp contrast to the situation over most of Brazil.The South American fauna has not been fragmented with generic (orsubgeneric) names as was the case for the Antilles and Middle America.Nonetheless, a number of clades are evident. The species of the Atlantic forestsof Brazil, Uruguay and Argentina represent a single clade (Lynch 2001),although some species of this clade extend westward to Bolivia. Anotherclade, present in the north-western part of the continent, is composed ofspecies with broad heads and chunky toad-like bodies. The remaining speciesare grouped into the subgenus Eleutherodactylus, with their distributioncentered on the Andes (and immediately adjacent lowlands) of Colombiaand Ecuador. This heterogeneous unit extends into Lower Central America(at least to Honduras), east to the mouth of the Amazon River, and southto Bolivia. Superimposed upon this pattern of distribution one fi nds sometaxonomic elements that have been separated from Eleutherodactylussensu lato on what could be viewed as tenuous grounds, for example,Phrynopus in the Andes from Colombia to Bolivia, separated because theylack digital disks.At least in terms of Colombia and Ecuador, there is an obvious patternto occurrence and diversity. In those areas with a negligible dry season,Eleutherodactylus communities achieve impressive diversities (to more than20 sympatric species). However, as the dry season becomes more and moremarked (and longer), diversity decays rapidly and only one or two speciespersist. When the dry season increases to three or more months duration,Eleutherodactylus disappear from the frog community or must retreatinto enclaves (caves or phyllotemata) so as to survive the dry conditions.The cause of this pattern is almost certainly the pattern of reproductionemployed by all known species (save the apparently extinct E. jasperi, oncean ovoviviparous species). Adults, juveniles, and egg masses occupy thesame ecological space and the embryos and small juveniles are especiallysusceptible to desiccation. Embryos and juveniles tend to occur in the leaflitter and the dry season is especially severe in that layer of the habitat (adultsmay retreat to phyllotemata or caves and by virtue of their smaller surfacearea/ volume ratio resist more effectively the harshness of the dry seasonthan the smaller juveniles).Members of the genus are smallish frogs. The smallest species havebody-size maxima of about 10 mm and these very small species (8-18mmbody size) are typically confi ned to the wettest parts of the landscape. Theother extreme is occupied by species of Craugastor that reach between 100and 130 mm body-size. Most of these occupy very wet habitats (such as theChocó), but some occur in lands that are or appear to be dry (for example,parts of the Mexican highlands extending into the south-western part of theUnited States where I once collected Craugastor augusti amidst cactus). Thegeneric name Eleutherodactylus means free toes – in allusion to the absenceof inter-digital membranes (webs – and this is true for the vast majority ofthe species now assigned to Eleutherodactylus. However, a few species have
Chapter 1. An Introduction introduction to the <strong>Amphibian</strong>s amphibians 21apparently never read Dumeril and Bibron or Boulenger and have obviouslywebbed feet (for example, the Puerto Rican E. karlschmidti and the ColombianE. anatipes and E. zygodactylus).For many reasons, Eleutherodactylus are confusing to the non-specialist.The confusion stems from several factors: (1) the sheer number of sympatricspecies in several areas; (2) the difficulty in distinguishing between adults andjuveniles, compounded by the first factor; (3) the marked sexual dimorphism,where for most species adult males are only about 75% the length of adultfemales; and (4) the widespread phenomenon of pattern polymorphism,especially evident in the exposed visible parts of the animal (dorsal surfacesof the body, head and limbs). When diversity is modest (fewer than a halfdozen sympatric species), even the non-specialist becomes slowly comfortablewith these frogs.ReferencesJohn D. LynchCrawford, A.J. and Smith, E.N. 2005. Cenozoic biogeography and evolution in direct-developingfrogs of Central America (Leptodactylidae: Eleutherodactylus) as inferred froma phylogenetic analysis of nuclear and mitochondrial genes. Molecular Phylogeneticsand Systematics 35:536-555.Darst, C.R. and Cannatella, D.C. 2004. Novel relationships among hyloid frogs inferredfrom 12S and 16S mitochondrial DNA sequences. Molecular Phylogenetics andSystematics 31:462-475.Frost, D.R., Grant, T., Faivovich, J., Bain, R., Haas, A., Haddad, C.F.B., De Sá, R.O., Channing,A., Wilkinson, M., Donnellan, S.C., Raxworthy, C., Campbell, J.A., Blotto, B.L., Moler, P.,Drewes, R.C., Nussbaum, R.A., Lynch, J.D., Green, D. and Wheeler, W. The amphibiantree of life. Bulletin of the American Museum of Natural History 297:1-370.Lynch, J.D. 1976. The species groups of South American frogs of the genus Eleutherodactylus (Leptodactylidae).Occasional Papers Museum of Natural History University of Kansas 61:1-24.Lynch, J.D. 2001. Four osteological synapomorphies within Eleutherodactylus (Amphibia:Leptodactylidae) and their bearing on subgeneric classifi cation. Revista Academia deCiencias Exactas, Físicas y Naturales 25:127-136.Lynch, J. D. and Duellman, W.E. 1997. Frogs of the Genus Eleutherodactylus (Leptodactylidae)in Western Ecuador: Systematics, Ecology, and Biogeography. University ofKansas Natural History Museum Special Publication 23:1-236.ESSAY 1.5. HYLIDAEHylidae, the treefrogs, is among the most species-rich family of amphibians, withmore than 800 described species. These include some species quite familiar tothe general public, such as common Green Treefrog Hyla cinerea and leaf frogs,but also an incredible diversity of less well-known groups. Hylids are foundmostly in South and Central America, as well as in the Australo-Papuan Region,but some species also occur in the Caribbean, North America, and temperateEurasia, including extreme northern Africa and the Japanese Archipelago.Our knowledge about the relationships and composition of Hylidae hasexperienced dramatic changes in recent years, in part thanks to the revelationsof DNA-based studies. For example, marsupial frogs, for a long timeconsidered to be hylids, have been shown by several analyses to be quiteunrelated with treefrogs, and have been shown to be unrelated to this familyin recent analyses (Haas 2003; Darst and Cannatella 2004; Faivovich et al.2005; Wiens et al. 2005; Frost et al. 2006)As it stands, Hylidae is now composed of three subfamilies. Phyllomedusinae,whose species are sometimes called “monkey frogs” or “leaffrogs”, includes the poster frog of the amphibian world, the Red-eyedTreefrog Agalychnis callidryas (LC), but also other charismatic species suchas Phyllomedusa sauvagii (LC), and the quite uncommon, but astonishinglybeautiful, Cruziohyla craspedopus (LC). This subfamily is distributed fromthe tropical areas of Mexico to northern Argentina. It currently comprises56 species divided into seven genera. A very interesting characteristic ofPhyllomedusinae is that most of its species lay eggs outside water. Eggs aremost frequently adhered to leaves (sometimes even completely envelopedby them) or tree trunks, where the earlier developmental stages are spent,and the tiny larvae then fall into the water body below them (be it a pond,stream, or even the water trapped in a tree hole), where they undergo larvaldevelopment as free-living feeding larvae.The subfamily Pelodryadinae includes all the Australo-Papuan treefrogs.Among their better known representatives are Litoria caerulea (LC), and theWhite-lipped Treefrog Litoria infrafrenata (LC). Its more than 170 speciesare included in three genera: most (126) occur in the genus Litoria, with theremaining members included either Cyclorana or Nyctimystes 5 . Pelodryadinesare amazing in that they diversified in complete isolation, occupying an extensiverange of habitats, and evolving multiple adult and tadpole morphologiesthat are quite reminiscent to those of the subfamily Hylinae.The subfamily Hylinae includes the core of hylid diversity. Its more than590 species are divided into 34 genera and four tribes. The tribe Cophomantiniis restricted to the Neotropics and includes five genera. This tribe includes,among others, the “gladiator frogs”, so called because males of several of itsspecies engage in violent territorial combats, assisted by a pre-pollex (one ofthe bones of the hand) that is modified as a spine of variable size and shape.The tribe Dendropsophini, whose identity still requires additional research,includes seven genera restricted to the Neotropics. This tribe includes the mostaquatic hylids (genera Lysapsus and Pseudis), so peculiar that for a long timethey were included in a separate family (Pseudidae). It also includes the twomost species-rich genera of the subfamily, the taxonomically complex Scinaxand Dendropsophus (about 90 species each, and doubtless much more awaitingdescription), and possibly the only known frugivorous frogs (genus Xenohyla).Litoria daviesae (Vulnerable), a representative of the subfamily Pelodryadinae,is distributed on the eastern edge of the tablelands and the greatescarpment of the Great Dividing Range of New South Wales, Australia.© Marion AnstisThe tribe Lophiohylini is also restricted to the Neotropics. This tribeincludes 10 genera, many of which include species characterized by heavilymodifi ed skull architecture, including fusion of several bones and unusualornamentations, earning them the name of “casque-headed frogs”. Aninteresting characteristic of this tribe is that many of its species depend onbromeliads and/or tree holes for refuge and even for reproduction, with onegenus (Phyllodytes) and some of the species of other genera (Osteocephalus,Osteopilus) laying eggs in the water trapped by the leaf axils of bromeliads,where the tadpoles then spend their entire larval life. The members of thegenus Nyctimantis and some species of Trachycephalus are suspected, orknown, to lay their eggs in water trapped in tree holes.The tribe Hylini includes 16 genera and is mostly concentrated in CentralAmerica and North America, with species of the genus Hyla also presentin temperate Eurasia, including extreme northern Africa and the JapaneseArchipelago. This diverse tribe includes common species such as the GreenTreefrog Hyla cinerea (LC), the cricket frogs (genus Acris), the unusual anddiverse Plectrohyla, from the mountains of Mexico, Guatemala, and Honduras,and the rarely seen fringe-limbed species of Ecnomiohyla.According to the results of the Global <strong>Amphibian</strong> Assessment, only asingle hylid is classed as Extinct, namely Phrynomedusa fi mbriata, whichhas not been recorded since it was fi rst collected in 1898 in south-easternBrazil. In addition, the Global <strong>Amphibian</strong> Assessment identifi ed another 123hylids as “Critically Endangered” or “Endangered”; interestingly, of these,81 are from the tribe Hylini (roughly 50% of the known species in the tribe!),while only 43 belong to the remaining groups (4 phyllomedusines, 12 pelodryadines,2 Dendropsophini, 13 Cophomantini, and 7 Lophihylini).Among those hylids classed in the Critically Endangered or Endangeredcategories, the overwhelming threat is habitat loss (113 species). However,whether the overwhelming majority of Hylini present on the list of CriticallyEndangered and Endangered hylids is partially the consequence of differencesin the perceived threat posed by habitat destruction by different specialists,or a genuine reflection of real destruction of the most diverse areas in CentralAmerica and the Caribbean, deserves further study. One important problemfacing the conservation of hylids in many countries is our ignorance about thegeographic distribution of a large number of species, a problem that complicatesany assessment of the status of their populations. A further problemstems from our plain ignorance about the taxonomy of several groups; thereare likely many dozens of species of hylids that are unknown to scientistssitting on the shelves of biological collections, not to mention many speciesstill awaiting discovery in poorly surveyed regions.In conclusion, Hylidae is a large and diverse family of amphibians, but, likemost other amphibian families, its members are facing population declines inthe face of a litany of threats (Blaustein et al. 1994; Beebee and Griffiths 2005).Although actions to mitigate against threats such as habitat loss are undoubtedlynecessary, the resolution of this environmental crises depends fi rstly onan attitude change of the humans in relations to their environment.ReferencesJulián Faivovich and Célio F.B. HaddadBeebee, T.J.C. and Griffi ths, R.A. 2005. The amphibian decline crisis: A watershed forconservation biology? Biological Conservation 125:271-285.Blaustein, A.R., Wake, D.B. and Sousa W.P. 1994. <strong>Amphibian</strong>s declines: judging stability,persistence and susceptibility of populations to local and global extinctions.Conservation Biology 8:60-71.Darst, C.R. and Cannatella, D.C. 2004. Novel relationships among hyloid frogs inferredfrom 12S and 16S mitochondrial DNA sequences. Molecular Phylogenetics andEvolution 31:462-475.Faivovich, J., Haddad, C.F.B., Garcia, P.C.A., Frost, D.R., Campbell, J.A. and Wheeler, W.C.2005. Systematic review of the frog family Hylidae, with special reference to Hylinae:phylogenetic analysis and taxonomic revision. Bulletin of the American Museum ofNatural History 294:1-240.Frost, D.R., Grant, T., Faivovich, J., Bain, R., Haas, A., Haddad, C.F.B., de Sá, R.O., Channing,A., Wilkinson, M., Donnellan, S.C., Raxworthy, C.J., Campbell, J.A., Blotto, B.L., Moler,P., Drewes, R.C., Nussbaum, R.A., Lynch, J.D., Green, D. and Wheeler, W.C. 2006. Theamphibian tree of life. Bulletin of the American Museum of Natural History 297:1-370.Haas, A. 2003. Phylogeny of frogs as inferred from primarily larval characters (Amphibia:Anura). Cladistics 19:23-89.Wiens, J.J., Fetzner, J.W., Jr., Parkinson, C.L. and Reeder, T.W. 2005. Hylid frog phylogenyand sampling strategies for speciose clades. Systematic Biology 54:719-748+48(Supp. Data).Phyllomedusa nordestina, a representative of the subfamily Phyllomedusinae, is known from north-eastern Brazil.The species was only recently described in 2006, and has yet to be assessed according to IUCN Red List criteria.© Célio F.B. HaddadBokermannohyla luctuosa (Least Concern), a representative of the subfamily Hylinae, is a common species fromsouth-eastern Brazil. © Célio F.B. Haddad
22Threatened <strong>Amphibian</strong>s of the WorldESSAY 1.6. THE AMPHIBIAN TREE OF LIFERecent advances in the field of computational biology and high-throughputDNA sequencing have opened up possibilities for exploring the relatednessbetween large numbers of species in a much more rigorous way than waspreviously possible (Wheeler 1996; Wheeler et al. 1996-2003). As a result ofthese advances, Frost et al. (2006), presented the first ever comprehensiveamphibian tree, and this was subsequently modified by Grant et al. (2006) (seeFigure 1). The analysis by Frost et al. (2006) addressed the relationships of522 species of amphibians, from all nominal families as well as a informativeselection of genera. Details of this very large tree are undoubtedly going tochange as data on more species become available, but the broad picture isnow probably reasonably well delimited.The tree shows that caecilians are not only the most distinctive group ofamphibians; they are also the sister group of all other living amphibians (i.e.,Batrachia, the salamanders and the frogs). In other words, the 172 species ofcaecilians form one ancient major branch in the tree, and the remaining 5,746species of salamanders and frogs form the other major branch. Among thesalamanders and frogs, the next major division is, not surprisingly, betweenthese two groups; they are sister groups of each other.Within the salamanders, two families (Cryptobranchidae and Hynobiidae)arguably form the sister group of all the other salamanders. According toFrost et al. (2006), these two families (collectively comprising 49 species)are centred on East Asia, with one species of Cryptobranchidae occurring inNorth America and a single species of Hynobiidae just reaching Europe. Theremaining clade of salamanders (comprising seven families and 486 species)is, with the exception of the Salamandridae, overwhelmingly North American.The position of Sirenidae, placed as the sister taxon of Proteidae by Frostet al. (2006), is controversial as this family was traditionally considered toform the sister taxon of all other salamanders. We can only assume thatthis result will be either further confirmed or rejected as more data come tobear on the question.The taxonomic changes within frogs are more drastic, although the bulk ofthe Frost et al. (2006) results have been suggested previously and many can beconsidered conventional, the taxonomy having just lagged behind the generalunderstanding of frog evolution. The vast majority of the species continueto belong to the Neobatrachia (see Figure). However, several groups branchoff from the stem of the tree before we reach the Neobatrachia. The fi rstgroup to branch off comprises a single family, the Leiopelmatidae (the NewZealand frogs and the tailed frogs of western North America), comprisingjust six species. This is the sister group of all the other frogs (5,205 species).Traditionally, this family would be considered “primitive”, but there is noparticular reason to consider these frogs as being more or less “primitive”than any others. However, they do comprise the most phylogenetically isolatedgroup of frogs in the world.The next major branch among the bulk of the frogs puts two families,the Pipidae (30 highly aquatic species in tropical Africa and South America)and Rhinophrynidae (one species from Mesoamerica) as the sister group toall remaining species. The Alytidae (midwife toads and painted frogs – 12species in Europe and the Mediterranean region) and the Bombinatoridae(fi re-bellied toads – ten species from western and eastern Eurasia andSoutheast Asia) are the next major branch to diverge from the tree, followedby the spadefoots (Megophryidae from East and Southeast Asia, Pelobatidaeand Pelodytidae from western Eurasia, and Scaphiopodiae from North andCentral America), which form a distinct clade of 142 species. As suggestedby Frost et al. (2006) and other authors (e.g., Savage 1973; Roelants andBossuyt 2005) spadefoots are the sister group of the Neobatrachia, whichcomprises the remaining 5,010 species.The fi rst split within the Neobatrachia is between the Heleophrynidae(the six species of South African ghost frog) and the remaining species,the Phthanobatrachia. The Phthanobatrachia consist of two familiar majorgroupings, the Hyloides (3,157 species – 60% of all frog species) and theRanoides (1,975 species – 38% of the frogs).The Hyloides is the dominant group of frogs in the Americas and Australia.Of the 18 families, 13 are endemic to the Americas, and two (Limnodynastidaeand Myobatrachidae) are centred on Australia. Of the remaining families, theHylidae is overwhelmingly concentrated in the Americas and Australia (butwith a few species in Eurasia), the Bufonidae is globally widespread exceptin Australasia, and the Sooglossidae is restricted to the Seychelles Islandsand the Western Ghats of southern India.The Ranoides is the dominant group in Africa and Eurasia, to which 13 ofthe 16 families are endemic. Of the remaining families, the Microhylidae iswidespread through both the New World and Old World tropics, the Ranidaeis globally widespread except in the southern parts of South America, Africaand Australia, and the Ceratobatrachidae ranges from East Asia to the islandsof the South Pacifi c.An understanding of the relationships between these families is importantfor conservation. In deciding conservation priorities, consideration needsto be given to the evolutionary distinctness of species, as well as to theseverity of threat to species. For example, using such considerations wewould devote much more conservation attention to the caecilians thanthey currently receive. And within the frogs, we should focus much more onthe New Zealand frogs and tailed frogs as the most evolutionarily distinctgroup of species.Simon N. StuartAcknowledgementsWe thank Darrel Frost and Taran Grant for their very helpful comments onan earlier draft of this essay.ReferencesCaeciliidaeIchthyophiidaeRhinadermatidaeCryptobranchidaeHynobiidaeRhyacotritonidaeAmphiumidaePlethodontidaeProteidaeSirenidaeAmbystomatidaeSalamandridaeLeiopelmatidaePipidaeRhinophrynidaeAlytidaeBombinatoridaeMegophryidaePelobatidaePelodytidaeScaphiopodidaeHeleophrynidaeSooglossidaeBatrachophrynidaeLimnodynastidaeMyobatrachidaeHemiphractidaeBrachycephalidaeNeobatrachiaCryptobatrachidaeAmphignathodontidaeHylidaeCentrolenidaeCeratophrynidaeLeptodactylidaePhthanobatrachiaCycloramphidaeepsLeiuperidaeBufonidaeHylodidaeAromobatidaeDendrobatidaeMicrohylidaeArthroleptidaeHyperoliidaeBrevicipitidaeHemisotidaePtychadenidaeCeratobatrachidaeMicrixalidaePhrynobatrachidaePetropedetidaePyxicephalidaeDicroglossidaeNyctibatrachidaeRanidaeMantellidaeRhacophoridaeCaecilians Salamanders Frogs and ToadsHyloidesRanoidesFrost, D.R., Grant, T., Faivovich, J.N., Bain, R.H., Haas, A., Haddad, C.F.B., de Sá, R.O.,Channing, A., Wilkinson, M., Donnellan, S.C., Raxworthy, C.J., Campbell, J.A., Blotto,B.L., Moler, P., Drewes, R.C., Nussbaum, R.A., Lynch, J.D., Green, D.M. and Wheeler,W.C. 2006. The amphibian tree of life. Bulletin of the American Museum of NaturalHistory 297:1-370.Grant, T., Frost, D.R., Caldwell, J.P., Gagliardo, R., Haddad, C.F.B., Kok, P.J.R., Means, D.B.,Noonan, D.P., Schargel, W.E. and Wheeler, W.C. 2006. Phylogenetic systematics ofdart-poison frogs and their relatives (Amphibia: Athesphatanura: Dendrobatidae).Bulletin of the American Museum of Natural History 299:1-262.Roelants, K. and Bossuyt, F. 2005. Archaeobatrachian paraphyly and Pangaean diversificationof crown-group frogs. Systematic Biology 54:111-126.Savage, J.M. 1973. The geographic distribution of frogs: patterns and predictions. In J. L.Vial (editor), Evolutionary Biology of the Anurans: Contemporary Research on MajorProblems: 351-445. Columbia, Missouri: University of Missouri Press.Wheeler, W.C. 1996. Optimization alignment: the end of multiple sequence alignment inphylogenetics? Cladistics 12:1-9.Wheeler, W.C., Gladstein, D.S. and De Laet, J. 1996-2003. POY: Phylogeny reconstructionvia optimization of DNA data. New York: Computer software distributed bythe authors and from the American Museum of Natural History: ftp://ftp.amnh.org/pub/molecular/poy.Figure 1. The amphibian tree of life, showing the relationships betweenamphibian Orders and Families, according to Frost et al. (2006), as modifi edby Grant et al. (2006).
CHAPTER 2. WHY SAVE AMPHIBIANS?Neil Cox, Richard J. Berridge, Don Church, Peter Paul van Dijk, Mirza Kusrini,Michal Lau, Thomasina Oldfield, Louise Rollins-Smith and Feng XieWhile scientists discuss the urgency of preventing further amphibian declines, it is clearthat many people are uncertain about why we should care about the loss of these species.When the ongoing extinction crisis is discussed, the question often asked is “why saveamphibians?” This chapter provides a brief discussion of some of the reasons for savingamphibians.In much of the world, amphibians, mostespecially frogs such as this mix of Fejervaryacancrivora (Least Concern) and Limnonectesmacrodon (Vulnerable), provide an importantbut often overlooked source of animal protein.© Anisa FitriAMPHIBIANS AS FOODTo many people, it may be surprising to hear that amphibians are a valued food sourcethroughout much of the world. The use of amphibians for food can range widely from theconsumption of animals for subsistence means, to their inclusion as essential ingredientsin gourmet dishes. The results of the GAA indicate that ~220 of the world’s amphibianspecies are used for food.The muscular back legs of the larger species of frogs, particularly members of thefamilies Ranidae and Leptodactylidae, are eaten in many cultures; in some regions, otherbody parts of both frogs and salamanders are also consumed. Liner (2005) has helpfullydocumented 193 recipes for frogs and toads, and 26 for salamanders (mostly recipes fromNorth America), and freely admits that this total does not include many of the expectedhigh number of recipes from Asia and Europe. In some instances, species that may seemparticularly unappetising are eaten; for example, the Campa Indians of central Peru arereported to roast (to remove noxious skin alkaloids) and eat the poison frog Epipedobatespetersi (Rodríguez and Myers 1993).Subsistence harvesting of amphibians for food is often quite small-scale or opportunistic,and may have little overall impact on amphibian populations (with the exception of somerestricted-range species). The results of the GAA suggest that at least 212 amphibians areused for subsistence food; however, the diversity of species consumed is probably underrecorded, and further studies will almost certainly reveal additional species not previouslyidentified as being used.Commercial harvesting of wild amphibians for food operates at scales ranging fromthe local collection and transportation of animals to regional or provincial markets, to theextensive international trade in frog legs. Unfortunately, commercial collection of wildamphibians has often been unsustainable, and in many cases appears to have resultedin significant reductions in amphibian populations. Declines of formerly common specieshave been reported from the United States (Jennings and Hayes 1985), Europe (Szilárd andCsengele 2001; Ljubisavljevic et al. 2003; Török 2003), South Asia (Fugler 1983; Abdulali1985; Niekisch 1986), China (Ye et al. 1993), Viet Nam (Nguyen Quang Truong 2000), andseveral Andean countries (Lehr 2000, 2006).From a global conservation perspective, amphibians with localized distributions, or thosethat are in high demand, such as the Critically Endangered Chinese Giant Salamander Andriasdavidianus, have undergone even more alarming declines. Many restricted-range species thatare collected for food are now threatened with extinction (such as the frog Batrachophrynusbrachydactylus EN, confined to the region of Lake Junin in Peru, and the Mountain ChickenFrog Leptodactylus fallax of the islands of Montserrat and Dominica [Rollins-Smith et al.2005a]), and while some species such as the Chinese Giant Salamander are protected byboth national and international legislation (nationally protected in China since 1988; listedon CITES Appendix I in 1997), unsustainable harvesting continues to threaten dwindlingpopulations (and see Essay 4.7).The international trade in frog legs still largely depends on the collection of wild animals,with the majority of animals in trade (all species) coming from wild sources (possibly upto 85% in 2002; see FIRI 2005). While frog legs are sold globally, the largest market byfar is Western Europe, particularly France, Belgium, the Netherlands [almost exclusivelywholesale for re-export], Luxembourg, and Switzerland (Niekisch 1986; Kusrini and Alford2006). The principal source of frog legs exported to these countries were initially India andBangladesh; however, concerns about the ecological damage resulting from the heavy harvestof amphibians, in particular of the species Hoplobatrachus tigerinus (LC) and Euphlyctishexadactylus (LC), led to export bans in the mid-1980s, and the listing of both species onCITES Appendix II in 1985, to establish controls on international trade aimed at keepingit within sustainable levels. Exports of frog legs from Indonesia (mostly from Java) havecontinued to increase since the first exports in 1969, and this country is now considered tobe the world’s primary exporter. In 2002, around 3,800t of frog legs, largely of the MangroveFrog Fejervarya cancrivora (LC), were exported from Indonesia, with 83% of these exportsgoing to Europe (Kusrini and Alford 2006). The impact of this heavy collection on Indonesia’sfrog populations is unclear, especially as the large domestic market still needs to be fullyinvestigated (see Essay 2.1). The results of the GAA given here indicate that the FangedRiver Frog Limnonectes macrodon of Indonesia now meets the criteria for the category ofVulnerable, in part as a result of the frog legs trade.In order to meet both international and domestic market demands for frogs, commercialfrog aquaculture has developed in some parts of the world. While frogs have generallybeen considered difficult to farm, as they often require moving food and are relativelyslow to reach marketable size, suitable pelleted food has recently been developed forfeeding to both adults and larvae. Fishery statistics available from the FAO indicate thatfarms in China alone annually produce substantial numbers of frogs; in 2004 these farmsare reported to have provided 73,837t of frogs (all species) (FAO-FIDI, c2004). In someinstances, it is possible to find example statistics for the cultivation of a single species ofamphibian. Approximately, 1,382t of American Bullfrogs Rana catesbeiana were reportedlyproduced by farms in 2004 with most originating from Taiwan (Province of China)(FAO-FIDI, c2004; FIRI 2005). Lau et al. (1999) report that more than six million ChineseEdible Frogs Hoplobatrachus rugulosus were imported to Hong Kong from Thailand in1999 1 . Unfortunately, frog aquaculture has in many instances been detrimental to wildstocks, with a key problem being the escape of large, often non-native amphibians (suchas the American Bullfrog) and their diseases, into surrounding environments (see Lanzaand Ferri 1997; Rueda-Almonacid 2000; Kiesecker et al. 2001; Mazzoni et al. 2003; Gorisand Maeda 2004) (and see Essay 4.8).MEDICINAL USE OF AMPHIBIANSWhile amphibians have long been recognized for their value in traditional medicines 2 , theyare increasingly also being acknowledged as an important potential source of chemicalsubstances for use in modern medicine. According to the GAA, at least 73 amphibians areconsidered to have some kind of medicinal value.In many parts of the world amphibians are still collected for use in traditional medicines bytribal and local peoples, often to meet primary health needs. Aside from this more localizeduse, there are some areas, notably East Asia, where commercial markets exist for the use ofamphibians in traditional medicinal practices. More than 30 species of amphibian have beenrecorded in Traditional Chinese Medicine alone (Ye et al. 1993). Most of the animals used inthe various traditional medicines tend to come from wild sources, and although much of theharvesting is of common or widespread species (and may often have little overall effect onthe conservation status of populations), there is concern that a number of restricted-rangespecies, such as the Critically Endangered Achoque Ambystoma dumerilii, a salamander fromLake Patzcuaro in Mexico, are now significantly threatened by over-harvesting.The potential value of amphibians to modern medicine is coming under increasingscientific study, with the diverse skin secretions produced by amphibians being of particularinterest. The skin of an amphibian must protect the animal against many environmentalpressures, including both disease and predation. Chemical secretions identified so far fallinto the four categories of biogenic amines, bufodienolides (bufogenins), alkaloids andsteroids, and peptides and proteins (Clarke 1997; Pukala et al. 2006). Of these substances,perhaps the most familiar are the alkaloids produced by the Neotropical poison frogs(Dendrobatidae), which rank among the most powerful animal poisons known. Hundredsof alkaloids have now been identified in extracts from amphibian skins, with many ofthese considered to be potentially very useful chemicals (Daly 1995; Philippe and Angenot2005). For example, the alkaloid epibatidine, isolated from the skin of the Ecuadorianspecies Epipedobates tricolor (EN), is a potent non-addictive analgesic considered tobe around 100 to 200 times more effective than morphine (Badio et al. 1994). While anumber of ongoing studies have demonstrated that many of the alkaloids in amphibianskin are not produced directly by the animals themselves, but are sequestered from thearthropods that make up much of their diet (Daly 1995; Smith and Jones 2004; Saporito etal. 2004), emerging evidence suggests that some species of Australian frogs in the genusPseudophryne are capable of directly biosynthesizing skin alkaloids (pseudophrynamines)(Smith et al. 2002).A number of important advances have recently been made in the study of the peptidessynthesized and typically stored in granular glands of amphibians. Several hundred peptideshave now been recorded from amphibians, and many of these are known to have antimicrobialproperties that act as an important natural defence against skin pathogens (Rollins-Smithet al. 2005b). Antimicrobial peptides from amphibian skin have potentially very significantapplications for both human health and conservation. Exciting work by VanCompernolleet al. (2005) has identified three amphibian antimicrobial peptides that inhibit Human ImmunodeficiencyVirus (HIV) infection of human immune system T cells. Importantly, thesepeptides have also been found to be effective at preventing transmission of HIV fromdendritic cells to T cells (see Essay 2.2).One important finding, particularly with regards to global conservation efforts, is that ofRollins-Smith et al. (2002, 2003) who determined that a number of amphibian skin peptidescan inhibit the growth of the chytrid fungal pathogen Batrachochytridium dendrobatidis,which is implicated as a major cause of ongoing global amphibian declines. Indeed, it nowappears that many amphibian species produce antimicrobial peptides that protect againstinfection with the chytrid pathogen (Rollins-Smith et al. 2005b). However, as many amphibiansare suffering chytrid-associated population declines, it seems entirely plausible that inmany instances these natural defences have now been compromised by other environmentalfactors (Rollins-Smith et al. 2005b).THE INTERNATIONAL PET TRADESince the mid 20 th century, a wide range of amphibian species has been represented inthe international pet trade. The GAA recorded that at least 278 species of amphibian werein the pet trade alone, and it is likely that many additional species enter the trade on aregular basis. The main centres of export for the amphibian pet trade are the wet tropics,with species largely coming from the rainforests of Africa (including Madagascar), CentralAmerica, South America and Southeast Asia. Comprehensive data covering all amphibianstraded are often hard to come by, especially as there is no global database or monitoringsystem for the trade in non-CITES species (Schlaepfer et al. 2005). Very generally, the maininternational markets for pet amphibians are considered to be within North America and
24Threatened <strong>Amphibian</strong>s of the WorldA number of brightly coloured amphibiansare now regularly bred in captivity and keptas pets. Pictured here is the Dyeing PoisonFrog Dendrobates tinctorius (Least Concern),a native species of the lowland forests ofthe Guianas and adjacent Brazil. © HenkWallaysTable 1. Export of Mantella frogs between1994 and 2003 from Madagascar as reportedin the CITES annual report data obtained fromthe UNEP-WCMC trade database (data collatedon 2 May 2005). The species M. baroni,M. cowani, M. haraldmeieri, M. madagascariensisand M. pulchra have gone throughstages of profound taxonomic rearrangementsbetween 1988-1999, and these have beenlargely confounded also in the pet trade. Thetrade figures of these species therefore needto be viewed with some caution (reproducedfrom Rabemananjara et al. in press).Europe, and developed countries such as Japan. Schlaepfer et al. (2005) provide a valuablestudy of imports of wild reptiles and amphibians into the United States from 1998-2002;during this period at least five million amphibians, reported as being from wild-caughtsources, entered the US primarily for the purposes of the pet trade 3 .The export of mantella frogs (Mantellidae) from Madagascar has been particularlyclosely examined, and provides a helpful case study of the value of some amphibians inthe international pet trade. Data gathered by Rabemananjara et al. (in press) reveal thatover the 10-year period from 1994-2003 the top ten importers of mantella frogs were: theUnited States (71% of all mantellas exported from Madagascar), the Netherlands (5.5%),Germany (5.2%), Canada (4.6%), Belgium (4.5%), France (2.2%), Japan (1.9%), Switzerland(1.1%), Great Britain (1.3%), and Spain (1.0%). This trade comprised over 230,000 animals,and over a period of three years (2001-2003) was worth almost US$250,000 in foreigncurrency revenue for Madagascar. Although these figures relate just to mantellas, andare therefore subject to certain influences 4 , the broad trends in these data, particularly interms of which countries have the highest demand for pet amphibians, are likely to applyacross many other genera.The most common amphibians in the international trade are the frogs and toads, andamong these several groups of species predominate. The brightly coloured poison frogs(Dendrobatidae) and the equally attractive mantellas from Madagascar (Table 1) havealways been in high demand. Other popular anurans include similarly spectacular species,such as treefrogs (most often in the family Hylidae), fire-bellied toads (Bombinatoridae),horned frogs (Ceratophrys, in the Leptodactylidae) and several aquatic frogs (often speciesin the genera Hymenochirus or Xenopus). Several salamander species are also traded,with aesthetic appeal seeming to be the main criterion for inclusion. Popular taxa includethe Asian fire-bellied newts of the genus Cynops, members of the North American familyPlethodontidae, and other brightly coloured salamanders such as the European Fire SalamanderSalamandra salamandra (LC), and several newts of the Asian genus Tylototriton.Salamanders of the family Ambystomatidae are also in demand as pets, often because oftheir large size, general ease of maintenance and, perhaps most particularly in the case ofthe Axolotl Ambystoma mexicanum (CR), their fascinating ecology and breeding biology.Caecilians tend to be comparatively rare in the international pet trade, with the easier toobserve fully aquatic species (such as Typhlonectes natans LC), being more readily availablethan the predominantly subterranean forms.While the vast bulk of the international pet trade in amphibians comprises wild-caughtspecimens, in several instances captive-bred individuals feature more prominently. Forexample, some captive-bred colour morphs of particular poison frogs (such as the pink andyellow morph of Epipedobates tricolor) now appear to be commoner in the trade than theirwild progenitors. A comprehensive study of the trade in dendrobatid frogs by Gorzula (1996)revealed that an increasing proportion of the animals recorded in trade from 1987 to 1993were reported as having been captive-bred; of nearly 16,000 poison frogs in internationaltrade during this period, live captive-reared frogs represented 13.1% of the total traded 5 .It seems possible that the implementation of various regulatory controls, such as CITES(which has also had a marked effect on the availability of particular species), has provideda stimulus for the development of captive-breeding methods, which in turn have reducedthe need for wild-caught individuals. Several amphibians that are particularly popular aspets are also captive-bred in commercial quantities, such as the Ceratophrys horned frogs,some treefrogs (such as Red-eyed Treefrog Agalychnis callidryas LC), and a number ofpoison frog species. And, indeed, the Axolotl Ambystoma mexicanum is more common incaptivity now than it is in the wild.There is potential scope for developing sustainable in situ harvesting, or farming, ofsome of the more desirable species, where their ecology is sufficiently well understoodfor sustainable harvest quotas and practices to be established (see also Chapter 11). Thiscould have profound conservation benefits, as although most amphibian species kept aspets have been now bred in captivity on occasion, the great bulk of all animals in trade arestill collected from wild populations. And even where the capture of wild specimens doesnot yet constitute a threat to a species, the development of in situ harvesting practicescould provide the required incentive to motivate landowners to protect and even enhancethe species’ habitat. A local, sustainable, production programme for species of relativelyhigh worth (e.g., mantella frogs or poison frogs) could also have the additional benefit ofplaying a role in poverty reduction strategies for some of the poorest parts of the world(and see Chapter 11).ECOSYSTEM ROLE OF AMPHIBIANSAlthough generally unseen, amphibians can often be very abundant in some ecosystems.In both temperate and tropical environments, amphibians may exceed all other terrestrialvertebrate classes (reptiles, mammals, and birds) in both the numbers of individuals and inthe proportion of total available biomass (Stebbins and Cohen 1995). Examples of particularlyhigh abundances of amphibians include findings by Gergits and Jaeger (1990) of densitiesTaxon 1994 1995 1996 1997 1998 1999 2000 2001 2002 2003 TOTAL %Mantella spp. 0 0 0 230 620 200 6,760 9,853 1,420 1,291 20,374 8.71Mantella100 11,965 16,693 17,406 3,194 8,850 11,445 10,335 4,780 2,681 116,196 49.68aurantiacaMantella baroni 0 0 0 0 0 0 0 0 10 650 660 0.28Mantella bernhardi 0 0 0 0 0 30 490 1,005 650 60 2,235 0.96Mantella betsileo 0 0 0 1,000 435 175 150 4,040 1,215 1,465 8,480 3.63Mantella cowani 0 0 0 0 52 150 425 975 1,520 500 3,622 1.55Mantella crocea 0 0 0 0 395 250 1,157 1,750 630 100 4,282 1.83Mantella expectata 0 0 0 100 624 105 1,260 1,790 2,585 1,100 7,564 3.23Mantella0 0 0 0 0 0 240 310 380 350 1,280 0.55haraldmeieriMantella laevigata 0 0 0 100 435 415 2,537 2,795 1,170 1,581 9,033 3.86Mantella0 0 0 125 2,182 1,535 6,195 8,805 5,945 4,848 29,635 12.67madagascariensisMantella0 0 0 0 0 0 0 0 1,270 1,780 3,050 1.30milotympanumMantella nigricans 0 0 0 100 200 0 155 490 80 0 1,025 0.44Mantella pulchra 0 0 0 0 784 905 3,277 4,430 2,990 2,560 14,946 6.39Mantella viridis 0 0 0 125 690 385 1,951 3,825 2,495 2,040 11,511 4.92TOTAL 100 11,965 16,693 19,186 9,611 13,000 36,042 50,403 27,140 21,006 233,893 100of 7-10 individuals per square metre in Red-backed Salamander Plethodon cinereus populationswithin the Shenandoah National Park, eastern USA; and estimates by Stewart andRand (1991) of as many as 20,570 adult Puerto Rico Coqui Frogs Eleutherodactylus coquiper single hectare of forest.It is probable that amphibians can occur in such abundance because both adults and larvaeare often the immediate primary vertebrate predators of invertebrates (especially insects), inboth freshwater and moist terrestrial environments (Stebbins and Cohen 1995). Additionallymany larvae are primary consumers of plant matter, such as algae, and detritus and canbe frequently found at high densities in freshwater habitats. In agricultural landscapes,such as rice paddies, amphibians have been suggested as important agents in the controlof invertebrate pests (Abdulali 1985; Oza 1994). There is some concern that the removal ofamphibians from these systems could lead to increases in these pests, and subsequentlyto an increase in the need for the application of insecticides and other agrochemicals. Itshould be noted here that a number of amphibians, such as the Cane Toad Bufo marinus (LC),have been widely introduced as biological controls of insect pests. In the majority of cases,naturalized populations of non-native amphibians are considered to have had damagingecological and/or socioeconomic consequences. Lever (2003) provides extensive detailson the effects of known amphibian introductions worldwide.<strong>Amphibian</strong>s are one of the key links in many ecosystem food webs. As “cold-blooded”ectotherms, ingested energy from food is efficiently converted to high-quality new tissue,with this biomass then becoming readily available for transfer to higher trophic levels(Pough 1983; Stebbins and Cohen 1995; Whiles et al. 2006). In both freshwater and terrestrialecosystems, amphibians as adults and larvae represent a major food resource formany predators, including large invertebrates, fishes, other amphibians, reptiles (snakes inparticular), birds, and mammals. Through the process of metamorphosis, they also providea link in the transfer of nutrients from aquatic systems to terrestrial ones (including forest,see Gibbons et al. 2006).From the few studies that have been undertaken into the potential consequences ofremoving amphibians from an ecosystem, it appears that important changes can take placein both ecosystem processes and services. Among the structure and functions affected by theremoval of amphibians are algal communities, invertebrate populations, predator dynamics,organic matter dynamics, patterns of primary production, leaf litter decomposition, andnutrient cycling (Whiles et al. 2006).The future impact of ongoing amphibian declines on the world’s ecosystems is stilluncertain with much further study needed. However, given the important role of amphibiansin many food webs it seems likely that significant measurable changes in both freshwaterand terrestrial environments will eventually take place.MONITORING ENVIRONMENTAL CHANGE<strong>Amphibian</strong>s have a number of physiological, ecological and life history characteristics thatmake them susceptible to environmental changes. They are often considered to be valuablebioindicators of environmental change in both aquatic and terrestrial environments, anddeclines in amphibian populations or species diversity have frequently been directly linkedto habitat degradation (Harfenist et al. 1989; Vitt et al. 1990; Blaustein and Wake 1995;Stebbins and Cohen 1995; Dodd 1997; Southerland et al. 2004).It seems that relatively few attempts have been made to explicitly estimate how goodamphibians are as indicators compared with other taxonomic groups. Welsh and Droege(2001) argued that the low variation in counts of plethodontid salamanders among studiesrelative to Lepidoptera (butterflies and moths), passerine birds, small mammals, and otheramphibians suggests that these salamanders provide a statistical advantage over otherspecies for monitoring forest health 6 . In contradiction to Welsh and Droege (2001), Baileyet al. (2003, 2004a,b,c) explicitly estimated detection probability and temporary movementin plethodontid salamander populations using marked individuals and found that counts ofanimals varied both spatially and temporally, thereby potentially confounding any studiesthat use simple counts by themselves as a surrogate to population size. In other words, thefindings of Bailey et al. (2004a,b,c) suggest that counts that are not corrected by incorporatingdetection and temporary movement probabilities across temporal and spatial componentsof a study area are likely to provide inaccurate and potentially biased indications of howpopulations and, thereby, the environment are faring. As further complication to the potentialof plethodontids as indicator species, Bailey et al. (2004a) found that accounting for detectionprobability can only do a reasonable job of correcting counts if temporary movement froma population is a random process.Although there remains some uncertainty concerning the overall value of amphibiansas bioindicators, especially with regards to monitoring more difficult to observe species,the following text outlines some of the commonly recognized characteristics of amphibiansthat are believed to be of use in recording environmental change.Physiologically, the skin and egg capsules of amphibians are often highly permeableto gases and liquids and may readily absorb pollutants such as toxic chemicals, endocrinemimics, and other substances from the surrounding environment (Stebbins and Cohen 1995;Dodd 1997). Contamination with many of these substances can often result in rapid declinesin amphibian populations, and, perhaps more pervasively, can frequently lead to abnormalmetamorphosis from the larval stage to the adult form (malformed animals may often beobserved in contaminated populations).<strong>Amphibian</strong> larvae feed on a wide variety of plant and animal matter, in all parts of thewater column from the benthic detritus to the surface film. The larvae are often susceptibleto ingesting persistent chemicals attached to particulate matter. The chemicals can readilyaccumulate in fat deposits, and sequestered contaminants may also significantly affectnormal development or metamorphosis when the fat deposits are drawn upon. As adultamphibians largely feed on invertebrates, they are also vulnerable to bioaccumulation ofpersistent chemical pollutants, such as polychlorinated biphenyls (PCBs) or dichloro-diphenyl-trichloroethane(better known as DDT), in the food web (Hall et al. 1985; Stebbins andCohen 1995; Dodd 1997; Fagotti et al. 2005; DeGarady and Halbrook 2006).<strong>Amphibian</strong> populations can decline in response to changes in the acidity of aquatichabitats, through either a decrease or increase in pH levels. Sources of changes in pH includeacidic precipitation, or point pollution, such as runoff from abandoned mines (Dodd 1997;Middlekoop et al. 1999). In general, eggs and developing larvae are the most sensitive lifestages to low pH (< 4.5) (Dodd 1997).Adult temperate and montane amphibians are often heliothermic, and may exposethemselves to sunlight in order to increase their body temperatures. This characteristic maymake animals more susceptible to increases in ultraviolet (UV) radiation, often associatedwith a thinning of the ozone layer (Stebbins and Cohen 1995). In addition, as amphibians aremoisture dependent ectotherms, they are generally sensitive to any changes in temperatureor precipitation levels. Unfavourable conditions may prevent reproduction, possibly for manyyears (Stebbins 1995).
Chapter 2. Why Save <strong>Amphibian</strong>s? 25<strong>Amphibian</strong>s are one of the key links in ecosystemfood webs, providing a significantfood source for snakes and other predators.This juvenile Pink-sided Treefrog Agalychnislitodryas (Vulnerable) has become preyfor the snake Leptodeira septentrionalis.© H. Mauricio Ortega-AndradeIncreases in sedimentation or turbidity of streams and other waterbodies may be revealedthrough changes in both the species richness, and population sizes, of amphibians present(Welsh and Ollivier 1998). Many species, possibly most especially in their larval stage,are sensitive to the loss of certain microhabitats or food sources resulting from increasedlevels of particulates. Other species may be affected by a reduced efficiency of their gillswithin turbid waters.Unlike many vertebrates, such as birds, some amphibian species have a low inclination orability to disperse and tend to be largely confined to small areas of moist habitat (althoughsee Chapter 1) (Smith and Green 2005). These sites, and the amphibian populations present,are often naturally fragmented and there can be little or no movement between populations.Consequently, the loss of one of these populations, for instance through a temporarypollution event, does not necessarily mean that the site will be easily recolonized from anynearby populations. The loss of amphibian populations in some species can, therefore, beused to track ecological disturbance with some confidence that recolonization from adjacentpopulations will not mask any notable changes to the environment.It has sometimes been suggested that while some invertebrates have the ecologicalcharacteristics that make amphibians helpful bioindicators, they generally differ in thatmany species are short-lived and can have significant population fluctuations within a shorttimeframe. However, amphibian populations may also exhibit unstable population dynamics(e.g. Pechmann et al. 1991). To use them as bioindicators it is necessary to either monitortheir populations over long periods or establish a solid understanding of the relationshipsamong population vital rates, the environmental factors that influence these rates, and howthe environment is likely to change in the future so that stochastic population projectionscan be performed.While nearly all caecilian and salamander species make little, if any, noticeable vocalizations,the often loud calls by frog species are well known to most people. Communicationbetween individual frogs is a helpful means by which the general species composition ofthe area, and relative density of the individuals for each species, can be roughly determined.Auditory monitoring of frog vocalizations can help indicate any changes in either speciescomposition or density of individuals (which in turn may reflect changes in environmentalquality of the site) (Crouch and Paton 2002; Brandes et al. 2006).LEARNING FROM AMPHIBIANSFor many people, one of their first experiences in handling amphibians is in dissecting afrog during school biology classes. Frogs are most frequently used in these classes, as theycost relatively little and are often readily available. The primary aim of such lessons, ofcourse, is to observe the animal’s major internal organs (such as the heart and the liver),and thereby allow students to gain a better understanding of basic vertebrate (includinghuman) anatomy and physiology. As many biology classes require a course in dissection,there is understandably a high demand for subject animals. Although the volume of frogsspecifically used in dissection classes is difficult to determine, an early study by Gibbs etal. (1971) reported that approximately 326.5t of wild-caught animals (Leopard Frogs Ranapipiens and Bullfrogs Rana catesbeiana) were annually supplied for educational and researchpurposes in the United States 7 . Pandian and Marian (1986) estimated that 18 million frogswere used in 1980 by the education sector in India; a significant rise on the 2.6 million animalsestimated to have been used in 1956. It is difficult to determine the current volume of animaluse in countries such as the United States, as supply companies are perhaps understandablyconcerned about the confidentiality of these data. However, information kindly provided byCarolina Biological Supply Company (USA) suggests an overall decline in the use of frogs(both live and preserved) within the United States for dissection in education (D.E. Jamespers. comm.). Most of the frogs now used in the classroom appear to originate from cultivatedstock, although small numbers of wild animals are still available 8 .Today, modern technology means that there are now a number of interactive or ‘virtual’programmes and software available for use in dissection and anatomy classes (Kinzie et al.1996). Many of these programmes use virtual frogs as the dissection subject, and in someinstances provide an alternative to the use of animals in classes.Outside the classroom, amphibians have contributed to important medical research anddiscoveries. In fact, seven Nobel prizes have been awarded based on research done withamphibians. While using a dissected frog, the 18 th century Italian anatomist Luigi Galvanifound by chance that muscle and nerve cells produce electricity. During the discovery,Galvani’s assistant accidentally touched an electrically charged scalpel to the sciatic nerveof the dissected frog, causing the limbs to violently twitch and convulse. This observationand subsequent experiments by Galvani helped to establish the basis for the study of thenervous system through the scientific disciplines of neurophysiology and neurology.<strong>Amphibian</strong> oocytes (a cell which may produce an egg [ovum] by meiotic division) arecommonly used in ‘patch clamp’ experiments for measuring the electrical properties ofbiological cells and tissues. The Nobel Prize-winning team of Bert Sakmann and ErwinNeher developed this technique, which is used to measure the movement of electricallycharged molecules through individual channels in the membranes of cells (Neher andSakmann 1976). To conduct an experiment, a very fine, polished glass pipette is placed incontact with the membrane of a cell, and then slight suction is used to make a very tightseal between the pipette and the ‘patch’ of cell membrane underneath the pipette’s tip.The passage of electrically charged molecules through the cell’s membrane channels, bothinto, and out of the cell, is then measured. Xenopus oocytes are commonly used for theseexperiments because of their relatively large size (at approximately 1mm across they are 10times larger than most animal cells), which makes their handling and manipulation easier.Not only can patch clamping be used to examine the electrical properties of the channelsthat are normally found in the membranes of Xenopus oocytes, but treatment with geneticmaterial from other organisms makes the oocytes ‘express’ other organisms’ membranechannels too, making Xenopus oocytes an extremely valuable tool for neurological research.Molecules that are temporary copies of DNA (mRNA - messenger RNA) can be extractedfrom the cells or tissues of other organism, and then injected into the Xenopus oocyte, whichwill manufacture the foreign proteins, and incorporate that organism’s foreign channels intoits own membranes, as if they were actually its own 9 .<strong>Amphibian</strong> eggs have an especially important role in the field of embryology – the studyof the formation, early growth, and development of living organisms. The large size of amphibianeggs and their translucent jelly-like coat provide a helpful window into embryonicdevelopment, with the African-clawed Frog Xenopus laevis (LC) most regularly used as themodel organism for embryology studies (Gurdon and Hopwood 2000). During the 1930s, itwas discovered that female Xenopus could be induced to ovulate when injected with theurine, and hormones, of a pregnant woman. Additional research demonstrated that otherspecies of frogs, such as Rana pipiens and Bufo viridis, could also be used as pregnancytests (Miller and Wilberger 1949; Rabau and Szeinberg 1959). For some time during the1940s and 1950s the use of Xenopus, or the Hogben test as it was called, was the onlypregnancy test readily available to hospitals. Once it was realized that large eggs suitablefor microsurgery could be obtained year-round from domesticated Xenopus, embryologistsno longer needed to rely on the seasonal collection of wild amphibian eggs for their experiments.The eggs of Xenopus are now the leading choice for many embryology studies, asthey are ideal for microsurgery, and can be easily manipulated both morphologically andgenetically (Stebbins and Cohen 1995).It may be of some interest that the world’s first successful cloning experiments relied onthe use of amphibians. In 1952, the two scientists Robert Briggs and Thomas King managedto clone a Leopard Frog by carefully transferring early stage nuclei (from blastula cells)into enucleated eggs (Briggs and King 1952). Although some of Brigg’s and Kings’ initialattempts failed, they continued perfecting their methods and by the end of the project anumber of eggs had successfully developed into normal tadpoles. However, during their
26Threatened <strong>Amphibian</strong>s of the WorldLaboratory studies using the African ClawedFrog Xenopus laevis (Least Concern) haveled to significant medical breakthroughs.© Louis du PreezIt was once believed that the Common FireSalamander Salamandra salamandra (LeastConcern) was invulnerable to fire, mostlybecause hibernating animals would quicklyemerge from firewood once it had been lit.© Jelger HerderPeople may often be surprised by how manysimple images of amphibians surround themin daily life. For example, this baker’s shopin Denmark sells tasty frog-shaped cakes.© Thomas Brooksexperiments, Briggs and King were unable to clone frogs using nuclei from older, differentiated,embryo cells. The breakthrough came in 1962, when the scientist John Gurdonfinally demonstrated that successful cloning could be achieved from differentiated cells.Gurdon transferred intestinal cell nuclei from Xenopus tadpoles into enucleated eggs andmanaged to produce 10 normal tadpoles (Gurdon 1962). Although there was some initialscepticism among scientists concerning Gurdon’s results, his later experiments confirmedthat a major advance in our understanding of cloning had indeed taken place. The potentialimportance of the achievements of these cloning pioneers is difficult to overestimate. Theirexperiments with amphibians have formed the scientific basis for later landmark events,such as the cloning of Dolly the sheep, the first mammal to be successfully cloned from anadult cell (Wilmut et al. 1997).Unfortunately, although we are continuing to gain an appreciation for the value of amphibiansfor medical advances and in research, it seems as though one important lesson mayhave been lost forever. The two species of gastric-brooding frogs (Rheobatrachus silus andR. vitellinus) from the rainforests of Queensland, Australia, had extraordinary reproductivehabits in which the females brooded young within the stomach and disgorged the fullydeveloped young through the mouth. Research by Tyler et al. (1983), when the species wasalready rare, provided evidence that the tadpoles secrete a substance (prostaglandin E 2) thatinhibits the secretion of gastric acid by the female. It certainly seems possible that furtherstudies of this remarkable reproductive mode could have resulted in medical advances inthe treatment of people who suffer from gastric ulcers. Sadly, neither of the Rheobatrachusspecies has been seen since the mid-1980s, despite extensive field surveys, and both arenow considered to be extinct (see Essay 6.1).THE CULTURAL USE OF AMPHIBIANS<strong>Amphibian</strong>s have long been represented in the cultures of many human societies. As it isdifficult to present a concise picture of the spiritual, material, intellectual and emotional usesof amphibians, the following examples are intended to provide only a very brief overviewof their many contributions.Within written records, amphibians are well represented in antiquity by the AncientEgyptians, most especially in the form of the goddess Heqet who symbolized birth and rebirth,life and fertility. Heqet is depicted in hieroglyphs as a frog or as a woman with a frog’s head,a reflection of the sudden abundance of calling frogs during and following Nile River floods.An important cultural reference to both frogs and Ancient Egypt is found within the Biblicalbook of Exodus and Sura 7 in the Quran, in which Moses leads the Israelites from Egypt.In Exodus, 10 plagues are inflicted upon Egypt by God to convince Pharaoh to allow theIsraelites to leave. The second of these plagues was a horde of frogs that overran the land.Pharaoh gave permission for the Israelites to leave if Moses would agree to remove the frogs;however, once the frogs had died Pharaoh reneged on his word. God subsequently sent eightmore calamities to Egypt before the Pharaoh agreed to let the Israelites leave.Frogs are not the only amphibians that have been associated with religion, spiritualismor mysticism. Salamanders were long associated with the popular European myth that theseanimals were invulnerable to fire. Indeed, it was often believed that salamanders preferredthe hottest or fiercest of fires. It seems as though this legend is almost certainly derivedfrom the frequent hibernation of Fire Salamanders Salamandra salamandra in stacks offirewood. The Axolotl of Mexico provides another helpful example of a culturally importantsalamander (see Essay 2.3).There are several local festivals around the world in which frogs are the leading feature,and a few examples are given here. During the Maguai (= frog) festival of the Zhuangpeople of Guangxi, China, a frog is captured, honoured and then buried in order to ensuregood weather and an excellent harvest for the following year. Since 2003, the city of SanFernando on Luzon Island in the Philippines has held the Pyestang tugak frog festival; withthe purpose of perpetuating the Kapampangan people’s traditional methods of catching andcooking frogs. The City of Rayne in Louisiana, USA, declares that it is the “Frog Capitol of theWorld”! People attending this annual festival can see frog races and jumping competitions,as well as frogs dressed up in small uniforms.In Japan, the frog is traditionally viewed as a symbol of good fortune endowed with magicalpowers. The word for frog in Japanese, ‘kaeru’, also means ‘to return’; this may includea return from travel, the return of a fortune, or the return of youth. Small charms of frogs areoften carried, and are considered to be especially lucky if the frog’s mouth is open.<strong>Amphibian</strong>s are regularly found in both classical literature and fairy tales. Shakespearegives a familiar view of the toad in the comedy ‘As You Like It’ (“Sweet are the uses ofadversity, which, like the toad, ugly and venomous, Wears yet a precious jewel in hishead.”), and amphibians are an important ingredient of a witches brew (“eye of newt andtoe of frog”) in the tragedy ‘Macbeth’. Mark Twain wrote about the unfortunate gamblerJim Smiley and his trained frog, Daniel Webster, in the short story ‘The Celebrated JumpingFrog of Calaveras County’. The much-loved central characters of the children’s stories,‘Jeremy Fisher’ by Beatrix Potter, ‘The Frog Prince’ by the Brothers Grimm and ‘The Wind inthe Willows’ by Kenneth Grahame, are all amphibians. Aesop included frogs in two of hismost popular fables ‘The Frog and the Ox’ and ‘The Frogs Who Desired a King’.Images of amphibians, especially frogs, are often used for advertising or entertainmentin popular culture. International advertising campaigns for beer (Budweiser®) and telephonering-tones (the ‘Crazy Frog’) feature amphibians, as do advertisements and packaging forproducts as diverse as shoe-polish (Erdal®) and chocolate (‘Freddo Frog’). Within entertainment,amphibians are commonly found in video games, such as the classic arcade game‘Frogger’, as puppets, such as the frog ‘Kaj’ in the popular Danish children’s TV series “Kajog Andrea”, and as characters in various cartoons and manga comics including: Michigan J.Frog, an animated ‘Looney Tunes’ cartoon character; Sergeant Keroro, an anime character;Flip the Frog, an animated cartoon character who starred in a series of cartoons from 1930to 1933; and Baron Silas Greenback, the recurring villain in the British animated televisionseries, ‘Danger Mouse’. Finally, of course, perhaps the most widely recognized amphibianin contemporary pop-culture is the puppet Kermit the Frog, famously associated with thewell-known television programmes Sesame Street and The Muppets.THE BEAUTY OF AMPHIBIANSIn concluding this chapter on the value of amphibians to society, it is important to discusstheir aesthetic worth, and although this component of intrinsic value generally defiescomplete quantification in monetary terms, it is important to recognize, and providesperhaps the most important incentive for valuing amphibians (McCauley 2006a,b). Inparticular, because amphibians are abundant and generally harmless, they may be oneof the first wild animals encountered by young children that can lead to an enduringappreciation of nature.Carl von Linnaeus, the founding father of modern taxonomy, famously described amphibiansas “ugly, disgusting creatures ... whose creator failed to try and make more of them”(Hofrichter 2000). However, there is, in fact, a diversity of colour, form, appearance andactivity among amphibians to rival the aesthetic delights of anything else that the naturalworld cares to dazzle us with. Colours range from one end of the spectrum to the other,with every possible permutation in between, with reds, oranges, brilliant vermilions, blues,greens, violets, pinks, black, and even white. Some are paradigms in post-modernism, beingdelicately dipped in just one shade, while others combine crazy rainbow combinationswith spots, stripes, hatches and stipples, madly finished off with tiger-striped legs. Yet othersamaze with their uniform bright, almost fluorescent colouration, impossibly tastefully welloffset by a crystal clear, shining bright black. No one who sees these species can fail to beamazed by their outlandish, excessive, seemingly pointless beauty.Yet, these colours serve a very important purpose. Bright colours may serve to advertisefitness to a potential mate, and toxicity (to predators) in the dark confines of the rainforest.A tasteful mix of browns and greys is just the right combination to render a dainty treefrogidentical, upon resting, to a very ordinary, quite unappetising bird dropping. Other speciesproduce amazing visual displays by hiding their brightest surprises until the situation demandsthat they parade themselves in all their glory – the fire-bellied toads (Bombina spp.)are camouflaged on their upper surface, being a mixture of browns, blacks, and greens, butupon disturbance by a predator they arch their backs and reveal a stunning fiery belly, aflamewith bright oranges, reds, and yellows, warning any foolish predator to back off, lest theyingest some of the poison the toads carry. The frog Physalaemus nattereri (LC) even revealsstartling eye-patches on its hind legs when being pursued by a predator; the eye patchesare actually inguinal venomous macroglands, but they contribute to the appearance of alarge face with a pair of impressive large eyes.The particular characteristics or forms are often reflected in their scientific names.The Latin name of the Golden Poison Frog Phyllobates terribilis (EN) is most apt whenone considers that it is the most toxic species of frog in the world (Myers and Daly 1983).Another example is the Lake Titicaca Frog Telmatobius culeus (CR), whose names translatesas ‘aquatic scrotum’ on account of this species’ multiple folds of baggy skin, designed toenhance oxygen uptake in its cold water habitat.There is little doubt that the sheer diversity of form and appearance provides an endlessaesthetic treat for the interested observer. But perhaps the greatest appeal of amphibiansis not visual, but acoustic as anyone who has ever been privy to a chirping chorus of frogsas they begin their courtship ritual in early spring will attest.“Frogs do for the night what birds do for the day... they give it a voice. And that voice isa varied and stirring thing that ought to be better known.”These words written by the zoologist, Archie Carr (Carr 1973) reflect the thinking of manyof us who study amphibians. Sadly, such melodic rhapsodies are under threat; this book setsout to argue that we cannot stand by while the frogs croak their last.REFERENCESAbdulali, H. 1985. On the export of frog legs from India. Journal of the Bombay Natural History Society82:347-375.Badio, B., Garraffo, H.M., Spande, T.F. and Daly, J.W. 1994. Epibatidine: discovery and definition as a potentanalgesic and nicotinic agonist. Medicinal Chemistry Research 4:440-448Bailey, L.L., Simons, T.R. and Pollock, K.H. 2003. Estimating site occupancy and species detection probabilityparameters for terrestrial salamanders. Ecological Applications 14(3):692-702.Bailey, L.L., Simons, T.R. and Pollock, K.H. 2004a. Comparing population size estimators for plethodontidsalamanders. Journal of Herpetology 38(3):370-380.Bailey, L.L., Simons, T.R. and Pollock, K.H. 2004b. Estimating detection probability parameters forPlethodon salamanders using the robust capture–recapture design. Journal of Wildlife Management68(1):1-13.Bailey, L.L., Simons, T.R. and Pollock, K.H. 2004c. Spatial and temporal variation in detection probabilityof plethodontid salamanders using the robust capture-recapture design. Journal of Wildlife Management68(1):14-24.Blaustein, A.R. and Wake, D.B. 1995. The puzzle of declining amphibian populations. Scientific American272:52-57.
Chapter 2. Why Save <strong>Amphibian</strong>s? 27Brandes, T.S., Naskrecki, P. and Figueroa, H.K. 2006. Using image processing to detect and classify narrowbandcricket and frog calls. Journal of the Acoustical Society of America 120(5):2950-2957.Briggs, R. and King, T.J. 1952. Transplantation of living nuclei from blastula cells into enucleated frogs’ eggs.Proceedings of the National Academy of Sciences of the United States of America 38:455-463.Carr, A. 1973. The Everglades. Time-Life Books, New York, USA.Clarke, B.T. 1997. The natural history of amphibian skin secretions, their normal functioning andpotential medical applications. Biological Reviews of the Cambridge Philosophical Society72(3):365-79.Crouch, W.B. and Paton, P.W.C. 2002. Assessing the use of call surveys to monitor breeding anurans inRhode Island. Journal of Herpetology 36:185-192.Daly, J.W. 1995. The chemistry of poisons in amphibian skin. Proceedings of the National Academy ofSciences 92:9-13.DeGarady, C.J. and Halbrook, R.S. 2006. Using anurans as bioindicators of PCB contaminated streams.Journal of Herpetology 40(1):127-130.Dodd, K.C. 1997. Imperiled amphibians: A historical perspective. In: G. Benz and D. Collins (eds.), AquaticFauna in Peril: The Southeastern Perspective. Special Publication 1, pp. 165-200. Southeast AquaticResearch Institute, Lenz Design & Communications, Decataur, Georgia, USA.Fagotti, A., Morosi, L., Di Rosa, I., Clarioni, R., Simoncelli, F., Pascolini, R., Pellegrino, R., Guex, G.-D. andHotz, H. 2005. Bioaccumulation of organochlorine pesticides in frogs of the Rana esculenta complexin central Italy. Amphibia-Reptilia 26:93-104.FAO Fishery Information, Data and Statistics Unit (FAO-FIDI). c2004. Collation, analysis and dissemination ofglobal and regional fishery statistics. FI Programme Websites. FAO - Rome. Updated Thu Jan 11 16:07:34CET 2007. Available via FIGIS from: http://www.fao.org/figis/servlet/static?dom=org&xml=FIDI_STAT_org.xml [Accessed Feb 27 2007].FAO Inland Water Resources and Aquaculture Service (FIRI). c2005- .Flores Nava, A. Cultured Aquatic SpeciesInformation Programme - Rana catesbeiana. Cultured Aquatic Species Fact Sheets. FAO - Rome.Updated Mon Oct 09 09:58:52 CEST 2006 Available via FIGIS from http://www.fao.org/figis/servlet/static?dom=culturespecies&xml=Rana_catesbeiana.xml [Accessed Oct 24 2006].Fei, L., Hu, S.Q. and Huang, Y.Z. 2006. Fauna Sinica. Amphibia I. Science Press, Beijing, China.Gergits, W.F. and Jaeger, R.G. 1990. Site attachment by the red-backed salamander, Plethodon cinereus.Journal of Herpetology 24:91-93.Gibbons, J.W., Winne, C.T., Scott, D.E., Willson, J.D., Glaudas, X., Andrews, K.M., Todd, B.D., Fedewa,L.A., Wilkinson, L., Tsaliagos, R.N., Harper, S.J., Greene, J.L., Tuberville, T.D., Metts, B.S., Dorcas, M.E.,Nestor, J.P., Young, C.A., Akre, T., Reed, R.N., Buhlmann, K.A., Norman, J., Croshaw, D.A., Hagen, C.and Rothermel, B.B. 2006. Remarkable <strong>Amphibian</strong> Biomass and Abundance in an Isolated Wetland:Implications for Wetland Conservation. Conservation Biology 20(5):1457-1465.Gibbs, E.L., Nace, G.W. and Emmons, M.B. 1971. The live frog is almost dead. BioScience 21:1027-1034.Goris, R.C. and Maeda, N. 2004. Guide to the amphibians and reptiles of Japan. Kreiger PublishingCompany, Malabar, Florida, USA.Gorzula, S. 1996. The trade in Dendrobatid frogs from 1987 to 1993. Herpetological Review 27(3):116-123.Gurdon, J.B. 1962. The developmental capacity of nuclei taken from intestinal epithelium cells of feedingtadpoles. Journal of Embryology and Experimental Morphology 34:93-112.Gurdon, J.B. and Hopwood, N. 2000. The introduction of Xenopus laevis into developmental biology:of empire, pregnancy testing and ribosomal genes. International Journal of Developmental Biology44:43-50.Hall, R.J., Ashton, R.E. Jr., and Prouty, R.M. 1985. Pesticide and PCB residues in the Neuse River waterdog,Necturus lewisi. Brimleyana 10:107-109.Harfenist, A., Power, T., Clark, K.L., Peakall, D.B. 1989. A review and evaluation of the amphibian toxicologicalliterature. Technical Report Series, no. 61, Canadian Wildlife Service.Hofrichter, R (ed.) 2000. The Encyclopedia of <strong>Amphibian</strong>s. Key Porter Books Limited, Toronto, Canada.Jennings, M.R. and Hayes, M.P. 1985. Pre-1900 Overharvest of California Red-legged Frogs (Rana auroradraytonii): The inducement for Bullfrog (Rana catesbeiana) introduction. Herpetologica 41(1):94-103.Jensen, J.B. and Camp, C.D. 2003. Human exploitation of amphibians: direct and indirect impacts. In:R.D. Semlitsch (ed.), <strong>Amphibian</strong> Conservation. pp. 199-213. Smithsonian Institution, WashingtonD.C., USA.Kiesecker, J.M., Blaustein, A.R. and Miller, C.L. 2001. Potential mechanisms underlying the displacementof native red-legged frogs by introduced bullfrogs. Ecology 82:1964-1970.Kinzie, M.B., Larsen, V.A., Burch, J.B. and Boker, S.M. 1996. Frog dissection via the World-Wide Web:Implications for the widespread delivery of instruction. Educational Technology Research and Development44(2):59-69.Kusrini, M.D. and Alford, R.A. 2006. Indonesia’s exports of frogs’ legs. Traffic Bulletin 21(1):13-24.Lanza, B. and Ferri, V. 1997. Rana catesbeiana Shaw, 1802. In: J.P. Gasc, A. Cabela, J. Crnobrnja-Isailovic,D. Dolmen, K. Grossenbacher, P. Haffner, J. Lescure, H. Martens, J.P. Martínez Rica, H. Maurin, M.E.Oliveira, T.S. Sofianidou, M. Veith and A. Zuiderwijk (eds.), Atlas of <strong>Amphibian</strong>s and Reptiles inEurope, pp. 132-133. Societas Europaea Herpetologica and Museum National d’Histoire Naturelle(IEGB/SPN), Paris, France.Lau, M.W.N., Ades, G., Goodyer, N. and Zou, F.S. 1995. Wildlife Trade in Southern China including HongKong and Macao. Report to Biodiversity Working <strong>Group</strong> of China Council for International Cooperationon Environment and Development Projects, Available at: http://monkey.ioz.ac.cn/bwg-cciced/english/bwg-cciced/tech-27.htm (Accessed February 1st 2007).Lehr, E. 2000. Zur Nutzung einiger Amphibien- und Reptilienarten in Peru. Reptilia 5:40-46.Lehr, E. 2005. The Telmatobius and Batrachophrynus species of Peru. Asociación Herpetológica Española,Monografías de Herpetología 7:39-64.Lever, C. 2003. Naturalised Reptiles and <strong>Amphibian</strong>s of the World. Oxford University Press, UK.Liner, E.A. 2005. The Culinary Herpetologist (2 nd Edition). Bibliomania! Salt Lake City, USA.Ljubisavljevic, K., Dzukic, G. and Kalezic, M. 2003. Green frogs are greatly endangered in Serbia andMontenegro. Froglog 58.Mazzoni, R., Cunningham, A.A., Daszak, P., Apolo, A., Perdomo, E. and Speranza, G. 2003. Emerging pathogenof wild amphibians in frogs (Rana catesbeiana) farmed for international trade. Emerging InfectiousDiseases 9(8):995-998. Available from: URL: http://www.cdc.gov/ncidod/EID/vol9no8/03-0030.htm.McCauley, D.J. 2006a. Selling out on nature. Nature 443:27-28.McCauley, D.J. 2006b. Nature: McCauley replies. Nature 443:750.Middlekoop, M.J., Watts, T. and Schorr, M. 1999. Acid mine drainage and its effects on physicochemicalconditions and salamander populations in a Cumberland Plateau stream. Journal of the TennesseeAcademy of Sciences 73:36.Miller, D.F. and Wiltberger, P.B. 1949. Some peculiarities of the male frog test for early pregnancy. TheOhio Journal of Science 48(3):89-94.Myers, C.W. and Daly, J.W. 1983. Dart-Poison Frogs. Scientific America 248(2):120-131.Neher, E. and Sakmann, B. 1976. Single-channel currents recorded from membrane of denervated frogmuscle fibres. Nature 260:799-802.Niekisch, M. 1986. The international trade of frogs’ legs. Traffic Bulletin 8:7-10.Nguyen Quang Truong, 2000. <strong>Amphibian</strong> uses in Vietnam. Froglog 38Oza, G.M. 1990. Ecological effects of the frog’s leg trade. Environmentalist 10:39-41.Pandian, T.J. and Marian, M.P. 1986. Production and utilization of frogs: and ecological view. Proceedingsof the Indian Academy of Science (Anim. Sci.) 95(3):289-301.Pariyanonth, P. and Daorerk, V. 1995. Frog farming in Thailand. INFOFISH International 3:25-28.Pechmann, J.H.K., Scott, D.E., Semlitsch, R.D., Caldwell, J.P., Vitt, L.J. and Gibbons, J. 1991. Decliningamphibian populations: The problem of separating human impacts from natural fluctuations. Science253(5022):892-895.Philippe, G. and Angenot, L. 2005. Recent developments in the field of arrow and dart poisons. Journal ofEthnopharmacology 100:85-91.Pough, F.H. 1983. <strong>Amphibian</strong>s and reptiles as low energy systems. In: W.P. Aspey and S.I. Lustick (eds.),Behavioral Energetics: The Cost of Survival in Vertebrates, pp. 141-188. Ohio State University Press,Columbus, Ohio, USA.Pukala,T.L., Bowie, J.H., Maselli, V.M., Musgrave, I.F., and Tyler, M.J. 2006. Host-defence peptides from theglandular secretions of amphibians: structure and activity. Natural Product Reports 23:368-393.Rabau, E. and Szeinberg, A. 1959. The practical value of the frog test in the diagnosis of normal andpathological pregnancy. Journal of Clinical Pathology 12:268-271.Rabemananjara, F.C.E., Raminosoa, N.R., Ramilijaona, O.R., Andreone, F., Bora, P., Carpenter, A.I., Glaw,F., Razafindrabe, T., Vallan, D, Vieites, D.R. And Vences, M. in press. Malagasy poison frogs in thepet trade: a survey of levels of exploitation of species in the genus Mantella. <strong>Amphibian</strong> and ReptileConservation 5(1): in press.Rodríguez, L. and Myers, C.W. 1993. A new poison frog from Manu National Park, southeastern Peru(Dendrobatidae, Epipedobates). American Museum Novitates 3068:1-15.Rollins-Smith, L.A., Carey, C., Longcore, J., Doersam, J.K., Boutte, A., Bruzgal, J.E. and Conlon, J.M. 2002.Activity of antimicrobial skin peptides from ranid frogs against Batrachochytrium dendrobatidis, thechytrid fungus associated with global amphibian declines. Developmental and Comparative Immunology26:471-479Rollins-Smith, L.A., Carey, C., Conlon, J.M., Reinert, L.K., Doersam, J.K., Bergman, T., Silberring, J.,Lankinen, H. and Wade, D. 2003. Activities of Temporin family peptides against the chytrid fungus(Batrachochytridium dendrobatidis) associated with global amphibian declines. Antimicrobial Agentsand Chemotherapy 47(3):1157-1160.Rollins-Smith, L.A., King, J.D., Nielen, P.F., Sonnevend, A., and Conlon, J.M. 2005a. An antimicrobial peptidefrom the skin secretions of the mountain chicken frog Leptodactylus fallax (Anura: Leptodactylidae).Regulatory Peptides 124:173-178.Rollins-Smith, L.A., Reinert, L.K., O’Leary, C.J., Houston, L.E. and Woodhams, D.C. 2005b. Antimicrobialpeptide defenses in amphibian skin. Integrative and Comparative Biology 45:137-142.Rueda-Almonacid, J.V. 2000. Status and threats produced by the introduction of the bullfrog inColumbia. Revista de la academia Colombiana de ciencias exactas fisicas y naturales. 23 supplement:367-393.Saporito, R.A., Garraffo, H.M., Donnelly, M.A., Edwards, A.L., Longino, J.T. and Daly, J.W. 2004. Formicineants: An arthropod source for the pumiliotoxin alkaloids of dendrobatid poison frogs. Proceedings ofthe National Academy of Sciences 101(21):8045-8050Schlaepfer, M.A., Hoover, C. and Dodd Jr, C.K. 2005. Challenges in evaluating the impact of the trade inamphibians and reptiles on wild populations. BioScience 55(3):256-264.Smith, B.P., Tyler, M.J., Kaneko, T., Garraffo, H.M., Spande, T.F. and Daly, J.W. 2002. Evidence for Biosynthesisof Pseudophrynamine Alkaloids by an Australian Myobatrachid Frog (Pseudophryne) and for Sequestrationof Dietary Pumiliotoxins. Journal of Natural Products 65:439-447.Smith, M.A. and Green, D.M. 2005. Dispersal and the metapopulation paradigm in amphibian ecology andconservation: are all amphibian populations metapopulations? Ecography 28:110-128.Smith, S.Q. and Jones, T. 2004. Tracking the cryptic pumiliotoxins. Proceedings of the National Academyof Sciences 101:7841-7842.Southerland, M.T., Jung, R.E., Baxter, D.P., Chellman, I.C., Mercurio, G., Vølstad J.H. 2004. Stream salamandersas indicators of stream quality in Maryland, USA. Applied Herpetology 2:23-46.Stebbins, R.C. and Cohen, N.W. 1995. A Natural History of <strong>Amphibian</strong>s. Princeton University Press,Princeton, New Jersey, USA.Stewart, M.M. and Rand, A.S. 1991. Vocalizations and the defense of retreat sites by male and femalefrogs, Eleutherodactylus coqui. Copeia 1991:1013-1024.Szilárd, N. and Csengele, K. 2001. <strong>Amphibian</strong> harvesting in Romania. Froglog 44.Török, Z. 2003. Action plan for sustainable exploitation of Rana ridibunda stocks from the Danube DeltaBiosphere Reserve (Romania). Froglog 60.Tyler, M., Shearman, D., Franco, R., O’Brien, P. Seamark, R. and Kelly, R. 1983. Inhibition of gastric acidsecretion in the Gastric Brooding Frog, Rheobatrachus silus. Science 220:609-610.VanCompernolle, S.E., Taylor, R.J., Oswald-Richter, K., Jiang, J., Youree, B.E., Bowie, J.H., Tyler, M.J., Conlon,J.M., Wade, D., Aiken, C., Dermody, T.S., KewalRamani, V.N., Rollins-Smith, L.A. and Unutmaz, D. 2005.Antimicrobial peptides from amphibian skin potently inhibit Human Immunodeficiency Virus infectionand transfer of virus from dendritic cells to T cells. Journal of Virology 79(18):11598-11606.Vitt, L.J., Caldwell, J.P., Wilbur, H.M. and Smith, D.C. 1990. <strong>Amphibian</strong>s as harbingers of decay. Bioscience40:418.Welsh, H.H. and Droege, S. 2001. A case for using plethodontid salamanders for monitoring biodiversityand ecosystem integrity of North American forests. Conservation Biology 15(3):558-569.Welsh, H.H., Jr. and Ollivier, L.M. 1998. Stream amphibians as indicators of ecosystem stress: a case studyfrom California’s redwoods. Ecological Applications 8(4):1118-1132.Whiles, M.R., Lips, K.R., Pringle, C.M., Kilham, S.S., Bixby, R.J., Brenes, R., Connelly, S., Colon-Gaud,J.C., Hunte-Brown, M., Huryn, A.D., Montgomery, C. and Peterson, S. 2006. The effects of amphibianpopulation declines on the structure and function of Neotropical stream ecosystems. Frontiers inEcology 4(1):27-34.Wilmut, I., Schnieke, A.E., McWhir, J., Kind, A.J., Campbell and K.H.S. 1997. Viable offspring derived fromfetal and adult mammalian cells. Nature 385:810-813.Ye, C.-Y, Fei, L. and Hu, S.-Q. 1993. Rare and Economic <strong>Amphibian</strong>s of China. Sichuan Publishing House ofScience and Technology, Chengdu, China. [In Chinese]Endnotes1 Although it is unclear what percentage of thesewere cultivated, the species is commonly farmedin Thailand and most are suspected to haveoriginated from farms (Pariyanonth and Daorerk1995; P.P. van Dijk pers. comm.).2 In China, the use of amphibians in traditionalmedicine was documented to at least 1500 yearsago (Fei et al. 2006).3 This represents the total number of only the threemost frequently traded species identified as beingprimarily imported for the pet trade: Hymenochiruscurtipes (2,376,647 animals); Cynops orientalis(1,635,362 animals); and Bombina orientalis(1,016,579 animals). In addition to this total,large numbers of poorly documented amphibiansentered the US during the same period (presumablymany of which were destined for the pettrade); there were seven families for which morethan 100,000 individuals entered the US with nospecies-specific identification (Schlaepfer et al.2005). Approximately 500,000 amphibians witha primary trade purpose as pets were reportedlyexported from the United States during the sameperiod of 1998-2002 (Schlaepfer et al. 2005).4 This includes the 2001 decision by the EuropeanCommission to halt trade in all Mantella species(with the exception of the widespread Mantellabetsileo), artificially inflating the percentage of themarket being dominated by the United States.5 In 1987 only 1.2% of the animals traded werereported to be captive-bred, by 1993, 39% ofanimals in trade were captive-bred.6 This study therefore indicates that not all amphibiantaxa are of equivalent quality in termsof providing an accurate and precise measureof ecosystem health, but that plethodontids maybe overall superior indicators in North Americanforests.7 The numbers reported by Gibbs et al. (1971) areconsidered by some to be overstated by severalmagnitudes; it is possible that frogs collectedprimarily for food were also included within thesetotals (D.E. James pers. comm.).8 Carolina Biological Supply Company reports thatthere has been no news from collectors of declinesin numbers of frogs harvested from the wild fordissection, including those populations withinthe main collecting areas of southwest Texas andMexico (D.E. James pers. comm.).9 The oocyte can also be induced to produce manymore times the number of channels than the cellsfrom the original organism would have done, andthis, coupled with the fact that the oocyte is comparativelylarge and easy to use, makes Xenopusoocytes a very powerful system for conductingpatch clamp experiments.<strong>Amphibian</strong>s have an amazing diversity ofcolours, body shapes and calls. The jewel-likeMantella frogs of Madagascar, such as Baron’sMantella Mantella baroni (Least Concern), areamong the world’s most colourful animal species.© Frank Glaw & Miguel Vences
CHAPTER 3. THE GLOBAL AMPHIBIAN ASSESSMENT (GAA):HISTORY, OBJECTIVES AND METHODOLOGYJanice Chanson, Simon Stuart, Neil Cox, Bruce Young and Michael Hoffmannfar more widespread and severe than would be expected under natural conditions (Poundset al. 1997). This evidence, in addition to many further reports of declines in the 1990s(Laurance et al. 1996; Lips 1998; Lynch and Grant 1998; Houlahan et al. 2000; Young et al.2001), convinced most herpetologists that non-random and severe declines were takingplace in the populations of many amphibian species.THE INITIATION OF THE GAA AND ITS OBJECTIVESParticipants at the China and the Koreas GAAworkshop in Chengdu, China, in March 2002.The lack of a comprehensive global picture on the extent and severity of amphibian declinesprompted IUCN, in partnership with Conservation International and NatureServe, to undertakethe Global <strong>Amphibian</strong> Assessment (GAA), which commenced in 2001. The over-arching goalof the GAA was to stimulate concerted and well-targeted activities to halt the current waveof amphibian extinctions, through the development of an information baseline on amphibianstatus and conservation needs. The initial objectives of the GAA included:• Identification of the most threatened amphibian species, using the IUCN Red List Categoriesand Criteria (see Appendix I) to determine which species were in need of urgentconservation action.• Identification of the most important geographic regions and habitats that need to beconserved in order to prevent further amphibian extinctions.• Identification of the most important threats to amphibians globally, specifically thoseresulting in rapid declines, and to propose both mitigating measures and prioritizedconservation actions for these.• Comparing the conservation needs for amphibians with those for mammals and birds,thus making it possible to determine the extent to which conservation initiatives canefficiently and simultaneously address the needs of all of these species’ groups.• Increasing and building the capacity of the IUCN Species Survival Commission expertnetwork for amphibians, thereby allowing scientists to coordinate their conservationactivities at the global level, and providing a base of expertise from which informationcollected during the GAA could be regularly updated.To meet these ambitious objectives the GAA had to develop a sound methodology bywhich it could engage the scientific community and gather data on the distribution, abundance,population trends, habitat requirements, and threats for all of the ~6,000 describedspecies of amphibians.Participants at the Southeast Asia GAA workshopin Bangkok, Thailand, in September-October 2002.Participants at the Mesoamerica GAA workshopin La Selva, Costa Rica, in November2002.BACKGROUNDWhile there have always been some instances of localized amphibian declines, often inresponse to changes in the local environment, scientists had started to become increasinglyconcerned about the possibility of widespread and severe population declines when theymet during 1989 at the First World Congress of Herpetology. A review of historical datasuggested that significant amphibian declines had begun as early as the 1970s in the westernUnited States, Puerto Rico and north-eastern Australia (Czechura and Ingram 1990; KagariseSherman and Morton 1993; Drost and Fellers 1996; Burrowes et al. 2004).Subsequent reports from field sites revealed the true severity of the population declines.At one site in Costa Rica, 40% of the amphibian fauna had disappeared over a short period inthe late 1980s (Pounds et al. 1997). In addition, sudden disappearances of montane specieshad also been simultaneously noted elsewhere in Costa Rica, and in Ecuador, and Venezuela(Pounds and Crump 1994; Pounds et al. 1997; Young et al. 2001; Ron et al. 2003). In someregions, the declines were taking place in seemingly pristine habitats (Czechura and Ingram1990; Kagarise Sherman and Morton 1993; Pounds and Crump 1994; Drost and Fellers 1996;Pounds et al. 1997; Young et al. 2001; Ron et al. 2003; Burrowes et al. 2004).Some scientists were initially skeptical about the reports; amphibian populations werealready well known to sometimes fluctuate widely from year to year (Pechmann and Wilbur1994). However, by using statistical tests and models, it was shown that the declines wereMETHODOLOGYThe GAA process involved three core phases of data compilation: initial data collection;data review; and data correction and consistency check.The task of collecting the initial data was divided into 33 geographic regions (AppendixII) that were defined to cover the global distribution of all amphibians. A network of regionalcoordinators – scientists with a broad knowledge of the region’s amphibian species – werethen identified and given the responsibility of collecting data on the amphibians within theirregion. During the initial data collection phase, regional coordinators were asked to producedistribution maps of each species’ current geographic range, which were then digitized in ageographic information system (ArcView 3.x). These maps are most often in a standardizedform of polygons that join known point localities.In addition to range maps, coordinators provided general information on habitat requirements,population status, major threats and conservation measures for each species, andwere also asked to make use of the IUCN Classification Schemes for coding up Countries ofOccurrence, Habitat Preferences, Major Threats, Conservation Measures, and Utilization 1 .Finally, regional coordinators were asked to provide a provisional Red List assessment of theconservation status of each species by applying the IUCN Red List Categories and Criteria(Appendix I; and see later).Once the initial data had been collected, they were subjected to a process of peer review.More than 500 amphibian specialists and experts from over 60 countries participated in thisprocess. The means of undertaking reviews varied from region to region, but in most cases(usually the more species-rich regions) the process was handled through expert workshops.However, in other regions, peer-review of data was managed through individual review byleading herpetologists. The following GAA workshops have been held to date:• Australia – Hobart, Tasmania, 6-8 February 2001.• China and the Koreas – Chengdu, China, 18-21 March 2002.• Sub-Saharan Africa – Watamu, Kenya, 16-18 April 2002.• South Asia – Coimbatore, India, 1-5 July 2002.• Southeast Asia – Bangkok, Thailand, 30 September – 4 October 2002.• Mesoamerica (Mexico south through Panama) – La Selva, Costa Rica, 11-15 November2002.• The Papuan Region – Hawaii, United States, 24-27 February 2003.• Tropical South America East of the Andes (merging the Amazonian Brazil, AtlanticForest-Cerrado-Caatinga, Paraguay, and Guianas regions, and parts of the Colombia,Ecuador, Peru, Bolivia and Venezuela regions) – Belo Horizonte, Brazil, 31 March – 4April 2003.• Tropical Andes (merging the remaining parts of the Venezuela, Colombia, Ecuador, Peru,and Bolivia regions) – Tandayapa, Ecuador, 18-22 August 2003.• Madagascar – Gland, Switzerland, 22-25 September 2003.• Chile – Concepción, Chile, 3-4 October 2003.• Argentina and Uruguay – Puerto Madryn, Argentina, 12-14 October 2003.• Caecilians (the only taxonomic rather than geographically based workshop) – London,23-25 February 2004.• Caribbean – Santo Domingo, Dominican Republic, 19-21 March 2004.• Mediterranean – Malaga, Spain, 13-17 December 2004.Data review has been completed by correspondence with amphibian experts in thefollowing regions: Northern Eurasia; Seychelles Islands; Japan; Australia (a continuationof the initial data collection workshop); New Zealand; West Asia; North America; Europe;and North Africa.
Chapter 3. The Global <strong>Amphibian</strong> Assessment (GAA): History, Objectives and Methodology 31Following the review process, the GAA coordinating team undertook a final review of allthe data to ensure that there had been a consistent approach in the collection and qualityof the data between the different regions and taxonomic groups (members of the GAAcoordinating team also attended all of the workshops to help promote consistent approachesduring the review process). To the extent possible within the constraints of time and budget,when significant problems or uncertainties were encountered in the data, the coordinatingteam contacted the experts who contributed information about the species to ensure thatany changes were correctly made, or information clarified, in order to ensure accurateand consistent conservation status assessments for each individual species. However, itis the GAA coordinating team, not the individual data providers, that takes responsibilityfor the content of each species account. The data providers are listed as “assessors” oneach species account, but because of the limitations in time and funding, they have not allbeen given the opportunity to sign off on the content of each account to which their nameis attached as an “assessor”.DATA LIMITATIONS AND CAVEATSTaxonomyAs already noted under the introductory chapter, the taxonomic framework used for theGlobal <strong>Amphibian</strong> Assessment follows Frost (2004). Regional coordinators were initiallyasked to follow the systematic arrangement provided in Version 2.2 of <strong>Amphibian</strong> Speciesof the World (2000), and were only permitted to depart from this classification in a fewwell-justified circumstances. The GAA has continued to follow revisions to the ASW up toVersion 3.0 (Frost 2004). The significant changes given in the most recent update of theASW are discussed in the introductory chapter.Distribution mapsParticipants at the Papuan region GAA workshop in Hawaii, United States, in February 2003.The GAA process has endeavored to produce maps for all of the ~6,000 amphibian species;however, in a very few instances (~100) it has been impossible to produce a meaningfulmap, mostly for species that are currently known only from non-specific type localities. Themaps are in the form of polygons that join known locations. A species’ distribution map canconsist of more than one polygon where there is an obvious discontinuity in suitable habitat.Data attached to each polygon include presence (e.g., extant, extirpated) and origin (native,introduced, reintroduced). In some cases, polygons were clipped to geographical features,such as rivers, or elevational contours.IUCN Red List Categories and CriteriaThe IUCN Red List of Threatened Species 2 (hereafter referred to as the Red List) is theaccepted standard for species global threat status (Lamoreux et al. 2003; Rodrigues etal. 2006). The identification of threatened species is of great importance to biodiversityconservation, since it enables practitioners to target those species known to be at highestrisk of extinction. The first Red List assessments were largely subjective and qualitative,and primarily focused on a few hand-picked species. However, in 1994, IUCN introduceda system of categorical rankings employing quantitative criteria and representing severaladvances, including: enabling consistent application by different people, being based arounda probabilistic assessment of extinction risk, the incorporation of a time-scale, and the abilityto handle uncertainty. The adoption in 2001 of the most recent version of the categoriesand criteria (IUCN 2001; Appendix I), has enabled considerable improvement of the rigor,justification, and transparency of Red List assessments.Despite the development of objective criteria, consistency and subjectivity in the applicationof these remains an issue. The Red List criteria are designed to handle uncertainty, forexample uncertainties in population size or trends and distribution (Akçakaya et al. 2000),but when there is inadequate information to make an assessment of extinction risk, thecategory Data Deficient must be used. In the course of undertaking a Red List assessment,there is a risk that errors will be introduced, specifically errors of omission (a species thatis genuinely threatened is included in a non-threatened category, such as Data Deficientor Least Concern) and commission (a species that is not genuinely threatened is classedin a threatened category). The attitudes of assessors to such risk and uncertainty rangealong a spectrum from evidentiary (demanding substantial evidence of threatened statusbefore allowing such a classification) to precautionary (allowing a species to be listed ina non-threatened category only if there is strong evidence that it is not threatened). For awell-known species with extensive quantitative data, the effects of the assessors’ attitudeson listings are generally small. However, when the level of uncertainty is high, attitudes caneasily cause the observed discrepancies. Assessors with strongly precautionary attitudesare concerned mainly about omission errors, whereas assessors with strongly evidentiaryattitudes are concerned mainly about commission errors. Seeking to minimize the risk of onetype of error inevitably increases the risk of the other type. IUCN is concerned about bothtypes of error and, therefore, seeks to find a balance between the extremes. The purposeof the consistency check was to help ensure that the Red List category selected for eachspecies reflected this balance.Improved training in the use of the Red List criteria, particularly at a regional level, andassessor awareness of issues relating to criteria application can help ensure consistency andminimize discrepancies between the global IUCN Red List and national Red Lists.Brazilian speciesFor 113 species endemic to Brazil, it was not possible to reach agreement on the Red Listcategory between the GAA Coordinating Team and the experts on the species in Brazil (AppendixXIII). The Red List category for the individual species listed in this book are thosethat were agreed at the GAA Brazil workshop in April 2003. However, in the subsequentconsistency check conducted by the GAA Coordinating Team, many of these were found tobe inconsistent with the approach adopted elsewhere in the world. It is these consistent RedList categories that are used in the actual analyses presented in the introductory chaptersof this book, and in Appendix V; the consistent categories are presented as footnotes in thespecies accounts in the book, where relevant.Underlying dataThe data upon which the analyses in this book are based, and the content presented in theindividual species accounts that comprise the bulk of this work, are essentially the sameas the information contained within the 2007 IUCN Red List of Threatened Species. Anyspecies described or revalidated after 31 December 2005, is not included. In addition, anyinformation that was published before that date but which was only made available to theGAA Coordinating Team after that date, is also not included here (and, as already noted,the overarching taxonomic classification follows Frost 2004). However, the informationpresented in the species accounts has been fully edited for content and style, and a numberof corrections have been made usually to correct inconsistencies in data or obvious dataerrors. In a few exceptional instances, we have introduced footnotes, where we feel itis necessary to draw attention to important recent findings (for example, rediscovery ofConraua derooi in West Africa).Rapidly Declining SpeciesIn view of the rapid changes that are taking places in the status of amphibian species inmany parts of the world, the GAA Coordinating Team attempted to define a group of speciesas “rapidly declining”, based on an estimate of the likely IUCN Red List status of eachspecies in 1980. Drawing on the data in the 2004 and 2006 IUCN Red List assessments, inparticular on information on population trends, habitat decline trends, threatening processesand conservation actions, one member of the GAA Team (Simon Stuart) determined thelikely Red List category for each species in 1980. This was estimated conservatively, withthe default position being that no change had occurred unless there was strong evidence.Small changes in status were not considered to be sufficient to allow Red List categorychange. Changes in category were generally related to dramatic changes in the status ofthe species. Examples include: the disappearance of most, or all, of the population dueto disease or poorly understood processes; a catastrophic decline due to over-harvesting;or severe habitat loss (especially for species that are not tolerant of habitat disturbance).Back-calculating of Red List categories has previously been done for birds in order to detectgenuine trends in status over time, though this has only been done from 1994 back to 1988(BirdLife International 2004).<strong>Amphibian</strong>s that moved to a higher Red List threat category between 1980 and 2006were defined as “rapidly declining” species. The assignment of individual species to the“rapidly declining” group clearly requires further review. However, for broad multi-speciesgeographic analyses, the results give what seems to be a reliable overall picture of thepatterns of amphibian declines.Participants at the Tropical South America Eastof the Andes region GAA workshop in BeloHorizonte, Brazil, in March-April 2003.
32Threatened <strong>Amphibian</strong>s of the WorldParticipants at the Chile GAA workshop in Concepción, Chile in October 2003.Participants at the Tropical Andes region GAA workshop in Tandayapa, Ecuador, in August 2003.Participants at the Caribbean GAA workshop in Santo Domingo, Dominican Republic, in March 2004.Participants at the Southern Cone GAA workshop in Puerto Madryn, Argentina, in October 2003.Endnotes1 http://www.iucnredlist.org/info/authority_files andhttp://www.iucn.org/themes/ssc/sis/authority.htm2 www.iucnredlist.orgREFERENCESAkçakaya, H.R., Ferson, S., Burgman, M.A., Keith, D.A., Mace, G.M. and Todd, C.R. 2000. Making ConsistentIUCN Classifications under Uncertainty. Conservation Biology 14:1001-1013.BirdLife International. 2004. State of the World’s Birds: Indicators for our Changing World. BirdLifeInternational, Cambridge, UK.Burrowes, P.A., Joglar, R.L. and Green, D.E. 2004. Potential causes for amphibian declines in Puerto Rico.Herpetologica 60:141-154.Czechura, G.V. and Ingram, G. 1990. Taudactylus diurnus and the case of the disappearing frogs. Memoirsof the Queensland Museum 29:361-365.Drost, C.A. and Fellers, G.M. 1996. Collapse of a regional frog fauna in the Yosemite area of the SierraNevada. Conservation Biology 10:414-425.Frost, D.R. 2004. <strong>Amphibian</strong> Species of the World: an Online Reference. Version 3.0 (22 August, 2004).Electronic Database accessible at http://research.amnh.org/herpetology/amphibia/index.html. AmericanMuseum of Natural History, New York, USA.Houlahan, J.E., Findlay, C.S., Schmidt, B.R., Meyer, A.H. and Kuzmin, S.L. 2000. Quantitative evidence forglobal amphibian population declines. Nature 404:752-755.Kagarise Sherman, C. and Morton, M.L. 1993. Population declines of Yosemite toads in the eastern SierraNevada of California. Journal of Herpetology 27:186-198.Lamoreux, J., Akçakaya, R., Bennun, L., Collar, N.J., Boitani, L., Brackett, D., Bräutigam, A., Brooks, T.M.,Fonseca, G.A.B., Mittermeier, R.A., Rylands, A.B., Gärdenfors, U., Hilton-Taylor, C., Mace, G., Stein, B.A.,and Stuart, S. 2003. Value of the IUCN Red List. Trends in Ecology and Evolution 18:214-215.Laurance, W. F., McDonald, K.R. and Speare, R. 1996. Epidemic disease and the catastrophic decline ofAustralian rain forest frogs. Conservation Biology 10:406-413.Lips, K.R. 1998. Decline of a tropical montane amphibian fauna. Conservation Biology 12:106-117.Lynch, J.D. and Grant, T. 1998. Dying frogs in western Colombia: catastrophe or trivial observation? Revistade la Academia Colombiana de Ciencias Exactas, Físicas y Naturales 23:149-152.Pechmann, J.H.K. and Wilbur, H.M. 1994. Putting declining amphibian populations in perspective: naturalfluctuations and human impacts. Herpetologica 50:65-84.Pounds, J.A., Fogden, M.P.L., Savage, J.M. and Gorman, G.C. 1997. Tests of null models for amphibiandeclines on a tropical mountain. Conservation Biology 11:1307-1322.Pounds, J.A. and Crump, M.I. 1994. <strong>Amphibian</strong> declines and climate disturbance: the case of the goldentoad and the harlequin frog. Conservation Biology 8:72-85.Rodrigues, A.S.L., Pilgrim, J.D., Lamoreux, J.L., Hoffmann, M. and Brooks, T.M. 2006. The value of the RedList for conservation. Trends in Ecology and Evolution 21:71-76.Ron, S.R., Duellman, W.E., Coloma, L.A. and Bustamante, M.R. 2003. Population decline of the Jambato ToadAtelopus ignescens (Anura: Bufonidae) in the Andes of Ecuador. Journal of Herpetology 37:116-126.Young, B.E., Lips, K.R., Reaser, J.K., Ibanez, R., Salas, A.W., Cedeno, J. R., Coloma, L.A., Ron, S., La Marca,E., Meyer, J.R., Munoz, A., Bolanos, F., Chavez, G. and Romo, D. 2001. Population declines and prioritiesfor amphibian conservation in Latin America. Conservation Biology 15:1213-1223.
CHAPTER 4. THE STATE OF THE WORLD’S AMPHIBIANSJanice Chanson, Michael Hoffmann, Neil Cox and Simon StuartDuring the course of the 20 th Century the global human population increased from 1.65 billionto 6 billion people. In April 2005, the United Nations launched the results of the MillenniumEcosystem Assessment 1 , a four-year effort involving 1,360 scientists from 95 countriesthat aimed to determine more precisely how a burgeoning human population is impactingthe planet’s biodiversity and ecosystem services, and, conversely, how those changes areaffecting human well-being. According to the Millennium Ecosystem Assessment, theworld’s population doubled between 1960 and 2000, while the global economy gre six-folsover the same time-period. Perhaps not surprisingly then, over the past 50 years, humanshave changed the planet’s ecosystems more rapidly and more extensively than in any othercomparable period of time in human history, largely to meet rapidly growing demands forfood, fresh water, timber, fibre, and fuel. The most important direct drivers of change inecosystems are habitat change, overexploitation, invasive alien species, pollution, andclimate change (Millennium Ecosystem Assessment 2005).Many of the dramatic findings of the Millennium Ecosystem Assessment are tellingindictments of the anthropogenic influences that a rapidly technologically evolving humansociety has brought to bear on earth’s natural resources. More land was converted to croplandin the 30 years after 1950 than in the 150 years between 1700 and 1850. Cultivatedsystems (areas where at least 30% of the landscape is in croplands, shifting cultivation,confined livestock production, or freshwater aquaculture) now cover one-quarter of Earth’sterrestrial surface. In the last 20 years, some regions have experienced very high rates offorest loss, particularly in the tropics: in Central America, Amazonia, the Congo Basin, theforests of eastern Madagascar, and south-east Asia (mainly in lowland regions), and it isprojected that a further 10-20% of grassland and forestland will be converted between2000 and 2050 (primarily to agriculture). More than two-thirds of the area of two of theworld’s 14 major terrestrial biomes and more than half of the area of four other biomes hadbeen converted by 1990, primarily to agriculture. The amount of water impounded behinddams quadrupled since 1960, and three to six times as much water is held in reservoirsas in natural rivers; most water use (70% worldwide) is for agriculture. Since 1750, theatmospheric concentration of carbon dioxide has increased by about 32% (from about 280to 376 parts per million in 2003), primarily due to the combustion of fossil fuels and landuse changes. Approximately 60% of that increase (60 parts per million) has taken placesince 1959 (Millennium Ecosystem Assessment 2005).From a human welfare perspective, such dramatic changes are of primary importancebecause of the direct linkages between ecosystems and the essential provisioning, regulatingand cultural services that they provide to humanity. That such changes already are havinga dramatic effect on human society is undeniable. We already know, for example, that theimpacts of the massive Tsunami that struck Aceh province in Indonesia on December 26,2004, could have been significantly less were it not for the loss of coastal mangroves andoffshore coral reef systems (e.g., Marris 2005). Similarly, the aftermath of Hurricane Katrina,which devastated the Gulf Coast of the United States, and in particular the city of NewOrleans, may rekindle interest in bolstering the wetlands south of New Orleans to providemore of a barrier to future hurricanes (Travis 2005).Unfortunately, these same aforementioned drivers of change are leading to a significant,irreversible loss of Earth’s biodiversity – the very foundation upon which these ecosystemservices are built. Although some species respond positively to anthropogenic pressures,the great majority show only limited tolerance of the increasingly widespread and rapidchanges impacting ecosystems worldwide. There is already ample evidence that currentspecies extinction rates are 100-1,000 times higher than the normal rate of extinction (Pimmet al. 1995; Baillie et al. 2004). At least in the last 500 years alone, nearly 800 documentedextinctions have occurred, clearly an underestimate since this figure is based only on thosespecies actually known to have gone extinct within this time frame (Baillie et al. 2004).And, at least one recent study suggests that we could lose at least three times this numberof species within just a few decades (Ricketts et al. 2005).The Global <strong>Amphibian</strong> Assessment is the first-ever attempt to undertake a comprehensiveassessment of the conservation status of the world’s ~6,000 amphibian species. Only 124threatened amphibians appeared on the 1996 IUCN Red List (Baillie and Groombridge 1996),and only a few more were added to this number in the 2000 IUCN Red List (Hilton-Taylor2000). Other than amphibians, only two other vertebrate Classes have been globally andcomprehensively assessed: mammals were assessed globally for the first time in 1996(Baillie and Groombridge 1996), and, at the time of writing, are the focus of a massive revisionthrough the IUCN-led Global Mammal Assessment; birds, on the other hand, a Classof ~10,000 species, have been assessed globally four times since 1988 (most recently in2004), with a fifth major global assessment planned for completion in 2008.A comprehensive assessment of this nature permits us a clear picture of the stateand distribution of global biodiversity. However, of greatest interest, particularly amongamphibians, is the opportunity it presents to investigate the causes of the marked and rapiddeclines and disappearances that have been observed in amphibian populations the worldover, especially those populations that have vanished in seemingly pristine habitats whereapparent environmental degradation or anthropogenic impacts are low.GLOBAL CONSERVATION STATUSThe GAA undertook risk assessments for 5,915 amphibian species 2 , categorizing one-thirdof all extant species (1,893 out of 5,881) as threatened with extinction 3 (Figure 1). This isnoticeably higher compared with other groups that have been globally and comprehensivelyassessed, specifically mammals (23%) and birds (12%) (Baillie et al. 2004). Not only areamphibians more threatened than mammals or birds, but they also have a higher proportionof species on the verge of extinction. Some 21% of amphibians are classed in thecategories Critically Endangered or Endangered, compared with 10.5% of mammals and5.4% of birds. Worryingly, it seems increasingly certain that this high level of threat is asignificant underestimate of the true threat status of the class, since there is currently insufficientinformation available to assess the conservation status of 23% of amphibians (thesespecies are placed in the category Data Deficient). These poorly known species (a numberof which have only recently been described), are often rare and have small distributions,and with the availability of more information, particularly on threats, may warrant listingin a threatened category. Although the assessment revealed that 44% of amphibian speciesare currently not considered to be globally threatened (these are species listed in thecategories Near Threatened and Least Concern), the populations of most of these speciesare still decreasing, albeit not currently at a rate sufficient to meet the criteria for listing ina higher category of threat (see later).A total of 34 species 4 are listed as officially Extinct 5 ; 19 of these species are from SriLanka 6 (see Figure 2; and see Essay 4.1). One species, the Wyoming Toad, Bufo baxteri, isconsidered Extinct in the Wild, since the surviving wild population persists only due to annualreleases of thousands of captive-reared toadlets (see Essay 11.7). Furthermore, within thecategory Critically Endangered, 130 of the 455 species are flagged as being Possibly Extinct(see Appendix IX). These typically are species that have not been seen for an extended periodof time, but for which there is still some lagging hope that they may yet be hanging on intheir native habitat (see Butchart et al. 2006).CONSERVATION STATUS BY CRITERIAIn order for a species to qualify for one of the three threatened Red List categories (CR,EN, VU), it must satisfy one or more of the five Red List criteria: A: Population reduction;B: Geographic range size and decline; C: Small population size and decline; D: Very smallor restricted population; and E. Quantitative analysis of the probability of extinction (seeAppendix I). By summarizing across species the criteria that trigger the Red List categories,Red List CategoryNumber of speciesin categoryA % of category B % of speciesin categoryRed List Category Number of speciesExtinct (EX) 34Extinct in the Wild (EW) 1Critically Endangered (CR) 455Endangered (EN) 768Vulnerable (VU) 670Near Threatened (NT) 369Least Concern (LC) 2,236Data Deficient (DD) 1,382Total Number of Species 5,915Figure 1. Summary of Red List categoriesfor all amphibian species. The percentageof species in each category is given in thepie chart above.Figure 2. The distribution of Extinct (n=34) and Extinct in the Wild (n=1; Bufo baxteri) amphibians (since 1500). Numbers correspond as follows:1-19 – Philautus malcolmsmithi, Adenomus kandianus, Nannophrys guentheri, Philautus adspersus, Philautus eximius, Philautus hypomelas,Philautus leucorhinus, Philautus nasutus, Philautus temporalis, Philautus variabilis, Philautus oxyrhynchus, Philautus halyi, Philautus dimbullae,Philautus nanus, Philautus rugatus, Philautus extirpo, Philautus stellatus, Philautus zal, Philautus zimmeri; 20 – Philautus travancorius;21 – Rheobatrachus vitellinus; 22-23 – Rheobatrachus silus, Taudactylus diurnus; 24 – Cynops wolterstorffi; 25 – Discoglossus nigriventer;26 – Plethodon ainsworthi; 27 – Rana fisheri; 28 – Bufo baxteri; 29 – Eleutherodactylus milesi; 30 – Eleutherodactylus chrysozetetes; 31 – Bufoperiglenes; 32 – Atelopus vogli; 33-34 – Atelopus longirostris, Atelopus ignescens; 35 – Phrynomedusa fimbriata.C % of category D % of categoryCritically Endangered (CR) 455 189 42 316 69 8 2 5 1Endangered (EN) 768 50 7 730 95 4 1 2 0.3Vulnerable (VU) 670 36 5 463 69 1 0.1 177 26Table 1. A summary of the Red List criteria triggering each Red List category. No amphibians are listed under Criterion E, as quantitative analysisof extinction risk requires considerably more data over longer time periods than is usually available for threatened amphibians.23%38%1%8%13%6%11%One of four small families of amphibians atrisk of extinction, the Leiopelmatidae of NewZealand is represented by only four species,including Leiopelma hochstetteri (Vulnerable)from North Island, which is at possible riskfrom the chytrid fungus. © Paddy Ryan
34Threatened <strong>Amphibian</strong>s of the WorldOrder/Family Total EX EW CR EN VU NT LC DD Numberthreatened% Threatenedor ExtinctAnuraAllophrynidae 1 0 0 0 0 0 0 1 0 0 0Arthroleptidae 51 0 0 3 9 2 3 18 16 14 27Ascaphidae 2 0 0 0 0 0 0 2 0 0 0Astylosternidae 29 0 0 2 11 8 2 5 1 21 72*Bombinatoridae 10 0 0 0 1 4 0 5 0 5 50Brachycephalidae 8 0 0 0 0 1 1 1 5 1 13Bufonidae 476 5 1 85 71 52 26 171 65 214 45*Caeciliidae 113 0 0 1 1 1 0 41 69 3 3*Centrolenidae 138 0 0 6 16 29 10 28 49 51 37Dendrobatidae 234 0 0 20 29 16 14 58 97 65 28Discoglossidae 12 1 0 0 0 2 4 5 0 3 25Heleophrynidae 6 0 0 2 0 0 0 4 0 2 33Hemisotidae 9 0 0 0 0 1 0 4 4 1 11Hylidae 804 1 0 71 64 47 27 431 163 183 23*Hyperoliidae 253 0 0 1 19 29 17 133 54 49 19*Leiopelmatidae 4 0 0 1 1 2 0 0 0 4 100Leptodactylidae 1,238 2 0 145 247 172 61 351 260 566 46*Limnodynastidae 50 0 0 1 7 2 1 37 2 10 20Mantellidae 158 0 0 7 12 16 12 77 34 35 22*Megophryidae 128 0 0 3 14 27 13 40 31 44 34Microhylidae 430 0 0 6 27 39 18 177 163 72 17*Myobatrachidae 71 1 0 6 2 4 3 49 6 13 18*Nasikabatrachidae 1 0 0 0 1 0 0 0 0 1 100Pelobatidae 4 0 0 0 1 0 1 2 0 1 25Pelodytidae 3 0 0 0 0 0 0 3 0 0 0Petropedetidae 102 0 0 3 13 8 10 39 29 24 24Pipidae 30 0 0 1 2 0 1 21 5 3 10*Ranidae 666 2 0 19 61 82 60 295 147 164 25*Rhacophoridae 274 18 0 17 50 33 26 64 66 118 43*Rheobatrachidae 2 2 0 0 0 0 0 0 0 2 100Rhinodermatidae 2 0 0 1 0 1 0 0 0 2 100Rhinophrynidae 1 0 0 0 0 0 0 1 0 0 0Scaphiopodidae 7 0 0 0 0 0 1 6 0 0 0Sooglossidae 4 0 0 0 0 4 0 0 0 4 100TOTAL ANURA 5,208 32 1 400 658 581 311 2,028 1,197 1,672 32CaudataAmbystomatidae 30 0 0 9 2 2 1 13 3 13 43Amphiumidae 3 0 0 0 0 0 1 2 0 0 0Cryptobranchidae 3 0 0 1 0 0 2 0 0 1 33Dicamptodontidae 4 0 0 0 0 0 1 3 0 0 0Hynobiidae 46 0 0 5 10 12 2 11 6 27 59*Plethodontidae 365 1 0 36 82 58 37 91 60 177 48*Proteidae 6 0 0 0 1 1 1 3 0 2 33Rhyacotritonidae 4 0 0 0 0 1 2 1 0 1 25Salamandridae 70 1 0 3 14 12 11 27 2 30 43Sirenidae 4 0 0 0 0 0 0 4 0 0 0TOTAL CAUDATA 535 2 0 54 109 86 58 155 71 251 47*GymnophionaIchthyophiidae 39 0 0 0 0 2 0 5 32 2 5*Rhinatrematidae 9 0 0 0 0 0 0 4 5 0 0Scolecomorphidae 6 0 0 0 0 0 0 3 3 0 0Uraeotyphlidae 5 0 0 0 0 0 0 0 5 0 0TOTAL GYMNOPHIONA 172 0 0 1 1 3 0 53 114 5 3*Table 2. Red List Status by Order and Family 8 . *The difference between these percentages and the percentages for amphibians as a wholewe can potentially obtain a better understanding of the factors driving species towardsextinction (Table 1) 7 .Among Critically Endangered amphibians, 42% of the species meet the criteria for thiscategory due to their having undergone a substantial population reduction (Criterion A), and69% of species meet the geographic range criterion (Criterion B). The majority of amphibiansthat are recognized as threatened on the basis of population reduction most often fall withinthe category of Critically Endangered, with 69% of species meeting Criterion A being withinthis highest category of threat. Very few amphibian species meet either Criteria C or D (theexception being Vulnerable species meeting Criterion D2; see Appendix X) as the informationnecessary to appropriately apply these criteria is usually not available. For most species, it isconsiderably easier to observe a decline in the population, or to make an educated inferenceof the range size, than it is to estimate the actual number of individuals.CONSERVATION STATUS ACROSS TAXAThere are significant differences among the three taxonomic Orders of amphibians in the totalnumber of species and conservation status (Table 2). The Anura (frogs and toads), by virtueof absolute numbers of species, greatly influence the average threat level for all amphibians,with 32% either globally threatened or extinct. The less species-rich Caudata (salamandersand newts) are significantly more threatened than the global average, with 47% of speciescurrently threatened or extinct. The smallest Order of amphibians, the Gymnophiona(caecilians), remain extremely poorly known, with two-thirds (66%) of caecilians currentlyassessed as Data Deficient. Only 3% of caecilians are known to be threatened.Significant variations in both the total number of species and threat status are alsoevident between the 48 amphibian families (Table 2). Very diverse families of frogs andtoads that are significantly more threatened than the global average include the Bufonidae,Leptodactylidae, and Rhacophoridae. Sadly, both species of the extraordinary Australianendemic family Rheobatrachidae (the gastric-brooding frogs) are now Extinct (see Essay 6.1).Four small families are at severe risk of disappearing altogether; the Leiopelmatidae of NewZealand, with all four species in the family threatened (see Essay 6.2); the Rhinodermatidaeof Chile and Argentina with two threatened species, one of which (Rhinoderma rufum) hasnot been recorded since the late 1970s; the Sooglossidae, all endemics of the Seychelles,and the monotypic family Nasikabatrachidae. Diverse families that are less threatened thanthe global average include Ranidae, Microhylidae, and Hyperoliidae. Among the three mostspecies-rich salamander families, Hynobiidae and Plethodontidae exhibit much higher levelsof threat than Salamandridae.CONSERVATION STATUS ACROSS BIOGEOGRAPHICREALMSBiogeographic realms are the eight continent-scale terrestrial and freshwater regionsdistinguished by characteristic biota that reflect shared evolutionary histories (Udvardy1975). We adapted the biogeographic realm classification of Olson et al. (2001) (Figure 3)to allocate species to one of six biogeographic realms 10 . These realms are broadly similarto the six zoogeographic realms employed by Duellman (1999) in his regional comparisonof amphibian distributions (see Fig 1:1 in Duellman 1999).The Neotropical Realm, which stretches from central Mexico south throughout SouthAmerica and includes all of the Caribbean Islands, is by far the leader in terms of overallspecies richness of amphibians, being home to almost half of the world’s amphibians, ofwhich 96% are endemic to the realm (Table 3). Two other realms have even higher levels ofendemism, the Australasian (99%) and Afrotropical (98%) realms. The relatively low levelof endemism in the Palaearctic is mainly due to the somewhat arbitrary border betweenthe Palaearctic and Indomalayan realms in China, and similarly the level of endemism inthe Nearctic is also reduced by the arbitrariness of the division of Mexico between theNearctic and Neotropical realms.The Neotropical Realm also has the greatest proportion of threatened and extinctspecies, having experienced significant habitat loss, and is home to many narrow rangeendemics, especially in the Andes and Mexico. It is also the region that has been hardesthit by chytridiomycosis. Although there are many species that are threatened or extinct asa result of habitat loss, disease and introduced species in Australia and New Zealand, thecontribution of the relatively unthreatened amphibians of the island of New Guinea resultsin the overall percentage of threatened species in the Australasian Realm being the lowestof all the regions, with only 13% and significantly less than the global average of 33%. TheAfrotropics, Nearctic, and the Palaearctic are also regions with significantly less threatenedspecies than the global average. In-depth syntheses of amphibian distributions in each ofthe six biogeographic realms are presented in <strong>Chapters</strong> 5-10.is statistically significant 9 Realm Total (endemics) % endemics EX EW CR EN VU NT LC DD Number threatened % Threatened or EXFigure 3. Biogeographic Realms adapted from Olson et al. (2001).SPECIES RICHNESS AND ENDEMISMNearly a decade has passed since the last major synthesis on the global distributionpatterns of amphibians (Duellman 1999). Prior to Duellman’s (1999) synthesis, the onlymajor contributions in the last 50 years that have taken a global perspective on amphibiandistributions are those of Savage (1973) and Duellman and Trueb (1986). There have, ofcourse, been many treatises focusing on regional distribution patterns on continents, suchas Central America (Savage 1982), China (Zhao and Adler 1993) and Europe (Gasc 1997),as well as island faunas, such as the Caribbean (Hedges 1996) and the Philippines (Inger1954). However, Duellman’s publication was the first to attempt a major synthesis of theglobal distribution patterns of amphibians, describing differences and similarities amongcontinents, major islands and archipelagos, and discussing the implications of these patternsof distribution relative to conservation.Table 3. Red List status in each biogeographicregion. *includes OceaniaAfrotropical 969 (954) 98 0 0 33 107 100 53 467 209 240 25*Australasian* 544 (538) 99 3 0 16 21 29 10 287 178 69 13*Indomalayan 999 (800) 80 20 0 32 134 143 104 311 255 329 33Nearctic 337 (230) 68 2 1 10 24 46 40 189 25 83 25*Neotropical 2,916 (2,808) 96 7 0 358 456 324 140 956 675 1,145 39*Palaearctic 468 (260) 56 2 0 13 40 58 48 245 62 113 24*
Chapter 4. The State of the World’s <strong>Amphibian</strong>s 35Leptopelis vermiculatus (Vulnerable) is a range-restricted species endemic to severalmountain blocks in the Eastern Arc chain of Tanzania, including the East and West Usambaras,Nguu, Udzungwa, Poroto and Mount Rungwe. Around two-thirds of amphibians havedistribution ranges less than 50,000km 2 . © Maik DobieyOne of the major advances of the GAA process is the collection of high resolution spatialdata that allow us to undertake analyses that expand considerably upon the work andconclusions of these aforementioned earlier assessments, making comparisons possibleacross both broad geographic regions and political units. Importantly, we can make thesecomparisons across threatened species. Such an analysis of extent of occurrence data hasnot previously been possible for amphibians beyond that of a single continent (e.g., Brookset al. 2001). It is also possible to compare these maps to human demographic data to gaina better understanding of the challenges faced by amphibians in an increasingly humandominated world (See Essay 4.2).Figure 4. Global species richness for amphibians, with dark red colours corresponding to higher richness. Colour scale based on 10 quantileclasses. Maximum richness equals 144 species.GEOGRAPHIC PATTERNS OF SPECIES RICHNESSAND ENDEMISMThe most obvious pattern to emerge from an analysis of the overlay of all species distributionsis visual evidence that the tropics hold much higher species richness than do temperateregions (Figure 4). This is further supported by a summary of the number of species ineach five-degree latitudinal band, which shows that species richness is much higher in thetropics than is to be expected based on area alone, and peaks around the equator (Baillieet al. 2004; Mace et al. 2005).Areas of high global species richness among amphibians include Central America, theAndes and the Amazon Basin, the Atlantic forest of Brazil, the Upper Guinea forests ofWest Africa, the Afromontane regions of Africa (including the Albertine Rift, the highlandsof Cameroon, and the Eastern Arc Mountains), eastern Madagascar, the Western Ghats,and montane Southeast Asia. The only non-tropical area with high species richness is thesouth-eastern United States, which is the global centre for salamander diversity. Speciesrichness is lowest in arid regions, and there are no amphibians at all in the high latitudesof the northern hemisphere, central Asia, North Africa, south-central Australia, Antarctica,and most of New Zealand. Of course, this map must be interpreted with some cautionwhen considering the problem of uneven survey efforts around the world; regions such asIndonesia, New Guinea and the Congo Basin are especially likely to be under representedon this map due to lack of adequate surveys, although the overall pattern of species richnessdecreasing away from the poles holds true. Considering existing maps of species richnessamong mammals and birds, there is an obvious degree of congruence in patterns of overallspecies richness among these groups (Baillie et al. 2004; Mace et al. 2005).The global distribution of threatened amphibians (Figure 5) differs significantly from themap of overall species diversity. Major concentrations of threatened species are associatedwith insular systems (montane environments, islands), where there has been severe habitatloss and exposure to the fungal disease chytridiomycosis, including the sierras and transvolcanicbelt of Mexico, Central America, the tropical Andes, Brazil’s Atlantic Forest, theGreater Antilles, the Upper Guinea forests of West Africa, the forest of western Cameroonand eastern Nigeria, the Albertine Rift, the Eastern Arc Mountains of Tanzania and otherAfromontane outliers, the south-east coast of South Africa, Madagascar’s wet forests, theWestern Ghats and Sri Lanka, montane Southeast Asia, and eastern Australia. South andEast China also emerge quite strongly, although the pattern is driven to a large degree bythe formerly widespread, but now Critically Endangered, Chinese Giant Salamander.In contrast then to published richness maps of threatened mammals (Baillie et al. 2004;Grenyer et al. 2006) or birds (Baillie et al. 2004; BirdLife International 2004; Orme et al.2005; Grenyer et al. 2006), most of the world is devoid of threatened amphibians. It hasalready been established that there is a widespread correlation between a species’ rangesize and extinction risk (Purvis et al. 2000), and geographic range is inherent in the Red Listcriteria (see Appendix I). Since amphibians are largely sedentary species, their ranges tendto be much smaller than more mobile species, such as birds (Baillie et al. 2004). Threatenedamphibians are more likely to have small range sizes (Table 4) and tend to occur more denselyin smaller areas than either mammals or birds.Not only do most amphibians have small ranges, but these narrowly distributed speciestend to co-occur in ‘centres of endemism’ (Anderson 1994). These centres of endemism tendto lie across isolated or topographically varied regions, and show extreme concentration inthe tropics (Figure 6). This is the geographical manifestation of ‘Rapoport’s rule’ (Rapoport1982), which states that the mean latitude of a species’ range correlates with the species’range size, although the generality of this ‘rule’ has been questioned (Gaston 1999). Previousanalyses have already demonstrated the remarkable degree of overlap between centres ofendemism across birds, mammals and amphibians (Baillie et al. 2004).Figure 5. Richness map of threatened amphibian species, with dark red colours corresponding to higher richness. Colour scale based on 10quantile classes. Maximum richness equals 44 species.Order All species minus DD, EX and EW All threatened speciesMedian area (km 2 ) Number of species Median area (km 2 ) Number of speciesAnura 19,118 3,978 1,090 1,639Caudata 4,378 462 417 249Gymnophiona 33,224 58 44 5All species 16,794 4,498 976 1,893Table 4. Median range size of species in each amphibian Order. Only extant non-Data Deficient species with a range map are included inthe analysis 11 .SPECIES RICHNESS AND ENDEMISM WITHINCOUNTRIESAn important contribution of any analysis of geographic patterns of amphibian distributionsis reporting on the distribution of species by political units, specifically countries. ParticularlyFigure 6. Centres of endemism inhabited, respectively, by more than two overlapping species with global distributions of less than50,000km² 12 .
36Threatened <strong>Amphibian</strong>s of the WorldBrazilColombiaEcuadorPeruMexicoIndonesiaChinaJamaicaSeychellesMadagascarCubaAustraliaSri LankaJapanColombiaMexicoEcuadorBrazilChinaPeruGuatemalaHaitiDominicanRepublicJamaicaCubaPuerto RicoSri LankaGuatemalaMexicoVenezuelaPhilippinesVenezuelaUnited StatesSeychellesof AmericaPuerto RicoIndiaPhilippinesPapua NewUnited StatesGuineaof AmericaCosta RicaHondurasIndiaChileHondurasEcuadorMadagascarMexicoMadagascarChileAustraliaPapua NewGuineaPanamaJapanCongo, D.R.BoliviaMalaysiaCamerooonPanamaCosta RicaTanzaniaBrazilIndiaChinaHaitiVenezuelaColombiaTaiwan, Provinceof ChinaCameroonSri LankaUnited Statesof AmericaPhilippinesAustraliaCubaMalaysiaTurkeyCosta RicaColombiaPanamaEl SalvadorTaiwan, Provinceof ChinaTrinidadand Tobago0 200 400 600 800 100040 50 60 70 80 90 1000 50 100 150 200 2500 20 40 60 80 100Number of speciesPercentage of endemic speciesNumber of threatened speciesPercentage of species threatenedEndemics Non-endemicsEndemics Non-endemicsFigure 7 Figure 9 Figure 10 Figure 12Figure 7. The 20 most diverse countries foramphibians.Figure 9. The 20 countries with the highestpercentage of country endemics. Countrieswith less than 10 native species are excluded(NB. The totals for China include species inHong Kong and Macau).Figure 10. The 20 countries with the highestnumber of threatened amphibians.Figure 12. The 20 countries with the highestpercentage of threatened amphibians. Onlycountries with 10 or more native amphibiansare included.informative are the numbers of species endemic to each country, and especially the numbersof endemic threatened species, because they can guide a “doctrine of ultimate responsibility”for each nation to ensure the persistence of global biodiversity (Mittermeier et al. 1998).Although the number of threatened species per country provides a coarse measure of threatsto biodiversity, albeit heavily conflated by area (Balmford and Long 1995), dividing the numberof threatened species by total numbers of species per country does give a useful measure ofrelative threat to a nation’s biodiversity. Further, the presentation of threatened species occurrencesby country is also useful in providing a cross-check to national Red Lists, and vice versa(Hilton-Taylor et al. 2000; Rodriguez et al. 2000), given the important implications of these fornational conservation policy. A detailed summary for all countries is provided in Appendix V.When comparing amphibian richness amongst countries, Brazil, with 751 species currentlyrecognized, is first, followed closely by Colombia with 697 (Figure 7). These results need to beconsidered with some caution, particularly bearing in mind the relative level of survey effortin some countries. For example, both Colombia and Brazil have received extensive surveyefforts in recent decades, and although both countries can be expected to add significantlyto their totals (see Essay 9.5 and Essay 9.4, respectively), the level of increase is likely tobe less than in some of the other highly diverse countries such as Papua New Guinea orIndonesia. In South America, Peru in particular is relatively poorly sampled and is almostcertain to experience substantial increases in its number of recorded species, and couldeven surpass Ecuador. Nonetheless, the species richness in Ecuador is remarkable for acountry one-thirtieth the size of Brazil. Figure 8 provides an alternative illustration of therelative significance of each country in terms of amphibian diversity.The number and percentage of endemics within a country (Table 5 and Figure 9, respectively),gives a slightly different perspective on the importance of countries in amphibianconservation. When looking at the number of country endemics, the first two countries,Brazil and Colombia, not surprisingly emerge yet again at the top of the list. Interestingly,Ecuador with the third largest number of amphibians is only 11 th in the list of percentage ofendemics, with only 36% of species endemic. To put some perspective on the contributionthese countries make to global amphibian species richness, the endemic species of the top10 countries account for 40% of the world’s amphibian species, and the top 20 for 56%.When considering the percentage of country endemics, it is perhaps not surprising to seethat the first nine countries listed are island states. Many of these have very small numbersof species, with the exception of Madagascar with 226 species currently described, only oneof which is not endemic to the country. Similarly, Australia with a total of 214 species has200 country endemics. The two countries with the highest number of endemics, Brazil andColombia, are only ranked 18th and 24th when looking at percentage of endemic species.Among countries with the highest number of threatened amphibians (Figure 10), there aresome apparent differences to the most species-rich countries listed in Figure 7, suggestingthat either amphibians in some countries are more susceptible to threats, or that threats varybetween countries, or that there are other factors influencing the distribution of threatenedspecies. Figure 11 illustrates the relative importance of each country to threatened amphibians.Colombia, the country with the second largest amphibian fauna, has the most threatenedspecies. The major threat to amphibians in Colombia is habitat loss, although there have alsobeen many as yet unexplained declines occurring (presumably due to chytridiomycosis). Thedramatic topography of the Andes means that many of the amphibians have very restrictedranges thus making them more vulnerable to threatening processes.Ranking of countries with the highest percentage of threatened species (Figure 12 is quitedifferent to the list of countries with the highest number of threatened species (Figure 10).The first five countries 13 with the highest percentage are all in the Caribbean, and over 70%of all the amphibians in these countries are threatened. Compared with other regions, theCaribbean region stands out with by far the highest percentage of threatened species. Mostnotable in this regard is Haiti, with 46 of the 50 species native to this country threatenedwith extinction, almost entirely due to rampant habitat loss.In Mexico, a country ranked fifth for species richness, but second in terms of number ofthreatened species, more than 50% of amphibians are threatened. Severe habitat loss is theoverwhelming threat to Mexican amphibians, but chytridiomycosis is also present.Figure 8. The world according to amphibians.The size of each country represents therelative proportion of the world’s amphibiansfound there. Map produced by VineetKatariya.
Chapter 4. The State of the World’s <strong>Amphibian</strong>s 37Ranking Country Native Native Endemic % endemics Number threatened Number threatenedendemics% SpeciesThreatened1 Brazil 751 489 65 110 106 152 Colombia 697 337 48 209 159 303 Mexico 363 246 68 198 162 554 Madagascar 226 225 99.6 55 55 245 Australia 214 200 93 47 47 226 United States of America 261 182 70 52 48 207 Peru 411 181 44 81 59 208 China 325 170 52 87 82 279 Papua New Guinea 244 164 67 10 8 410 Indonesia 347 161 46 33 23 1011 Ecuador 447 159 36 163 102 3612 Venezuela 298 155 52 69 62 2313 India 236 151 64 63 61 2714 Philippines 98 77 79 48 48 4915 Sri Lanka 83 67 81 52 51 6316 Tanzania 162 65 40 41 40 2517 Cuba 59 57 97 47 47 8018 Malaysia 203 56 28 47 34 2319 Cameroon 196 55 28 53 38 27=20 Bolivia 209 53 25 21 18 10=20 Congo, Democratic Republic of the 211 53 25 13 4 6Table 5. The 20 countries with the highestnumber of country endemics.HABITAT AND ECOLOGYHabitat PreferencesRecording the habitat preferences of species from a standardized classification scheme (seedocumentation on CD) is part of the required documentation in the Red List assessmentprocess. Almost 80% of amphibians are forest species (Table 6 and Figure 13) and 90% ofthese species (4,251 species), in turn, occur in tropical forests. Of all forest species, 36%are either threatened or extinct, and for those occurring in tropical forests the percentageof threatened or extinct species is slightly higher at 37%. However, montane forest species(very generally defined here as forest at altitudes above 1,000m asl) are much morelikely to be threatened than those occurring in lowland forest. This is probably becausemontane species are more likely to have restricted ranges and hence are more susceptibleto threatening processes, and also because chytridiomycosis appears to be having a muchgreater impact on species occurring at elevations above 1,000m asl.Only a small percentage of amphibians occur in relatively dry habitats such as aridand semi-arid habitats and savannah, 2% and 8%, respectively, and the percentages ofspecies in these habitats that are threatened are very low (9% and 3%, respectively). Thelack of species in these habitats is not surprising as amphibians are known to prefer moisthabitats. These drier habitats are also usually less varied topographically and are relativelyless impacted by anthropogenic disturbance, so it is to be expected that there will also befewer threatened species.Although amphibians are classically considered as leading ‘dual lives’, occurringin both land and water environments (hence the etymological origins of the word), infact only two-thirds of species (3,775) undergo a free-swimming larval developmentstage in which they are dependent on a freshwater habitat. Those species that arenot dependent on freshwater habitats are predominantly direct-developing species,which develop directly from eggs without a larval stage (see Chapter 1). It is the larvalstage of larval-developing species that most likely occurs within freshwater habitats.In Table 6, occurrence in freshwater is divided into three subgroups: still, flowing, orswamp/marsh. Flowing freshwater habitats for amphibians usually include streams,creeks or brooks; still freshwater habitats are often temporary rainpools or other smallpools of freshwater (favoured breeding sites for many explosive-breeding species).This distinction between freshwater habitats appears to have a significant influenceon the likelihood that a species is threatened. Of species that are associated withflowing water, 36% are currently threatened or extinct, whereas only 15% of speciesassociated with still water are currently threatened or extinct. This may be related toWhile almost 80% of amphibians are forestspecies, only two-thirds undergo a free-swimminglarval development stage in which theyare dependent on some freshwater habitat(like Atelopus varius pictured here). Speciesthat are not dependent on freshwater habitatsare predominantly direct-developing species,which develop directly from eggs without afree-living larval stage. © Twan LeendersFigure 11. The world according to threatenedamphibians. The size of each country representsthe relative proportion of the world’sthreatened amphibians found there. Mapproduced by Vineet Katariya.
38Threatened <strong>Amphibian</strong>s of the WorldTable 6. The habitat preferences for allamphibian species. “All tropical forest”encompasses both lowland and montanetropical forest.Figure 13. The number of species occurringin a particular habitat, and the percentage ofspecies occurring within each habitat thatare threatened.Habitat type All species % of allspeciesThreatenedor Extinctspecies% of allspecies inhabitat thatare threatenedor ExtinctForest 4,710 80 1,678 36All tropical forest 4,251 72 1,566 37Lowland tropical forest 2,849 48 807 28Montane tropical forest 2,507 42 1,142 46Savannah 484 8 13 3Grassland 987 17 217 22Shrubland 860 15 148 17Secondary terrestrial habitats 1,496 25 258 17Flowing freshwater 2,506 42 897 36Marsh/swamp 722 12 113 16Still open freshwater 1,793 30 275 15Arid and semi-arid habitats 94 2 8 9Number of speciesForestSavannahGrasslandShrublandSecondary terrestrial habitatsFlowing freshwaterMarsh/swampStill open freshwaterArid and semi-arid habitats0 1,500 3,000 4,500% of species in habitat that are threatened0 10 20 30Figure 14. Richness map of a) larval-developingamphibians; b) direct-developingamphibians; and c) live-bearing amphibians.Darker red colours correspond to regionsof higher richness. Colour scale based on10, 10 and 5 quantile classes, respectively.Maximum richness equals 127, 55 and 9 species,respectively.the likelihood of exposure to disease increasing in flowing water, as the water may beacting as a vector for disease.Reproductive ModesAs noted earlier (see Chapter 1), for the purposes of analysis in this book, amphibianreproductive modes have been combined into three general groups: larval developing– species that lay eggs, from which free-living larvae hatch; direct developing – speciesthat lay eggs in which the larvae develop and metamorphose prior to hatching; and livebearing– species in which the larvae develop inside the mother, with no eggs being laid(including viviparous and ovoviviparous species). By far the most common reproductivemode is larval development, with 4,004 species known or believed to use this mode.Direct development is also quite common, being present or strongly suspected in 1,742species, whereas there are only 58 known or suspected live-bearing species. There are111 species for which the reproductive mode remains completely unknown and cannotreadily be inferred from close relatives.The global distribution of larval-developing, direct-developing, and live-bearingamphibians is shown in Figure 14. The richness map of larval developers is very similarto the richness map for all amphibian species (Figure 4), which is not surprising consideringthat over two-thirds of amphibians are larval developers. The few regions that differsignificantly are the Caribbean; a region extending from southern Mexico south to Ecuadorand Venezuela; New Guinea; and the mountains of the eastern United States, which havevery few larval-developing species compared with overall species richness. Compared withlarval developers, direct developers occur in relatively few areas. The main concentrationsare in the Caribbean, the Andes of South America extending through Central America toa.b.c.southern Mexico, the Atlantic Forest of Brazil, New Guinea, Sri Lanka (see Essay 4.3), themountainous regions of the eastern United States, and the west coast of the United States.Lesser concentrations are also found in east and central Africa, Madagascar, the WesternGhats and the Philippines. The number and overall range of direct-developing species inthe Old World tropics is still greatly under-estimated, especially because large numbers ofspecies in the genera Philautus (Indomalayan) and Arthroleptis (Afrotropical) probably remainto be described. Live-bearing species are only found in a few places: the Amazon, CentralAmerica, Europe, West Africa, the Eastern Arc Mountains and West Asia.A map of the global distribution of all three reproductive modes (Figure 15) shows thatthe majority of the global range of amphibians is home only to larval-developing species.This is perhaps why most people think of amphibians as being freshwater, larval-developingspecies only, and are often surprised to hear of the existence of other remarkable reproduc-Family Larval-developing Direct-developing Live-bearing UnknownAnuraAllophrynidae 1 0 0 0Arthroleptidae 16 35 0 0Ascaphidae 2 0 0 0Astylosternidae 29 0 0 0Bombinatoridae 8 0 0 2Brachycephalidae 0 8 0 0Bufonidae 426 24 13 13Centrolenidae 138 0 0 0Dendrobatidae 232 2 0 0Discoglossidae 12 0 0 0Heleophrynidae 6 0 0 0Hemisotidae 9 0 0 0Hylidae 800 0 0 4Hyperoliidae 250 1 0 2Leiopelmatidae 0 4 0 0Leptodactylidae 394 836 1 7Limnodynastidae 50 0 0 0Mantellidae 125 20 0 13Megophryidae 128 0 0 0Microhylidae 192 233 0 5Myobatrachidae 63 8 0 0Nasikabatrachidae 1 0 0 0Pelobatidae 4 0 0 0Pelodytidae 3 0 0 0Petropedetidae 90 10 0 2Pipidae 25 3 0 2Ranidae 585 80 0 1Rhacophoridae 138 130 0 6Rheobatrachidae 0 2 0 0Rhinodermatidae 1 1 0 0Rhinophrynidae 1 0 0 0Scaphiopodidae 7 0 0 0Sooglossidae 1 3 0 0TOTAL ANURA 3,737 1,400 14 57CaudataAmbystomatidae 30 0 0 0Amphiumidae 3 0 0 0Cryptobranchidae 3 0 0 0Dicamptodontidae 4 0 0 0Hynobiidae 45 0 0 1Plethodontidae 50 315 0 0Proteidae 6 0 0 0Rhyacotritonidae 4 0 0 0Salamandridae 57 0 13 0Sirenidae 4 0 0 0TOTAL CAUDATA 206 315 13 1GymnophionaCaeciliidae 8 27 28 50Ichthyophiidae 39 0 0 0Rhinatrematidae 9 0 0 0Scolecomorphidae 0 0 3 3Uraeotyphlidae 5 0 0 0TOTAL GYMNOPHIONA 61 27 31 53TOTAL ALL AMPHIBIANS 4,004 1,742 58 111Table 7. Variation in reproductive mode between taxonomic Orders and Families.
Chapter 4. The State of the World’s <strong>Amphibian</strong>s 39Figure 15. Combined distribution of amphibianreproductive modes.Breeding StrategyLarval developers onlyDirect developers onlyLarval and direct developersLarval and live-bearingLarval, direct and live-bearingtive modes. Live-bearing species always occur sympatrically with larval-developing species,and sometimes with direct-developing species. The regions where all three reproductivemodes co-exist are the Amazon Basin, Colombia to southern Mexico, West and CentralAfrica, East Africa and north-central Italy and south-eastern France. Direct developers arethe only amphibians in New Zealand, Fiji, the Lesser Antilles, the Bahamas, Palau, theSolomon Islands and various small islands off New Guinea, but otherwise are always foundin areas inhabited by larval developers.The prevalence of the various reproductive modes varies between the different taxonomicOrders (Table 7). All three Orders have species representative of each reproductive mode.The most common strategy for frogs and toads is larval development (over 70% of species),and the most common strategy for salamanders and newts is direct development (59%).While the most common strategy for caecilians is larval development (35% of species), themajority (54%) of live-bearing species are caecilians. There is still very little known aboutmost caecilian species, and the reproductive mode for nearly one-third (30%) of caeciliansremains unknown.Larval development is a very common reproductive mode amongst amphibian families,and all but four families have some larval-developing species. The three anuran families,Brachycephalidae, Rheobatrachidae and Leiopelmatidae, contain direct-developing speciesonly, and the caecilian family Scolecomorphidae has three live-bearing species in one genus,and the reproductive mode for the three species in the other genus are unknown. Comparedwith larval development, direct development and live-bearing are reproductive modesrestricted to far fewer families. Only 19 families have species that are direct developers,and the overwhelming majority of these are within the anuran family Leptodactylidae, andin particular the largest amphibian genus Eleutherodactylus. Amongst other anuran families,slightly more than half of the microhylid species, and almost half of the rhacophorid speciesare direct developers. There is only one salamander family containing direct-developingspecies, Plethodontidae, and only one caecilian family, Caecilidae.Within the Caudata there are 13 live-bearing species all in the genera Salamandra andLyciasalamandra. There appear to be few live-bearing frog and toad species (14 species intotal), relative to the diversity of this Order. Most of these species, such as the CriticallyEndangered Kihansi Spray Toad Nectophrynoides asperginis and Golden Coqui Eleutherodactylusjasperi are ovoviviparous, with the equally highly threatened Nimbaphrynoidesliberiensis and Nimbaphrynoides occidentalis being the only truly viviparous anurans.The reproductive mode of a particular species is related to whether or not it is likelyto be threatened with extinction (Table 8). Amongst direct developers, 45% of species arecurrently threatened with extinction or are already extinct, which is considerably higher thanthe global average of 33%. Twenty-one of the 34 extinct amphibians were direct developers.Larval developers are relatively less threatened than the global average.The median range size of amphibians employing each of the three different reproductivemodes is summarized in Table 9. When considering all extant, non-Data Deficient species,the median for larval-developing species is much greater than that of direct-developingspecies. The much smaller range size of direct developers makes these species moresusceptible to habitat loss and other threats compared to larval developers. This mightpartly explain why direct-developing amphibians are proportionately more threatened thanlarval-developing amphibians.Major ThreatsAs part of the Global <strong>Amphibian</strong> Assessment, the major threats to all amphibians werecollated. Analyses of these data permit a quantitative perspective on the major causalmechanisms not only driving amphibians to extinction, but also allowing us some insightinto the threats that are driving amphibians most rapidly to extinction.Given the major finding of the Millennium Ecosystem Assessment that humans havechanged ecosystems more rapidly and extensively in the last 50 years than in any comparableperiod of time in human history, it is not surprising that habitat loss remains the numberone threat to amphibians globally, with two-thirds (63%) of species affected, of whichalmost nine out of every 10 species (87%) are threatened with extinction (Table 10; Figure16). These figures for threatened amphibians are comparable with those for threatenedbirds, where habitat loss and degradation affects 86% of species (BirdLife International2004). These results take on more meaning when one considers that nearly three-quartersof amphibians are inhabitants of tropical forest environments – the same habitats thatare subject to the highest rates of forest loss. The most common form of habitat loss isclearance for crops, followed very closely by extractive processes, such as logging (be itfor subsistence purposes or due to selective and/or clear-cutting 15 ), and urbanization andindustrial development (Table 10).But just how high are rates of forest loss? In Indonesia, the vast majority of forest losshas occurred over the last 30 years or so, mainly the result of commercial logging, followedby massive agricultural projects (particularly rubber, oil palm, industrial timber for pulp production,and so forth) and smallholder agriculture. One recent estimate alone indicates thatKalimantan’s protected lowland forests declined by 56% between 1985 and 2001 primarilydue to logging (Curran et al. 2004). Another study combining high-quality remote sensingapplications and extensive field surveys across an area of 1.17 million ha in south-westSumatra determined that the single largest contiguous area of forest standing across theirstudy area had been nearly halved in the space of three decades (692,850 ha to 344,409ha between 1972 and 2002), at an average rate per original forest cover of 1.69% per year(Gaveau et al. 2007). In Madagascar, rates of forest loss have been estimated at slightlyless than 1% per annum (Harper et al. 2007).One of the key consequences of habitat loss is habitat fragmentation. Decreasingpatch size and increasing isolation of patches results in an increased risk of demographic,stochastic and genetic events, thereby increasing extinction risk by reducing demographicand genetic input from immigrants (not to mention reducing the chance of recolonizationafter local extinction) (Cushman 2006). Connectivity is therefore important in the regionalviability of amphibian populations, being predominantly affected by means of juveniledispersal. However, in fragmented landscapes, the survival of dispersers is often lower thanrequired for population viability, and even species with limited dispersal abilities are likelyto be imperilled by habitat loss and fragmentation over longer time periods (see CushmanReproductive mode All species EX EW CR EN VU NT LC DD Number threatened or EX % Threatened or EXLarval-developing 4,004 11 1 266 412 410 262 1,775 867 1,100 27Direct-developing 1,742 23 0 176 337 249 106 418 433 785 45Live-bearing 58 0 0 7 9 4 1 18 19 20 34Unknown 111 0 0 6 10 7 0 25 63 23 21 Table 8. The Red List status of species withvarying reproductive modes.Reproductive mode All species (minus DD, EX and EW) All threatened speciesMedian area (km 2 ) Number of species Median area (km 2 ) Number of speciesLarval development 41,999 3,125 1,671 1,088Direct development 2,272 1,286 454 762Live-bearing 1,755 39 287 20Not known 12,264 48 713 23Total 16,794 4,498 976 1,893Table 9. Median range size for the differentreproductive modes employed by amphibians.Only extant non-Data Deficient species with arange map are included in the analysis 14 .
40Threatened <strong>Amphibian</strong>s of the WorldSpecies of the genus Lyciasalamandra, such asL. helverseni (Vulnerable) from the islands ofKarpathos and Kasos in Greece, are among theonly live-bearing salamanders, giving birth tofully developed young. © Jan van der VoortFigure 16. The major threats to amphibiansglobally.All habitat lossInvasive speciesUtilizationAccidental mortalityPersecution0 1,000 2,000 3,000 4,000Number of speciesThreatened species Non-threatened speciesMajor Threat All species % of all species Threatened species % of ThreatenedspeciesAll habitat loss 3,700 63 1,655 87Agriculture – Crops 2,588 44 1,227 65Agriculture – Tree Plantations 508 9 230 12Agriculture – Livestock 1,376 23 620 33Timber and other vegetation removal 2,529 43 1,169 62Urbanization and industrial development 2,106 36 945 50Invasive species 456 8 207 11Utilization 250 4 105 6Accidental mortality 47 1 22 1Persecution 3 0.05 1 0.05Pollution 1,122 19 544 29Natural disasters 220 4 128 7Disease 451 8 362 19Human disturbance 243 4 151 8Changes in native species dynamics (excluding disease) 16 0.3 4 0.2Fire 615 10 290 15Major Threat Anura % of Anurans Caudata % of Caudata Gymnophiona % of GymnophionaAll habitat loss 1,440 88 212 85 3 60Agriculture – Crops 1,092 67 132 53 3 60Agriculture – Tree Plantations 209 13 21 8 0 0Agriculture – Livestock 560 34 60 24 0 0Timber and other vegetation removal 1,013 62 155 62 1 20Urbanization and industrial development 799 49 146 59 0 0Invasive species 186 11 19 8 2 40Utilization 72 4 33 13 0 0Accidental mortality 18 1 4 2 0 0Persecution 0 0 1 0.4 0 0Pollution 479 29 62 25 3 60Natural disasters 97 6 30 12 1 20Disease 343 21 19 8 0 0Human disturbance 129 8 22 9 0 0Changes in native species dynamics3 0.2 1 0.4 0 0(excluding disease)Fire 220 13 68 27 2 40PollutionNatural disastersDiseaseHuman disturbanceChanges in native sp. dynamicsTable 10. The major threats to amphibians globally. Only present threats to species are tallied. “All species” excludes Extinct species.Table 11. The major threats to threatened amphibians globally in each amphibian Order. Only present threats to species are tallied.Fire2006 for review). Among those amphibians currently listed as threatened, 45% are affectedby severe fragmentation of their habitat, particularly in regions such as the Western Ghatsand Sri Lanka, the Philippines, the coastal forests of Eastern Africa, and the Atlantic Forestof Brazil (C. Boyd et al. unpubl.).The second most significant threat to amphibians is pollution, affecting around one-fifth(19%) of species, and 29% of threatened species. These percentages are much higher thanthose recorded for mammals or birds (4% and 12%, respectively; Baillie et al. 2004), probablydue to the fact that a high proportion of amphibians are aquatic. Among the over-ridingcauses of increasing pollution is the increasing use of agrochemicals (fertilizers, herbicides,fungicides, pesticides), especially in developing countries; other types of pollution includethe discharge of industrial wastes into waterways, acid precipitation, and atmosphericpollution that results in thinning of the ozone layer and increased ultra-violet (UV) radiation.Most studies investigating the effects of pollutants and contaminants on amphibianshave focused on physiology (e.g., disruption of the endocrine system; Hayes et al. 2002),behaviour (e.g., changes in activity patterns; Bridges 1997), and morphology (specifically,morphological anomalies, such as ectromelia, apody or syndactyly; Oullet et al. 1997 16 ).Although a foreboding body of evidence suggests that pollutants and contaminants cancompromise amphibian communities (see Essay 4.4), the relative contribution of contaminantsto declines remains unclear. However, at least one recent study has demonstrated acorrelation between population declines and chemicals carried by winds from agriculturein California (Davidson et al. 2002) 17 .Although disease appears to be a relatively less significant threat for amphibians, forthose species affected it can cause sudden and dramatic population declines and disappearances(see Essay 4.5). That disease is operating in synergy with global climate changeis now also strongly supported, with evidence suggesting that recent trends toward warmernights and increased daytime cloud cover have created optimum conditions for the chytridfungus, Batrachochytrium dendrobatidis, at mid-elevation sites (1,000-2,400m asl), whichis where the preponderance of amphibian extinctions and disappearances have occurred(Pounds et al. 2006; and see Essay 4.6). In comparison, although habitat loss and degradationaffect a much greater number of species, the rate at which species decline is usuallymuch slower, and there are a number of strategies, such as the establishment of protectedareas, available to counter this threat.MAJOR THREATS ACROSS TAXAThe significance of a threatening process is influenced by a species’ ability to adapt to thisprocess. Some species are more able to adapt to certain threats than others; for example, speciesthat are able to persist, or even thrive, in degraded habitats are much less affected by habitat lossthan species that breed only in bromeliads. Comparing major threats to threatened species acrosstaxonomic groups (Table 11) can potentially provide some insight into how susceptible particulargroups of species are to certain threatening processes. Caution is needed in interpreting theseresults, given the uneven global distribution of both threats and biodiversity. Hence, it is notalways possible to separate whether a particular taxonomic group is more or less susceptibleto a threatening process, or whether exposure to threats is influencing these figures.Across all the Orders, habitat loss is still overwhelmingly the most significant threat.For frogs and toads, and salamanders and newts, habitat loss affects around three timesmore species than the next most significant threat, pollution. Disease is the third mostsignificant threat to frogs and toads, but only seventh in level of significance for salamandersand newts. Disease is almost three times more prevalent amongst threatened frogs andtoads than salamanders and newts. To date, there have been no recorded incidences ofdisease amongst caecilians.Looking at other major threats, utilization affects proportionally three times morethreatened salamanders and newts, than frogs and toads, suggesting that salamandersand newts appear to be relatively more susceptible to utilization (particularly for humanconsumption and for the international pet trade). Salamanders and newts on average have amuch longer generation length than the frogs and toads; in the Critically Endangered ChineseGiant Salamander, a species that has been subject to extensive exploitation (see Essay 4.7),it takes two months for the eggs to hatch after fertilization. Hence the effect of removing anindividual from a wild population is likely to have a more significant impact.When comparing the different types of habitat loss affecting threatened amphibians, frogsand toads are most significantly impacted by habitat loss for agricultural crops, followedclosely by vegetation removal (mostly logging) and infrastructure development (mainly forhuman settlement) (Table 11). The relative significance of different types of habitat loss isslightly different for salamanders and newts, with vegetation removal affecting the mostspecies, followed closely by infrastructure development and agricultural crops.By comparing major threats to threatened species across taxonomic families it is possibleto get a finer scale understanding of the variation in the significance of different threats tospecies (Table 12). Such an analysis can also assist species conservation by highlightinggroups of species which are more or less likely to be impacted by particular threats. Forexample, 36% of threatened bufonids are affected by disease, compared with only 19% ofall threatened species. It can be predicted that bufonids in any newly infected region wouldtherefore have a high probability of being impacted by the disease.Not surprisingly, across almost all families habitat loss affects the greatest proportionof species. The only exceptions are the families Caeciliidae, Leiopelmatidae and Sooglossidae.Two of the three threatened species in the family Caeciliidae, and all of the speciesin the Sooglossidae, are endemic to the Seychelles Islands and are listed on the basis oftheir restricted range with a major threat being invasive species. Similarly, the four specieswithin the Leiopelmatidae are all endemic to New Zealand and are also threatenedby invasive species. When looking at the families most affected by invasive species, it isisland endemics (for example, the Mantellidae of Madagascar and the leptodactylids ofthe Caribbean) that are most affected. While many threatened amphibians are impacted byinvasive alien species, some amphibians themselves can also be invasive, and in so doingbecome a threat in their own right (see Essay 4.8).Pollution, the second most significant threat to all amphibians, also affects a significantnumber of species in almost all families, with no families in particular appearing to be moresusceptible to this threat than others.The incidence of disease, the third most significant threat to all threatened species, doesseem to vary across families. Disease is only recorded in 15 of the 36 families containingthreatened species, and in particular there are 10 families containing a higher proportionof species affected than the global average of 19%. These families are Leiopelmatidae(100%), Rhinodermatidae (100%), Discoglossidae (50%), Myobatrachidae (58%), Hylidae(51%), Bufonidae (36%), Dendrobatidae (28%), Leptodactylidae (21%), Centrolenidae (20%),and Limnodynastidae (20%). Of the 362 threatened species affected by disease, 286 (79%)of them are found in just three of these families: Leptodactylidae (118 species), Hylidae (93species), and Bufonidae (75 species).
Chapter 4. The State of the World’s <strong>Amphibian</strong>s 41FamilyNumber of All habitat loss Invasive species Utilization Accidentalthreatenedmortalityspecies in familyPersecution Pollution NaturaldisastersDiseaseHumandisturbanceChanges in nativesp. dynamics(ex. disease)AnuraArthroleptidae 14 13 0 0 0 0 1 0 0 0 0 1Astylosternidae 21 21 0 1 0 0 4 0 0 0 0 1Bombinatoridae 5 5 0 0 5 0 3 1 0 1 0 0Brachycephalidae 1 1 0 0 0 0 0 0 0 0 0 0Bufonidae 208 167 21 3 0 0 79 13 75 14 1 31Centrolenidae 51 48 8 0 0 0 29 4 10 4 0 4Dendrobatidae 65 57 12 9 0 0 27 3 18 1 0 4Discoglossidae 2 2 1 0 0 0 0 1 1 0 0 0Heleophrynidae 2 2 2 0 0 0 1 0 0 1 0 2Hemisotidae 1 1 1 0 0 0 0 0 0 0 0 0Hylidae 182 169 21 4 1 0 66 18 93 16 0 30Hyperoliidae 49 47 3 0 0 0 2 1 0 0 1 5Leiopelmatidae 4 2 4 0 0 0 2 3 4 0 0 2Leptodactylidae 564 490 28 13 2 0 128 19 119 67 0 75Limnodynastidae 10 9 8 0 1 0 8 0 2 2 0 2Mantellidae 35 35 22 10 0 0 4 1 0 0 1 14Megophryidae 44 36 0 5 2 0 14 0 0 2 0 3Microhylidae 72 63 16 2 0 0 9 2 0 6 0 19Myobatrachidae 12 11 10 0 0 0 6 5 7 2 0 6Nasikabatrachidae 1 1 0 0 0 0 0 0 0 0 0 0Pelobatidae 1 1 1 0 0 0 1 0 0 0 0 0Petropedetidae 24 23 4 0 0 0 6 0 3 0 0 2Pipidae 3 2 1 0 0 0 1 0 0 0 0 0Ranidae 162 143 19 24 6 0 51 13 9 9 0 7Rhacophoridae 100 89 1 1 1 0 35 13 0 4 0 8Rhinodermatidae 2 2 0 0 0 0 2 0 2 0 0 1Sooglossidae 4 0 3 0 0 0 0 0 0 0 0 3TOTAL ANURA 1,672 1,440 186 72 18 0 479 97 343 129 3 220CaudataAmbystomatidae 13 13 13 5 2 1 12 1 2 5 0 1Cryptobranchidae 1 1 0 1 0 0 1 0 0 0 0 0Hynobiidae 27 25 2 15 0 0 11 2 1 4 0 0Plethodontidae 176 150 2 1 0 0 23 22 16 9 1 66Proteidae 2 2 0 0 0 0 2 0 0 1 0 0Rhyacotritonidae 1 1 0 0 0 0 0 0 0 0 0 0Salamandridae 29 20 2 11 2 0 13 5 0 3 0 1TOTAL CAUDATA 251 212 19 33 4 1 62 30 19 22 1 68GymnophionaCaeciliidae 3 1 2 0 0 0 1 1 0 0 0 2Ichthyophiidae 2 2 0 0 0 0 2 0 0 0 0 0TOTAL GYMNOPHIONA 5 3 2 0 0 0 3 1 0 0 0 2FireUtilization, a major threat for 6% of all threatened species, is also only recorded as athreat in 15 of the 36 families containing threatened species. There are seven families inparticular that contain a greater proportion of species affected by utilization compared withthe average: Hynobiidae (56%), Salamandridae (38%), Ambystomatidae (38%), Mantellidae(29%), Ranidae (15%), Dendrobatidae (14%) and Megophryidae (11%). Species inthe Dendrobatidae, Mantellidae and Salamandridae are particularly popular in the pettrade, and those in the Ranidae and Megophryidae are quite popular, particularly in Asiafor providing food.MAJOR THREATS ACROSS BIOGEOGRAPHIC REALMSComparing threats across biogeographic realms, habitat loss is still by far the most significantthreat, affecting at least over three-quarters of all threatened species in every region (Table13). However, there is substantial variation in the relative importance of the various causes ofhabitat loss across the regions. For example, in the Afrotropics, 80% of threatened species areaffected by expanding croplands, as are the majority of threatened species in the Neotropicsand Indomalayan realms. In Australasia, on the other hand, only 6% of threatened species areimpacted by this threat, and only 29% and 37%, respectively, are affected in the Palaearcticand Nearctic. These differences between the regions probably reflect the timing of large-scaleagricultural expansion, the three regions with the minority of threatened species affected beingthose that have already converted most of their suitable land to agriculture. A similar trend,albeit to a lesser extent, is evident when one looks at habitat loss that has taken place as aresult of timber and other vegetation removal. Again, the three regions most impacted arethose that still have a more significant proportion of their original forest cover.The significance of invasive species and disease as a major threat varies substantiallybetween regions. Invasive species is the second most significant threat in the AustralasianRealm, affecting 67% of threatened species, which is three times more than any otherregion, and much higher than the global average of 11%. The Afrotropics and Nearctic alsohave a higher proportion of species than the global average affected by this threat (22%and 21%, respectively). In the other three realms, the importance of invasive species as athreat is comparatively small. Australasia is also the region with the highest proportion ofthreatened species affected by disease (36%), followed by the Neotropics with 28%, andthe Nearctic with 18%. In comparison, the Afrotropics, Indomalayan and Palaearctic realmshave far fewer species affected, only 2%, 0.3% and 2%, respectively.Utilization is a relatively minor threat in all regions (affecting 8% or less of threatenedspecies), except for the Palaearctic Realm where 37% of threatened species are affected.This figure is mainly driven by the significant number of Chinese species that are utilized. Therelative importance of the different threatening processes within each region is discussedfurther in <strong>Chapters</strong> 5-10.MAJOR THREATS ACROSS REPRODUCTIVE MODESNot surprisingly, habitat loss is the most significant threat across all three reproductive modes(Table 14). When comparing the various types of habitat loss there is no difference betweenlarval and direct developers in the ranking of importance, although for direct developersTable 12. The major threats to threatened amphibians globally in each amphibian Family.Threat type Afrotropical Australasian Indomalayan Nearctic Neotropical PalaearcticAll habitat loss 92 76 88 79 89 81Agriculture – Crops 80 6 61 29 71 37Agriculture – Tree plantations 8 8 18 15 13 4Agriculture – Livestock 33 36 5 14 42 14Timber and other vegetation removal 75 26 64 49 64 43Urbanization and industrial development 74 44 46 39 47 53Invasive species 22 67 3 21 7 8Utilization 6 2 8 8 3 37Accidental mortality 0.4 3 3 8 0.3 4Persecution 0 0 0 1 0 0Pollution 13 47 32 34 29 37Natural disasters 1 18 8 11 6 10Disease 2 36 0.3 18 28 2Human disturbance 0.4 24 6 15 9 10Changes in native species dynamics (excluding disease) 1 0 0 1 0.1 0Fire 21 24 6 16 17 4Table 13. The percentage of threatened species affected by each major threatening process across regions. Only present threats to speciesare tallied.Threat type Larval % of larval Direct % of direct Live-bearing % of live-bearingAll habitat loss 963 89 657 86 12 60Agriculture – Crops 651 60 549 72 7 35Agriculture – Tree plantations 133 17 96 13 0 0Agriculture – Livestock 351 32 256 34 1 5Timber and other vegetation removal 631 58 510 67 9 45Urbanization and industrial development 586 54 336 44 9 45Invasive species 168 15 32 4 1 5Utilization 103 9 1 0.1 1 5Accidental mortality 21 2 1 0.1 0 0Persecution 1 0.1 0 0 0 0Pollution 396 36 142 19 1 5Natural disasters 68 6 60 8 0 0Disease 250 23 110 14 2 10Human disturbance 72 7 77 10 1 5Changes in native species dynamics (excluding disease) 3 0.3 1 0.1 0 0Fire 140 13 146 19 1 5Table 14. Major threats to threatened species employing different reproductive modes. Only present threats to species are tallied.
42Threatened <strong>Amphibian</strong>s of the WorldTable 15. A summary of the population trendsfor all extant amphibians, as well as across thedifferent realms, given as a percentage of allspecies in the realm.Population TrendNumber of extantamphibians globally% of all extantspecies globallyAfrotropical Australasian Indomalayan Nearctic Neotropical PalaearcticDecreasing 2,500 42 44 10 52 31 45 53Stable 1,567 27 23 53 16 48 25 27Increasing 29 0.5 1 0.4 0.2 1 1 1Unknown 1,788 30 32 37 31 20 29 19Table 16. The number of rapidly decliningamphibians in each IUCN Red List categorycategorized by the type of threat they areexperiencing.ThreatNumber of speciesrapidly decliningEX EW CR EN VU NT Number threatened or Extinct % of rapidly declining thatare threatened or ExtinctOver-exploitation (A) 38 0 0 8 8 11 11 27 71Reduced habitat (B) 206 1 0 66 33 29 77 129 63Enigmatic decline (C) 226 8 1 156 38 14 9 217 96All rapidly declining species 470 9 1 230 79 54 97 373 79Figure 17. The number of “rapidly declining”amphibians in the IUCN Red List Categories,broken into the major threat causing thedecline.Table 17. The number of rapidly decliningspecies in each taxonomic Order and Family.*these percentages differ significantly fromthe global average 21 .Number of species that have changed category from 1980 to 2006250200150100500Extinct Extinct in the Wild Critically Endangered Endangered Vulnerable Near ThreatenedIUCN Red List Category in 2006Over-exploitation Reduced habitat Enigmatic declineFamily Over-exploitation (A) Reduced habitat (B) Enigmatic decline (C) Total rapidly % of Familydeclining speciesAnuraArthroleptidae 0 3 0 3 6Bufonidae 0 26 81 107 22*Centrolenidae 0 0 4 4 3Dendrobatidae 0 6 11 17 7Discoglossidae 0 3 0 3 25Hemisotidae 0 1 0 1 11Hylidae 0 17 49 66 8Hyperoliidae 0 6 0 6 2*Leiopelmatidae 0 0 1 1 25Leptodactylidae 9 48 53 110 9Limnodynastidae 0 4 3 7 14Mantellidae 1 0 0 1 1*Megophryidae 0 4 0 4 3Microhylidae 3 7 0 10 2*Myobatrachidae 0 2 7 9 13Pelobatidae 0 2 0 2 50Petropedetidae 0 7 0 7 7Ranidae 17 31 6 54 8Rhacophoridae 0 9 0 9 3*Rheobatrachidae 0 0 2 2 100*Rhinodermatidae 0 0 1 1 50Scaphiopodidae 0 1 0 1 14TOTAL ANURA 30 177 218 425 8CaudataAmbystomatidae 2 4 0 6 20Cryptobranchidae 1 0 0 1 33Hynobiidae 1 1 0 2 4Plethodontidae 0 16 8 24 7Proteidae 0 1 0 1 17Salamandridae 4 7 0 11 16TOTAL CAUDATA 8 29 8 45 8TOTAL ALL AMPHIBIANS 38 206 226 470 16the percentage of species affected by expanding cropland, livestock and timber and othervegetation removal is slightly higher. For live-bearing species, it is difficult to identify anytrends as there are only 20 threatened species employing this reproductive mode.Invasive species are a much greater threat to larval developers, affecting 15% ofthreatened species. This is most likely because the vast majority of amphibians in Australia,the country most impacted by invasive species, are larval developers (87%). Utilization isprimarily a threat affecting only larval-developing species, with 103 of the 105 species affectedemploying this reproductive mode. Like invasive species, this trend in utilization ismost likely because the country that utilizes the most species, China, is also dominated bylarval developers (there are only nine direct-developing species in China).Pollution is a more significant threat to larval-developing rather than direct-developingspecies. Most larval developers rely on freshwater for breeding making them more susceptibleto water pollution than direct developers that are more likely to be restricted toterrestrial habitats. Disease is also more prevalent amongst larval developers (23% comparedwith 14% for direct developers) and this may also be explained by larval developers beingmore often linked to freshwater habitats, since it is suspected that chytrid is most likelytransmitted from one site to another through waterways.Population Status and TrendsBy measuring trends in the status of biodiversity, we can gain a better understanding ofthe impact that humans are having, and determine how successful we are at addressingbiodiversity loss. This has become all the more important given the target set by the nationsof the world for significantly reducing the rate of loss of biological diversity by 2010 18 . Here,we use IUCN Red List data for amphibians to present several insights into the overall trendsof amphibian species globally, including the use of an indicator, developed specifically tohelp monitor progress towards achieving this ambitious target.ESTIMATES OF POPULATION TRENDSRed List data offer several means of estimating population trends. The most simple involvescategorizing the current population trend for all extant amphibians as either decreasing,stable, increasing or unknown. These trend data are not necessarily derived from populationdata, and are often based on expert opinion related to the impact of threats, including, forexample, habitat loss, invasive species and the confirmation of disease within populations,as well as changes in range size.At least 42% of amphibian species are believed to be declining, only 27% are consideredto have generally stable populations, and fewer than 1% of species are believed to beincreasing (Table 15). As many as 30% of species are so poorly known that it is difficult togive even a rough estimate of population trends. Unfortunately, it seems plausible that this30% will include many additional species that are undergoing population declines. Thesegeneral figures give some indication of the magnitude of the decline in amphibian populationsglobally. Although currently one-third of species are globally threatened, there are alsosignificant numbers of non-threatened species that have declining populations (albeit that arenot currently declining at a rate fast enough to qualify for listing under a threatened category).It is inevitable that many of these species could eventually become globally threatened ifthreats are not mitigated and their populations continue to decline.Although the small number of species with increasing populations includes populationsthat are recovering from past declines, for the most part these species are often widespreadinvasive animals that can represent a significant threat to native amphibian populationsthrough predation, competition, hybridization, or disease transmission.The magnitude of the decline in amphibian populations varies across biogeographicrealms (Table 15). The two regions with the highest proportion of species with decreasingpopulations are the Indomalayan and Palaearctic realms. The Indomalayan Realm alsohas the lowest proportion of species with a stable population. The Australasian Realmhas significantly more optimistic statistics, with only 10% of species considered to havepopulations in decline, and 53% of species with stable populations, although this very likelyis partly due to the stabilizing effect of New Guinea (where threats are still relatively minor).This region also has the highest percentage of species for which the population trend isunknown (37%); however, again, most of these lesser known species are from New Guineawhere populations are less likely to be in decline.Biogeographic Realm Over-exploitation (A) % of rapidlydeclining speciesReduced habitat (B)% of rapidlydeclining speciesEnigmatic decline (C)% of rapidlydeclining speciesAfrotropical 3 10 26 87 1 3 30 3Australasian 0 0 12 34 23 65 35 6Indomalayan 20 34 37 64 1 2 58 6Nearctic 1 4 14 58 9 38 24 7Neotropics 12 4 99 32 194 64 305 10Palaearctic 18 43 23 55 1 2 42 9TOTAL% of speciesin the regionTable 18. The number of rapidly declining amphibians in each biogeographic realm, categorized by the type of threat they are experiencing.
Chapter 4. The State of the World’s <strong>Amphibian</strong>s 43“RAPIDLY DECLINING” SPECIESFor amphibians, 2004 was the first time that all species were assessed using the Red ListCategories and Criteria. The first comprehensive assessment of all species in a group is ameasure of the current projected extinction risk of the group, but does not give any indicationof how this is changing with time. Therefore, to estimate an overall trend in projectedextinction risk for amphibians, the information used to make the assessments in 2004 wasalso used to assign a backcast Red List Category for 1980. These backcast categories weredetermined by the GAA coordinating team and not by the assessors of the species in 2004.They are not official Red List assessments, as these cannot be accepted retrospectively,but are instead used here to identify species that appear to be in rapid decline. Whendetermining these backcast categories, it was assumed that the category in 1980 was thesame as in 2004 unless there was evidence to support a change in category. It is most likelythat this methodology for retrospectively assigning categories has resulted in a conservativeestimate of the change in status of amphibians, since undoubtedly there would have beensome changes in status for some species for which there was insufficient evidence availableto support a change in category. 19Rapidly declining species are defined here as species that have moved to a higher RedList category of threat between 1980 and 2006. They have been categorized into threegroups according to the most dominant threat that is thought to be causing the decline:over-exploitation (A); reduced habitat (B); or enigmatic decline (C).Particular threats appear to be pushing amphibians to extinction more quickly than others.Of the 470 species that are rapidly declining (see Appendix IV), 373 (79%) are consideredthreatened or already Extinct (Table 16 and Figure 17). The most likely threat to push speciesinto a threatened category or to extinction is enigmatic decline (96% of enigmatic declinespecies are threatened or already extinct). In contrast, only 63% of rapidly declining speciesRLIFigure 18. Red List Index for amphibians. If all species are Least Concern the RLI is equalto 1, and if all species are Extinct the RLI is equal to 0.RLIFigure 19. Red List Index for amphibians in the different biogeographic realms. (Note:species that occur in more than one realm contribute to the RLI in all the realms in whichthey occur.) Key to realms: AUS = Australasian; PAL = Palaearctic; NEAR = Nearctic; AFR =Afrotropical; IND = Indomalayan; NEO = Neotropical.RLI1.00.90.80.70.60.51.00.90.80.70.60.51.00.90.80.70.60.51980 1985 1990 1995 200020052010Figure 20. Red List Index for amphibians across the different reproductive modes.Year1980 1985 1990 1995 200020052010YearAUS PAL NEAR AFR IND NEO1980 1985 1990 1995 200020052010YearLarval developers Direct developers Live-bearingsuffering from reduced habitat are currently threatened or already extinct. For rapidly decliningspecies experiencing over-exploitation, 71% of these species are currently threatenedand there are no documented extinctions.Species in certain taxonomic groups are more likely to be experiencing a rapid decline thanother groups (Table 17). For example, there are no caecilians known to be in rapid decline atpresent, but around 8% of all frogs and toads and 8% of salamanders and newts are. Twofamilies of anurans, Bufonidae and Rheobatrachidae 20 , have significantly more species inrapid decline compared with the average. There are currently 476 species described in theBufonidae, 107 (22%) of which are in rapid decline.<strong>Amphibian</strong>s in different regions of the world are experiencing different threats, andthese threats also vary in their severity (Table 18). For example, in the Australasian andNeotropical realms most rapidly declining species are experiencing enigmatic declines. Forthe other four realms, reduced habitat is the reason for decline amongst the majority ofrapidly declining species. In the Indomalayan and Palaearctic realms, over-exploitation isalso responsible for over one-third of the declines amongst rapidly declining species. TheNeotropics overall has the most rapidly declining species, with 10% of amphibians in theregion currently considered to be in rapid decline. The Nearctic has the least number ofamphibians in rapid decline, only 24; however, as a percentage of species richness in theregion, the Afrotropics have the least rapidly declining species with only 3%.RED LIST INDEXThe most robust means of looking at how the Red List status of large groups of specieshas changed over time is by means of the IUCN Red List index. The Red List Index (RLI)uses the Red List categories of species within a group, and how they change over time, toestimate an overall trend in projected extinction risk (Butchart et al. 2004, 2007). Every time acomprehensive assessment of all species in the group is completed, the Red List categoriesare then used to calculate a value for the RLI for this time period. For amphibians, the RLIwas calculated in 2004 (Baillie et al. 2004), but since then the methodology for calculatingthe RLI has been revised, a small number of amphibians have been reassessed, and someassessments have been corrected. Here, we present a calculation of the RLI for amphibiansusing the revised formulation and use the most current categories for each species.Between 1980 and 2006 there has been a decrease in the RLI, as illustrated by a downwardtrend in Figure 18, which indicates that the projected extinction risk for amphibiansis increasing. In order to meet the Convention on Biological Diversity target of significantlyreducing the loss of biodiversity by 2010 (Secretariat of the Convention on Biological Diversity2003), the RLI must increase from the previous time period – i.e., the line in Figure 13 mustshow an upward trend. With only two data points for the amphibian RLI, at present it canonly be shown that the projected extinction risk is increasing, but as the global assessmentof amphibians continues on a regular basis, future data points will show whether or not therate of increase is accelerating or decelerating.The Red List Index can also be disaggregated, for example, by biogeographic realm (Figure19) and by reproductive mode (Figure 20). All six realms show an increase in the projectedextinction risk for amphibians from 1980 to 2006. However, the level of increase varies acrossrealms, as does the average threatened status of amphibians. The current threat status ofamphibians is best (that is on average there are less threatened species) in the AustralasianRealm and worst in the Neotropical Realm. For all regions, the RLI shows a downward trend– i.e., the projected extinction risk has increased in 2006 compared with 1980, indicatingthat amphibian declines are a global problem. The rate of increase in projected extinctionrisk is lowest for the Afrotropics, and highest for the Neotropics.The RLI was also calculated across the three different reproductive modes: larval developers,direct developers or live-bearing species. There are also quite a few species for whichthe reproductive mode is not known and these species were omitted from this RLI calculation.The results show that the average threatened status of larval developers in 1980 and 2006is better than live bearers and direct developers. All three groups show a downward trendin the RLI, indicating an increase in projected extinction risk, but the increase for directdevelopers is less compared with larval developers and live bearers.KEY FINDINGS• The GAA assessed 5,915 amphibian species globally and categorized one-third of allextant species (1,893 out of 5,881) as threatened with extinction.• There are 34 species currently listed as Extinct and one as Extinct in the Wild.Baskets of frogskins from a market in Thailand.The GAA recorded more than 220 species ofamphibians currently used for human consumption,although in some cases such usedoes not always represent a major threat tothe species. © Peter Paul van DijkEndnotes1 www.maweb.org2 This is the number of amphibians officially recognizedas valid by the GAA as of December 2006.At the time of going to press, 6,184 species wereofficially listed on <strong>Amphibian</strong> Species of theWorld (v 5.0), and 6,308 on AmphibiaWeb (Feb25, 2008).3 A threatened species is one that is included in theIUCN Red List Categories Vulnerable, Endangeredor Critically Endangered.4 At the time of going to press, there were reportsof the rediscovery of one EX species, namelyPhilautus travancoricus from the Western Ghatsin India (S.D. Biju pers. comm.).5 A taxon is presumed Extinct, according to the IUCNRed List Categories and Criteria, when exhaustivesurveys in known and/or expected habitat, atappropriate times (diurnal, seasonal, annual),throughout its historic range have failed to recordan individual. Surveys should be over a time frameappropriate to the taxon’s life cycles and life form.Species that are believed to have gone extinct priorto 1500 AD are not considered.6 At the time of going to press, Meegaskumbara etal. (2007) had just described two additional extinctspecies, Philautus pardus and P. maia, known onlyfrom collections made in Sri Lanka prior to 1876;both species await formal assessment.7 When interpreting these results, it is necessaryto bear in mind that a species can be listed ina category on the basis of one or more criteria,and that a species may trigger criteria for a lowercategory of threat than that for which it is listed(these criteria are not recorded). For example, aspecies may qualify for Endangered on the basisof criterion B and for Vulnerable on the basisof criterion C. When listed as Endangered onlycriterion B will be given.8 As discussed elsewhere in this volume, themajor reclassification by Frost et al. (2006) andGrant et al. (2006) has dramatic implications foramphibian classification at the family level. Theresults presented here can be expected to undergosubstantial modification based on the conclusionsof that study.9 P
44Threatened <strong>Amphibian</strong>s of the WorldPlectrohyla dasypus (Critically Endangered)from the Parque Nacional Cusuco in Hondurasis one of many species that have undergonea rapid decline in status, in this case dueto the effects of chytridiomycosis. © SilviuPetrovan11 The range size for each species has been calculatedusing the area of the polygons representingeach species’ Extent of Occurrence.12 The methodology for mapping these amphibian“centres of endemism” follows that developed byBirdLife International in identifying their EndemicBird Areas (Stattersfield et al. 1998). Around twothirdsof amphibians have range sizes less than50,000km² compared with around one-quarter ofbirds.13 Table 10 only includes countries with more than 10species. If all countries are included, the countrywith the highest percentage is New Zealand withall four of its species, which are also all endemic,threatened with extinction.14 The range size for each species has been calculatedusing the area of the polygons representingeach species’ Extent of Occurrence.15 Selective logging is generally defined as theprocess by which only the most desirable trees,often the largest and\or most commercially viable,are logged from an area of forest; in contrast, clearcuttingis generally defined to be a large-scaleand commercial process, by which all trees froma given area are taken in a logging operation.16 Although amphibian deformities can result fromexposure to contaminants, many cases of limbdeformities in nature have been linked to otherabiotic and biotic factors, such as UV radiation,parasitic infections, retinoids, predation, and theinteraction of several of these factors (see Oullet2000; Sessions 2003).17 In this study, pesticides that inhibit acetylcholinesterasewere most strongly correlatedwith declines. Such cholinesterase inhibitors (or“anticholinesterase”) suppress the action of theenzyme, and ultimately lead to death. Anticholinesterasesare commonly used for killing insects inorganophosphate and other pesticides.18 http://www.biodiv.org/2010-target/default.asp19 In 2006, a small number of species were reassessed,and the new information supporting thesereassessments was also used to better estimatethe categories in 1980, and where necessarysome categories were changed. The Red Listcategories for all species in 2006 and the revised1980 categories form the basis of the informationin the section on rapidly declining species.20 The family Rheobatrachidae has only two species,both of which are now Extinct.21 P
Chapter 4. The State of the World’s <strong>Amphibian</strong>s 45ESSAY 4.1. PICKLED FROGS HELP BIODIVERSITY ASSESSMENTAt a time when amphibian populations globally are in decline, the recentdiscoveries of large numbers of new frog species on Sri Lanka, an islandfrom which the pathogenic chytrid fungus has not yet been reported, mayseem heartening (Meegaskumbura et al. 2002). A total of 42 new speciesof anurans have been described since 1993, and many more species are inthe process of being formally described. Description of these new speciesnecessitated the examination of all available type material, as well as otherpreserved voucher material, for all Sri Lanka’s amphibians. As a result of thecountry’s five-century history of colonial occupation, these specimens, collectedlargely between 1850 and 1950, lie scattered amongst natural historymuseums in Europe, the United States and India. In particular, since Sri Lankawas a British colony from 1796 to 1948, most type specimens are housed inThe Natural History Museum (formerly the British Museum of Natural History),in London. Sri Lanka’s own national museum contains no amphibian typeswhatsoever. Although locality information beyond ‘Ceylon’ is usually lackingon the specimen labels, these specimens provide the only available baselineof Sri Lanka’s amphibian fauna before the island’s primary rainforests werereduced to their present-day extent of approximately 750km 2 .The recent review of historical material served to highlight several keyaspects. First, a number of species described in the 19th century, and sincerelegated to synonymy, were shown to represent valid taxa. Second, several‘new species’ lay silently undiscovered among the old collections (Manamendra-Arachchiand Pethiyagoda 2005; Meegaskumbura and Manamendra-Arachchi 2005). At the same time, the Wildlife Heritage Trust’s 1993-2005comprehensive survey of the island’s amphibian fauna provides a reliablerecord of the species still persisting on the island and their relative abundance.A comparison of the results of the recent biodiversity survey, together withthe historically preserved specimens, revealed that 19 named anuran specieshave apparently disappeared from the island (an additional two undescribedspecies also appear to be extinct). Given that these 19 species had not beenreported since their original collections before 1940, and were not recordedduring the recent surveys across the island’s remaining forests, they wereformally declared Extinct according to the IUCN Red List categories andcriteria (GAA; Stuart et al. 2004). Apart from a single species each from theendemic genera Adenomus and Nannophrys, the Extinct species all belongto the Oriental shrub-frog genus Philautus (Ranidae: Rhacophorinae), whichshows a remarkable radiation in Sri Lanka. A total of 62 of the approximately140 species currently recognized in this genus are endemic to Sri Lanka.To put these findings in a global context, according to the results of theGlobal <strong>Amphibian</strong> Assessment, 19 of 34 amphibian species confirmed asExtinct worldwide are from Sri Lanka. Even though a further 122 species areconsidered ‘possibly extinct’ globally, the Sri Lankan total is still remarkablyhigh. Given that the island accounts for only around 2% of the world’s anuranspecies (which is high given its relatively small size: 65,000km 2 ), it is surprisingthat more than half of the confirmed amphibian extinctions worldwidehave occurred on Sri Lanka.This extinction phenomenon in Sri Lanka (19 of the 103 native speciesdescribed to date) appears to have been driven largely by the destruction ofsuitable habitat. Since 1815, approximately 95% of the island’s 16,000km 2 ofrainforest was lost to coffee and cinchona plantations, later to be replacedby tea and rubber (Kumar et al. 2004). While large expanses of dry forestand scrub persist elsewhere in the island, these habitats only support threeof the 68 extant endemic amphibian species, with only a single species,Philautus regius (DD), restricted to dry forest. Of Sri Lanka’s 84 survivinganuran species, 11 are Critically Endangered (seven of them Philautus) and28 Endangered (20 Philautus). Many of these surviving amphibian species,especially the Philautus, have extremely restricted ranges. Even where thereare larger tracts of contiguous forest, the ranges of many of these speciesare restricted by altitude or vegetation, resulting in the total contemporaryrange of some species being as small as 5km 2 . Some 17 species are knownonly from a single site each (per Ricketts et al. 2005), with some sites, suchas Morningside and Knuckles Forest Reserve, being home to several endemicand threatened species.Interestingly, though not unexpectedly, the results of the GAA also suggestthat, among threatened direct-developing species worldwide, 65 outof the 115 (57%) species that are closely associated with freshwater arethreatened by disease, compared with only 45 out of the 650 (7%) speciesnot closely associated with freshwater. Given that the major global threatto direct developers appears to be habitat loss (Chapter 4), and most of theextant Sri Lankan direct developers are not associated closely with freshwaterhabitats, the role of waterborne diseases in Sri Lanka’s extinction of directdevelopers may have been slight.The large-scale extinction of many of the island’s amphibians might havegone undetected if not for the historical collections in the world’s naturalhistory museums; unfortunately, old amphibian collections in Sri Lanka’sNational Museum have not survived the years to help facilitate this effort.Clearly, the extraordinary value historical collections represent by way ofbiodiversity baselines against which present-day surveys may be assessed,remains to be widely appreciated (Fig. 1). This is especially relevant at a timewhen the contemporary role and value of natural history collections is beingquestioned, and with many museums facing financial crises (Dalton 2003;Suarez and Tsutsui 2004; Winker 2004). Furthermore, historical collections canbe useful in several other ways, as exemplified most recently by the detectionof chytrid fungus in the skin of a museum specimen collected from nearMonteverde, Costa Rica, and deposited in a museum well before declineswere documented in the area (Puschendorf et al. 2006).Interestingly, since most of the species that were recently described(Manamendra-Arachchi and Pethiyagoda 2005; Meegaskumbura and Manamendra-Arachchi2005) were absent from early museum collections, it seemsthat past surveys of the island were not very thorough. The documentationof the extinction of so many species from such a limited collection suggeststhat these extinct species may be only a fraction of a much larger extinctionevent in Sri Lanka. The account of Sri Lanka’s amphibian declines is also novelin that it combines a recent comprehensive survey of the island’s amphibianswith a re-examination of almost all preserved material worldwide. Many othertropical countries are similarly under-explored, and it is therefore likely thatthe global tally of recent amphibian extinctions will rise significantly whentheir historical collections are similarly evaluated and compared with currentassessments of amphibian diversity.Madhava Meegaskumbura, Rohan Pethiyagoda, JaniceChanson, David Wake and James HankenReferencesDalton, R. 2003. Natural history collections in crisis as funding is slashed. Nature 423:575.Kumar, A., Pethiyagoda, R. and Mudappa, D. 2004. Western Ghats and Sri Lanka.Pp. 152-157, in: R.A. Mittermeier, P. Robles-Gil, M. Hoffmann, J.D. Pilgrim, T.M.Brooks, C.G. Mittermeier, J.L. Lamoreux and G. Fonseca (eds.), Hotspots Revisited.Cemex. 392 pp.Manamendra-Arachchi, K. and Pethiyagoda, R. 2005. The Sri Lankan shrub-frogs of thegenus Philautus Gistel, 1848 (Ranidae: Rhacophorinae), with description of 27 newspecies. The Raffles Bulletin of Zoology, Supplement No. 12:163-303.Meegaskumbura, M., Bossuyt, F., Pethiyagoda, R., Manamendra-Arachchi, K., Bahir,M.M., Schneider, C. J. and Milinkovitch, M.C. 2002. Sri Lanka: an amphbian hotspot.Science 298:379.Meegaskumbura, M. and Manamendra-Arachchi, K. 2005. Description of eight new speciesof shrub frogs (Ranidae: Rhacophorinae: Philautus) from Sri Lanka. The Raffles Bulletinof Zoology, Supplement No. 12:305-338.Puschendorf, R., Bolanos, F., and Chaves, G. 2006. <strong>Amphibian</strong> chytrid fungus alongan altitudinal transect before the first reported declines in Costa Rica. BiologicalConservation 132:136-142.Ricketts, T.H., Dinerstein, E., Boucher, T., Brooks, T.M., Butchart, S.H.M., Hoffmann, M.,Lamoreux, J.F., Morrison, J., Parr, M., Pilgrim, J.D., Rodrigues, A.S.L., Sechrest, W.,Wallace, G.E., Berlin, K., Bielby, J., Burgess, N.D., Church, D.R., Cox, N., Knox, D.,Loucks, C., Luck, G.W., Master, L.L., Moore, R., Naidoo, R., Ridgely, R., Schatz, G.E.,Shire, G., Strand, H., Wettengel, W. and Wikramanayake, E. 2005. Pinpointing andpreventing imminent extinctions. Proceedings of the National Academy of SciencesUSA 102:18497-18501.Stuart, S.N., Chanson, J.S., Cox, N.A., Young, B.E., Rodrigues, A.S.L., Fischman, D.L. andWaller, R.W. 2004. Status and trends of amphibian declines and extinctions worldwide.Science 306:1783-1786.Suarez, A.V. and Tsutsui, N.D. 2004. The value of museum collections for research andsociety. BioScience 54:66-74.Winker, K. 2004. Natural history museums in a postbiodiversity era. BioScience 54:455-459.The collections of the world’s natural history museums represent important biodiversity baselines. Here, preserved amphibian specimens collected in SriLanka ca. 1900 are stored on the shelves of The Natural History Museum in London © Barry Clarke/NHMESSAY 4.2. AMPHIBIANS AND HUMANS SHARING ONLY ONE PLANETTo effectively conserve amphibian populations in the wild it is not onlynecessary to understand the needs of the individual species, but also thecontext in which conservation efforts will need to take place. By comparingoverlays of individual species range maps with recent and future humandemographic variables (such as human population density, population growth,Gross National Income, and poverty), it is possible to elucidate the socialand economic context in which conservation action must be implemented.Here, we investigate the relationships between amphibian species richnessand two of these variables, human population density and levels of poverty– using Infant Mortality Rate data (CIESIN 2005) as a surrogate – not as ameans of looking for causal relationships, but rather to identify regions whereconservation may be more challenging.Human population densityBy comparing the current human population density in 2005 (LandScan 2005)with the global distribution of all amphibian species it is possible to identifythe regions that are favoured by both humans and amphibians (Figure 1).Regions with a large number of amphibian species and a high populationdensity are mostly found in Asia, in particular southern and eastern India,south-east China, southern Sri Lanka, and Indonesia (especially Java), as wellas coastal parts of West Africa, the Ethiopian Highlands, and the AlbertineRift of Central Africa. There are also similar regions in the eastern UnitedStates, which is a hotspot for salamander diversity. In South America, theAtlantic Forest is the most prominent region.Considering that humans and amphibians are dependent on freshwaterfor survival, the arid regions of the world are the places with the fewestamphibians (often none at all) and very low human population densities.For example, the deserts of North Africa, central Australia, central NorthAmerica, and Central Asia. The majority of amphibians prefer moist tropicalconditions, and many of the regions rich in amphibian species, but with lowhuman population densities, are the world’s tropical rainforests, for examplethe Amazon, the Congo, the tropical Andes, Southeast Asia and northernQueensland in Australia (the Queensland Wet Tropics). Regions with lowdiversity of amphibians, but high human population densities, are in generalcooler regions such as northern India, northern China and much of Europe.By comparing the diversity of threatened amphibians with human populationdensity it is possible to highlight regions where species conservation ismost likely to come into conflict with increasing demand by humans for naturalresources (Figure 2). Many of these regions are the same as those highlightedin Figure 1, for example south-east China, Java (Indonesia), the Albertine Riftof Central Africa, coastal West Africa, and the Ethiopian Highlands. Notableadditions are the larger islands of the Caribbean, southern Mexico, and thePhilippines. In India, the highest density of threatened amphibians is focusedon the Western Ghats. Parts of the eastern United States, Europe and Indiathat are rich in amphibian species and have high human population densitiesare no longer highlighted as they have relatively few or no threatened species.In Europe and the United States this may be because species susceptible tohabitat loss may have declined a long time ago, and perhaps also becausemany of the resources on which humans in these areas rely on come fromother regions, for example the forests of Africa and Asia.
46Threatened <strong>Amphibian</strong>s of the WorldFigure 1. <strong>Amphibian</strong> species richness compared with human population density. Each quarter-degree grid cell iscoded according to the combined value of the two variables. <strong>Amphibian</strong> species richness is represented by the numberof amphibian species per grid cell (Low: 0-15; Medium: 16-30; High: 30-144). Population density is classified by thenumber of people per km 2 (Low: 0-10; Medium: 11-100; High: >100).Figure 2. Threatened amphibian species richness compared with human population density. Each quarter-degreegrid cell is coded according to the combined value of the two variables. Threatened amphibian species richness isrepresented by the number of threatened amphibian species (Red List Categories Critically Endangered, Endangeredand Vulnerable) per grid cell (Low: 0; Medium: 1-10; High: >10). Population density is classified by the number ofpeople per km 2 ; Low: 0-10; Medium: 11-100; High: >100.Figure 3. <strong>Amphibian</strong> species richness compared with poverty. Each quarter-degree grid cell is coded according tothe combined value of the two variables. <strong>Amphibian</strong> species richness is represented by the number of amphibianspecies per grid cell (Low: 0-15; Medium: 16-30; High: 30-144). Infant Mortality Rate data (CIESIN 2005) are usedas an index of poverty. The rates are per thousand of live births and the data are at the sub-national level. The datawere reclassed as: Low: 0-100; Medium: 100-250; High: >250.Figure 4. Threatened amphibian species richness compared with poverty. Each quarter-degree grid cell is codedaccording to the combined value of the two variables. Threatened amphibian species richness is represented by thenumber of threatened amphibian species (Red List categories Critically Endangered, Endangered and Vulnerable) pergrid cell (Low: 0; Medium: 1-10; High: >10). Infant Mortality Rate data (CIESIN 2005) are used as an index of poverty.The rates are per thousand of live births and the data are at the sub-national level. The data were reclassed as: Low:0-100; Medium: 100-250; High: >250.Human povertyAn additional challenge to biodiversity conservation is the welfare of local humanpopulations, in particular the degree of poverty. Many of the world’s mostdensely populated regions are also some of the poorest, for example, China,India, mainland Southeast Asia and West Africa. When comparing the mostimpoverished regions with amphibian diversity we find these same regionsemerging again, but also less densely populated regions are also highlighted,such as central and southern Africa, Madagascar, northern Brazil, Peru, andBolivia (see Figure 3). The land surface area of the world’s wealthiest nationsis relatively small and these countries often have cooler climates not favouredby amphibians, hence the proportion of amphibian species found in thesecountries is relatively low. Exceptions are the eastern United States, coastaleastern Australia and central Europe. However, the relatively high numbersof species in these regions may be more a reflection of intense survey effortwhen compared with much poorer countries.By comparing the diversity of threatened amphibians with the level ofpoverty it is possible to highlight those regions where biodiversity conservationwill most likely suceed if it also improves the welfare of the localcommunities (Figure 4). In addition these regions will less likely be unable toshoulder any of the costs of conservation programmes. Many of these regionsare the same as those highlighted when comparing threatened species withhuman population density, for example south-east China, the Albertine Riftof Central Africa, the Ethiopian Highlands, coastal West Africa, Puerto Rico,southern Mexico, the Western Ghats of India, and the Philippines. Regionswith a high level of poverty that were not previously highlighted as also beingdensely populated include Peru, Bolivia, Guyana, the Solomon Islands,Vietnam, Madagascar, and the Cameroon highlands.ConclusionIn an increasingly human-dominated world it is impossible for conservation tobe successful without understanding the context in which it is to take place.By comparing the distribution of amphibians, and in particular threatenedamphibians, with human demographic data, it is possible to gain a betterunderstanding of some of the challenges facing conservation.ReferencesVineet Katariya andJanice ChansonCenter for International Earth Science Information Network (CIESIN), Columbia University;2005 Global subnational infant mortality rates [dataset]. CIESIN, Palisades, NY, USA.Available at: http://www.ciesin.columbia.edu/povmap/ds_global.htmlLandScan TM Global Population Database. Oak Ridge, TN: Oak Ridge National Laboratory.Available at http://www.ornl.gov/landscan/.ESSAY 4.3. THE USE OF PHYLOGENIES IN PREDICTING TRENDS FOR CONSERVATION: A CASE STUDY FROM SRI LANKAThe discovery of large numbers of new amphibian species in Sri Lanka andelsewhere (Pethiyagoda and Manamendra-Arachchi 1998; Köhler et al.2005; and see Essay 1.1), even as population declines accelerate worldwide,presents profound challenges to conservation managers. Prioritizing conservationactions in the face of declines caused by a diversity of threats – includingdisease and habitat fragmentation and loss – is obviously difficult. Frequently,detailed natural history knowledge that would facilitate conservation, ismissing for many, if not most, species. Nonetheless, it is often necessary tomake decisions even in the absence of detailed information.Phylogenetic analyses of species and genera can provide an importantsource of additional information, particularly when coupled with existingecological data. In this respect, the anurans of Sri Lanka provide an interestingcase study. Based on morphological characters, taxonomists had previouslyallocated the treefrogs (subfamily Rhacophorinae of the family Ranidae) ofSri Lanka among several genera, such as Philautus (including a subgenusKirtixalus), Polypedates, Rhacophorus and Theloderma. However, recentphylogenetic analyses based on mitochondrial DNA have largely refutedthese classifications and demonstrated that Sri Lankan treefrogs belong toonly two clades: a large and diverse group of direct-developing species inthe genus Philautus, and a much smaller clade of foam-nesting species in thegenus Polypedates (Meegaskumbura et al. 2002) (Figure 1A).While information on breeding strategy is available for 19 species ofSri Lankan rhacophorids, several lines of evidence suggest that the entireradiation of Philautus in Sri Lanka is characterized by direct development (i.e.,their embryos undergo complete development within the egg, from whichthey emerge as fully developed froglets, enabling them to develop with thetadpoles bypassing the ‘conventional’ aquatic larval stage). The fact that eachof the 19 species examined shows direct development suggests, at least,that the most recent common ancestor of those taxa was a direct developer(Figure 1A, 1B and 1C). The sister group of the Sri Lankan clade of Philautusis a diverse Indian clade (Meegaskumbura et al. 2002; Bossuyt et al. 2004)in which direct development has been observed for a number of species (Bijuand Bossuyt 2005). This suggests that the most recent common ancestor ofthe Indian and Sri Lankan taxa was also a direct developer. Therefore, it isparsimonious to infer that all Sri Lankan Philautus are direct developing. Incontrast, Polypedates, which has only five species in Sri Lanka, build foamnests on vegetation overhanging water, into which emerging tadpoles falland continue to develop.While all Sri Lankan Philautus are direct developers, they exhibit twodistinct reproductive behaviours: soil-nesting and leaf-nesting (Bahir et al.2005) (Figure 1B, 1C). While in amplexus, females of soil-nesting speciesexcavate a pit in damp soil with their hands into which they deposit eggs,which are fertilized by the males. The females then cover up the nest withsoil and leaf litter. Leaf-nesting females, on the other hand, attach their clutchto the underside of a leaf (also while still in amplexus), usually 1-2 m above
Chapter 4. The State of the World’s <strong>Amphibian</strong>s 47the forest floor. Egg masses on leaves are highly vulnerable to desiccationwhen relative humidity falls below about 90%, and so the species depend ongood-quality forests with dense shade and low wind speeds. The phylogenysuggests that leaf nesting, as a reproductive trait, is restricted to a singleclade (Figure 1B and 1C).Despite Sri Lanka having been connected by a land bridge to India formuch of its history and as recently as 10,000 years ago, phylogenies of severalgroups of organisms indicate that there has been little recent biotic exchangebetween the two landmasses – particularly for taxa restricted to rainforesthabitats (Bossuyt et al. 2004). This is true for Sri Lankan Philautus, whichbelong to an old lineage distinct from the Indian direct developers, except fora small group that appears to be derived from a species that migrated back toIndia over 9 million years ago. The Sri Lankan Philautus, therefore, encompasssubstantial phylogenetic diversity that necessitates their consideration as aunique entity from a conservation perspective.In addition to conserving diversity per se, it is widely recognized thatconservation must aim also to preserve the processes that generate diversity.A mt-DNA based phylogeny has shown how sister taxa are distributed acrossmontane-forest refugia in Sri Lanka, suggestive of speciation by vicarianceduring the contraction of cool and wet habitats during dry periods of theMiocene and the Pliocene (Meegaskumbura and Manamendra-Arachchi 2005)(Figure 1D). This pattern of geographic isolation of sister taxa in patches offavourable habitat is seen also in several other major lineages of direct-developingfrogs, including the Neotropical genus Eleutherodactylus (Savage2002), and the Afrotropical Arthroleptella (Dawood and Channin 2000), and, interestingly,also in the direct-developing plethodontid salamanders of CentralAmerica (Garcia-Paris et al. 2000). These observations suggest that montaneisolation may be an important mechanism of speciation in direct-developingamphibians. However, this does not mean that habitat fragmentation shouldbe encouraged. In addition, phylogenies can also help to identify refugia thatsurvive as habitats through successive major climatic oscillations (Hewitt andNichols 2005). Such refugia can be identified because they will, for a givenspecies, contain greater genetic diversity than areas of recent populationexpansion (Schneider et al. 1998) and they often contain a higher diversityof montane endemic species (Schneider and Williams 2005).The rhacophorine phylogeny (see Figure 1A) also suggests that the morederived terrestrial direct development is associated with a larger numberof species. The more basal Buergeria, containing only five species, showsconventional, and plesiomorphic, anuran reproduction, with eggs and larvaeundergoing development entirely in water. On the other hand, ca. 200 speciesof Philautus are presently recognized, with dozens more species awaitingdescription (Biju 2001; Meegaskumbura et al. 2002). Direct developmentreleases amphibians from dependence on water bodies for reproduction.This, in turn, appears to enable amphibians to colonize a wide array of moistterrestrial habitats, as evidenced by the diversity of such habitats (e.g., forestcanopy, leaf litter, rock surfaces, and open grasslands) occupied by species ofboth Philautus and Eleutherodactylus. However, greater habitat specializationand/or smaller habitat patches would make them susceptible to stochasticpopulation declines as well as putting them at risk due to climate change.Phylogenetic information contributes to conservation in several importantways. First phylogenetic information is fundamental to identify biodiversity(i.e., to diagnose species or to identify evolutionarily signifi cant units orendemic taxa). Second, phylogenies are necessary for identifying importantadaptive diversity. For example, the Sri Lankan / Indian radiation of Philautusappears to have evolved direct development independently from Asian Philautus(Meegaskumbura et al. 2002). Separate instances of adaptive evolution arecrucial for understanding adaptation and thus the Sri Lankan / Indian Philautustake on added importance for conservation. Third, knowledge of phylogeneticrelationships allows us to extend our understanding of ecology and behaviorin a few species to clades of closely related species for which we have limiteddata. For example, understanding phylogenetic relationships may allow us touse a relatively abundant species as a surrogate to develop captive-breedingprotocols for a closely related, but Critically Endangered, species in urgentneed of ex situ conservation. Phylogenies are important on several levels andnow, with the widespread use of DNA sequencing and molecular phylogenetics,are likely to play an increasing role in conservation biology.ReferencesMadhava Meegaskumbura, Kelum Manamedra-Arachchi,Rohan Pethiyagoda and Christopher J. SchneiderBahir, M., Meegaskumbura, M., Manamendra-Arachchi, K., Schneider. C.J. and Pethiyagoda,R. 2005. Reproduction and terrestrial direct development in Sri Lankan shrubfrogs (Ranidae: Rhacophorinae:Philautus). The Raffles Bulletin of Zoology, SupplementNo. 12:339-350.Biju, S.D., 2001. A synopsis to the frog fauna of the Western Ghats, India. OccasionalPapers of the Indian Society for Conservation Biology. South Asian Natural History1:119-124.Biju, S.D. and Bossuyt, F. 2005. Two new species of Philautus (Anura: Ranidae: Rhacophorinae)from Ponmudi Hill in the Western Ghats of India. Copeia 1:29-37.Bossuyt, F., Meegaskumbura, M., Beenaerts, N., Gower, D.J., Pethiyagoda, R., Roelants,K., Mannaert, A., Wilkinson, M., Bahir, M.M., Manamendra-Arachchi, K., Ng, P.K.L.,Schneider, C.J., Oommen, O.V. and Milinkovitch, M.C. 2004. Sri Lanka: a center offaunal endemism in a Biodiversity Hotspot 21. Science 306:479-481.Dawood, A. and Channing, A. 2000. A molecular phylogeny of moss frogs from theWestern Cape, South Africa, with a description of a new species. Journal of Herpetology34:375-379.Garcia-Paris, M., Good, D.A., Parra-Olea, G. and Wake, D.B. 2000. Biodiversity of CostaRican Salamanders: implications of high levels of genetic differentiation and phylogeographicstructure for species formation. Proceedings of the National Academy ofSciences 97:1640-1647.Hewitt, G.M. and Nichols, R.A. 2005. Genetic and evolutionary impacts of climate change.In: T.E. Lovejoy and L. Hannah (eds.), Climate change and biodiversity, pp.176-192.Yale University Press, New Haven, USA.A B CDPhilautus - Sri Lanka/ Ind (100+)Philautus - Ind (100+)Kurixalus (2)Philautus - SE Asia (63)Polypedates (28)Chiromantis (4)Rhacophhorus (63)Theloderma (9)Buergeria (5)P. decorisP. mittermeieriP. wynaadensisP. stuartiP. viridisP. demoralisP. mooreorumP. poppiaeP. steineriP. microtympanumP. hoffmaniP. asankai4.00-5.804.37-6.93*4.15-6.04*5.31-11.97*7.63-11.06*Figure 1. The mt-DNA phylogeny of Sri Lankan Philautus (modifi ed from Meegaskumbura et al. 2002 and Meegaskumbura and Manamendra-Arachchi 2005).1A: the genus level relationships of the Old World treefrogs shows that Buergeria is basal and shows aquatic breeding (light blue), while the more derivedgroups are tree-hole breeding (black), foam nesting (green), tree-hole nesting (purple) with brood care and direct developing (Red – South East Asian andIndian species, and Blue – Sri Lankan species). Number of species within each genus is depicted within brackets. 1B and 1C: the major clades within theSri Lankan radiation, with the number of species for which breeding information is available inside the triangles. The leaf nesting clade is circled. 1D: someof the clades (highlighted by a *) restricted to cloud forest habitats and the sister taxa within these clades distributed on adjacent cloud-forest habitats(K - Knuckles Hills, C - Central Hills; R - Rakwana Hills). In contrast, Philautus decoris – mittermeieri clade is distributed across an altitudinal gradient. Thisinformation is useful for making conservation decisions.Köhler, J., Vieites, D.R., Bonett, R.M., García, F.H., Glaw, F., Skeinke, D. and Vences, M.2005. New amphibians and global conservation: a boost in species discoveries in ahighly endangered vertebrate group. BioScience 55:693-696.Manamendra-Arachchi, K. and Pethiyagoda, R. 2005. The Sri Lankan shrub-frogs of thegenus Philautus Gistel, 1848 (Ranidae: Rhacophorinae), with description of 27 newspecies. The Raffl es Bulletin of Zoology, Supplement No. 12:163-303.Meegaskumbura, M., Bossuyt, F., Pethiyagoda, R., Manamendra-Arachchi, K., Bahir,M.M., Schneider, C.J. and Milinkovitch, M.C. 2002. Sri Lanka: an amphibian hotspot.Science 298:379.Meegaskumbura, M. and Manamendra-Arachchi, K. 2005. Description of eight new speciesof shrub frogs (Ranidae: Rhacophorinae: Philautus) from Sri Lanka. The Raffles Bulletinof Zoology, Supplement No. 12:305-338.333235P. hallidayiP. altoP. femoralisP. asankaiP. sp.P. zorroPethiyagoda, R. and Manamendra-Arachchi, K. 1998. Evaluating Sri Lanka’s amphibiandiversity. Occasional Papers of the Wildlife Heritage Trust 2:1-12.Savage, J. 2002. The <strong>Amphibian</strong>s and Reptiles of Costa Rica: A Herpetofauna Between TwoContinents Between Two Seas. University of Chicago Press, Chicago, Illinois, U.S.A.Schneider, C.J., Cunningham, M. and Moritz, C. 1998. Comparative phylogeographyand the history of endemic vertebrates in the Wet Tropics rainforests of Australia.Molecular Ecology 7:487-498.Schneider, C.J. and Williams, S.E. 2005. Effects of Quaternary Climate Change onRainforest Diversity: Insights from Spatial Analyses of Species and Genes inAustralia’s Wet Tropics. In: E. Bermingham, C.W. Dick, and C. Moritz (eds.), TropicalRainforests: Past, Present, and Future, pp. 401-424. University of Chicago Press,Chicago, Ilinois, USA.
48Threatened <strong>Amphibian</strong>s of the WorldESSAY 4.4. THE EFFECTS OF PESTICIDES ON AMPHIBIANSSince the general recognition of global amphibian declines in the early1990s, biologists have sought to determine the underlying causes (Alford andRichards 1999; Stuart et al. 2004). During the past two decades, a numberof hypotheses have been developed and it seems likely that many declineshave a multitude of causes. One leading hypothesis is that some amphibianpopulations are declining due to exposure to chemical contaminants includingthe more than 10 billion kg of globally applied pesticides (U.S.E.P.A. 1997).Understanding all of the mechanisms by which contaminants may impactamphibian populations is certainly a difficult proposition because there aremore than 80,000 registered chemicals in the United States alone, and theregistration process does not require any tests on amphibians. Thus, the effectof pesticides on amphibian populations remains a very large and open question.Below, I very briefly review the evidence linking pesticides to amphibiandeclines and then discuss the various mechanisms by which pesticides affectamphibians and thereby potentially cause declining populations.The evidence supporting a connectionbetween pesticides and amphibian declinesDocumenting a definitive link between pesticides and the decline of any organismin nature is a monumental task because it requires long-term monitoringdata over large regions (because amphibian populations are normally quitevariable over time) and, ideally, the ability to conduct controlled experimentsat these same scales. Given the virtual impossibility of such a task, perhapsthe best hope is to document pesticide-related patterns of declines in natureat large geographic scales and then identify the most likely mechanism(s)using smaller, more feasible experimental scales. This is the approach thathas been employed by amphibian biologists during the past decade.The most extensive regional data examining patterns of declines comefrom the western United States where a number of amphibian species areexperiencing population declines across a large regional scale. By combiningdetailed records of annual pesticide use in the Central Valley of Californiawith surveys of hundreds of amphibian populations in the Sierra NevadaMountains, Davidson et al. (2001, 2002) found a positive correlation betweenpopulation declines and the amount of agricultural land that is upwind.Subsequently, Davidson (2004) found a correlation between declining populationsand the actual amount of pesticides that are applied upwind (Figure 1).<strong>Amphibian</strong>s in these mountain sites contain pesticides in their tissues andreduced acetylcholine esterase activity (i.e., a signal of insecticide exposure;Datta et al. 1998, Sparling et al. 2001), further strengthening the hypothesisthat pesticides may indeed be the underlying cause. If pesticides are a causeof amphibian declines, we need to consider the possible mechanisms bywhich this could occur.Mechanism #1: Direct toxicityThe most obvious mechanism by which pesticides could cause amphibiandeclines is via direct toxicity. There are two key issues concerning this mechanism.First, because very high concentrations of pesticides are almost alwayslethal to amphibians, we must consider the actual concentrations that anamphibian would experience in nature. Second, to cause a population decline,the amount of death due to the pesticide would have to be over and abovenatural causes of death experienced by amphibians (which can be >90% foramphibian larvae; reviewed in Relyea 2007). For some pesticides includingthe herbicide Roundup® (Monsanto Corp., St. Louis, MO), researchers haveobserved 70-100% mortality of larval amphibians at concentrations that havebeen observed in nature (Relyea 2005; Relyea et al. 2005). However, for manyof the pesticides that have been tested, including some of the most commoninsecticides (e.g., carbamates and organophosphates), the concentrationsthat cause amphibian death are above those concentrations that are mostcommonly found in nature (Boone and Semlitsch 2001; Relyea 2004) althoughseasonal spikes in pesticide use may make these rare, high concentrationevents quite important to amphibian populations. In either case, it is clearthat we should also consider alternative mechanisms for how pesticidesmight cause amphibian declines.Mechanism #2: Sublethal effects on amphibianbehaviour, physiology, and endocrinologyOne of the most striking discoveries in recent years is that pesticides can havesome surprising and unintended effects on amphibians at very low, sublethalconcentrations. Analogous to the side effects of human drugs, pesticides arenow known to alter animal behavior in ways that can reduce feeding, impairlocomotion, and weaken predator avoidance (Weis et al. 2001). Pesticides canalso compromise the immune system, making amphibians more susceptible toparasites and pathogens (Christin et al. 2003). Moreover, there appears to bea correlation between the frequency of amphibian malformations (e.g., extraor missing limbs) and the proximity of agricultural land (Taylor et al. 2005).Perhaps the most striking discovery is that some pesticides (e.g., atrazine) atvery low concentrations (i.e., within drinking water standards) can mimic sexhormones and cause adult male frogs to become feminized and grow eggs intheir testes (Hayes et al. 2002; Hayes 2004). While these effects are certainlydramatic, it is currently unclear as to whether they can subsequently resultin amphibian population declines.Mechanism #3: Synergistic effects betweenpesticides and other stressorsOne way in which low concentrations might impact amphibian populationsis by interacting with other natural stressors and becoming more lethal thanwe appreciate. Traditional pesticide testing is done on a single speciesunder laboratory conditions that typically lack any natural environmentalstressors. In contrast, there are wide variety of stressors that occur in natureincluding elevated temperature, reduced pH, increased ultraviolet radiation,competition, and the threat of predation. To date, very few pesticides havebeen tested on amphibians in combination with different natural stressors,but the results thus far have been quite surprising; insecticides can becomemore lethal at higher temperatures (Boone and Bridges 1999) and morelethal when combined with the smell of predators in the water (Relyea2003; Figure 2). The physiological mechanisms underlying these synergisticinteractions are not yet known, but it is clear that natural stressors canmake seemingly sublethal concentrations of pesticides become highlylethal to amphibians.Mechanism #4: Indirect effects througha food web<strong>Amphibian</strong>s live in diverse ecological communities with a network of interactions,yet traditional pesticide testing is conducted on single species in thelaboratory. As a result, we know relatively little about how low concentrationsof pesticides that cannot directly kill amphibians might indirectly affectamphibians via changes in the food webs that contain amphibians. Theseeffects can initially be positive if pesticides reduce or remove populations ofamphibian predators whereas the changes can be negative when pesticidesaffect the food available to amphibians (Boone and Semlitsch 2001; Relyea2005). Reduced food availability commonly reduces amphibian growth whichcan have long-term effects on the time to reproduction (i.e. generation time),future survival, and reproductive output (i.e., the number of eggs that can belaid; Relyea 2007). However, we do not yet know whether these indirect foodweb effects impact the population sizes of amphibians.< 0.2 kg/m69% present0.2 - 5.2 kg/m45% present5.2 - 99 kg/m32% present> 99 kg/m17% presentFigure 1. Statewide patterns of declines in populations of five amphibianspecies (Rana muscosa, R. boylii, R. cascadae, R. draytonii and Bufocanorus) throughout California and the amount of pesticide appliedupwind of each site. The general pattern suggests a connection betweenpesticide use and amphibian declines (figure courtesy of Carlos Davidsonbased on data from Davidson 2004).
Chapter 4. The State of the World’s <strong>Amphibian</strong>s 49ConclusionsConfirming the role of pesticides in the global decline of amphibians is anextremely daunting task, but it is being rapidly addressed by researchers. Sincerealizing that amphibians were declining globally, we have been accumulatingadditional regional datasets on amphibian populations to assess their statusand to test for correlative patterns with regional pesticide use. At the sametime, experimentalists are rapidly delving into the wide range of possiblemechanisms whereby pesticides might affect amphibians and discoveringsome mechanisms that were inconceivable only a decade ago. Unfortunately,most pesticide research is being conducted in North America and Europe on asmall fraction of the 6,000-odd amphibian species that exist (and mostly on thelarval stage), making our current power of inference rather limited (Schiesariet al. 2007). If pesticides are contributing to amphibian declines in nature, wewill continue to require a multi-faceted approach from many sources of datato develop a solid case. A solid case is critical because it must withstand thedoubtless challenges that will follow from the manufacturers and applicatorsof pesticides around the world. Importantly, while scientists can provide thedata demonstrating the impacts of pesticides on amphibians, only societies candetermine whether or not demonstrated pesticide impacts are acceptable.ReferencesRick RelyeaAlford, R.A. and Richards, S.J. 1999. Global amphibian declines: A problem in appliedecology. Annual Review of Ecology and Systematics 30:133-165.Boone, M.D. and Bridges, C.M. 1999. The effect of temperature on potency of carbarylfor survival of tadpoles of green frog (Rana clamitans). Environmental Toxicology andChemistry 18:1482-1484.Boone, M.D. and Semlitsch, R.D. 2001. Interactions of an insecticide with larval densityand predation in experimental amphibian communities. Conservation Biology15:228-238.Christin M.S., Gendron A.D., Brousseau P., Menard L., Marcogliese D.J., Cyr D., Ruby S.and Fournier M. 2003. Effects of agricultural pesticides on the immune system ofRana pipiens and on its resistance to parasitic infection. Environmental Toxicologyand Chemistry 22:1127-1133.Datta, S., Hansen, L., McConnell, L., Baker, J., LeNoir, J. and Seiber, J.N. 1998. Pesticidesand PCB contaminants in fish and tadpoles from the Kaweah River basin, California.Bulletin of Environmental Contamination and Toxicology 60:829-836.Davidson, C. 2004. Declining downwind: <strong>Amphibian</strong> population declines in California andhistorical pesticide use. Ecological Applications 14:1892-1902.Davidson, C., Shaffer, H.B. and Jennings, M.R. 2001. Declines of the California red-leggedfrog: Climate, UV-B, habitat, and pesticides hypotheses. Ecological Applications11:464-479.Davidson, C., Shaffer, H.B. and Jennings, M.R. 2002. Spatial tests of the pesticide drift,habitat destruction, UV-B, and climate-change hypotheses for California amphibiandeclines. Conservation Biology 16:1588-1601.Hayes, T.B. 2004. There is no denying this: Defusing the confusion about atrazine.Bioscience 54:1138-1149.Hayes, T.B., Collins, A., Lee, M., Mendoza, M., Noriega, N., Stuart, A.A. and Vonk, A. 2002.Hermaphroditic, demasculinized frogs after exposure to the herbicide atrazine at lowecologically relevant doses. Proceedings of the National Academy of Sciences of theUnited States of America 99:5476-5480.Relyea, R.A. 2003. Predator cues and pesticides: A double dose of danger for amphibians.Ecological Applications 13:1515-1521.Relyea, R.A. 2004. Synergistic impacts of malathion and predatory stress on six species ofNorth American tadpoles. Environmental Toxicology and Chemistry 23:1080-1084.Relyea, R.A. 2005. The impact of insecticides and herbicides on the biodiversity andproductivity of aquatic communities. Ecological Applications 15:618-627.Relyea, R.A. 2007. Getting out alive: How predators affect the decision to metamorphose.Oecologia 152:389-400.Relyea, R.A., Schoeppner, N.M. and Hoverman, J.T. 2005. Pesticides and amphibians: Theimportance of community context. Ecological Applications 15:1125-1134.Schiesari, L., Grillitsch, B. and Grillitsch, H. 2007. Biogeographic biases in researchand their consequences for linking amphibian declines to pollution. ConservationBiology 21:465-471.Sparling, D.W., Fellers, G.M. and McConnell, L.L. 2001. Pesticides and amphibianpopulation declines in California, USA. Environmental Toxicology and Chemistry20:1591-1595.Stuart, S.N., Chanson, J.S., Cox, N.A., Young, B.E., Rodrigues, A.S.L., Fischman, D.L.and Waller, R.W. 2004. Status and Trends of <strong>Amphibian</strong> Declines and ExtinctionsWorldwide. Science 306:1783-1786.Taylor, B., Skelly, D., Demarchis, L.K., Slade, M.D., Galusha, D. and Rabinowitz, P.M. 2005.Proximity to pollution sources and risk of amphibian limb malformation. EnvironmentalHealth Perspectives 113:1497-1501.U.S.E.P.A. 1997. Pesticides Industry Sales and Usage. Report # 733-R-97-002. Washington,DC. USA.Weis, J.S., Smith, G., Zhou, T., Santiago-Bass, C. and Weis, P. 2001. Effects of contaminantson behavior: Biochemical mechanisms and ecological consequences.Bioscience 51:209-217.Figure 2. The synergistic impacts of an insecticide (carbaryl) on bullfrogtadpoles when combined with the presence or absence of predator odoursin the water. When no insecticide is present, there is low mortality withor without the odour of predators. When the insecticide is present at highconcentrations (6.5 mg/L) there is high mortality with or without the odour ofpredators. However, at intermediate concentrations (0.6 mg/L), there is lowmortality in the absence of predator odours, but 46 times higher mortality inthe presence of predator odours.No pesticide1.6 mg/l of carbaryl6.5 mg/l of carbaryl100%100%100%80%80%80%60%60%60%SurvivalSurvivalSurvival40%40%40%20%20%20%0%0 4 8 12 16Day0%0 4 8 12 16Day0%0 4 8 12 16DayNo predator odors Predator odorsESSAY 4.5. CHYTRIDIOMYCOSIS: DRIVER OF AMPHIBIAN DECLINES AND EXTINCTIONS<strong>Amphibian</strong> populations are declining at alarmingly rapid rates worldwideand species are disappearing from entire regions. A greater proportion ofamphibians are at imminent risk of extinction than any other animal class,including birds. Some have already been lost forever. While habitat loss,overexploitation and the other “usual suspects” are partly to blame, thefactor driving amphibians most rapidly to extinction is the emergence of thevirulent fungal disease, chytridiomycosis. Chytridiomycosis is caused by afungus in the order chytridiales (the chytrid fungi) called Batrachochytriumdendrobatidis. This fungus was unknown until 1998, when it was simultaneouslydiscovered as the primary cause of catastrophic amphibian declines inthe rain forests of Australia and Central America (Berger et al. 1998). Whilemany chytrid fungi are parasites of invertebrates, B. dendrobatidis is the onlychytrid fungus known to infect vertebrates. Although the fungus is knownonly to infect amphibians, it has low host specificity having thus far beenrecorded infecting at least 14 families and over 100 species of amphibianon five continents.Although B. dendrobatidis was unknown until the late 1990s, retrospectivestudies have shown it to have been a major cause of amphibian declines atleast as far back as the 1970s. Many amphibian declines considered to havebeen due to other reasons at the time, such as predation or competition byintroduced species, or stress and disruption by human activities, are nowknown to have been due – at least in part - to chytridiomycosis (Green andSherman 2001; Green et al. 2002; Muths et al. 2003; Carey et al. 2006).The primary hypothesis for the emergence of chytrid-caused declinesis the exposure of naïve host populations to a newly introduced pathogen,although other hypotheses (such as a change in a pre-existing host-pathogenrelationship) have not yet been discounted (Cunningham et al. 2003;Weldon et al. 2004). Some amphibian species, such as the North AmericanBullfrog (Rana catesbeiana) (Daszak et al. 2004) and the African ClawedFrog (Xenopus laevis) (Weldon et al. 2004), are generally unaffected by B.dendrobatidis infection and there has been speculation these species mightact as transport hosts, introducing the infection to new areas and to new hostspecies and populations (Mazzoni et al. 2003; Weldon et al. 2004; Garneret al. 2006). The global trade in amphibians, which began in the 1930s withthe trade in Xenopus laevis for pregnancy testing, mushroomed in the 1970sand 1980s with the widespread harvesting of wild frogs in India, Indonesiaand China for the international restaurant trade. The level of internationaltrade continues to rise with the development of commercial frog farms inAsia and Latin America that export bullfrogs and other ranid species for theNorth American and European markets. There is evidence that this trademight be a major driver of the current chytridiomycosis pandemic (Mazzoniet al. 2003; Weldon et al. 2004; Garner et al. 2006; Kusrini and Alford 2006;Cronin et al. in press).Infection with B. dendrobatidis is limited to the keratinized tissues of theanimal: the most superficial, keratinized, cells of the skin in metamorphosedamphibians, and the mouthparts of anuran larvae (Daszak et al. 1999; Bergeret al. 2005). The infection is intracellular (i.e. the fungus grows within theskin cell) and discharge tubes open onto the surface of the cell for therelease of zoospores, the infective stage of the fungus. The presence of thefungus induces a number of host responses, including, in metamorphosedanimals, hyperkeratosis, irregular foci of hyperplasia, disordered epidermalcell layers, spongiosis, erosion and ulceration of the skin. Areas of the skinmore frequently in close contact with the water, such as the digits and thepelvic patch, are more severely affected (Berger et al. 1998). Inflammatoryresponses in the dermis are mild, if at all present, and involve mononuclearcells. Inflammation within the epidermis is rare. The lack of an immuneresponse might be due to a lack of stimulation of the host immune systemas the site of infection is both superficial and intracellular. Also, the degreeof tissue damage is very low. There is no evidence of immuno-suppressioneither as an underlying factor to, or as a consequence of, B. dendrobatidisinfection (Berger et al. 1999).Signs of the disease include lethargy, loss of righting reflex and abnormalposture. Gross lesions are usually not apparent, but increased epidermalsloughing, epidermal ulceration and reddening (hyperaemia) of the digitaland ventral skin have been reported (Daszak et al. 1999; Berger et al. 2000).Diagnosis is by visualization of the characteristic intracellular zoosporangiain the keratinized epidermis using either cytology of sloughed skin orhistopathology of skin samples (e.g., toe-clip biopsies or post-mortem skinsamples). Molecular techniques, such as the polymerase chain reaction (PCR)and quantitative PCR, have largely superseded cytology and histopathologyfor rapid diagnosis and for screening large numbers of animals.Despite almost a decade of research on chytridiomycosis, there is stillmuch that remains unknown. The exact mechanism by which B. dendrobatidiscauses mortality is not known, but there are currently three possiblemechanisms hypothesized. Firstly, the chytrid might release toxins, suchas proteolytic enzymes, which are absorbed to cause systemic poisoning.Secondly, epidermal hyperplasia may impair cutaneous respiration and/orosmoregulation (Berger et al. 1998, 2005). Thirdly, a combination of both ofthese mechanisms might be involved (Daszak et al. 1999). The absence of anyspecific internal lesions suggests that the ultimate cause of death probablyis either metabolic or toxic (Berger et al. 1999).Although several life-history (e.g., low fecundity) and ecological (e.g.,riparian, montane habitat) factors have been shown to correlate with populationdeclines due to chytridiomycosis, these might be solely indicators of a
50Threatened <strong>Amphibian</strong>s of the WorldBatrachochytrium dendrobatidis infection in the superficial, keratinized layerof skin sloughed from an adult North American bullfrog. Note focal thickeningof the sloughed skin with numerous subspherical empty sporangia. Onesporangium still contains zoospores (arrow). © Andrew Cunningham, ZSL.population’s ability to respond to any stochastic factor (amphibians in riparian,montane habitats tend to have small and restricted ranges). Infection with B.dendrobatidis is highly variable between species: some species (e.g., Ranacatesbeiana, Xenopus laevis) become infected, but show no evidence ofdisease, while others (e.g., Atelopus spp.) appear to be highly susceptibleto infection, with very high mortality rates. However, within a species,there are differences in response, depending on variables such as dose ofexposure, temperature and humidity. Therefore, a chytrid-positive populationmight appear to be resistant, only to decline markedly following a changein environmental conditions.Addressing the threat of chytridiomycosis is not easy. We are used totackling species threats by introducing or increasing protection measuresof the animals and/or their habitats. Pathogens respect neither the law norprotected areas. In fact, many of the most devastating effects of chytridiomycosishave occurred in pristine and protected areas, such as rainforestreserves in Australia and Central America. Although B. dendrobatidis canbe killed by a range of antifungal medications, it is both impractical andecologically dangerous to attempt such treatments in the wild. The diseaseand causative agent were unknown until less than 10 years ago and there isstill much to learn about the biology, ecology and distribution of the pathogen.Currently, our only defense is to bring vulnerable species into captivityuntil alternative approaches are devised. These are massive challenges tothe zoo and conservation research communities. If we are to avoid losing asubstantial proportion (the majority?) of the world’s amphibians in the faceof this daunting threat, these communities need to raise their game to a newlevel of cooperation along the lines of a Manhattan project-style responsefor amphibian conservation.ReferencesAndrew A. Cunningham and Peter DaszakBerger, L., Hyatt, A.D., Speare, R. and Longcore, J.E. 2005. Life cycle stages of theamphibian chytrid Batrachochytrium dendrobatidis. Diseases of Aquatic Organisms68:51-63.Berger, L., Speare, R., Daszak, P., Green, D.E., Cunningham, A.A., Goggin, C.L., Slocombe,R., Ragan, M.A., Hyatt, A.D., McDonald, K.R., Hines, H.B., Lips, K.R., Marantelli, G.and Parkes, H. 1998. Chytridiomycosis causes amphibian mortality associated withpopulation declines in the rain forests of Australia and Central America. Proceedings ofthe National Academy of Sciences of the United States of America 95:9031-9036.Berger, L., Speare, R. and Hyatt, A.D. 1999. Chytrid fungi and amphibian declines: overview,implications and future directions. In: Campbell A. (ed) Declines and disappearancesof Australian frogs. Environment Australia: Canberra 1999:23-33.Carey, C., Bruzgul, J.E., Livo, L.J., Walling, M.L., Kuehl, K.A., Dixon, B.F., Pessier, A.P., Alford,R.A. and Rogers, K.B. 2006. Experimental exposures of boreal toads (Bufo boreas) to apathogenic chytrid fungus (Batrachochytrium dendrobatidis). EcoHealth 3:5-21.Cronin, A.O., Maranda, L., Pokras, M. and Daszak, P. in press. Wildlife trade into the Port of NewYork 2000-2003: Assessment of the risk to public health and conservation. Ecohealth.Cunningham, A.A., Daszak, P. and Rodríguez, J.P. 2003. Pathogen pollution: defining a parasitologicalthreat to biodiversity conservation. Journal of Parasitology 89:S78-S83.Daszak, P., Berger, L., Cunningham, A.A., Hyatt, A.D., Green, D.E. and Speare, R. 1999.Emerging infectious diseases and amphibian population declines. Emerging InfectiousDiseases 5:735-748.Daszak, P., Strieby, A., Cunningham, A.A., Longcore, J.E., Brown, C.C. and Porter, D.2004. Experimental evidence that the bullfrog (Rana catesbeiana) is a potential carrierof chytridiomycosis, an emerging fungal disease of amphibians. HerpetologicalJournal 14:201-207.Garner, T.W.J., Perkins, M.W., Govindarajulu, P., Seglie, D., Walker, S.F., Cunningham,A.A. and Fisher, M.C. 2006. The emerging amphibian pathogen Batrachochytriumdendrobatidis globally infects introduced populations of the North American bullfrog,Rana catesbeiana. Biology Letters 2:455-459.Green, D.E., Converse, K.A. and Schrader, A.K. 2002. Epizootiology of sixty-four amphibianmorbidity and mortality events in the USA, 1996-2001. Annals of the New YorkAcademy of Science 969:323-339.Green, D.E. and Sherman, C.K. 2001. Diagnostic histological findings in Yosemite toads(Bufo canorus) from a die-off in the 1970s. Journal of Herpetology 35:92-103.Kusrini, M.D. and Alford, R.A. 2006. Indonesia’s Exports of Frogs’ Legs. TRAFFIC Bulletin21:13-24.Mazzoni, R., Cunningham, A.C., Daszak, P., Apolo, A., Perdomo, E. and Speranza, G.2003. Emerging pathogen of wild amphibians in frogs (Rana catesbiana) farmed forinternational trade. Emerging Infectious Diseases 9:995-998.Muths, E., Corn, P.S., Pessier, A.P. and Green, D. E. 2003. Evidence for disease-relatedamphibian decline in Colorado. Biological Conservation 110:357-365.Weldon, C., du Preez, L.H., Hyatt, A.D., Muller R. and Speare, R. 2004. Origin of the amphibianchytrid fungus. Emerging Infectious Diseases 10:2100-2105.ESSAY 4.6. CLIMATE CHANGE AND AMPHIBIAN DECLINESEvidence that climate change is currently affecting life on earth has becomeoverwhelming in the last few years. Although some continue to question thelink between global warming and human activity, the rate of current trends intemperature shifts is vastly different from past global climate change events.For example, in lower elevation cloud forests in the Andes, the warming trendexperienced from the 1970s to the present is 18 times faster than at the endof the last ice age (Bush et al. 2004). Species of plants and animals in manydifferent taxonomic groups and regions of the world are already respondingto warming, by shifting their ranges uphill or towards the poles and trackingcooler environments (Walther et al. 2002). The timing of seasonal cycles, suchas flowering in plants and migration in birds, has also been shifting with thechanging climate (Root et al. 2003). Spawning dates and breeding migrationsin a number of amphibian species have already become significantlyearlier (Root et al. 2003). Although these changes might appear trivial, theydo alter the composition and dynamics of communities, with complex andunpredictable outcomes. For example, in Britain, newts are now arrivingmuch earlier at breeding ponds, allowing their predatory larvae to be muchlarger by the time frogs arrive. This may be detrimental for frog species thatnow deposit their eggs and tadpoles into pools full of hungry newt larvae(Beebee 1995). Along with changes in species’ ranges and phenology, currentmodels predict a great loss of species in the future due to a warmer and moreextreme climate (Thomas et al. 2004). In fact, climate change may alreadybe causing extinctions.Declines and disappearances of amphibian populations have becomeincreasingly apparent in the past 20 years. Some declines appear to beexplained by clear anthropogenic effects such as habitat loss, while others,with less apparent causes, have been classified as “enigmatic” (Stuart etal. 2004). Research activity has increasingly focused on determining thecauses of these declines. High-elevation species seem to be most affected,and based on the fate of known species it appears that many have probablydisappeared prior to being described. In the Neotropics, harlequin frogs of thegenus Atelopus appear to have been most affected by “enigmatic declines”.A number of undescribed Atelopus species collected by South Americanherpetologists are currently awaiting description. In the short time since thesespecies were collected, scientists have returned to their original collectionsites only to find that most of these undescribed species have vanishedfrom their apparently pristine environments. Many more species are likelyto have become extinct before even being collected. For instance, in manycountries, most historical collection sites are directly adjacent to a highwayor rural road, while vast tracts of land remain almost entirely unsurveyed. Thismakes it likely that many species unknown to science have already been lost.The situation is even worse when we take molecular evidence into account.Cryptic species that looked extremely similar to each other were probablyhidden among some of the widespread species. We may never know howmany species we have truly lost.Could amphibian disappearances be attributed to global warming patterns?Skeptics have voiced critical opinions on this idea. <strong>Amphibian</strong>s havebeen on earth for at least 280 million years, persisting through at least 60glacial periods in the last 12 million years alone. So why would the recenttemperature shifts be more threatening to amphibians than the ever-changingenvironment they evolved in? The answer may be found in the interactionbetween climate change and another variable – disease.Climate change is already impacting human health by facilitating thespread of disease, causing an estimated 150,000 deaths a year (Patz et al.Atelopus zeteki (Critically Endangered) from El Cope, Panama, taken about nine months before the population crash happened at that site. © Ross A. Alford2005). As with humans, a synergistic interaction between temperature changeand infectious disease may explain many of the recent disappearances ofamphibians. One disease for which this synergism may be important is thechytrid fungus Batrachochytrium dendrobatidis, which infects the skin ofamphibians, causing the disease chytridiomycosis. Outbreaks of this diseasehave occurred in apparently naïve populations, and are clearly linked to theextirpation of frog communities in the immediate range of harlequin frogs(Lips et al. 2006). Approximately 80% of missing harlequin frog speciesvanished directly after a relatively warm year (Pounds et al. 2006; see Figure1). The probability of this correlation occurring by chance is less than one ina thousand. In the laboratory, B. dendrobatidis grows best at temperaturesbetween 17 and 25°C, but grows more slowly outside this range, and maynot cause disease at temperatures over 30°C (Piotrowski et al. 2004). Evenshort periods at body temperatures of 37°C can clear frogs of infections bythe pathogen (Woodhams et al. 2003). Such temperatures may be experiencedby frogs after a short period in direct sunlight, but cannot be attained underheavy cloud cover. Although it has been suggested that the probability ofpopulation declines increases with altitude, this does not seem entirely
Chapter 4. The State of the World’s <strong>Amphibian</strong>s 51true for harlequin frogs. Pounds et al. (2006) demonstrate that patterns ofextinction in harlequin frogs vary at different altitudes, and suggest that theyare caused by interactions among temperature, atmospheric moisture, cloudcover, and host-pathogen dynamics. This hypothesis could be tested in otherregions of the world, such as Australia, where the patterns of declines inamphibian populations show many parallels with those in the Neotropics.In eastern Queensland, Australia, at least 14 species have experienceddeclines in recent decades, with six species disappearing altogether, andothers becoming locally extinct at high-elevation sites. Batrachochytriumdendrobatidis has been implicated in most of these declines. In these areas,where B. dendrobatidis now appears to be endemic, patterns of infectionand mortality are consistent with the climate-linked epidemic hypothesis,with infection levels and mortality highest during cooler months (Berger etal. 2004; Retallick et al. 2004; McDonald et al. 2005; Woodhams and Alford2005). Future predictions for amphibians in the region are grim, with 13 to68% of frog species endemic to Queensland predicted to become extinct underfuture climate scenarios (Thomas et al. 2004). This prediction is based on theeffects of changing climatic conditions alone. The true impacts of climatechange may be far more complex and potentially detrimental when actingin synergism with disease.What seems to be clear is that amphibian extinctions are strongly correlatedwith the changing climate. The disappearance of frogs may be anearly warning of a new episode of mass extinction, and this time, there isno cataclysm to blame, only ourselves.ReferencesRobert Puschendorf, Ross A. Alford, and Jodi J.L. RowleyBeebee, T.J.C. 1995. <strong>Amphibian</strong> breeding and climate change. Nature 374:219-220.Berger, L., Speare, R., Hines, H.B., Marantelli, G., Hyatt, A.D., McDonald, K.R., Skerratt,L.F., Olsen, V., Clarke, J.M., Gillespie, G., Mahony, M., Sheppard, N., Williams, C. andTyler, M.J. 2004. Effect of season and temperature on mortality in amphibians due tochytridiomycosis. Australian Veterinary Journal 82:434-439.Bush, M.B., Silman, M.R. and Urrego, D.H. 2004. 48,000 years of climate and forest changein a biodiversity hot spot. Science 303:827-829.Lips, K.R., Brem, F., Brenes, R., Reeve, J.D., Alford, R.A., Voyles, J., Carey, C., Livo, L.,Pessier, A.P. and Collins, J.P. 2006. Emerging infectious disease and the loss of biodiversityin a Neotropical amphibian community. Proc Natl Acad Sci USA 103:3165-3170.McDonald, K.R., Méndez, D., Müller, R., Freeman, A.B., and Speare, R. 2005. Decline inthe prevalence of chytridiomycosis in frog populations in North Queensland, Australia.Pacific Conservation Biology 11:114-120.Patz, J.A., Campbell-Lendrum, D., Holloway, T. and Foley, J.A. 2005. Impact of regionalclimate change on human health. Nature 438:310-317.Piotrowski, J., Annis, S. and Longcore, J.E. 2004. Physiology of Batrachochytrium dendrobatidis,a chytrid pathogen of amphibians. Mycologia 96:9-15.Pounds, J.A., Bustamante, M.R., Coloma, L.A., Consuegra, J.A., Fogden, M.P., Foster, P.N.,La Marca, E., Masters, K.L., Merino-Viteri, A., Puschendorf, R., Ron, S.R., Sanchez-Azofeifa, G.A., Still, C.J. and Young, B.E. 2006. Widespread amphibian extinctionsfrom epidemic disease driven by global warming. Nature 439:161-167.Retallick, R.W.R., McCallum, H. and Speare, R. 2004. Endemic infection of the amphibianchytrid fungus in a frog community post-decline. PLoS Biology 2:1965-1971.Root, T.L., Price, J.T., Hall, K.R., Schneider, S.H., Rosenzweig, C. and Pounds, J.A. 2003.Fingerprints of global warming on wild animals and plants. Nature 421:57-60.Stuart, S.N., Chanson, J.S., Cox, N.A., Young, B.E., Rodrigues, A.S.L., Fischman, D.L.and Waller, R.W. 2004. Status and Trends of <strong>Amphibian</strong> Declines and ExtinctionsWorldwide. Science 306:1783-1786.Thomas, C.D., Cameron, A., Green, R.E., Bakkenes, M., Beaumont, L.J., Collingham, Y.C.,Erasmus, B. F. N., de Siquera, M.F., Grainger, A., Hannah, L., Hughes, L.S., Huntley,B., van Jaarsveld, A.S., Midgley, G.F., Miles, L., Ortega-Huerta, M.A., Peterson, A.T.,Phillips, O.L. and Williams, S.E. 2004. Extinction risk from climate change. Nature427:145-148.Walther, G.-R., Post, E., Convey, P., Menzel, A., Parmesank, C., Beebee, T.J.C., Fromentin,J.-M., Hoegh-Guldberg, O. and Bairlein, F. 2002. Ecological responses to recent climatechange. Nature 416:389-395.Tropical AT (ºC)0,8 –0,6 –0,4 –0,2 –0 –1985 1988 19911982 1994YearFigure 1. Last year of observation in harlequin frog species for which thereis sufficient population data (red line) and air temperature for the tropics (ºC)of the preceding year (blue line). Reproduced, with permission of authors,from Pounds et al. 2006 (Nature 439:161-167).Woodhams, D.C., Alford, R.A. and Marantelli, G. 2003. Emerging disease of amphibianscured by elevated body temperature. Diseases of Aquatic Organisms 55:65-67.Woodhams, D.C. and Alford, R.A. 2005. The Ecology of Chytridiomycosis in RainforestStream Frog Assemblages of Tropical Queensland. Conservation Biology 19:1449-1459.– 12– 10– 8– 6– 4– 2– 0Number of speciesESSAY 4.7. THE STATUS OF THE CHINESE GIANT SALAMANDER ANDRIAS DAVIDIANUSThe Chinese Giant Salamander Andrias davidianus, is the largest living amphibian,with adults reaching a total length of more than 200cm and a weight of50kg (Peng et al. 1998). Although very similar to its congener, the Japanese GiantSalamander Andrias japonicus, the Chinese Giant Salamander differs in the arrangementof tubercles on the head and throat, which are mostly in pairs, andmuch smaller and fewer than those of its Japanese cousin. The snout is also lessrounded and the tail a little longer in the Chinese species. The species is referredto locally as wawayu (baby fish), because its call resembles a baby’s cry.Formerly widespread in China, most local wild populations of the Chinese GiantSalamander have declined greatly in both range and number since the 1950s,largely due to habitat fragmentation or loss, and as a result of overharvesting forhuman consumption. Recent surveys show that the Chinese Giant Salamanderis distributed in a few mountainous areas in the middle and lower tributaries ofthe Yangtze, Yellow and Pearl Rivers, across the 17 provinces of Henan, Shaanxi,Shanxi, Gansu, Qinghai, Sichuan, Chongqing, Guizhou, Hubei, Anhui, Zhejiang,Jiangxi, Hunan, Fujian, Yunnan, Guangdong and Guangxi (Wang et al. 2004).Many populations are now on the verge of extinction, and some are alreadyextinct (Zhao 1998; Zhang and Wang 2000). Today, because of this continuing,drastic, population decline the Chinese Giant Salamander is listed as CriticallyEndangered on the IUCN Red List of Threatened Species.Although habitat loss is certainly a threat, uncontrolled harvesting is the primaryreason for the steep decline in numbers of Chinese Giant Salamander. Beforethe wildlife protection act was declared by the Chinese government in 1988, theChinese Giant Salamander was a legal fishery product in China. Indeed, there wasalready a marked decline in the number of salamanders being collected from thewild by the 1970s. For example, a traditional company in Taibai county of Shaanxiprovince reported that, while demand remained high, the quantity of ChineseGiant Salamander purchased declined from 3,813kg in 1973 to 1,300kg in 1979,presumably in response to a reduction in wild stocks. Likewise, from the 1950s tothe 1980s, the amount purchased of this species had declined more than 80% insome areas in Hunan and Anhui Provinces (Wang et al. 2004). In addition, whereasthe salamander was found in 28 counties of north-eastern Sichuan Province in the1970s, it appears to have disappeared from 11 of them by the middle of the 1980s.Western Hunan Province had 10 counties with salamanders in the 1960s, but thespecies could only be found in five of them in the 1980s (Liu 1989).Despite protection by the Chinese Government since 1988 (the ChineseGovernment has declared the giant salamander a Class II Protected Species),illegal collection of Chinese Giant Salamander from the wild is still a leadingthreat widely contributing to population declines, and in many countiesthe poaching has actually increased during recent years. Hunters now usepesticides, electrical shock tools, explosives, and other modern methods,instead of traditional bow-hooks to capture salamanders. The increasinguse of such unsustainable methods has resulted in very serious declines insalamander populations. Furthermore, the species is in danger of losing itstitle of “world’s largest amphibian”, as the weights of giant salamanders beingcaptured today appears to be much lower than formerly, presumably due tothe increased hunting pressure. In Sangzhi County in Hunan Province mostindividuals weighed c. 35-40kg; all individuals captured in the same localityduring the 1970s were
52Threatened <strong>Amphibian</strong>s of the WorldThe many problems outlined above suggest that wild populations of theChinese Giant Salamander are on the verge of extinction, particularly if noeffective conservation measures are taken in the immediate future. Thedevelopment and enforcement of a comprehensive conservation strategyand action plan is now urgently needed to prevent the extinction of thisextraordinary amphibian.Zhang Ke-jiaand Wang XiaomingReferencesAnon. 1978. The economic amphibian and reptiles in China. Shanghai Science andTechnology Press, Shanghai, China. [In Chinese]Wang, X.-M., Zhang, K.-J., Wu, W., Wang, Z.-H., Ding, Y.-Z. and Huang, S. 2004. The declineof the Chinese giant salamander and applications for its conservation. Conservationstatus and distribution of Chinese giant salamander. Oryx 38:197-202.Peng, K.-M., Fen, R.-P. and Cheng, X.-P. 1998. The Chinese giant salamander. Journal ofChinese Wildlife 19:11. [In Chinese]Ermi, Z. 1998. China Red Data book of Endangered Animal: Amphibia and Reptilia. SciencePress, Beijing, Hong Kong, China, and New York, USA.Zhang, K.-J. and Wang, X.-M. 2000. Status of conservation biology of Chinese giantsalamander. In: Proceedings of the fourth Asian Herpetological Conference (ed.),pp. 172. Chengdu, China.Liu, G.-J. 1989. The Rare and Precious Animal in China---giant salamander. Chinese Journalof Zoology 24:43-45. [In Chinese.]ESSAY 4.8. AMPHIBIANS AS INVASIVE ALIEN SPECIESWhile only a small proportion of the species that are moved around theworld with human movements and global trade actually cause harm, thosethat do – termed invasive alien species – are devastating. Such “biologicalinvasions” are now considered one of the biggest factors in biodiversityloss and extinctions (Baillie et al. 2004). Many threatened amphibians areheavily impacted by invasive alien species. However, amphibians themselvescan also be invasive. The list of “100 of the world’s worst invasive alienspecies” includes three amphibians, as well as a fungal disease agent, forwhich invasive amphibians are vectors of spread (Lowe et al. 2000; and seewww.gisd.org).Judas’ kiss: the role of invasive amphibians inthe spread of frog chytrid fungus<strong>Amphibian</strong> species have been reported as declining since the 1970s,and in many of them the fungal disease chytridiomycosis is implicated.Moreover, of the recorded nine recent extinctions of amphibians since1980, eight were sudden disappearances in suitable habitats and theyare thought to be the result of this disease, probably operating in synergywith climate change. At first, this may seem to be unrelated to the issueof invasive species, but in fact, it perfectly illustrates the complexity ofbiological invasion issues: not only is the pathogen itself an invasivealien species, but its spread is facilitated by invasive alien species thatare amphibians!The origin of the virulent pathogen Batrachochytrium dendrobatidisis not known with absolute certainty, but a recent study has led tothe conclusion that in all likelihood it originated in Africa. Hence, theimpacts on amphibian populations in the rest of the world result fromthe unintentional introductions of a pathogen as an invasive alien species.In an ironic twist of fate, several invasive frog species play a rolein the exportation of the pathogen out of Africa, its ‘escape” into thewild and its ongoing spread and impact on threatened amphibians. Itis thought to have started with the export, out of Africa, of the AfricanClawed Frog (Xenopus laevis) for use in laboratories. This frog was acarrier of chytridiomycosis, and the establishment of feral populationsof this species in countries where it had been moved to, allowed thepathogen access to other species, such as the American Bullfrog Ranacatesbeiana which now is considered to be one of the main vectors ofthe disease (Weldon et al. 2004). The bullfrog, native in parts of the USAand Canada, is itself a highly invasive species, and has been introducedto Hawaii, parts of western USA and south-western Canada, Mexicoand the Caribbean, South America, Europe and Asia (GISD 2006a). It hasbeen traded internationally as a food item, and within countries it canspread when populations held for culinary use escape and establish.Frog species in the pet trade are also potential agents of spread of thedisease and infected amphibians have been identified in European andUS zoos. In Australia, chytridiomycosis has been found in Cane Toads(Bufo marinus), a recently introduced invasive alien species. Chytrid canpersist in contaminated water or mud and it can hence also be spreadby wet or muddy boots, vehicles, cattle and other animals moving amongaquatic sites. Nevertheless, invasive alien frogs and toads have acted inan (involuntary) ‘Judas’ role, exposing many native species of amphibianaround the world to the pathogen, with disastrous results.Frog eats frogThe American Bullfrog is not only a vector for disease, but is also a highlyinvasive alien species in its own right, affecting native species, amphibianand otherwise, through competition or direct predation. In British Columbia(Canada), for example, it has been recorded in competition with, and predatingupon, the Red-legged Frog (Rana aurora), and in Puerto Rico there havebeen reports of bullfrogs preying on several bird species, including WhitecheekedPintail (Anas bahamensis) (GISD 2006a). In the United States, itsimpacts include: competition with the Relict Leopard Frog (Rana onca, EN),which was once thought to be extinct, in Arizona and Nevada (Bradford etal. 2004); predation on both larval and juvenile Red-legged Frogs in California(Doubledee et al. 2003); and competition with and predation on the OregonSpotted Frog (Rana pretiosa, VU) in Oregon (Pearl et al. 2004).There goes the neighbourhoodThe Caribbean Treefrog, also called the Common Coqui (Eleutherodactyluscoqui) is a relatively small treefrog native to Puerto Rico. While there areecological concerns about its introduction into Hawai’i, it also creates anuisance to people: it is their loud call that is the main reason that manyHawai’ians consider the species as a pest. It is feared that the high-pitchedcall of the frog may affect the tourism industry and there are also concernsthat property value may be affected due to the high biomass of frogs oninfested sites (Kraus and Campbell 2002; GISD 2006b).Cane toad conquestThe Cane Toad is native in parts of South and Central America and parts of theCaribbean. It has been introduced widely throughout the world as a biologicalcontrol agent for various insect pests of sugarcane and other crops. Its alienrange now includes many countries, including parts of the Caribbean whereit is not native, and where, for example, it has been implicated in the declineof the endemic Bermuda Skink (Eumeces longirostris) (Davenport et al. 2001).It has also been introduced in parts of Asia, Australia and the Pacific. TheCane Toad has become a major invasive species in most of its introducedrange. It competes with native amphibians and other animals for food andbreeding habitat, and also directly preys on them. In fact, it has been quotedas eating “almost any terrestrial animal” (Hinkley 1962). In addition, thetoad’s toxicity means that many native predators are killed. For example, inAustralia native snakes have been found dead with the Cane Toad in theirmouths or guts, and in Japan’s remote Iriomote Island, it is feared that therecent arrival of Cane Toads may result in the poisoning of the threatenedIriomote Cat (Prionailurus iriomotensis) (GISD 2006c).In Australia, Cane Toads were introduced to Queensland in 1935 and theyhave since expanded their range to encompass more than a million squarekilometres of tropical and subtropical Australia. When researchers radio-trackedtoads at the “invasion front” they found astonishing locomotor performance,with animals moving up to 1.8km per night during the rainy months. As is thecase with many anurans, toads with longer legs can move faster than thosewith shorter legs. This turned out to be happening at a grand scale in Australia:longer-legged toads were disproportionately common among the first wave ofarrivals at any new site. In general, toads at the invasion front were longerleggedthan toads from older populations, confirming that the invasion processhas been assisted by the evolution of improved dispersal ability among toadsat the front. This means that it would be expected that over many generations,rates of invasion will be accelerated owing to rapid adaptive change in theinvaders. The annual rate of progress of the toad’s invasion through tropicalAustralia has increased about five-fold since the toads first arrived. In otherwords, an already strong invader is actually in the process of getting even betterat it (Philips et al. 2006). This should be a salutary reminder that, as with allalien invasive species, prevention of introduction is the best option, and anymanagement should be undertaken as soon as possible, before the invader hashad time to evolve into a more dangerous adversary.ReferencesMaj de PoorterBaillie, J.E.M., Hilton-Taylor, C. and Stuart, S.N. (eds.) 2004. 2004 IUCN Red list ofThreatened Species. A Global Assessment, pp.Xxiv+191. IUCN, Gland, Switzerlandand Cambridge, UK.Bradford, D.F., Jaeger, J.R. and Jennings, R.D. 2004. Population status and distributionof a decimated amphibian, the relict leopard frog (Rana onca). SouthwesternNaturalist 49:218-228.Davenport, J., Hills, J., Glasspool, A. and Ward. J. 2001. Threats to the Critically Endangeredendemic Bermudian skink Eumeces longirostris. Oryx 35:332-339.Doubledee, R.A., Muller, E.B. and Nisbet, R.M. 2003. Bullfrogs, disturbance regimes,and the persistence of California red-legged frogs. Journal of Wildlife Management.67:424-438Global Invasive Species Database, 2006a. Rana catasbeiana. Available from: http://www.issg.org/database/species/ecology.asp?si=80&fr=1&sts=sss [Accessed 6thSeptember 2006]Global Invasive Species Database, 2006b. Eleutherodactylus coqui. Available from:http://www.issg.org/database/species/ecology.asp?si=105&fr=1&sts=sss [Accessed6th September 2006]Global Invasive Species Database, 2006b. Bufo marinus. Available from: http://www.issg.org/database/species/ecology.asp?si=113&fr=1&sts=sss [Accessed 6thSeptember 2006]Hinkley, A.D. 1962. Diet of the giant toad, Bufo marinus (L.), in Fiji. Herpetologica18:253-259.Kraus, F. and Campbell, E. 2002. Human-mediated escalation of a formerly eradicableproblem: The invasion of Caribbean frogs in the Hawaiian Islands. Biological Invasions4:327-332.Lowe, S., Browne, M., Boudjelas, S., and De Poorter, M. 2000. 100 of the World’s WorstInvasive Alien Species. A selection from the Global Invasive Species Database;Published by ISSG as special lift-out in Aliens 12, December 2000. 12 pp. http://www.issg.org/booklet.pdf (English) http://www.issg.org/spanish.pdf (Spanish)Pearl, C.A., Adams, M.J., Bury, R.B., and McCreary, B. 2004. Asymmetrical effects ofintroduced Bullfrogs (Rana catesbeiana) on native ranid frogs in Oregon. Copeia2004:11-20Phillips, B.L., Brown, G.P. Webb, J.K., and Shine, R. 2006. Invasion and the evolution ofspeed in toads. Nature 439:803.Weldon C., du Preez, L.H., Hyatt, A.D., Muller, R. and Speare, R. 2004. Origin of the <strong>Amphibian</strong>Chytrid Fungus. Emerging Infectious Diseases 10:2100-2105.An African Clawed Toad Xenopus laevis (Least Concern) with a fish in itsmouth. Chytridiomycosis was detected in museum specimens of this speciesdating back to 1938, and one hypothesis posits that the international tradein this species may have introduced this fungal disease to other regions ofthe world. © Carlos Garin LobosThe Cane Toad Bufo marinus (Least Concern), a native of Central and SouthAmerica, has been widely introduced in the Caribbean, the Philippines, Japan,parts of Melanesia and the Pacific Islands and Australia. It was introducedto Australia in 1935 to control sugar cane pests (which it failed to do) fromwhence its name derives. © Craig MorleyIn recent years, Eleutherodactylus coqui (Least Concern), a species native to PuertoRico, has become infamous in the Hawaiian islands, where it probably arrived inplant pots and bromeliads. There, it has spread widely (the Hawaiian archipelagohas no native amphibians) where they reportedly annoy the local people when theysing loudly by windows and in gardens, at night. © Alejandro Sanchez
CHAPTER 5. AMPHIBIANS OF THE AFROTROPICAL REALMFranco Andreone, Alan Channing, Robert Drewes, Justin Gerlach,Frank Glaw, Kim Howell, Malcolm Largen, Simon Loader, Stefan Lötters,Leslie Minter, Martin Pickersgill, Christopher Raxworthy, Mark-Oliver Rödel,Arne Schiøtz, Denis Vallan and Miguel VencesTHE GEOGRAPHIC AND HUMAN CONTEXTThe Afrotropical Realm includes all of mainland Sub-Saharan Africa and the southern ArabianPeninsula 1 , as well as several large offshore islands: Zanzibar and Pemba; Madagascar;the western Indian Ocean islands of the Seychelles (including Aldabra), Mauritius (includingRodrigues), Réunion, Mayotte, and the Comoros; the Gulf of Guinea islands (Bioko,Príncipe, São Tomé and Pagalu); Socotra; and the Cape Verde Islands. Although Africafinally separated from the rest of the southern land-mass of Gondwanaland some 100Ma, the African, Arabian and Eurasian plates abutted at least at the end of the Oligocene,and it is only from about 15-10 Ma that Africa has been an isolated land mass (when theAfrican and Arabian land masses rifted apart; see Kingdon 1989; Goudie 2005). The islandof Madagascar, on the other hand, separated from the African mainland between 165-140Ma and has been isolated (as an island) from all other land masses for 87-91 million years(Storey et al. 1995; Torsvik et al. 2000).An extensive process of rifting which began about 30 Ma has left mainland Africa verydiverse topographically, with many high mountain ranges, especially on the east of thecontinent, and with rift valleys that include some of the deepest lakes in the world. Muchof Africa is still volcanically active, including Mount Kilimanjaro, its highest peak, soaringsome 5,895m above sea-level. A combination of intra-plate hotspots, extensive Cenozoicdoming (45 Ma), vulcanism and coastal upwarp has created the world’s largest plateau.This is characterized by a “basin and swell” topography unique to the interior of the Africancontinent, and stretching from South Africa to East Africa, with high points includingMount Mulanje (3,002m) in southern Malawi and Mount Rungwe (2,691m) in southernTanzania (Beentje et al. 1994; Goudie 2005). East and North-east Africa are bisected by the6,000-km-long Great Rift (or Gregory Rift), the “passive” margin between the African andEast African Plates. This massive feature is visible from space and runs from the LuangwaValley in Zambia, northe-ast through Ethiopia, where it meets the Saudi Arabian Plate andcontinues north-west to the Caucasus Mountains.Not surprisingly, the region is ecologically diverse, with an enormous range of vegetationtypes from deserts to woodlands and grasslands to rainforests. In West Africa, the agriculturallyproductive Guinea and Sudanese savannah regions slowly merge into the lowlandforests stretching across West Africa. A little further to the east, the highly fragmented, lowerGuinea rainforests of Nigeria and western Cameroon open into the vast, lush, relatively intacttropical rainforests of the Congo Basin. Apart from the chain of volcanic mountains centredon western Cameroon and extending into the sea as the Gulf of Guinea islands, West Africahas very few uplands (with the exception of Mount Nimba, and the Loma and other nearbymountains in Sierra Leone, Guinea and Liberia). The eastern edge of the Congo Basin isflanked by the Albertine Rift, a series of high, block-faulted mountain chains that separatesthe Congo Basin rainforest of Central Africa from the forest/savannah mosaic habitats ofEast Africa, most famous for their teeming herds of wildebeest and zebra.To the north the Great Rift cuts through the Ethiopian Highlands, home to more thantwo-thirds of Africa’s unique Afro-alpine habitat, while to the south-east of the Great Riftare the Eastern Arc Mountains that continue into the Southern Highlands of Tanzania southto Mount Mulanje in Malawi and the Chimanimani Highlands of Zimbabwe. Patches of forest(now highly fragmented) fringe the coast of much of eastern Africa, from the Juba andShabelle River Valleys in Somalia south to south-eastern South Africa. In the south-westernpart of South Africa, the unique Mediterranean fynbos vegetation is dominant, with itsremarkable floristic endemism, and further north the Succulent Karoo becomes dominantalong the west coast of South Africa.Africa has a low human population density (approximately 30 people per square kilometerin 2005), of which over 60% live in rural areas, but a high population growth rate (over 2.1%per annum, though this is decreasing). Historically, the region has been subject to relativelylow levels of anthropogenic disturbance, related not only to low human population densities,but also to widespread poverty (gross income per capita was around US$600 in Sub-SaharanAfrican in 2004). However, 35% of the continent’s Gross Domestic Product is concentrated inSouth Africa, where the human impacts on natural ecosystems and biodiversity have beenmore severe than in most of the region. Economic growth rates in Africa have been amongst thelowest in the world and still are, though there has been a recent tendency for somewhat fastergrowth (4.5% in 2004). Although many of Africa’s natural habitats are still intact, some parts ofthe continent have been affected much more than others. Deforestation has been particularlysevere in the Upper Guinea forests of West Africa, in the mountains and lowlands of Nigeria andwestern Cameroon, in many of the mountainous regions of central and East Africa, and in theEast African coastal lowlands. This forest loss has been driven largely by expanding subsistenceagriculture to support the burgeoning human populations, but also by commercial agricultureand logging. As mentioned above, habitat loss and fragmentation has been particularly severein South Africa, and above all in the fynbos vegetation of the extreme south and south-west(which has been heavily impacted by invasive species and fire, and well as by general urbanand agricultural development). There has also been extensive habitat degradation in the semiaridSahel region, much of it driven by over-exploitation of resources for basic subsistence bygrowing human populations. However, in central and south-central Africa, extensive tracts oflowland forest, savannah and grassland remain largely intact. On Madagascar, habitat losshas been especially severe, with almost no natural habitat surviving on the central plateau,and much of the country characterised by very high levels of soil erosion.GLOBAL CONSERVATION STATUSA total of 969 amphibian species are recorded from the Afrotropical Realm, of which 240(25%) are considered threatened (see Figure 1 for details). Although this is significantlyless than the global average of 33% 2 , it is still almost one-quarter of the overall amphibianfauna of the Afrotropics. As is the case globally, the percentage of threatened species isexpected to increase as the status of DD species is clarified, as new species (many of whichare likely to be rare, and have small ranges) are discovered, and as the taxonomic status ofmany species complexes is resolved.The Afrotropical realm currently accounts for about 13% (240) of all globally threatenedamphibian species. When looking at the Red List Categories, the Afrotropics account foronly 7% of CR species, but 14% of the EN species, and 15% of the VU species. Hence, onthe basis of current knowledge, threatened Afrotropical amphibians are more likely to bein a lower category of threat, when compared with the global distribution of threatenedspecies amongst categories. This might partly be explained by the fact that the amphibianfauna is very poorly known in many parts of the continent (for example the Albertine Rift,the Congo Basin, the Ethiopian plateau and the Upper Guinea forests of West Africa),and these are places that could have many threatened species. However, the lower thanaverage level of threat is also likely to be genuine, in part because the fungal disease chytridiomycosis,although present in Africa (Weldon et al. 2004), is not so far believed to bea serious threat in the region (although there are few monitoring programmes, and furtherinformation could change this perception). Species that are threatened by this disease aremore likely to experience sudden and dramatic declines, pushing them very quickly into thehigher categories of threat.Surprisingly, especially for such a poorly known region, the percentage of DD species(22%) is slightly lower than the global average (23%). As more African amphibian speciesare discovered and named, the percentage of DD species might increase for a period, atleast until the conservation status of these species can be adequately assessed.There have been no recorded recent extinctions of amphibians in the Afrotropical Realm.However, of the 33 CR species, three are flagged as Possibly Extinct: Arthroleptides dutoitifrom Mount Elgon in Kenya, which has not been recorded since 1962, despite extensivesearches (Lötters et al. 2003); Nectophrynoides asperginis from the Udzungwa Mountainsin the Eastern Arc of Tanzania (which might have become extinct in the wild in 2004, thoughit still survives in captivity); and Conraua derooi, from the Togo-Volta Highlands of easternGhana and western Togo (previously not recorded since the 1960s 3 ).SPECIES RICHNESS AND ENDEMISMSpecies Richness and Endemism Across TaxaThe 969 native amphibian species in the Afrotropical Realm represent 16% of the currentlyknown global total of 5,915 species. Of these 969 species, 954 (or 98%) are endemic to theAfrotropics (Table 1). The overwhelming majority of African amphibians are frogs and toads(Anura), 98% of which are endemic. All 28 species of Afrotropical caecilian (Gymnophiona)occurring in the region are endemic. Members of the order Caudata (salamanders) arecompletely absent. A total of 618 species (64%) are members of families that are endemicto the region.The amphibian fauna of the Afrotropical Realm has been relatively isolated from that ofthe rest of the world for much of its evolutionary history, and remains so today (the Saharanand Arabian deserts forming an effective, though fairly recent, barrier to most species).This isolation accounts for the high level of family and genus-level endemism within theregion. For example, of the 16 families of amphibians found in the region, nine are alsoendemic. From the perspective of amphibian biogeography, the region is almost defined bythe distribution of the African treefrogs and reed frogs (family Hyperoliidae) (Poynton 1999),which are present through nearly all of Sub-Saharan Africa, Madagascar, the SeychellesIslands, and the Gulf of Guinea islands (though absent from southern Arabia, the Comoros 4 ,the Mascarenes, and the Cape Verde Islands). The amphibian fauna comprises elementswith both tropical and southern temperate origins (Poynton 1999).There are 112 amphibian genera in the Afrotropical Realm, of which 105 (94%) areendemic. These endemic genera represent nearly one-quarter (23%) of the 460 amphibiangenera worldwide. The Afrotropics, therefore, account for a larger proportion of the overalldiversity of amphibians at the generic level than at the species level. The most species-richendemic genus in the region is Hyperolius (125 species). At the opposite end of the spectrum,there are 42 monotypic genera endemic to the Afrotropical Realm, which equates to exactlyFamilyNative species(endemics toregion)Percentage of Percentage ofspecies in region species in familythat are endemic that are endemicto regionNative genera(endemicsto region)Figure 1. Summary of Red List categoriesfor amphibians in the Afrotropical Realm.The percentage of species in each categoryis also given.Red List Category Number of speciesExtinct (EX) 0Extinct in the Wild (EW) 0Critically Endangered (CR) 33Endangered (EN) 107Vulnerable (VU) 100Near Threatened (NT) 53Least Concern (LC) 467Data Deficient (DD) 209Total Number of Species 969Table 1. The number of Afrotropical amphibiansin each taxonomic Family present inthe region.Percentage ofgenera in regionthat are endemicPercentage ofgenera in familythat are endemicto regionAnuraArthroleptidae 51 (51) 100 100 3 (3) 100 100Astylosternidae 29 (29) 100 100 5 (5) 100 100Bufonidae 105 (97) 92 20 15 (14) 93 41Heleophrynidae 6 (6) 100 100 1 (1) 100 100Hemisotidae 9 (9) 100 100 1 (1) 100 100Hylidae 1 (0) 0 0 1 (0) 0 0Hyperoliidae 253 (253) 100 100 18 (18) 100 100Mantellidae 158 (158) 100 100 5 (5) 100 100Microhylidae 87 (87) 100 20 18 (18) 100 26Petropedetidae 102 (102) 100 100 13 (13) 100 100Pipidae 23 (23) 100 77 4 (4) 100 80Ranidae 109 (103) 94 15 14 (9) 64 23Rhacophoridae 4 (4) 100 1 1 (1) 100 11Sooglossidae 4 (4) 100 100 2 (2) 100 100TOTAL ANURA 941 (926) 98 18 101 (94) 93 26GymnophionaCaeciliidae 22 (22) 100 19 9 (9) 100 100Scolecomorphidae 6 (6) 100 100 2 (2) 100 100TOTAL GYMNOPHIONA 28 (28) 100 16 11 (11) 100 100TOTAL ALL AMPHIBIANS 969 (954) 98 16 112 (105) 94 2322%48%3%11%10%6%
54Threatened <strong>Amphibian</strong>s of the WorldBoophis luteus (Least Concern) is a treefrog inthe Family Mantellidae, which is endemic toMadagascar. This species is locally abundantalong streams in both pristine and degradedrainforest. © Piotr NaskreckiTable 2. The number of species within eachIUCN Red List Category in each Family andOrder in the Afrotropical Realm. Introducedspecies are not included.one-third (33%) of the 126 monotypic genera of amphibians worldwide. This unexpectedlyhigh percentage is probably a reflection of the poor state of knowledge of the Afrotropicalamphibian fauna; it is likely that many of these genera will prove not to be monotypic asmore species are discovered. For example, recent descriptions include a second species ofthe previously monotypic genus Callulina (De Sá et al. 2004), a second species of Cophyla(Vences et al. 2005), a second species of Acanthixalus (Rödel et al. 2003), and a second andthird species of Alexteroon (Amiet 2000). The seven non-endemic genera in the Afrotropicsinclude five ranid genera (Euphlyctis 5 , Hoplobatrachus, Ptychadena, Rana 6 , Tomopterna 7 )and the widespread genera Bufo 8 and Hyla 5 .As noted already, 16 of the world’s 48 amphibian families (33%) occur in the Afrotropics.The nine endemic families to the region (Arthroleptidae, Astylosternidae, Heleophrynidae,Hemisotidae, Hyperoliidae, Mantellidae, Petropedetidae, Sooglossidae and Scolecomorphidae)represent 19% of the global level of diversity of amphibians at the family level 9 . Thecharacteristics of these families are provided in Chapter 1.Among the non-endemic families, the majority of Afrotropical species are in the Bufonidae,the Microhylidae and the Ranidae. Of the Afrotropical Bufonidae, 68 species (65% ofthose occurring in the region) are within the widespread genus Bufo 8 . The remaining 14genera have mostly small numbers of species, with the exception of Nectophrynoides (11species). The Afrotropical toad genera of Nectophrynoides (endemic to eastern Tanzania)and Nimbaphrynoides (endemic to Mount Nimba in Côte d’Ivoire, Guinea and Liberia) areremarkable in that they include 13 of the 14 known live-bearing anurans in the world 10 (withthe possibility that the poorly known, monotypic Afrotropical bufonid genera, Didynamipusand Laurentophryne, might also be live-bearing).The Afrotropical Microhylidae species are very unevenly distributed within the region,with 56 species endemic to Madagascar (10 genera, including Plethodontohyla – 15 species,Platypelis – 11 species, Scaphiophryne – 10 species, and Stumpffia – 8 species). Onthe African mainland, there are 29 species in eight genera. The largest concentrations ofmicrohylids are in South Africa (15 species, eight of which are endemic) and Tanzania (12species, nine of which are endemic, with four endemic genera). Microhylid diversity is lowin the rest of Africa, with only one species in West Africa, and none at all in the equatorialrainforest belt. The largest genera on the African mainland are Breviceps (15 species) andPhrynomantis (5 species). The Afrotropical microhylids exhibit a wide diversity of reproductivemodes, including both larval- and direct-developers. 11The Afrotropical Ranidae species are all larval-developers, and occur throughout theAfrican mainland, with one species naturally occurring on Madagascar. There are 14 genera,the dominant genus being Ptychadena (47 species), with other notable genera includingAmnirana (11 species), Strongylopus (11 species), Afrana (10 species), and Tomopterna (9species). Among the Afrotropical ranids is the largest frog in the world, the Goliath FrogConraua goliath, with some individuals recorded as weighing more than 3kg. 12Of the remaining families, the highly aquatic Pipidae, although small in number of species(but with more than 75% of the species in the family occurring in the Afrotropics), is a veryvisible and abundant component of the amphibian fauna, being dominated by the generallywidespread and resilient genus Xenopus (16 species).The caecilian family Caeciliidae is very poorly known in the Afrotropics, as in other partsof the world. Only 21 species (in nine genera) are known, of which six species are endemicto the granitic islands of the Seychelles, though strangely none at all occur in Madagascar.The Seychelles is the only country in the world in which the order Gymnophiona formsa majority of the amphibian fauna (and see Essay 5.1). One species in the Caeciliidae isendemic to the island of São Tomé. On the African mainland, members of this family appearto occur mainly in the West African forest belt, east to Cameroon and western DemocraticRepublic of Congo, and in the coastal areas of East Africa and the Eastern Arc Mountains,south to southern Malawi. There is a single species present in south-western Ethiopia, anda single species (known from just one specimen) is known from the Albertine Rift highlands.Caecilians are unknown from the Congo Basin, but this is probably due to lack of sampling,and they also appear to be absent from the Kenyan Highlands (except for the northernoutliers of the Eastern Arc Mountains).Not surprisingly, the larger families – Bufonidae, Hyperoliidae, Mantellidae, Microhylidae,Petropedetidae – have the largest absolute numbers of globally threatened species (Table2). The percentage of threatened species ranges greatly between the families, from 0% forthe Hylidae, Rhacophoridae and Scolecomorphidae to 100% for the endemic Sooglossidaeof the Seychelles (all four of the species have tiny ranges). The percentage of threatenedspecies is also very high in the Astylosternidae (73%), reflecting the poor state of forestconservation in the mountainous regions of Cameroon. The percentages are also high(>30%) in the Bufonidae, Heleophrynidae, and Microhylidae. In the Bufonidae, only 11 ofthe 68 species of Afrotropical Bufo (16%) are globally threatened, but 27 of the remaining37 species in other genera (80%) are threatened. The Bufonidae are also noteworthy in that30 of the 38 threatened species fall in the Critically Endangered and Endangered categories,underlining how urgent the conservation needs are in this family.Certain families have lower levels of threat, notably the Pipidae, Hemisotidae andRanidae 13 , all of which have a high proportion of adaptable species in the Afrotropics.The results for the Arthroleptidae are hard to interpret because of the major taxonomicuncertainties in this family (31% of the species are DD). There is very little information onthe threat levels to Afrotropical caecilians (39% DD); two of the three threatened speciesoccur in Seychelles, and the other in Kenya, but almost nothing is known of the conservationstatus of most of the West African species.Geographic Patterns of Species Richness andEndemismA map of overall species richness of amphibians in the Afrotropical Realm (Figure 2) showsthat species richness is lowest in arid regions, such as the Sahel, the Horn of Africa, andsouth-west Africa. However, the apparent region of species paucity on the southern CongoBasin is almost certainly an artefact reflecting the very limited herpetological work in thatpart of Africa.Although the regions with the highest known species richness, such as south-westernCameroon and eastern Madagascar are genuine reflections of amphibian diversity, these arealso the rainforest regions that have received the most research attention from herpetologists.Other regions, such as the high mountains of the Albertine Rift of eastern DemocraticRepublic of Congo, Rwanda, Burundi and south-western Uganda, are likely to be richer inspecies than the current data indicate. Some regions showing higher species richness, suchas the Eastern Arc Mountains of Tanzania, and Mount Nimba in Liberia, Guinea and Côted’Ivoire, are likely to represent genuine patterns, whereas others (for example, in the Upembaregion of southern Democratic Republic of Congo and the Taï National Park in south-westernCôte d’Ivoire) are probably a reflection of locally intensive survey efforts.There are seven major concentrations of threatened species (Figure 3a): the Upper Guineaforests from Sierra Leone to Togo; south-eastern Nigeria and south-western Cameroon;the mountains of the Albertine Rift; the Ethiopian Highlands; the Eastern Arc Mountains;southern South Africa (especially in the south-western Cape); and eastern Madagascar(especially in the northern and southern extremities of the eastern rainforest zone). Theseconcentrations of threatened species correlate with those for other taxa (Stuart and Collar1988; Baillie et al. 2004). Smaller concentrations of threatened amphibians are found in: SãoTomé, the Kenyan Highlands; southern Malawi (around Mount Mulanje); eastern Zimbabwe(the Chimanimani mountains, in particular) and adjacent Mozambique; and the SeychellesIslands. These geographic concentrations reflect the parts of the region where amphibianshave naturally small ranges, and where habitat destruction is ongoing. However, at leastsome of the threatened species in the Upper Guinea forests were once more widespread,but have declined due to extremely severe habitat destruction. Because of the relativelysmall number of CR species, there are few significant concentrations of CR species, andthe overall pattern is similar to that for threatened species (Figure 3b).Species Richness and Endemism within Countries<strong>Amphibian</strong>s occur naturally in every mainland country in Sub-Saharan Africa and southernArabia (Figure 4). They are also present on Madagascar, and are indigenous to the followingFamily CR EN VU NT LC DD Total numberof speciesNumber threatenedor Extinct% threatenedor ExtinctAnuraArthroleptidae 3 9 2 3 18 16 51 14 27Astylosternidae 2 11 8 2 5 1 29 21 72Bufonidae 9 21 8 2 49 16 105 38 36Heleophrynidae 2 0 0 0 4 0 6 2 33Hemisotidae 0 0 1 0 4 4 9 1 11Hylidae 0 0 0 0 1 0 1 0 0Hyperoliidae 1 19 29 17 133 54 253 49 19Mantellidae 7 12 16 12 77 34 158 35 22Microhylidae 3 13 16 2 36 17 87 32 37Petropedetidae 3 13 8 10 39 29 102 24 24Pipidae 1 1 0 1 15 5 23 2 9Ranidae 1 7 7 4 68 22 109 15 14Rhacophoridae 0 0 0 0 4 0 4 0 0Sooglossidae 0 0 4 0 0 0 4 4 100TOTAL ANURA 32 106 99 53 453 198 941 237 25GymnophionaCaeciliidae 1 1 1 0 11 8 22 3 14Scolecomorphidae 0 0 0 0 3 3 6 0 0TOTAL GYMNOPHIONA 1 1 1 0 14 11 28 3 11TOTAL ALL AMPHIBIANS 33 107 100 53 467 209 969 240 25Grandisonia sechellensis (Least Concern) is known only from the islands of Mahé, Praslinand Silhouette in the Seychelles. The Seychelles is the only place in the world wherecaecilians form the majority of the amphibian fauna, and this species is sympatric with fiveother caecilian species. © Renaud Boistel
Chapter 5. <strong>Amphibian</strong>s of the Afrotropical Realm 55Figure 2. The species richness of amphibians in the Afrotropical Realm, with darker colourscorresponding to regions of higher richness. Colour scale based on 10 quantile classes;maximum richness equals 123 species.islands: Seychelles (on most of the granitic islands, but not on the coral atolls), Zanzibar,Pemba, Mafia, Bioko, Príncipe and São Tomé (but apparently not on Pagalu, Socotra, theComoros 4 , the Mascarenes or the Cape Verde Islands).Madagascar has been intensively studied (Blommers-Schlösser and Blanc 1991; Glaw andVences 1994; Andreone et al. 2005) and has the largest number of species of any country inthe Afrotropical Realm (226 species), and 70% of these are in the endemic family Mantellidae(see also Essay 5.2). The only other country with more than 200 species is the DemocraticRepublic of Congo, and only four other countries have more than 100 species (Cameroon,Tanzania, South Africa, and Nigeria), although, if including species awaiting description,Cameroon has more than 200 species (J.-L. Amiet pers. comm.; see Essay 5.3).However, these figures need to be treated with considerable caution. The rate of newspecies’ descriptions in Madagascar has been very high over the last decade, with the numberof described species from the country doubling since 1991 (compare Blommers-Schlösserand Blanc [1991] with Figure 4). However, the rate of species descriptions in recent yearsfrom the African mainland has been much slower than from Madagascar, and this is largelya reflection of the very limited amount of herpetological work that has been conducted onthe continent in recent decades. Only the work of Schiøtz (1967, 1975, 1999) focusing onthe Hyperoliidae, and that of Tandy and Keith (1972) focusing on African Bufo, has takena continental approach to the amphibian fauna. In particular, there has been very limitedwork carried out in the Congo Basin since the late 1950s in what might be expected to beone of the most diverse parts of the region. Similarly, with the exception of a small amountof work in Uganda (Drewes and Vindum 1994; Vonesh 2001), the Albertine Rift has receivedno attention for a similar period of time, despite the fact that this area has higher speciesrichness and endemism among vertebrates than any other part of mainland Africa (Stuartand Collar 1988; Brooks et al. 2001). There has been much greater focus on the amphibianfauna of Cameroon (Perret 1966; Amiet 1983, 1989), but serious exploration of the fauna ofWest Africa only resumed in the mid 1990s (Rödel 2000; see Essay 5.4). Apart from somea.b.Figure 3. a) The richness of threatened amphibians in the Afrotropical Realm, with darkercolours corresponding to regions of higher richness. Colour scale based on 10 quantileclasses; maximum richness equals 31 species. b) The richness of CR amphibians in the AfrotropicalRealm, with darker colours corresponding to regions of higher richness. Maximumrichness equals three species.Bufo togoensis (Near Threatened) is a toadfrom the Upper Guinea forests of WestAfrica, ranging from eastern Sierra Leone towestern Togo. It lives only in primary forest,usually in close association with the streamsin which it breeds, and is affected by ongoingdeforestation throughout its range. © PiotrNaskreckiFigure 4. The number of amphibians presentin and endemic to each Afrotropical country.*denotes countries not entirely within theAfrotropical Realm, hence only the specieswhose ranges fall within the region areincluded.Figure 5. Percentage of species endemic toeach Afrotropical country. Countries with noendemic species are not included. *denotescountries not entirely within the AfrotropicalRealm, hence only the species whose rangesfall within the region are included.Figure 6. The number of threatened amphibianspresent in and endemic to each Afrotropicalcountry. Countries with no threatened speciesare not included in the diagram. *denotescountries not entirely within the AfrotropicalRealm, hence only the species whose rangesfall within the region are included.Figure 7. Percentage of native species that arethreatened. Countries with no threatened speciesare not included in the diagram. *denotescountries not entirely within the AfrotropicalRealm, hence only the species whose rangesfall within the region are included.MadagascarCongo D.R.CameroonTanzaniaSouth AfricaNigeriaAngolaKenyaCôte d’IvoireGabonZambiaGhanaMalawiGuineaEquatorial GuineaMozambiqueEthiopiaZimbabweCentral African RepublicUgandaCongoLiberiaSierra LeoneNamibiaSwazilandBotswanaRwandaSenegalSomaliaBurundiMali*GambiaTogoBurkina FasoSudan*BeninLesothoChad*EritreaGuinea BissauSeychellesNiger*Saudi Arabia*DjiboutiSão Tomé and PrincipeYemen*Mauritania*Oman*United Arab Emirates*Figure 40 50 100 150 200 250Number of speciesEndemics Non-endemicsSeychellesSão Tomé and PrincipeMadagascarSouth AfricaTanzaniaEthiopiaCameroonCongo, D.R.Chad*AngolaYemen*KenyaSomaliaTogoMali*NamibiaZimbabweBurundiGuineaCôte d’IvoireEritreaGhanaLesothoCentral African RepublicUgandaGabonMalawiSierra LeoneLiberiaRwandaZambiaEquatorial GuineaNigeriaMadagascarCameroonTanzaniaSouth AfricaCongo D.R.Côte d’IvoireNigeriaGhanaEthiopiaRwandaBurundiKenyaSeychellesUgandaZimbabweGuineaMalawiEquatorial GuineaLiberiaGabonMozambiqueSão Tomé and PríncipeTogoSierra LeoneNamibiaYemen*ZambiaSeychellesSão Tomé and PríncipeCameroonTanzaniaMadagascarBurundiRwandaSouth AfricaYemen*Côte d’IvoireEthiopiaTogoGhanaNigeriaUgandaZimbabweLiberiaGuineaMalawiKenyaCongo D.R.Equatorial GuineaMozambiqueSierra LeoneGabonNamibiaZambia0 20 40 60 80 1000 10 20 30 40 50 60Percentage of endemic speciesNumber of threatened speciesEndemics Non-endemicsFigure 5 Figure 6Figure 70 10 20 30 40 50 60Percentage of threatened species
56Threatened <strong>Amphibian</strong>s of the WorldKassina cochranae (Near Threatened) is in theendemic Afrotropical Family Hyperoliidae. It isan arboreal, forest-dwelling species knownfrom the forest zone of Sierra Leone, Liberiaand Guinea. Certain populations are probablysuffering from severe deforestation as a resultof agricultural expansion, logging and growinghuman settlements. © Piotr NaskreckiTable 3. The habitat preferences of amphibiansin the Afrotropical Realm.Figure 8. The habitat preferences of Afrotropicalamphibians. The plot on the left-hand sideshows the number of species in the region ineach habitat type. On the right-hand side,the percentage of these species which arethreatened is given.Hyperolius puncticulatus (Least Concern),one of at least 125 treefrogs in the genus Hyperolius,ranges from coastal Kenya, througheastern and southern Tanzania (includingthe island of Zanzibar) to the highlands ofMalawi. The males of this species call fromvegetation around pools, where they breed.© Alan Channingpreliminary work in Ethiopia (Largen 2001) and Somalia (Lanza 1990), work in eastern Africahas been very limited, although there has been some recent attention on Tanzania (e.g.,Poynton 2003), and a field guide to the amphibians of East Africa, covering Kenya, Tanzaniaand Uganda (Channing and Howell 2006).The frogs of the southern third of the African continent are probably somewhat betterknown, thanks to a number of detailed studies, for example: Poynton (1964) and Channing(2001) covering the whole region; Wager (1986), Lambiris (1989a), Passmore and Carruthers(1995), and Minter et al. (2004) in South Africa, Lesotho and Swaziland; Channing and Griffin(1993) in Namibia; Lambiris (1989b) in Zimbabwe; Broadley (1971) in Zambia; Stewart (1967)in Malawi; Poynton (1966) in Mozambique; and the classic Amphibia Zambesiaca works ofPoynton and Broadley (1985ab, 1987, 1988, 1991). However, even in South Africa, whichis by far the most studied country in the region, new species continue to be described (forexample, Turner et al. 2004).In reality, our understanding of the country-level species richness of amphibians in theAfrotropics is still very incomplete. Future investigations will doubtless result in increasesin the numbers of species in every country; however, based on the known species richnessof other groups such as birds, these increases are likely to be greatest for the DemocraticRepublic of Congo, Nigeria, Angola, Côte d’Ivoire, Gabon, Ghana, Guinea, Equatorial Guinea,Mozambique, Ethiopia, Central African Republic, Uganda, Congo, Liberia, Sierra Leone,Rwanda, Burundi, Togo, Sudan, Benin 14 , and Chad. Meanwhile, Madagascar, Cameroon andTanzania, which have received the most herpetological attention (after South Africa) in recentyears, show no signs of slowing in their rates of new species’ descriptions.Not surprisingly, endemism (in terms of relative proportions; Figure 5) is much higherin island nations. Madagascar has far more endemics than any other country, with all butHabitat typeNumberof species ineach habitat% of allspeciesoccurring inthe habitatThreatenedand Extinctspecies% of speciesoccurringin habitat thatare Threatenedor ExtinctForest 648 67 208 32All tropical forest 624 64 201 32Lowland tropical forest 495 51 114 23Montane tropical forest 322 33 137 43Savannah 227 23 7 3Grassland 267 28 52 19Shrubland 213 22 29 14Secondary terrestrial habitats 415 43 74 18Flowing freshwater 380 39 112 29Marsh/swamp 223 23 38 17Still open freshwater 375 39 53 14Arid and semi-arid habitats 41 4 1 2ForestSavannahGrasslandShrublandSecondary terrestrial habitatsFlowing freshwaterMarsh/swampStill open freshwaterArid and semi-arid habitatsNumber of species0 200 400 600% of species in habitat that are threatened0 10 20 30one of the native species, the Mascarene Ridged Frog Ptychadena mascareniensis (LC),being found nowhere else 15 . In both Seychelles and São Tomé and Príncipe, the level ofendemism is 100%.On the African mainland, Tanzania has more endemic species than any other country (seeEssay 5.5). More than 50 endemic species are also known from Cameroon, the DemocraticRepublic of Congo, and South Africa. In terms of percentage of the fauna being endemic, thehighest endemism on the African mainland is found in South Africa, Tanzania and Ethiopia(all have around 40% of species endemic). Although the actual numbers and percentageswill change as new information becomes available, the overall patterns are concordant withthose of other taxonomic groups, and are almost certainly real.Threatened species occur in 27 of the 49 countries in which there are native amphibians(Figure 6). In fact, threatened species are concentrated in relatively few countries. Only fourcountries, Madagascar, Cameroon, Tanzania and South Africa, have more than 20 globallythreatened species. The top three countries, Madagascar, Cameroon and Tanzania, areundoubtedly genuine centres of threatened species, but the number is almost certainlygrossly under-estimated for the Democratic Republic of the Congo. Here there are likelyto be many threatened species, probably many of them still undescribed, in the mountainsaround the Albertine Rift (where there is also severe forest loss due to expanding subsistenceagriculture). The percentage of threatened amphibian species is highest in the islandnations of Seychelles and São Tomé and Príncipe (Figure 7). The highest percentage on theAfrican mainland is 27% for Cameroon, a reflection of the poor state of forest conservationin the mountainous regions of the country. In many countries, the percentage of threatenedspecies can be expected to rise as new species discoveries are made or crucial habitatsare destroyed.Assessments of the conservation status of Afrotropical amphibians at national level havebeen carried out only for South Africa, Lesotho and Swaziland (Branch 1988; Monadjem etal. 2003; Minter et al. 2004).There are only 33 Critically Endangered Afrotropical species, nine of which occur inMadagascar, seven in Cameroon and five in Tanzania. Outside these three countries, thereare three Critically Endangered species in South Africa, two each in Côte d’Ivoire and Kenya,and one each in Gabon, Ghana, Guinea, Liberia, Togo and Zimbabwe. However, the numbersin West Africa are very likely to increase during the coming years, both because of newlydiscovered species and because of destruction of forest and mountain habitats.HABITAT AND ECOLOGYHabitat PreferencesTwo-thirds of Afrotropical amphibians occur in forests, and over 40% are believed to be ableto survive in secondary terrestrial habitats (Table 3; Figure 8). Similar percentages make useof flowing water and of standing, open water habitats, but marshes and swamps appearto be used by fewer species. Forest-dwelling amphibians are more likely to be threatenedthan those occurring in any other habitats, with almost one-third of them being globallythreatened. Almost 30% of amphibians associated with flowing water (generally streams)are threatened. Consequently, forest-associated amphibians that live along streams areparticularly likely to be threatened, a combination that has also been associated with rapiddeclines worldwide (Stuart et al. 2004).For tropical forests overall, 32% of Afrotropical species are globally threatened. However,in montane tropical forest, 43% of known species are threatened, compared with 23%in lowland tropical forest. These figures probably reflect smaller range sizes of montanespecies, and the lack of effective habitat conservation measures in many mountainousparts of the region.<strong>Amphibian</strong>s occurring in savannah and arid habitat are particularly unlikely to be threatened.Africa has 47% of the world’s 484 savannah-associated amphibians, and 44% of theworld’s 94 arid-habitat species, but only 14% of the global total of 4,712 forest-dwellingspecies. Many of these “species” are in fact complexes of several species, and when theseare disaggregated, the number of savannah amphibians will increase. In addition, thenumber of threatened savannah species can also be expected to increase as their habitatsshrink and dry out (these habitats are especially vulnerable to climate change) and theirranges become smaller.Reproductive ModesLarval development is by far the most common reproductive mode in the Afrotropics (85%of species), compared with 10% for direct development and 2% live-bearing (this compareswith the global picture of 68% larval development, 30% direct development, and 1%live-bearing) (Table 4). Although live-bearing is uncommon, the Afrotropics account for36% of the world’s known live-bearing amphibians, and all but one of the world’s knownlive-bearing frogs and toads. However, it should be noted that the reproductive mode ofmany species is unknown, and more terrestrial breeders are likely to be identified (Rödeland Ernst 2002; Rödel et al. 2002).In the Afrotropics, the percentage of globally threatened direct-developing amphibiansis only slightly higher than for larval-developing species (at a global level, direct-developingspecies are much more likely to be threatened). The high percentage of threatened livebearingspecies in the Afrotropics is a reflection of the high levels of threat to species inthe genera Nectophrynoides and Nimbaphrynoides, many of which have very small rangesin fragile, primarily montane, and poorly protected, habitats.MAJOR THREATSAs in other parts of the world, habitat loss is overwhelmingly the major threat to amphibiansin the Afrotropics (Table 5; Figure 9), affecting over 90% of the threatened species. Othercommonly recorded threats include invasive species, fire and pollution. Over-utilization appearsto be a minor threat in the region (at least based on current knowledge), and disease,which is a very important factor in other parts of the world, is cited as a threat to only 2%of threatened species in the Afrotropics (although the amount of information on the chytridfungus, and its pathogenicity, is very limited in the region).In terms of the types of habitat loss that are impacting threatened amphibians in theAfrotropics, expanding croplands, vegetation removal (mainly logging), and urbanization /industrial development are approximately equivalent, and each is affecting more than 70% ofthreatened species. Livestock grazing has less impact (probably because it is more prevalentin regions of lower amphibian species richness, and in any case much of Africa has longbeen grazed by large wild mammals), and tree plantations also appear not to be a significantthreat in most places (although this is a serious threat in South Africa and Swaziland). In
Chapter 5. <strong>Amphibian</strong>s of the Afrotropical Realm 57Reproductive mode All Species Threatened orExtinct Species% Threatenedor ExtinctDirect development 100 26 26Larval development 819 190 23Live-bearing 21 10 48Not known 29 14 48Table 4. Afrotropical amphibians categorized by reproductive mode.Threat type Threatened species % ThreatenedspeciesHabitat loss 221 92Agriculture – Crops 191 80Agriculture – Tree plantations 18 8Agriculture – Livestock 79 33Timber and other vegetation removal 179 75Urbanization and industrial development 177 74Invasive species 52 22Utilization 15 6Accidental mortality 1 0.4Pollution 30 13Natural disasters 3 1Disease 4 2Human disturbance 1 0.4Changes in native species dynamics2 1(excluding disease)Fire 50 21Table 5. The major threats to globally threatened amphibians in the Afrotropical Realm.Only present threats to species are tallied.parts of West Africa, planned mining activities might become increasingly serious as threatsto important sites for amphibians (for example, in Guinea and Ghana).A total of 84 species (18 of which are threatened) are recorded as being used for someor other purpose in the region (Table 6). The most commonly recorded reason for harvestingAfrotropical amphibians is for the international pet trade (especially in Madagascar),followed by human consumption (although the number of species used as human food isprobably greatly under-recorded). Much of the harvesting of amphibians in the region is notconsidered to constitute a major threat to the species. Of the 84 species being harvested,utilization is considered to be a threat for 32 (of which only 15 are threatened species forwhich harvesting is believed to be contributing to deterioration in their status).POPULATION STATUS AND TRENDSEstimates of Population TrendsA summary of the inferred population trends of Afrotropical amphibians is presented inTable 7. For nearly all species, these trends are inferred from trends in the state of thehabitats on which the species depend. Species with decreasing populations are typicalforest-dependent species that can tolerate little disturbance to their habitats. The percentageof decreasing and increasing species in the Afrotropics is very similar to the globalresults. However, the percentage of species where the situation is stable is slightly lower,and the percentage for which it is unknown is slightly higher than the global averages (27%and 30%, respectively).“Rapidly Declining” SpeciesThe Afrotropics appears to have been shielded to some extent from the amphibian declinesthat are taking place in some other regions, with only 30 (6%) of the 470 globally “rapidlydeclining” species occurring within the region (a full list of all “rapidly declining” species isprovided in Appendix IV and includes their occurrence within each of the realms). Most ofthe “rapidly declining” species are threatened primarily by the reduction of suitable habitat.Twelve of these are forest-obligate species from the Upper Guinea region of West Africa(see Essay 5.4), where habitat loss has been particularly severe. Another six are endemicto South Africa, where urbanization and agricultural intensification in key habitats has beenrelatively more severe than on the rest of the continent (see Essay 5.6). The remaining eightspecies are scattered widely across the continent in Cameroon, Gabon, Kenya, Madagascar(two species), São Tomé and Príncipe, Tanzania, and Zimbabwe.The Afrotropics have three “rapidly declining” species, affected by severe over-harvesting.Two of these, Mantella cowanii (CR) and Scaphiophryne gottlebei (CR), both from Madagascar,appear to have declined due to over-collection for the international pet trade (Andreoneet al. 2006). In the case of Mantella cowanii, it declined initially because of the loss of mostof its habitat, but subsequently the remnant populations were hit by over-harvesting. Thethird species, the Goliath Frog Conraua goliath (EN) from Cameroon and Equatorial Guinea,has declined mainly due to over-harvesting for human consumption, though there is alsosome international trade.So far, only one “rapidly declining” species undergoing an enigmatic decline has beenrecorded in the Afrotropics, namely the Kihansi Spray Toad Nectophrynoides asperginis (CR).This species, endemic to the spray zone of one waterfall in Tanzania, decreased initiallybecause of the damming of an upstream river. However, its final catastrophic decline toprobable extinction is believed to have been caused by the fungal disease chytridiomycosis(Krajick 2006), which has been implicated or suspected in most of the enigmatic declinesworldwide. Globally, enigmatic declines account for 48% of the “rapid declines” worldwide,but for only 3% so far in the Afrotropics, though it is possible that additional enigmaticdeclines have not yet been detected. One suspected case concerns Arthroleptides dutoiti(CR) in Kenya. This species has the ecological characteristics of other species that havesuccumbed to chytridiomycosis elsewhere in the world, and now appears to be absent fromformer sites, even though suitable habitat remains. It is not listed as an enigmatic declinespecies here, as its decline might have taken place prior to 1980.Figure 9. The major threats impacting threatened amphibians in the Afrotropical Realm.PurposeSubsistence Sub-national/NationalRegional/InternationalNumberof speciesFood – human 24 (4) 5 (2) 1 25 (4)Medicine – human and veterinary 3 1 1 3 (0)Pets, display animals 0 1 61 (15) 61 (15)Research 0 1 1 2 (0)Table 6. The purposes for which amphibians are used in the Afrotropical Realm. The numbersin brackets are the number of species within the total that are threatened species.Population Trend Number of species % of speciesDecreasing 425 44Stable 221 23Increasing 8 1Unknown 315 33FamilyAll habitat lossInvasive speciesUtilizationAccidental mortalityPersecutionPollutionNatural disastersDiseaseHuman disturbanceChanges in native sp. dynamicsFire0 20 40 60 80 100Percentage of threatened species affectedTable 7. The population trends for all extant Afrotropical amphibians.Number of speciesin “rapid decline”Percentage ofspecies in familyin “rapid decline”Arthroleptidae 3 6Bufonidae 5 5Hemisotidae 1 11Hyperoliidae 6 2Mantellidae 1 6Microhylidae 2 2Petropedetidae 7 7Ranidae 5 5Table 8. The number of species in “rapid decline” in the Afrotropical Realm by Family .Leptopelis parkeri (Vulnerable), a treefrog inthe Family Hyperoliidae, is endemic to severalmountain blocks in the Eastern Arc chain ofTanzania. It is a species of closed, intactrainforest, not surviving in seriously disturbedhabitats outside forest, and is threatened byhabitat loss as a result of expanding humansettlements and agriculture, and the harvestingof wood. © David Moyer / WildlifeConservation SocietyThe aptly named Tomato Frog Dyscophusantongilii (Near Threatened) of the FamilyMicrohylidae is endemic to north-easternMadagascar. Although it is an adaptablespecies, being found in a variety of habitatsfrom primary rainforest to disturbed urbanareas, the pollution of waterbodies is apotential threat to this species. © RussellA. Mittermeier
58Threatened <strong>Amphibian</strong>s of the WorldEndnotes1 We follow the WWF biogeographic realms in thischapter, but recognize that this is not ideal foramphibians, especially with regard to the inclusionof the Arabian Peninsula within the AfrotropicalRealm. The small Arabian amphibian fauna isgenerally of Palaearctic origin.2 P
Chapter 5. <strong>Amphibian</strong>s of the Afrotropical Realm 59ESSAY 5.1. SEYCHELLES AMPHIBIANSFigure 1. Map of the Seychelles Islands.Due to their permeable skin few amphibians are able to tolerate dry or saltyconditions, a characteristic that has prevented most species from colonisingoceanic islands. The most diverse oceanic island amphibian fauna is foundin the Seychelles, an archipelago of about 115 granitic and coralline islandsin the Indian Ocean, some 1,600km east of mainland Africa, and northeast ofthe island of Madagascar (Figure 1). Eleven native amphibian species havebeen recorded from the Seychelles islands, comprising both recent colonistsand ancient endemics. Recent colonization by one species, the MascareneGrass Frog Ptychadena mascariensis (LC), is probably the result of humanintroduction (Vences et al. 2004) in the 1800s, whilst the endemic SeychellesTreefrog Tachycnemis seychellensis (LC) is believed to be descended from anatural colonist from Madagascar (Vences et al. 2003). The remaining speciesare all ancient endemics that have probably existed on the island sincetheir isolation from the Indian landmass some 65 million years ago. Thesespecies comprise the endemic frog family Sooglossidae and seven speciesof burrowing caecilians (Order Gymnophiona).Sooglossidae are an exceptional family in several respects. Four speciesare currently recognized in two genera, although recent morphological and moleculardata suggests that a further three species remain to be described andthat the genera need to be redefined. They are all small frogs, with Gardiner’sFrog Sooglossus gardineri (VU) among several species up for contention asthe world’s smallest frog (with adults being as small as 9mm in length). Allsooglossids are found in the damp forests of the two highest islands, Mahéand Silhouette. These habitats have only seasonal or fast-flowing stems, andthe sooglossids have abandoned the normal frog life-cycle in favour of terrestrialdevelopment. The Seychelles Frog Sooglossus sechellensis (VU) laysits eggs on land and the female carries the tadpoles until they develop intofrogs. Sooglossus gardineri is even more specialized, with the male guardingterrestrial eggs that hatch into 3-mm long froglets; the entire tadpole stage ispassed within the egg. Thomasset’s Seychelles Frog Nesomantis thomasseti(VU) has recently been discovered to have a very similar breeding strategy,but nothing is known of the reproductive behaviour of the Seychelles PalmFrog S. pipilodryas (VU). This latter species is the most recently described ofthe Seychelles amphibian species, having been discovered in 2000 (Gerlachand Willi 2002). It lives in the axils of endemic palms where it lay protectedfrom discovery by the dense spines of the palm leaves. It is the only arborealsooglossid, the other species all being associated with crevices in boulderfields or the leaf-litter and root-mat of the forest floor.The caecilian fauna of the Seychelles islands comprises six species inthree endemic genera. Not surprisingly, and as with caecilians in general(see Essay 1.3), these are the least well known of all Seychelles amphibians.Their burrowing habits make them difficult to locate and study. Formost species, their distributions are reasonably well defined and there aresome observations of breeding habits. Different species appear to show thefull range of reproductive strategies, form aquatic larvae, thorough to terrestriallarvae and direct development. The limited ecological data availableindicate that Grandisonia alternans (LC) is a widespread species occurring inall habitats and Hypogeophis rostratus (LC) is a similar generalist, althoughmore associated with lowland habitats. In contrast, Praslina cooperi (VU) andsome of the small Grandisonia species appear to be specialists of the highforest. Current research into this group is attempting to develop monitoringmethods and to identify aspects of their ecology that are of importance totheir conservation.Half of Seychelles amphibians are threatened due to their naturallyrestricted ranges and deteriorating habitats (five species are categorisedas Least Concern, 5 Vulnerable and one Endangered). The sooglossid frogsand the caecilian Praslina cooperi have particularly restricted ranges, beingassociated only with the damper rain-forests. Habitat deterioration is asignificant threat to the caecilian Grandisonia brevis (EN), which has a restrictedrange and occurs in habitats that are suffering from ongoing invasionby alien plant species. In addition, there is some suggestion that changesin rainfall patterns may have impacts on some species, which may resultfrom mid-year declines in rainfall restricting the activity and distribution ofthe rain-forest specialists (Gerlach 2000). Losses of several areas of marshhabitats have probably caused population declines in some species, such asanother caecilian Grandisonia alternans (Gerlach 2000).There have been a number of successful conservation programmes inSeychelles, concentrating mainly on birds. Critically Endangered species havebeen rescued from extinction by limited habitat management, but mostly byinter-island transfers. These programmes have been to the benefit of speciessuch as the Seychelles Magpie-robin Copsychus seychellarum and theSeychelles White-eye Zosterops modesta. Such options are not availablefor the amphibians due to their close dependence on their high forest ormarsh-land habitats. Consequently, preservation of their habitat is essential;most species are present in protected areas, although habitat managementis still required to control the spread of invasive plant species. The islandwith the highest diversity of amphibians (Silhouette) is currently unprotectedNesomantis thomasseti (Vulnerable)is restricted to Mahé andSilhouette Islands in the Seychelles,and has been recorded from theMorne Seychellois National Park.© Naomi Doakand designation of this island as a national park would significantly enhanceamphibian conservation in Seychelles.To date, there has been no evidence of any sudden amphibian decline inSeychelles, although the potential impact of an invasion by chytridiomycosiswould be considerable. Monitoring programmes are in place for the frogs, andare being developed for the caecilians. Updates on research and conservationprogress can be found at http://members.aol.com/jstgerlach/herps.htmReferencesJustin GerlachGerlach, J. 2000. Seychelles Amphibia – a mixture of secure and declining species.Froglog 40(5).Gerlach, J. and Willi, J. 2002. A new species of Sooglossus frog (Sooglossidae). Amphibia-Reptilia23:445-498.Vences, M., Kosuch, J., Glaw, F., Bohme W. and Veith, M. 2003. Molecular phylogenyof hyperoliid treefrogs: biogeographic origin of Malagasy and Seychellean taxa andre-analysis of familial paraphyly. Journal of Zoology and Systematic EvolutionaryResearch 41:205-215.Vences, M., Kosuch, J., Rodel, M.-O., Channing, A., Glaw, F. and Bohme, W. 2004.Phylogeography of Ptychadena mascareniensis suggests transoceanic dispersal in awidespread African-Malagasy frog lineage. Journal of Biogeography 31:593-601.ESSAY 5.2. THE ENDEMIC AND THREATENED AMPHIBIANS OF MADAGASCARSeparated from mainland Africa by a sea channel of about 300km, the biodiversityof Madagascar has experienced a distinct evolutionary trajectory that hasresulted in a very high degree of endemism in both its fauna and flora. Amongthe vertebrates, the amphibians of this large island (around 580,000km², thefourth in the world for size) are currently represented by more than 230 frogspecies 1 , a number that is still preliminary and tentative, since many moreremain to be discovered or are awaiting description (see Essay 1.1) (Figure 1).Remarkably, out of the entire amphibian fauna, only two species, the adaptableand widely distributed Ptychadena mascareniensis, which is present also inmainland Africa, and Hoplobatrachus tigerinus, introduced to Madagascar fromsouthern Asia, are not considered to be endemic. Interestingly, recent molecularstudies have shown that the P. mascareniensis populations from Madagascarare already sufficiently differentiated from those from mainland Africa, andlikely represent a different species (Vences et al. 2003, 2004).Malagasy amphibians are represented by four families of frogs (Gymnophionesand Urodeles being absent): Mantellidae, Microhylidae, Hyperoliidae,and Ranidae 2 , with ranids being represented only by the aforementionednon-endemic Ptychadena mascareniensis and Hoplobatrachus tigerinus (Glawand Vences 1994). Mantellidae is the most speciose group and is endemic toMadagascar and the Comoro Islands. This family includes the highly diversegenus Mantidactylus (with nearly 90 species), the well-known genus Mantella
60Threatened <strong>Amphibian</strong>s of the World(15 species), Boophis (53 species), Aglyptodactylus (3 species), and the monospecificgenus Laliostoma. At the time of writing, Mantidactylus has beensplit into several genera (Glaw and Vences 2006), which differ significantlyin aspects of morphology, life history and distribution: Wakea, Blommersia,Guibemantis, Spinomantis, Gephyromantis, Boehmantis, and Mantidactylus.As a general trait, Mantidactylus (sensu lato) and the closely related Mantellashow peculiar reproductive features, such as the absence of amplexus andof nuptial pads in males, with eggs laid outside water, and the presence(in most species) of femoral glands, which are glandular structures on theinside of the thighs, and related to reproductive behaviour. They also exhibita variety of life history traits, with species adapted to terrestrial, aquatic,and arboreal habitats (Andreone and Luiselli 2003). The diurnal Mantellaspecies are characterized mainly by their bright aposematic colouration, smallsize, and accumulations of alkaloids in the skin. The Mantella species are,therefore, toxic, and are apparently rarely predated upon by other species,a situation similar in many respects to that of the Neotropical dendrobatidfrogs (Clark et al. 2005).In contrast to these frogs, amphibians in the genus Boophis are mainlyarboreal species, breed in water, and have a typical larval development.Egg-laying usually occurs in streams, except for some species that reproducein lentic waters (Aprea et al. 2004; Glaw and Vences 2006). Two furthergenera, Aglyptodactylus and Laliostoma, are mainly terrestrial and breedin temporary ponds, often breeding explosively during which time they formlarge aggregations. The genus Aglyptodactylus is also peculiar in having themales that assume a somehow bright yellow colouration during the breedingseason (Glaw and Vences 1994, 2006).Microhylidae are represented by 10 genera and more than 50 specieswith a diverse life history. The cophyline microhylids (belonging to the generaCophyla, Platypelis, Anodonthyla, Plethodontohyla, Madecassophryne,Rhombophryne, and Stumpffia) are closely tied to rainforest habitats andhave a reproduction that is characterized by the presence of parental care (forexample, both the parents, or at least one of them, remain with the tadpolesduring their development) and non-feeding tadpoles (Andreone et al. 2004).The genera Dyscophus, Paradoxophyla, and Scaphiophryne are different inthis habitat preference, living mainly in open areas, but sometimes in aridand sub-arid conditions (Andreone et al. 2006a). Most of them are mainlyterrestrial, although some species, such as S. gottlebei are partly rupicolousand able to climb vertical walls within the narrow canyons of the IsaloMassif (Andreone et al. 2005a). In particular, Scaphiophryne species havetadpoles that are largely filter feeding, with some peculiar specializations(see Mercurio and Andreone 2005).The Malagasy Hyperoliidae includes the single endemic genus Heterixaluscomprising eleven species, which inhabit grasslands and forest edges.They are quite similar in habitat preferences and general behaviour to otherhyperoliids from mainland Africa (Glaw and Vences 1994).Nine species of Malagasy frogs have been categorized as CriticallyEndangered according to the IUCN Red List Categories and Criteria, namely:Mantella aurantiaca, M. cowani, M. expectata, M. milotympanum, M. viridis,Scaphiophryne gottlebei, Mantidactylus pauliani, Boophis williamsi, andStumpffia helenae (Andreone et al. 2005b). A further 21 species were classedas Endangered and 25 as Vulnerable. In general, the main threat affectingthe local amphibian fauna is the high rate of forest loss (just less than 1%per annum; Harper et al. 2007) (Figure 2). The different life history traits ofthe amphibians are consequently mirrored by their differential ecologicalsensitivity and conservation needs (Andreone and Luiselli 2003). In fact,most of the Malagasy frogs inhabit the eastern rainforest, an ecosystemthat allowed the rapid diversification of some groups, such as Boophis,Mantidactylus (sensu lato), and cophyline microhylids. The original easternrainforest block is now severely fragmented due to deforestation, and thisfragmentation has often resulted in high levels of threats among the nativeamphibian fauna (Figure 3). However, in some cases this loss in amphibianspecies richness is not immediately evident, because species have differingsensitivities to habitat alterations (Andreone et al. 2005b).In addition to the threat of habitat loss, some species (e.g. those belongingto Mantella, Scaphiophryne, and Dyscophus) have been highly soughtafter for the international pet trade due to their biological peculiarities andremarkable colouration (Raxworthy and Nussbaum 2001; Andreone et al.2006b; Mattioli et al. 2006). There is still a paucity of reliable data on theimpact of trade on wild populations, although in some cases it is evidentthat collecting represents a confounding threat when the habitat is alreadycompromised and the populations are small. This is the case, for example, forthe rare harlequin mantella, Mantella cowani, which was collected in highnumbers and survived in a very degraded environment on the high plateauof Madagascar (Andreone and Randrianarina 2003; Chiari et al. 2005). Fortunately,the collecting and exportation of this species, classified as CriticallyEndangered, are now banned, a measure that should reinforce its protection(Andreone et al. 2006b). Due to concerns about overharvesting for commercialtrade, all frogs in the genus Mantella as well as the species Scaphiophrynegottlebei are now included on CITES Appendix II. Other species are also ofconservation concern, such as the Tomato Frog, Dyscophus antongili, the onlynative species included on CITES Appendix I. Although its distribution area iswider than formerly believed (Andreone et al. 2006b), the habitat degradationaround the town of Maroantsetra, where most known populations occur, ishigh. There is also evidence that the populations have apparently declinedin numbers, and the species appears to have vanished from sites at which itwas formerly known to occur (Chiari et al. 2006).Fortunately, field surveys conducted during the last 15 years have revealedno known extinctions of Malagasy amphibians resulting from habitat loss,disease or other agents (Andreone et al. 2005b), as has been reportedelsewhere. On the other hand, 12 highly threatened species now have theirlast remaining populations confined to a single site (Ricketts et al. 2005),and several of these sites, such as the Ankaratra Massif and Fierenana,remain unprotected. In general, the two areas with the majority of threatenedspecies are the northern Tsaratanana-Marojejy-Masoala highlands and thesoutheastern Anosy Mountains (Andreone et al. 2005b).Following the remarkable declaration by Malagasy president MarcRavalomanana to triple the existing coverage of the island’s protected areasnetwork (see Figure 2), amphibians are now beginning to be considered inthe identification of globally important sites for conservation (see Essay11.3). This is all the more important since, as already noted, several highlythreatened species experience no protection whatsoever. For example, ofthe nine Critically Endangered amphibians, six are not recorded from anyprotected area (Andreone et al. 2005b, 2006b). <strong>Amphibian</strong>s also representan excellent candidate to become a symbol for the conservation strategies inMadagascar. Indeed, it is clear that, as with lemurs, the frogs of Madagascarhave the potential to become an important tool for the conservation of wildlifein Madagascar. This aspect, as well as long-term conservation planning, wasthe focus of a workshop (A Conservation Strategy for the <strong>Amphibian</strong>s ofMadagascar) held in Antananarivo in September 2006 specifically dedicatedto the amphibians of Madagascar, and attended by more than 80 scientistsand conservation practitioners.ReferencesFranco Andreone and Herilala RandriamahazoAndreone F., Aprea G., Odierna G. and Vences M. 2006a. A new narrow-mouthed frog ofthe genus Paradoxophyla (Microhylidae: Scaphiophryninae) from Masoala rainforest,northeastern Madagascar. Acta Herpetologica 1:15-27.Andreone F., Mattioli F. and Mercurio V. 2005a. The call of Scaphiophryne gottlebei, amicrohylid frog from the Isalo Massif, south-central Madagascar. Current Herpetology24:33-35.Andreone, F. and Luiselli, L.M. 2003. Conservation priorities and potential threatsinfluencing the hyper-diverse amphibians of Madagascar. Italian Journal of Zoology70:53-63.Andreone F. and Randrianirina J.E. 2003. It’s not carnival for the harlequin mantella!Urgent actions needed to conserve Mantella cowani, an endangered frog from theHigh Plateau of Madagascar. Froglog 59:1-2.Andreone, F., Cadle, J.E., Cox, N., Glaw, F., Nussbaum, R.A., Raxworthy, C.J., Stuart, S.N.,Vallan, D. and Vences, M. 2005b. Species Review of <strong>Amphibian</strong> Extinction Risks inMadagascar: Conclusions from the Global <strong>Amphibian</strong> Assessment. ConservationBiology 19:1790-1802.Andreone, F., Mercurio, V. and Mattioli, F. 2006b. Between environmental degradationand international pet-trade: conservation strategies for the threatened amphibiansof Madagascar. Natura 95:81-96.Andreone, F., Vences, M., Vieites, D.R., Glaw, F. and Meyer, A. 2004. Recurrent ecologicaladaptations revealed through a molecular analysis of the secretive cophyline frogs ofMadagascar. Molecular Phylogenetics and Evolution 34:315-322.Aprea, G., Andreone, F., Capriglione, T., Odierna, G. and Vences, M. 2004. Evidence for aremarkable stasis of chromosome evolution in Malagasy treefrogs (Boophis: Mantellidae).Italian Journal of Zoology, Supplement 2:237-243.Chiari, Y., Andreone, F., Vences, M. and Meyer, A. 2005. Genetic variation of an endangeredMalagasy frog, Mantella cowani, and its phylogeographic relationships to thewidespread M. baroni. Conservation Genetics 6:1041-1047.Chiari, Y., Orozco-terWengel, P., Vences, M., Vieites, D.R., Sarovy, A., Randrianirina, J.E.,Meyer, A. and Louis, E., Jr. 2006. Genetic identification of units for conservation intomato frogs, genus Dyscophus. Conservation Genetics 7:473-482.Clark, V.C., Raxworthy, C.J., Rakotomalala, V., Sierwald, P. and Fisher, B.L. 2005. Convergentevolution of chemical defense in poison frogs and arthropod prey betweenMadagascar and the Neotropics. Proceedings of the National Academy of Sciencesof the USA 102:11617-11622.Glaw, F. and Vences, M. 1994. A fieldguide to the amphibians and reptiles of Madagascar.2nd edition. Vences & Glaw Verlag, Köln, Germany.Glaw, F. and Vences, M. 2006. Phylogeny and genus-level classification of mantellid frogs.– Organisms Diversity and Evolution 6:236-253.Harper, G.J., Steininger, M.K., Tucker, C.J., Juhn, D. and Hawkins, F. 2007. Fifty years ofdeforestation and forest fragmentation in Madagascar. Environmental Conservation34:325-333.Mattioli, F., Gili, C. and Andreone, F. 2006. Economics of captive breeding applied to theconservation of some selected amphibian and reptile species from Madagascar.Natura 95:67-80.Mercurio, V. and Andreone, F. 2005. The tadpoles of Scaphiophryne gottlebei (Microhylidae,Scaphiophryninae) and Mantella expectata (Mantellidae, Mantellinae) from IsaloMassif, central-southern Madagascar. Alytes 23:81-95.Raxworthy, C.J. and Nussbaum, R.A. 2001. Extinction and extinction vulnerability of amphibiansand reptiles in Madagascar. <strong>Amphibian</strong> and Reptile Conservation 2:15-23.Ricketts, T.H., Dinerstein, E., Boucher, T., Brooks, T.M., Butchart, S.H.M., Hoffmann, M.,Lamoreux, J.F., Morrison, J., Parr, M., Pilgrim, J.D., Rodrigues, A.S.L., Sechrest, W.,Wallace, G.E., Berlin, K., Bielby, J., Burgess, N.D., Church, D.R., Cox, N., Knox, D.,Loucks, C., Luck, G.W., Master, L.L., Moore, R., Naidoo, R., Ridgely, R., Schatz, G.E.,Shire, G., Strand, H., Wettengel, W. and Wikramanayake, E. 2005. Pinpointing andpreventing imminent extinctions. Proceedings of the National Academy of SciencesUSA 102:18497-18501.Vences, M., Vieites, D.R., Glaw, F., Brinkmann, H., Kosuch, J., Veith, M. and Meyer, A.2003. Multiple overseas dispersal in amphibians. Proceedings of the Royal SocietyB 270:2435-2442.Vences, M., Kosuch, J., Rödel, M.-O., Lötters, S., Channing, A., Glaw, F. and Böhme,W. 2004. Phylogeography of Ptychadena mascareniensis suggests transoceanicdispersal in a widespread African-Malagasy frog lineage. Journal of Biogeography31:593-601.1 Although only some 226 species are currently classified through the Global <strong>Amphibian</strong>Assessment, several new species were recently described, including Paradoxaphylatiarano from Masoalo Forest in north-eastern Madagascar (Andreone et al. 2006a).2 The Ranidae were disaggregated into several families by Frost et al. (2006). InMadagascar, Pthychadena is ascribed to Ptychadenidae and Hoplobatrachus toDicroglossidae. Thus, the number of families becomes five.Figure 1. Richness map of amphibian species in Madagascar, with dark redcolours corresponding to areas of higher richness. Colour scale based on 10quantile classes. Maximum richness equals 91 species.Figure 2. Forest cover map for Madagascar, and existing protected areas inblack. Red corresponds to forest clearance between 1990 and 2000, brown toclearance between 1975 and 1990, and green to forest cover in 2000.Figure 3. Richness map of threatened amphibian species in Madagascar, withdark red colours corresponding to areas of higher richness. Colour scale basedon five quantile classes. Maximum richness equals nine species.
Chapter 5. <strong>Amphibian</strong>s of the Afrotropical Realm 61ESSAY 5.3. FROG BIODIVERSITY IN CAMEROONAround 200 species of frogs occur in Cameroon (Amiet 1989), including severalunnamed taxa, but the final total could be as high as 210 due to limitedknowledge of the extreme north and south-east of the country. Comparisonswith the less well prospected neighbouring countries in central Africa aredifficult, but the frog fauna of Cameroon is almost certainly the second mostdiverse in continental Africa, after the Democratic Republic of the Congo.Components of Cameroon’s frog faunaCameroon’s frog fauna largely consists of four ecological components. Thesavannah component (c. 35 species) is associated with grassy and herbaceoushabitats over a broad latitudinal extent, from the small savannahs nearYaoundé, north to the steppes around Lake Chad. Very few species occupythis entire area, most being distributed in latitudinal bands reflecting theirdifferent tolerances of drought. All have wide distributions outside Cameroon,and their tadpoles develop in still water.The montane component, represented by about 50 species, many endemic,is restricted not only to mountains but also to high plateaus in westernCameroon. The boundary between this component and lowland faunas isbetween 800 and 1,200m. These species prefer forests or are indifferent tovegetation type, and for many the tadpoles develop in streams.The forest component includes some 80 species that are generally confinedto closed-canopy forest. These species depend mainly on ecological conditionscreated by a closed canopy, rather than on the exploitation history ofthe forest (primary or secondary), or on floristic composition. Amiet’s (1989)study of the Yaoundé forest frog fauna showed that it consisted overwhelminglyof species living in leaf-litter (43%), or on vegetation (39%), with halfof the water-dependent species associated with streams. This componentincludes many species and some genera that are, more or less, restricted toCameroon, especially in the west.The “parasylvicolous” component includes some 30 species confined tothe forest zone and gallery forests in the savannah zone. These species donot live in intact forest, but in habitats that have been disturbed, either asa result of natural processes, or because of degradation by humans (Amiet1989). Most of these species occur widely outside Cameroon, their tadpolesdeveloping in still or slow-flowing waters.There is also a small component of about six species that occur widely inthe savannahs, and in degraded habitats in the forest zone, often in villagesand large urban areas.These components are not homogeneous, and can be subdivided intoelevational zones (montane component) or latitudinal zones (savannahcomponent). However, the limits of these zones are less clear than thosethat separate the components themselves.Causes of the diversity of Cameroon’s frogfaunaSeveral factors contribute to the high level of frog diversity in Cameroon.The first is the wide variety of natural conditions in the country. An oldtourist advertisement boasts that Cameroon is “the whole of Africa in justone country”, which is not an exaggeration. Diversity is boosted by interplaybetween climatic and geomorphological factors. The country covers over 12°of latitude, including most of the climatic gradient of western and centralAfrica north of the equator, from a very rainy equatorial to tropical climate(with rainfall decreasing as one goes northwards).This pattern is modified by two major axes of relief. The first is theCameroon mountain ridge, a series of massifs, often of volcanic origin withpeaks over 2,000m, the highest being Mount Cameroon (4,095m). The ridgeruns SSW-NNE, with numerous southern and western slopes exposed to themonsoon rains. The second is the Adamawa Plateau, which, at an altitudeof 1,000-1,200m, crosses the entire country between 6° and 8°N, and hasa relatively cool and humid climate. Thus, there is a complex patchwork ofrainfall patterns in Cameroon, analysed in depth by Suchel (1972, 1988). Inaddition to affecting the overall climate, these high plateaus and mountainmassifs also display vertical climatic zoning, resulting in the diversificationof ecological conditions over very short distances.While the diversity of current climatic conditions undoubtedly contributesto the diversity of Cameroon’s frog fauna, climatic changes during the Quaternaryare the main cause. These changes (see Maley 1996, 2001) resultedin repeated modifications to the distribution of bioclimatic zones, and havebeen a major cause of frog speciation, affecting in particular lowland forestand montane species. Lowland tropical and montane forests both experiencedphases of expansion and regression. When habitats became fragmented,allopatric speciation took place in isolated areas, causing remarkable diversificationin genera such as Cardioglossa, Astylosternus or Leptodactylodon,which include pairs and trios of closely related species. Some of these closerelatives have remained allopatric, while others have become sympatric oreven syntopic (Amiet 1980, 1987). However, Quaternary climatic changes aretoo recent to explain the presence of 15 genera, endemic, or largely endemic,to Cameroon (Amiet 1989). Most of these have tadpoles that develop in welloxygenated,running water, a habitat that is plentiful in the hilly highlands ofthe west and south-west. These genera presumably evolved in situ duringthe formation of the Cameroon mountain ridge.More recently, human impact on the environment has had favourableconsequences on savannah and “parasylvicolous” species. Maintenanceof savannahs by fire since the last episode of forest regression has aidedthe expansion of savannah species (for example, in the northern part of thesouthern Cameroon Plateau, which under current climatic conditions shouldbe forest, but which is in fact dominated by savannah). In the forest zone,agricultural clearings have provided habitats favourable to “parasylvicolous”species, especially with the increasing destruction of forests since the startof the colonial period. Some “parasylvicolous” species of western origin,now quite common, were not found by the first collectors, and some ofthese might have reached Cameroon in the last 150 years, and continue toexpand towards the east or south-east. Judging by the speed at which certain“parasylvicolous” species settle in newly opened forest sites, this hypothesisdoes not seem outlandish.Geographic patterns of diversityFigure 1 shows how the frog fauna is distributed in relation to the main bioclimaticunits of the country. In regions Ic, II, Va and Vb, the numbers of specieshave probably been underestimated, but regions Ia, Ib and III will remain thecentres of Cameroon’s frog diversity. The high diversity in regions Ia and IIIis due to the large number of endemic and near-endemic species. Region IIIincludes virtually all of Cameroon’s montane species, none of which occur inother mountainous regions in Africa. Regions Ia and Ib include several “parasylvicolous”species (those in Ia and Ib being of “western” and “Congolese”origin, respectively). However, the higher diversity in Ia is due to the presenceof several endemic species on the coastal plain, especially between the lowerSanaga and the Mungo rivers, and also south of the lower Nyong River (bothprobably being forest refugia during past climatic fluctuations).Threats to Cameroon’s frog faunaThe ecological conditions and the overall diversity and endemism of frogs varyacross the regions of Cameroon, and this affects the threats facing the frogfauna. Moreover, future environmental changes in the context of the country’ssocio-economical and political situation need to be considered.The frog faunas in regions IV, Va and Vb are not at great risk, despitethese regions being greatly affected by human activity, as most of the speciesare adaptable. Conversely, in region II, the savannah species are, in theoryat least, doomed to eventual extinction, as the forest should be expandingrapidly under current climatic conditions. However, the species in questionalso occur in regions IV and V, and forest species would presumably spreadin region II.The situation is much worse for the forest species in regions Ia, Ib and Ic,with the increasingly serious loss of forest, which seems inevitable due to lackof political commitment to conservation. However, frogs are less seriouslyaffected than large mammals because, thanks to their small size, they areoften able to survive in what little forest remains. They can also survive inareas of shifting cultivation where rotations allow for rapid recovery of theforest cover. Logging has limited impact as there is very little clear-cutting inCameroon, but commercial tree plantations (such as oil palm) do have a verynegative impact on forest frogs, and are especially prevalent in region Ia.Region III has lost much forest, especially on the Bamileke Plateau.However, on the humid southern and western mountain slopes clearedforest can be replaced quickly by dense secondary vegetation suitable formany montane frogs (few species are completely dependent on intact forest).However, the tendency of the Bamileke and Banso peoples to clear largeareas of habitat is alarming. For frogs living at very high elevations in openhabitats, the threat level is low.The Goliath Frog Conraua goliath (EN) requires particular mention asthe only directly threatened frog in Cameroon. In the past it was sold inlarge numbers to at least one American importer for the ridiculous practiceof jumping competitions. Now, these frogs, which used to be eaten onlyoccasionally, have become prized game actively sought after, at least in thearea of Nkongsamba (G. Renson, pers. comm.). Special traps have even beeninvented for catching this species, a victim of the current fad for bushmeat.With lack of law enforcement and endemic corruption, conservation measuresare ineffective, and the future of the Goliath Frog depends on a change infood habits among local people.The most effective measure of conservation for forest and montane frogsin Cameroon would be total preservation or restoration of a 30m-wide bandof forest on both sides of water courses, whatever their size and location(including in commercial plantations). This solution, based on this author’s29 years of field research in Cameroon, would safeguard a huge portion ofbiodiversity in all taxonomic groups, and would contribute to quantitativeand qualitative improvements in water reserves. Such a measure, if it wereadopted, would require the means, and above all the political will, to implementin a resolute manner.ReferencesJean-Louis AmietAmiet, J.-L. 1980. Révision du genre Leptodactylodon (Amphibia Anura, Astylosterninae).Annales de la Faculté des Sciences de Yaoundé 27:69-224.Amiet, J.-L. 1987. Aires disjointes et taxons vicariants chez les Anoures du Cameroun:implications paléocliamtiques. Alytes 6:99-115.Amiet, J.-L. 1989. Quelques aspects de la biologie des Amphibiens Anoures du Cameroun.Année biologique 28:73-136.Maley, J. 1996. The African rain forest - main characteristics of changes in vegetationand climate from the upper Cretaceous to the Quaternary. Proceedings of the RoyalSociety of Edinburgh 104B:31-73.Maley, J. 2001. The impact of arid phases on the African rain forest through geologicalhistory. In: W. Weber, L.J.T. White, A. Vedder and L. Naughton-Treves (eds.), AfricanRain Forest Ecology and Conservation, pp. 68-87. Yale University Press, New Haven,Connecticut, USA.Schiøtz, A. 1999. Treefrogs of Africa. Chimaira, Frankfurt am Main, Germany.Suchel, J.-B. 1972. La répartition des pluies et les régimes pluviométriques au Cameroun.Travaux et documents de géographie tropicale, 5. Université fédérale du Camerounet C.N.R.S.Suchel, J.-B. 1988. “Les climats du Cameroun”. Thèse de Doctorat d’Etat, Université deSaint-Etienne, France. t. I-III: 1188 pp., et t. IV, atlas.Astylosternus ranoides (Endangered) is known only from western Cameroon, where it has been recorded from theBamboutos Mountains, Lake Oku, and Mount Neshele, at altitudes of 2,000-2,600m asl. © Jean-Louis AmietFigure 1. Map of Cameroon showingthe major bioclimatic regions,with the number of species recordedfrom each region. Key for bioclimaticregions: Ia: coastal plain tropicallowland forest (92 species); Ib:southern Cameroonian plateau tropicallowland forest (83); Ic: Congobasin tropical lowland forest (57);II: southern Cameroonian plateaugallery forests and Guinea savannah(51); III: Cameroon mountainridge mountains and high plateaus(78); IV: Adamawa Plateau (40); Va:northern Cameroon Sudan savannah(23); and Vb: northern Cameroon Sudano-Saheliansavannah and Sahel(29). For methodology in definingthese regions and estimating speciestotals, see (Amiet 1983).
62Threatened <strong>Amphibian</strong>s of the WorldESSAY 5.4. THREATENED ISLANDS OF AMPHIBIAN DIVERSITY IN WEST AFRICA160140# of described species1201008060402001830 1850 1870 1890 1910 1930 1950 1970 19902010Figure 1. Number of described West African amphibian species per decade (including known but not yet described new species for the last decade). Blackarrows indicate the start of periods of more intensive survey and taxonomic work. These signifi cant increases were mainly due to (arrows from left to right)P. Chabanaud; J. Guibé, M. Lamotte and co-workers; A. Schiøtz and J.-L. Perret and M.-O. Rödel and co-workers. With the exception of the 1960s (A. Schiøtz)new amphibian species have been described at a near constant rate of about 0.7 species per annum. Since 2000 the description rate increased to more than 1.8species per annum and is not yet reaching any visible plateau, hence illustrating that the West African amphibian fauna still is far from being well known.West Africa, here defined as the region from Senegal in the west to Nigeriain the east and extending north to the southern border of the Sahara Desert,covers almost all larger African biomes, ranging from rainforests along theAtlantic Ocean’s coast, over various types of savannahs to semi-deserts. Inthe border region of Guinea, Côte d’Ivoire, and Liberia, as well as withinSierra Leone, there are also several higher mountain ranges representing rareexamples, at least in the West African context, of montane grassland.<strong>Amphibian</strong> research in West Africa dates back to the middle of the 19 thcentury. In general, the diversity of amphibians in West Africa is high, witharound 175 amphibian species having been recorded from this region, includingfour caecilians and 171 anurans. While some forests may support as manyas 40 different amphibian species in an area as small as 2 ha, amphibianrichness is also high in some savannah formations (sometimes surpassing 30frog species in only a few square kilometres). However, while new specieshave been described on a continual basis, species description curves havenever attained any sort of saturation (Figure 1) suggesting that many newspecies remain undiscovered.Around one-fi fth of the region’s amphibian fauna is considered to bethreatened (34 species), including 14 species that are listed as Vulnerable,16 Endangered, and four Critically Endangered. A further 19 species are classifiedas Near Threatened. The four Critically Endangered species include twospecies, Nimbaphrynoides occidentalis and N. liberiensis, known only froma few square kilometres on Mount Nimba’s grassland mountain ridge and avery limited area in Liberia’s rainforest on Mount Nimba’s southern slopes,respectively. A third species, Bufo taiensis, is only known from four specimenscollected from the region of Taï National Park in Côte d’Ivoire, while the fourthspecies, Conraua derooi (currently considered Possibly Extinct on the IUCN Redlist), was described from, and only very recently rediscovered, in the southernpart of the Ghanaian-Togolese mountainous borderline.Many West African forest amphibians have very small ranges, possibly dueto fluctuations in the region’s forest cover (Wieringa and Poorter 2004). Thesefluctuations presumably also served as a catalyst for amphibian speciation andare a reason for today’s high diversity. In the Pleistocene and pre-Pleistocene,rainforests were either increasing towards the north in humid periods or wereshrinking to comparatively small forest refugia during drier periods (Falk etal. 2003). The recent distributions of West Africa’s endemic frogs matcheswell with the rough location of these postulated forest refugia, namely southwesternGhana (Rödel et al. 2005), south-western Côte d’Ivoire (Rödel andBranch 2002), and the Mount Nimba area (Rödel et al. 2004; Figure 2).However, new evidence lends support for a much finer grained picture,adding a few more distinct Pleistocene or Pre-Pleistocene forest remnants tothe Upper Guinea highlands (Rödel et al. unpubl.). The Upper Guinea highlandsregion stretches from Sierra Leone and Guinea through Liberia to western Côted’Ivoire, and forms part of the Guinean Forests of West Africa biodiversityhotspot (Bakarr et al. 2004). In order to understand West Africa’s forest historyand to reveal potentially overlooked centres of endemism, an accurate knowledgeof the location of historical forest refugia is needed. Current researchaims to locate these former forest refugia by investigating the relationshipsbetween various leaf litter frog species and populations from West Africanforests. The recent distribution patterns of these amphibians and the geneticdivergences of populations of these frogs will help us to reconstruct the historyof West Africa’s forest cover (Hillers et al. unpubl.).On this regional scale we have also started to analyse landscape characteristicssuch as climate, vegetation, altitude, and topo-diversity with respectto their potential influence on amphibian species richness. Our analyses haverevealed positive correlations of species richness with rainfall, forest cover,and habitat diversity. Based on these three parameters, we have been able tomodel areas believed to harbour a high richness of amphibian species. Theseareas coincide with the aforementioned areas of former forest refugia, whichhence would be not only islands of high endemism but also of correspondinghigh amphibian diversity (Penner et al. unpubl.).Unfortunately, these areas are also among the most threatened regions inWest African. South-western Côte d’Ivoire, the area with the most extensivetracts of remaining forest in the country, lost about 80% of its forests withinthe last 30 years (Chatelain et al. 1996). Guinea has little more than about5% of its former rainforests left (UICN 1996), and many of its remainingforested mountain ranges are threatened by open-cast mining operations.Given the distributional limitations of many forest amphibians and the vasttracts of forest areas that have already been lost, it is not unreasonable toexpect that several species have already gone extinct without having beendiscovered and described scientifi cally.But even selective logging might be a severe danger to the endemicWest African forest frogs. We have shown that habitat degradation markedlyalters the composition of forest frog communities, and many endemicand range-restricted forest frogs do not prevail in logged or fragmentedforests (Ernst and Rödel 2005). Moreover, not only does forest degradationnegatively affect particular species, but it severely and non-randomly reducesthe functional diversity of forest species assemblages, i.e., specifi c life historytraits disappear (Ernst et al. 2006). The latter is particularly importantfor ecosystem renewal and reorganization following change and it providesadaptive capacity in a world of complex systems, and human-dominatedenvironments. The loss especially concerns species with tadpoles that aredependant on larger stagnant or slow-fl owing waters. In conclusion, WestAfrica still supports an extraordinary rich amphibian fauna, albeit restrictedto steadily declining islands of diversity.Mark-Oliver Rödel, P. Joël Adeba, Raffael Ernst, Annika Hillers,S. Gilles A. Nago, Johannes Penner and Martin WegmannReferencesBakarr, M., Oates, J., Fahr, J., Parren, M., Rödel, M-O. and Demey, R. 2004. Guinean Forestsof West Africa. In: R.A. Mittermeier, P. Robles-Gil, M. Hoffmann, J.D. Pilgrim, T.M.Brooks, C.G. Mittermeier, J.L. Lamoreux and G. Fonseca (eds.), Hotspots: Revisited,pp. 123-130. CEMEX, Mexico City, Mexico.Chatelain, C., Gautier, L. and Spichiger, R. 1996. A recent history of forest fragmentationin southwestern Ivory Coast. Biodiversity and Conservation 5:783-791.Ernst, R. and Rödel, M.-O. 2005. Anthropogenically induced changes of predictability inFigure 2. Endemism of West African amphibian species. Shown are 42well-known amphibian communities and the respective proportion of endemicspecies. The level of endemism ranges from local (red, e.g. Nimbaphrynoidesoccidentalis, estimated range: 111km²) and regional (orange, e.g. Kassina lamottei,13,002km²) endemics, to species that occur in the Upper Guinea forestzone (yellow), West Africa (clear green), Central and West Africa (green, e.g.Phlyctimantis boulengeri, 294,445km²) to species with an almost sub-Saharandistribution (dark green, e.g. Kassina senegalensis, 12,263,903km²).
Chapter 5. <strong>Amphibian</strong>s of the Afrotropical Realm 63tropical anuran assemblages. Ecology 86:3111-3118.Ernst, R., Linsenmair, K.E., and Rödel, M.-O. 2006. Diversity erosion beyond the specieslevel: Dramatic loss of functional diversity after selective logging in two tropicalamphibian communities. Biological Conservation 133:143-155.Falk, T.M., Teugels, G.G., Abban, E.K., Villwock, W. and Renwartz, L. 2003. Phylogeographicpatterns in populations of the blackchinned Tilapia complex (Teleostei, Cichlidae)from coastal areas in West Africa: support for the refuge zone theory. MolecularPhylogenetics and Evolution 27:81-92.Rödel, M.-O., Bangoura, M.A. and Böhme, W. 2004. The amphibians of south-easternRepublic of Guinea (Amphibia: Gymnophiona, Anura). Herpetozoa 17:99-118.Rödel, M.-O. and Branch, W.R. 2002. Herpetological survey of the Haute Dodo and Cavallyforests, western Ivory Coast, Part I: <strong>Amphibian</strong>s. Salamandra 38:245-268Rödel, M.-O., Gil, M., Agyei, A.C., Leaché, A.D., Diaz, R.E., Fujita, M.K. and Ernst, R.2005. The amphibians of the forested parts of south-western Ghana. Salamandra41:107-127.UICN 1996. L’atlas pour la conservation des forêts tropicales d’Afrique. Editions Jean-Pierre de Monza, Paris, France.Wieringa, J.J. and Poorter, L. 2004. Biodiversity hotspots in West Africa; patterns andcauses. In: L.F. Poorter, F. Bongers, F. Kouamé and W.D. Hawthorne (eds.), Biodiversityof West African forests. An ecological atlas of woody plant species, pp. 61-72. CABIPublishing, Cambridge, Massachusetts, USA.ESSAY 5.5. THE AMPHIBIAN FAUNA OF THE EASTERN ARC MOUNTAINS OF KENYA AND TANZANIAIn 1983 three botanists – Jon Lovett, Roger Polhill and John Hall – were sittingtogether at the foot of the Uluguru Mountains discussing recent discoveriesof rare plants in the Udzungwa Mountains, previously thought to be endemicto the Usambaras and Ulugurus (Lovett 1998). From the analysis they weremaking, it was clear that these rare forest plants were found only on thecrystalline peaks of a series of isolated mountain ranges in south-easternKenya and Tanzania. These mountains were showing remarkable similaritiesin terms of species richness and composition and since they are set in a halfmoon‘arc’ shape, they decided to name them collectively as the Eastern ArcMountains (Lovett 1998). The name first appeared in an article written by JonLovett for the Kenyan magazine Swara, in 1985.The Taita Hills of Kenya and the Pare, Usambara, Nguru, Nguu, Ukaguru,Uluguru, Rubeho, Udzungwa, Malundwe and Mahenge Mountains in Tanzaniacomprise the Eastern Arcs. They lie within the intertropical montaneregion and were formed by heavily metamorphosed Pre-Cambrian basementrocks, rising to 2,635 m in elevation (Kimhandu peak in the Ulugurus). Theyare part of one of the Earth’s richest biodiversity hotpots and amongst themost important regions in Africa for concentrations of endemic animalsand plants, with at least 93 species of endemic vertebrate (Burgess etal. 2007).The Danish batrachologist Arne Schiøtz published a short paper highlightingthe importance of the basement hills of Tanzania (the name Eastern Arcwas still to be coined) as a regional centre of amphibian endemism (Schiøtz1981). The Eastern Arcs are home to about 94 named amphibian species,of which 57 are endemic or near-endemic. A further 17 species have beenrecently discovered and are awaiting formal description (all of which areprobably endemic). A rough estimate, therefore, of the total number ofamphibians (described and undescribed) in the Eastern Arc Mountains is121 species, of which 74 occur are endemic or nearly so. The remarkablespecies richness and the high level of endemism is due to the great age ofthe Eastern Arc Mountains (they uplifted at least 30 million years ago), totheir archipelago-like arrangement, and to the climatic influence of the IndianOcean that kept the mountains relatively wetter and warmer than the surroundingareas during past climatic fluctuations. The high number of endemicspecies in small areas, the co-occurrence of recent and old lineages, and theconsequent biogeographical implications make these mountains of extremebiological and conservation interest.Historically, the Eastern Arc Mountains were probably covered by amosaic of rainforests. These rainforests were concentrated mostly on theeastern slopes and on the upland plateaux and were interspersed withopen grassland areas and with dry, semi-deciduous forests on the westernslopes. The majority of endemic species occur in the wet forest that coveredparts of the eastern slopes of the mountains. Although the forest environmenthas been well-studied, the grasslands and ecotones could representa further frontier of batrachological exploration. At the southern tip of theUdzungwas, the so called ‘Makambako gap’ has long been considered thesouthernmost limit. However, recent cross-taxon studies are revealing thatthe Southern Highlands, especially the forests of Mt Rungwe and Livingstone,also contain many species previously assumed to be endemic to the EasternArcs. For example, amphibian species such as Nectophrynoides viviparus (VU),Nectophrynoides tornieri (VU), and Leptopelis barbouri (VU) demonstrate MtRungwe’s Eastern Arc affinities (Davenport et al. 2003).Recently, molecular analysis has shown that a number of genera andspecies in the Eastern Arc Mountains are genetically ancient. For example,DNA sequence data of caecilians, including Eastern Arc species, suggestthat the origin of the caecilian fauna of Africa may ‘predate the break-up ofGondwana’ (Wilkinson et al. 2003). Similar suggestions are made concerningthe microhylids and brevicipitids fauna of Africa based on DNA sequencedata, which have exposed the extremely ancient age of these lineages(Loader et al. 2004). The present pattern of distribution and the presenceof recent and old lineages could be interpreted as a consequence of stablelocal conditions, and to some degree the pattern can be attributed to localspeciation or to local low extinction rates – in other words, long speciespersistence (Lovett et al. 2004).Among the taxa occurring in the Arc, forest bufonids are of particularinterest with a number of endemic genera and species like the extraordinaryChuramiti maridadi (CR), with its shining skin resembling wet lichen, or thebicoloured Nectophrynoides viviparus. Ongoing molecular studies on forestbufonids are revealing the presence of lineages of East African origin as wellas others derived from Guineo-Congolian taxa and ancient African-Asianlinkages. Forest bufonids in the Arc are revealing a much more abundantspecies radiation than expected with several new species and generaawaiting description.Many of the endemic species are confined to high-elevation sites and theirdistribution pattern may be due to relictualization. Other endemic speciesdemonstrate intriguing and highly restricted ranges, deserving of specialconservation strategies. These species display a ‘single site’ distribution,since they are confined to a single valley or parts of it, at certain elevations,and yet are surrounded by apparently suitable habitat. In just the UzungwaScarp Forest Reserve there are three strictly endemic species showingsuch distribution patterns: two dwarf forest bufonids, Nectophrynoideswendyae (CR) and N. poyntoni (CR), and the treefrog Hyperolius kihangensis(EN)(Menegon and Salvidio 2005). Another ‘single site’ species is the KihansiSpray Toad Nectophrynoides asperginis (CR) occurring only in the Kihansigorge, and now possibly extinct in the wild. This species is adapted to thepeculiar habitat influenced by the constant spray provided by waterfalls. Inthis case, the small distribution is explained by the extremely peculiar localconditions in the lower Kinhasi gorge. The other three species inhabit siteswith no apparent special conditions; they have been sought unsuccessfullyin other suitable sites within the same forest patch. Differences thus existbetween assemblages at sites at similar altitudes in adjoining mountainfragments or within single fragments, indicating a fine-scale geographicturnover in the herpetofauna of these areas.The distinct nature of the herpetofauna species assemblages at highaltitude, and the high elevational turnover of species, clearly demonstratesthe importance of conserving forest at all altitudes. Areas of forest ormarginal habitats, at all elevations, might also be vital in generating highspecies diversity, and need to be considered in the development of a holisticconservation strategy for the area. This suggests that not only is it importantto conserve the forest along an elevational gradient, but it is also importantto conserve fragments in geographically complex terrains, where isolatedpopulations and therefore potentially new species may still exist, and areawaiting discovery.ReferencesMichele Menegon and Tim DavenportBurgess, N.D., Butynski, T.M., Cordeiro, N.J., Doggart, N., Fjeldså, J., Howell, K.M., Kilahama,F., Loader, S.P, Lovett, J.C., Menegon, M., Moyer, D.C., Nashanda, E., Perkin, A.,Rovero, F., Stanley, W.T., Stuart, S.N. 2007. The biological importance of the EasternArc Mountains of Tanzania and Kenya. Biological Conservation 134:209-231.Davenport, T.R.B., Machaga, S.J., Mwamtobe, A., Mwaipungu, O. and Hayes, B. 2003.Some notes on the amphibians of Mt Rungwe. Unpublished Report. Southern HighlandsConservation Programme / Wildlife Conservation Society (SHCP/WCS). 4 pp.Loader, S.P., Gower, D.J., Howell, K.M., Doggart, N., Rödel, M.-O., Clarke, B.T., De Sá,R.O., Cohen, B.L. and Wilkinson, M. 2004. Phylogenetic relationships of Africanmicrohylid frogs inferred from DNA sequences of mitochondrial 12S and 16S rRNAgenes. Organisms, Diversity and Evolution 4:227-235.Lovett, J.C. 1985. Moist forests of Tanzania. Swara 8:8-9.Lovett, J.C. 1998. Naming the Arc. The Arc Journal 7.Lovett, J.C., Marchant, R., Taplin, J., Küper, W., 2004. The oldest rainforests in Africa: stabilityor resilience for survival and diversity? In: A. Purvis, J.L. Gittleman, and T.M. Brooks(eds.), Phylogeny and Conservation. Cambridge University Press, Cambridge, UK.Menegon, M., Salvidio, S., 2005. <strong>Amphibian</strong> and Reptile diversity in the southern UzungwaScarp Forest Reserve, South-Eastern Tanzania. In: B.A. Huber, B.J. Sinclair and K.H.Lampe (eds.), African Biodiversity: Molecules, Organisms, Ecosystems, pp. 205-212.Proceedings of the 5th International Symposium on Tropical Biology, Museum Koenig,Bonn, Germany.Moyer, D.C. 1993. Foraging ecology, habitat selection, and community structure ofafromontane forest birds in Tanzania. M.Sc. thesis, Louisiana State University andAgricultural and Mechanical College, Department of Zoology and Physiology. BatonRouge, Louisiana, USA.Schiøtz, A. 1981. The Amphibia of the forested basement hills of Tanzania - a biological.indicator group. African Journal of Ecology 19:205-208.Wilkinson, M., Loader, S.P., Gower, D.G., Sheps, J.A. and Cohen, B.L., 2002. PhylogeneticRelationships of African Caecilians (Amphibia: Gymnophiona): Insights from MitochondrialrRNA Gene Sequences. African Journal of Herpetology 52:83-92.Figure 1. Map showing the 13 blocks of the Eastern Arc Mountains of Tanzania and Kenya (reproduced, with permission, from Moyer 1993).
64Threatened <strong>Amphibian</strong>s of the WorldESSAY 5.6. THREATENED AMPHIBIANS OF SOUTHERN AFRICAAlthough many species of amphibians have been described from Africa inrecent years, amphibians as a group remain poorly known relative to othervertebrate taxa. An exception is South Africa, which has perhaps the beststudiedfauna in the region, culminating in the Atlas and Red Data Book of theFrogs of South Africa, Lesotho and Swaziland (Minter et al. 2004). The largersouthern African region, including Botswana, Namibia, Mozambique, Malawiand Zimbabwe, is home to 185 species of amphibians, of which 32 species(17%) have been assigned a status of conservation concern, including five asCritically Endangered, 16 as Endangered, and 11 as Vulnerable.These threatened species have several things in common: they mostlyoccupy small areas, either on coastal plains, or in highland or montanegrasslands or forests. The coastal areas are preferred localities for housingdevelopments, and for farming wheat and other crops. The highlands andmountains are areas with high rainfall, and are selected for planting hugetracts of pine plantations. These threatened species evolved on highlandswhere there was sufficient moisture, often separated from other highlands bydry plains. The moist conditions that promoted speciation, thereby assistingthe formation of a rich diversity of amphibians (see, for example, Channinget al. 2002, 2005; Clarke & Poynton 2005) are the same environmental conditionsthat are suitable for growing trees and other crops. Agriculture leadsto severe habitat modification and fragmentation. All the well-known areasplanted with exotic pines, such as the Amatola Mountains, the ElandsbergMountains, and even Table Mountain in Cape Town, are home to endemicspecies of amphibians that are now threatened with extinction due to habitatloss and conversion. Furthermore, many of these species may be at risk ofinfection with the fast-spreading chytrid fungus, which is responsible forthe extinction of amphibian species in many parts of the world (Daszak etal. 1999; Mendelson et al. 2006).One-quarter of threatened species do not have normal life-cycles withfree-swimming tadpoles. Instead, their tadpoles remain within the egg, anddevelop directly into small frogs. This negates the need for nearby pools ofwater, enabling these species to survive in areas where there is little chanceof pools forming, such as in very sandy areas, forests and mountain tops.However, the species with tadpoles display some very unusual breedingstrategies: some deposit eggs out of water, and the tadpoles must eithermove to water, or wait until the nest is flooded. The tadpoles of these speciesalso display a range of adaptations. Most develop in streams or quietpools, but the tadpoles of Broadley’s Ridged Frog Ptychadena broadleyi (EN)live on wet rocks in forests, and both species of ghost frogs Heleophryne sp.have tadpoles that develop in fast-flowing rocky streams. The tadpoles hangonto rocks in these turbulent habitats by using a large sucker-like mouth. TheChirinda Toad Stephopaedes anotis (EN) breeds in small pockets of watertrapped in tree-holes.Protected areas have proved to be the most important conservation tacticin southern Africa, provided that the conservation area is large enough toinclude a viable population size of the threatened species. Protected areasthat provide a haven for globally threatened amphibians include: InyangaNational Park, Chimanimani National Park and Chirinda Forest on the easternhighlands of Zimbabwe (Afrana inyangae, EN; Bufo inyangae, EN; Arthroleptistroglodytes, CR; Probreviceps rhodesianus, EN; Stephopaedes anotis,EN; Strongylopus rhodesianus, VU); Mt Mulanje Forest Reserve in Malawi(Afrana johnstoni, EN; Nothophryne broadleyi, EN; Arthroleptis francei, EN;Ptychadena broadleyi); Nyika National Park in Malawi (Bufo nyikae, VU), andTable Mountain National Park (Capensibufo rosei, VU; Heleophryne rosei, CR)on the Cape Peninsula of South Africa. Smaller reserves occur along the southand east coasts of South Africa, though these may not be adequate to sustainviable populations of threatened species in the region, such as Knysna SpinyReed Frog Afrixalus knysnae (EN), Natal Spiny Reed Frog Afrixalus spinifrons(VU), and Pickersgill’s Reed Frog Hyperolius pickersgilli (EN).Several threatened species occur almost entirely within strictly managed,albeit different, areas. For example, the Cape Platanna Xenopus gilli(EN) occurs within the well-established Table Mountain National Park, withother populations in the newly proclaimed and still developing AgulhasNational Park. However, even within these national parks, its security cannotbe guaranteed, principally due to hybridization with the Common PlatannaXenopus laevis (LC) (Kobel 1981; Picker et al. 1996) although the extent of thisproblem may be limited (Evans et al. 1997). The Desert Rain Frog Brevicepsmacrops (VU) occurs in a narrow coastal zone along the west coast of SouthAfrica and southern Namibia. This is a diamond mining area where accessis restricted, and no development is permitted. However, the diamonds aremined by removing all the old beach sand above the bedrock. This effectivelydestroys the habitat where this species is found. Of course, even within manyprotected areas, a lack of management means that natural forest is still beingremoved, and agricultural activities (both subsistence and large-scale) havebeen reported from within these. Most (81%) threatened species occur largely(72%) or entirely (9%) outside of any conservation area.Active protection of threatened species does occur in some cases, as inthe Western Cape province of South Africa, where CapeNature was able toboth thwart construction plans for a road that would have had devastatingimpacts on the breeding habitat of the Critically Endangered Micro FrogMicrobatrachella capensis, and establish a new breeding site. This speciesis also being actively monitored by CapeNature, although continual activeintervention by local authorities is required to halt the damaging effects ofalien invasive plants on the breeding sites. As far as can be determined,the only threatened species that are subject to official long-term monitoringactivities are Rose’s Ghost Frog Heleophryne rosei (CR), the Micro Frog, andCape Platanna. Among local conservation authorities, only CapeNature seemsto be paying sufficient attention to the problem of threatened amphibians. Inmany other protected areas, including those to the north of southern Africa, itis not unusual for staff of reserves to be unaware of the importance of theirreserve as a haven for a population of a globally threatened species.Conservationists are able to determine effectively which species arethreatened. We are also able to determine which species require the mostappropriate conservation response, be it the establishment of a protectedarea or controlling invasive species. However, it seems that we are unable toinitiate long-term programmes involving active management. Will we sit onthe sidelines and tick off the species as they become extinct? Where therewas once a rallying call from African conservationists, ‘Save the Rhino!”, wenow need to encourage a ‘Save the Frog!” campaign.ReferencesAlan Channing and Andrew TurnerChanning, A., Moyer, D.C. and Howell, K.M. 2002. Description of a new torrent frog in thegenus Arthroleptides from Tanzania (Amphibia, Anura, Ranidae). Alytes 20:13-27.Channing, A., Menegon, M., Salvidio, S. and Akker, S. 2005. A new forest toad fromthe Ukaguru Mountains, Tanzania (Bufonidae: Nectophrynoides). African Journal ofHerpetology 54:149-157.Clarke, B.T. and Poynton, J.C. 2005. A new species of Stream Frog, genus Strongylopus (Anura:Ranidae)from Mount Kilimanjaro, Tanzania, with comments on a ‘northern volcanicmountains group’ within the genus. African Journal of Herpetology 54:53-60.Daszak P., Berger L., Cunningham, A.A., Hyatt, A.D., Green, D.E. and Speare, R. 1999.Emerging infectious diseases and amphibian population declines. Emerging InfectectiousDiseases 5:735-48.Evans, B.J., Morales, J.C., Picker, M.D., Kelley, D.B. and Melnick, D.J. 1997. Comparativemolecular phylogeography of two Xenopus species, X. gilli and X. laevis, in the southwesternCape Province, South Africa. Molecular Ecology 6:333-343.Kobel, H.R., du Pasquier, M. and Tinsley, R.C. 1981. Natural hybridization and gene introgressionbetween Xenopus gilli and Xenopus laevis laevis (Anura:Pipidae). Journalof Zoology 194:317-322.Minter, L.R., Burger, M., Harrison, J.A., Braack, H.H., Bishop, P.J. and Kloepfer, D. (eds.).2004. Atlas and Red Data Book of the Frogs of South Africa, Lesotho and Swaziland.Smithsonian Institution, Washington D.C., USA.Mendelson, J.R., Lips, K.R., Gagliardo, R.W., Rabb, G.B., Collins, J.P., Diffendorfer, J.E.,Daszak, P., Ibanez, R., Zippel, K.C., Lawson, D.P., Wright, K.M., Stuart, S.N., Gascon,C., da Silva, H.R., Burrowes, P.A., Joglar, R.L., La Marca, E., Lotters, S., du Preez, L.H.,Weldon, C., Hyatt, A., Rodriguez-Mahecha, J.V., Hunt, S., Robertson, H., Lock, B.,Raxworthy, C.J., Frost, D.R., Lacy, R.C., Alford, R.A., Campbell, J.A., Parra-Olea, G.,Bolanos, F., Domingo, J.J., Halliday, T., Murphy, J.B., Wake, M.H., Coloma, L.A., Kuzmin,S.L., Price, M.S., Howell, K.M., Lau, M., Pethiyagoda, R., Boone, M., Lannoo, M.J.,Blaustein, A.R., Dobson, A., Griffiths, R.A., Crump, M.L., Wake, D.B. and Broody, E.D.2006. Confronting <strong>Amphibian</strong> Declines and Extinctions. Science 313(5783):48.Picker, M.D., Harrison, J.A. and Wallace, D. 1996. Natural hybridisation between Xenopuslaevis laevis and X. gilli in the south-western Cape Province, South Africa. In: R.C.Tinsley and H.R. Kobel (eds.), The Biology of Xenopus, pp. 61-71. Zoological Societyof London, Oxford, UK.Afrana johnstoni (Endangered) is known only from montane grassland and forest habitats on Mount Mulanje insouthern Malawi. © Alan ChanningTable Mountain National Park on the Cape Peninsula of South Africa is home to the only known population of theeponymous Table Mountain Ghost Frog Heleophryne rosei (Critically Endangered), a cryptic species found from 240-1,060m asl. © Richard Boycott
CHAPTER 6. AMPHIBIANS OF THE AUSTRALASIAN REALMJean-Marc Hero, Stephen Richards, Ross Alford, Allen Allison, Philip Bishop,Rainer Günther, Djoko Iskandar, Fred Kraus, Frank Lemckert, James Menzies,Dale Roberts and Michael TylerTHE GEOGRAPHIC AND HUMAN CONTEXTThe Australasian Realm as defined here includes Australia and New Zealand, and subsumesthe Papuan Sub-region incorporating the Solomon Islands, Papua New Guinea and partsof Indonesia (Papua Province on the island of New Guinea, and the Malukus, including theislands of Halmahera, Ceram, Obi, Misool, Aru, Ambon, Buru and Kai). The Oceanic Region,which includes islands in the northern and eastern Pacific Basin, is usually treated as aseparate biogeographic region (Olsen et al. 2001), but as it has only three native amphibiansoccur in the region (two in Fiji and one in Palau) and their evolutionary affinities are withAustralasian taxa so it is combined with Australasia for the purpose of this analysis.The Australasian continental plate includes mainland Australia, the island of Tasmaniaand the southern half of the island of New Guinea. It was part of the southern landmassof Gondwana until about 96 Ma, though connections with Antarctica and South Americacontinued until more recently. The Indo-Australian Plate started drifting northwards (withthe Indian and Australasian portions separating), colliding with the Eurasian Plate to thenorth approximately 15 Ma, and creating the uplift that formed New Guinea’s spectacularmountainous spine. Much of New Guinea, particularly the northern portions, is a complexmosaic of ‘terrains’, fragments of the earth that have embedded onto the mainland atdifferent times, each with different origins and ages of impact. This incredibly complexgeological history and one of the most active orogenies on earth has resulted in a spectacularlydiverse topography and fauna in a relatively small area. The Torres Strait, ashallow water body that now separates Australia from New Guinea, has formed a bridgebetween the two land-masses on several occasions in the past during glacial periodswhen global sea levels were lower. The most recent land connection between Australiaand New Guinea lasted until about 7,000 years ago. Tasmania was similarly connected tothe Australian mainland during times of glacial maxima when Bass Strait was exposed.The islands of Wallacea form the western boundary of the region. These islands enabledcross colonization of plants between Southeast Asia and Australia-New Guinea but thedeep ocean straits between islands appear to have hindered the exchange of many groupsof amphibians (though some dispersal appears to have taken place due to tectonic accretion,for example allowing Oreophryne to reach Sulawesi from the east, and Rana toreach New Guinea from the west).Around 85 Ma, a land mass known as Tasmantis broke away from Australia. All that nowremains of this largely submerged landmass is New Zealand at its southern end and NewCaledonia at the northern end. Located on the south-eastern boundary of the Australian platewhere it converges with the Pacific plate, New Zealand consists of two main islands, calledthe North and South Islands, and a number of smaller islands. Its position on the boundary oftwo converging plates is reflected in the many active volcanoes on the North Island.Australia is one of the flattest countries in the world. Because it lies in the middle ofthe Australian tectonic plate there has been very little geological activity since the plateseparated from Gondwana. Instead the landscape has been moulded by constant weatheringand erosion over millions of years. The highest peak is Mount Kosciuszko (2,228m) inthe Snowy Mountains of New South Wales; these form part of the Great Dividing Range,which runs north-south along nearly the entire east coast of the country. This mountainrange promotes significant rainfall along the east coast, but substantially prevents rainfallfrom the Pacific Ocean reaching the interior. Hence, the east coast includes a wide rangeof wet forest habitats (especially in the more mountainous areas), but the vast interior ofAustralia, stretching all the way to the west coast, is predominantly desert, semi-desertor savannah. The north of the country is tropical, and is dominated by savannah, eucalyptwoodland, grassland, and desert habitats, with rainforests being found along parts of theeast coast (mainly in mountainous regions) and in pockets scattered further west. There aresignificant areas of rocky escarpment country in the Kimberley and Arnhem Land. Temperateclimates are found only in the south-east and south-west corners of the country. Inlanddroughts lasting several seasons are not uncommon as rainfall can be highly variable andpatchily distributed.The island of New Guinea is divided politically, with the eastern half of the island alongwith many islands off the north and east coast (including Admiralty and Bismarck archipelagos,and the islands of Bougainville and Buka in the Solomons Archipelago) forming thecountry of Papua New Guinea, and the western half of the island belonging to Indonesia. Awide, east-west range of mountains dominates the interior of the island, with the highestpeak being snow-covered Puncak Jaya (5,030m) in Papua, Indonesia. To the north and southof the central mountains are vast lowland rainforests and complex wetland habitats. Theseare most conspicuously developed in the Trans-Fly region of south-central New Guineawhere seasonally flooded savannah grasslands form a habitat unique in New Guinea (buttypical of northern Australia).New Zealand is geographically very isolated, the closest countries being Australia some2,000km to the west, and New Caledonia, Fiji and Tonga, between 1,400 and 2,000km to thenorth. Mountains cover about two-thirds of the South Island and 20% of the North Island,the highest peak being Aoraki/Mount Cook (3,754m) on the South Island. On either side ofthe central mountain ridges are rolling fertile plains, and due to its southerly latitudes thecountry has a temperate climate. Rainfall is generally moderate to high in New Zealand.Human population density is very low throughout the Australasian Realm. The SolomonIslands have the highest population density (17 people/km 2 ), followed by New Zealand(15), Papua New Guinea (11), Indonesia (Papua Province only: 6) and Australia (less than3). Indonesia is the fourth most populous country in the world, but only 1% of Indonesianslive in Papua Province, even though the landmass of Papua constitutes around 22% of thetotal landmass of the country. Population growth is high (over 3% per annum) in PapuaProvince, partly due to a high birth rate but also due to immigration from other provincesof Indonesia. The Solomon Islands and Papua New Guinea also have growth rates above2% (approaching 4% in many coastal areas), but Australia and New Zealand have growthrates that are less than 1% per annum.New Guinea has been subject to relatively low anthropogenic disturbance and it has beenstated that around 70% of the natural environment on the island remains intact (Mittermeieret al. 2002), although some parts of the island have experienced serious habitat loss (and thelevel of loss is likely to be higher than has been realised). The extensive tropical rainforestwilderness on the island is the world’s third largest rainforest block after the Amazon andCongolese forests. However, logging concessions now cover much of the lowland forest inNew Guinea and nearly all of New Britain; unsustainable logging is the most immediatethreat to the biodiversity of these regions. In Papua New Guinea the majority of people stillpractice subsistence agriculture and live in traditional societies, and the GDP per capita islow ($2,400 in 2005). The Solomon Islands has a similarly low GDP per capita ($1,700 in2002), and Indonesia ($3,700 in 2005 averaged across the whole country, not just PapuaProvince) is only slightly higher.Australia has a very low human population density, but with the majority of the peopleliving along the east and south-east coast, coupled with the high GDP per capita, habitatloss and degradation has been particularly serious in these regions. There has also beenextensive habitat loss in south-western Australia (which is a Mediterranean-type system).Likewise, New Zealand has experienced significant habitat loss and degradation with naturalhabitats covering only 22% of the country. Invasive species have had a significant impacton native species both in Australia and New Zealand.GLOBAL CONSERVATION STATUSThere are 544 amphibians currently recorded from the Australasian Realm, 69 (13%) ofwhich are considered globally threatened or Extinct. This is much lower than the globalaverage of 33% 1 . However, the number of DD species, 178 (33%), is much higher thanthe global average of 23%. As sufficient information becomes available to assess thesespecies, it is expected that some of them will contribute to an increase in the percentageof threatened species in the region.The Australasian Realm accounts for only 3% of globally threatened amphibians, whichis relatively low considering that 9% of the world’s amphibian species occur here. The regioncontains 4% of the CR, 3% of the EN and 4% of the VU species in the world.Of the world’s 34 known amphibian extinctions, three occurred in the Australasian Realmand all of them were species endemic to Australia. The only two species within the familyRheobatrachidae are now both Extinct: the Southern Gastric-brooding Frog Rheobatrachussilus was last seen in the wild in 1981 (Richards et al. 1993), while the Northern GastricbroodingFrog Rheobatrachus vitellinus was last recorded in the wild in 1985 (Ingram andMcDonald 1993; McDonald and Alford 1999) (see Essay 6.1). The third Extinct species,Taudactylus diurnus, has not been recorded in the wild since 1979 (Czechura and Ingram1990). The reason(s) for the decline of all three species has still not been confirmed despiteextensive research (Tyler and Davies 1985), but the disease chytridiomycosis (which wasunknown at the time of these extinctions) must now be suspected. In addition, there are fiveCritically Endangered species that are considered Possibly Extinct (Litoria castanea, Litorialorica, Litoria nyakalensis, Litoria piperata and Taudactylus acutirostris). This represents 4%of the global total of 130 Possibly Extinct species.SPECIES RICHNESS AND ENDEMISMSpecies Richness and Endemism Across TaxaThere are 544 amphibian species occurring in the Australasian Realm (9% of the world’stotal). Only one of the three orders of amphibians, the Anura, is found here but of the sevenanuran families native to the region, four are endemic. The level of endemism increases atthe generic level, with 90% (45 of 50) of genera endemic, and again at the species level,with 99% (538 of 544) of species endemic.The high level of endemism is largely due to the insular nature of the region. The boundarybetween Australasia and Indomalaya is also defined here in a manner that minimizes thenumber of amphibians occurring across both regions. Whereas the boundary between theAustralasian and Indomalayan realms is often taken as Wallace’s line (an imaginary linerunning between Borneo and Sulawesi and Bali and Lombok in Indonesia; e.g. Newton 2003),the boundary is here taken to lie further to the east between Sulawesi and the Maluku islands(approximating Tyler 1999a), as this reflects amphibian distribution patterns better.Seven of the world’s 48 amphibian families are found in the region, and four of theseare endemic: Leiopelmatidae, Limnodynastidae, Myobatrachidae, and Rheobatrachidae.The characteristics of these families are provided in Chapter 1 2 . There have been varioustaxonomic arrangements of the families defined here as Limnodynastidae, MyobatrachidaeCeratobatrachus guentheri (Least Concern)is an abundant direct-developing ranid frogfrom the Solomon Islands and Bougainvilleand Buka Islands in Papua New Guinea. Itinhabits the forest floor in tropical rainforest,and persists in secondary forest, rural gardensand other degraded areas. © Piotr NaskreckiFigure 1. Summary of Red List categoriesfor amphibians in the Australasian Realm.The percentage of species in each categoryis also given.Red List Category Number of speciesExtinct (EX) 3Extinct in the Wild (EW) 0Critically Endangered (CR) 16Endangered (EN) 21Vulnerable (VU) 29Near Threatened (NT) 10Least Concern (LC) 287Data Deficient (DD) 178Total Number of Species 54433%1% 3% 4%5%2%53%
66Threatened <strong>Amphibian</strong>s of the WorldThe Australian Lace-lid Nyctimystes dayi (Endangered)is a treefrog (Hylidae) that is endemicto the Wet Tropics of northern Queensland,Australia. In the 1980s and early 1990s itdisappeared from upland sites throughout itsrange, but still persists in suitable habitat atlow elevations. © Jodi RowleyTable 1. The number of Australasian amphibiansin each taxonomic Family presentin the region.FamilyNative species(endemicsto region)Family EX CR EN VU NT LC DD Totalof OrderAustrochaperina parkeri (Data Deficient) is onlyknown from two localities near Lae in PapuaNew Guinea. It is in the Family Microhylidae,which comprises over half the frog species ofthe island of New Guinea, all of which breedby direct development, and many of which arevery poorly known. © Fred KrausNumber threatenedor Extinct% Threatenedor ExtinctAnuraHylidae 0 6 6 12 2 93 42 161 24 15Leiopelmatidae 0 1 1 2 0 0 0 4 4 100Limnodynastidae 0 1 7 2 1 37 2 50 10 20Microhylidae 0 2 4 6 3 71 111 197 12 6Myobatrachidae 1 6 2 4 3 49 6 71 13 18Ranidae 0 0 1 3 1 37 17 59 4 7Rheobatrachidae 2 0 0 0 0 0 0 2 2 100TOTAL ANURA 3 16 21 29 10 287 178 544 69 13Table 2. The number of species within eachIUCN Red List Category in each Family andOrder in the Australasian Realm. Introducedspecies are not included.Figure 2. The species richness of amphibiansin the Australasian Realm, with darker colourscorresponding to regions of higher richness.Colour scale based on 10 quantile classes;maximum richness equals 51 species.Percentage of Percentage ofspecies in region species in familythat are endemic that are endemicto regionNative genera(endemicsto region)Percentage ofgenera in regionthat are endemicPercentage ofgenera in familythat are endemicto regionAnuraHylidae 161 (159) 99 20 3 (2) 67 4Leiopelmatidae 4 (4) 100 100 1 (1) 100 100Limnodynastidae 50 (50) 100 100 8 (8) 100 100Microhylidae 197 (197) 100 46 19 (18) 95 26Myobatrachidae 71 (71) 100 100 11 (11) 100 100Ranidae 59 (55) 91 8 7 (4) 57 10Rheobatrachidae 2 (2) 100 100 1 (1) 100 100TOTAL ANURA 544 (538) 99 10 50 (45) 90 12TOTAL ALL AMPHIBIANS 544 (538) 99 9 50 (45) 90 10and Rheobatrachidae. Limnodynastidae and Rheobatrachidae are sometimes included assubfamilies of Myobatrachidae, with the species defined here as members of the Myobatrachidaeincluded in the subfamily Myobatrachinae (Heyer and Liem 1976). Another taxonomicarrangement recognizes two families, separating the Limnodynastidae as a separate familyfrom the Myobatrachidae (Zug et al. 2001; Davies 2003a, b; Iskandar and Colijn 2000). TheRheobatrachidae were placed in a separate family by Laurent (1980, 1986), and these threeseparate families are recognized here. 3The three non-endemic families occurring in the region are Microhylidae, Hylidae, andRanidae. Together, these three non-endemic families contain 77% of the region’s species.The family with the largest number of species in the region is Microhylidae with 197 species(all endemic), and representing 46% of the family’s global species diversity. Most of thesespecies are found on New Guinea, and comprise almost half of the total amphibian faunaon the island. There are 19 genera of the Microhylidae in the region, which represents 28%of the family’s generic diversity. All of these are endemic to the region except for the genusOreophryne which occurs as far west as the Philippines. The three most speciose generaare Oreophryne (34 species in the region) that within Australasia is restricted to the Papuansub-region, and Cophixalus (35 species) and Austrochaperina (24 species) both of whichoccur in Australia and in the Papuan sub-region. All microhylids occurring in the region havea reproductive strategy in which embryonic and larval development occurs entirely withinthe egg capsule and they do not rely on free-standing water for breeding.The second largest family in the region is the Hylidae 4 with 161 species, of which 159are endemic to the region (representing 20% of the family’s global species diversity). Threehylid genera, representing only 6% of the global diversity at the genus level, are representedin the region. The largest genus, and the only one not endemic to the region, is Litoria (124species), which ranges across Australia and the Papuan sub-region. Two of the species inthe genus occur in both the Australasian and Indomalayan regions (Litoria infrafrenata and L.rubella) and one is endemic to the Indomalayan region (Litoria everetti). The second largestgenus, Nyctimystes (24 species), also occurs in Australia and the Papuan sub-region whilethe smallest genus, Cyclorana (13 species), is endemic to Australia. All hylids occurring inthe region lay eggs in water where free-swimming larvae develop until metamorphosis.The remaining non-endemic family occurring in the region is the globally widespreadRanidae, represented in the region by 59 species (55 endemic) comprising 9% of the globalspecies diversity of the family. Within Australasia ranids are primarily found in the Papuansub-region with only one species, Rana daemeli, extending its range into Australia. The threenative amphibians of the Oceanic Region are members of the region’s most speciose ranidgenus, Platymantis (29 species). In total there are seven native ranid genera in the region,which is 10% of the global diversity of the family at the genus level. Four of these generaare endemic: Batrachylodes (8 species), Ceratobatrachus (1 species), Discodeles (5 species)and Palmatorappia (1 species). The species in these genera have a ‘direct development’reproductive strategy like the microhylids, but species within the genera Limnonectes andRana have aquatic larvae. 5There are 69 threatened or extinct species in the Australasian Realm spread across allseven families (Table 2). The family with the highest number of threatened species (24) isthe Hylidae. The most diverse family in the region, the Microhylidae, has relatively fewthreatened species (only 12 of 197 species being threatened). Comparing the percentageof species that are threatened or extinct reveals large variation between families. Twofamilies have 100% of their species threatened or Extinct. Both species within the familyRheobatrachidae are Extinct, and all four species within the New Zealand endemic familyLeiopelmatidae are threatened (and see Essay 6.2).The least threatened families are the Microhylidae and Ranidae, with only 6% and 7%of species in threatened categories, respectively. Both of these families have in commonthat they are primarily found in the Papuan sub-region, and all microhylids and the majorityof ranids in the region are direct-developing species. Compared with the other families,they also have a much higher percentage of species in the Data Deficient category: 56%for Microhylidae and 29% for Ranidae. This is partly a reflection of how poorly surveyed thePapuan sub-region is for amphibians. As more research is done in the Papuan sub-region itis to be expected that the number of threatened species in these two families will increase,at least to some extent, although direct-developing species in this region do not appear tobe at risk from chytridiomycosis. Microhylids in northern Australia have not declined dueto this disease, even in areas where other species have disappeared.Geographic Patterns of Species Richnessand EndemismA map of overall amphibian species richness within the Australasian Realm is shown inFigure 2. The highest species richness of amphibians is found in the tropics, where thenumber of species is highest in the central mountains of New Guinea and the Wet Tropicsrainforests of north-eastern Queensland in Australia. In Australia amphibian species richnessis concentrated in the areas of highest rainfall including the east (in particular in thetemperate forest systems in the New South Wales / Queensland border area) and northcoastal regions, and the south-western tip of Western Australia. Areas of lowest speciesrichness coincide with Australia’s arid interior and central southern coast. In the Papuansub-region, Papua New Guinea has a higher documented species richness than PapuaProvince (Indonesia), but this is most likely an artefact of sampling because there has beensubstantially greater survey effort in Papua New Guinea.The pattern of species richness illustrated in Figure 2 will require modification as surveyeffort is increased in poorly documented areas. Australia and New Zealand are both wellsurveyed for amphibians and the rate of new species descriptions is low. In comparison, thePapuan sub-region is one of the least studied regions in the world, and it is estimated thatmore than half of the amphibian species in New Guinea remain to be described (Günther2006a). Many species in the Papuan sub-region are still known only from their type localitiesand perhaps one other locality, whereas the known range of species in Australia and NewZealand is much more likely to be representative of their actual ranges. There has beenrelatively little herpetological research conducted in the Solomon Islands and on the offshoreislands of Papua New Guinea, and it is expected that documented amphibian diversity inthese regions will increase in the future. However, there has recently been considerablesurvey work on the islands offshore of south-eastern Papua New Guinea and the knownamphibian diversity there has increased markedly. Although most of these new additionshave yet to be described, a number of new range records have been published (Kraus andAllison 2004; Kraus and Shea 2005).The vast majority of threatened species in the Australasian Realm are endemic toAustralia (see Figure 3) (and see Essay 6.3). The highest concentrations are found alongthe east and south-east coast, largely congruent with the areas of highest species speciesrichness. However, the north coast, a relatively species-rich region, has no threatenedspecies. Two factors appear to be contributing to this pattern: firstly, the fertile plains ofthe east and south-east coast of Australia are where the vast majority of people live, and
Chapter 6. <strong>Amphibian</strong>s of the Australasian Realm 67Figure 3. a) The richness of threatenedamphibians in the Australasian Realm, withdarker colours corresponding to regions ofhigher richness. Colour scale based on fivequantile classes; maximum richness equals11 species. b) The richness of CR amphibiansin the Australasian Realm. Maximum richnessequals five species.a. b.hence where ongoing habitat loss is most severe; and, secondly, the current distribution ofthe amphibian chytrid fungus excludes the north coast west of north-eastern Queensland.The chytrid fungus was first detected near Brisbane on the east coast of Australia in 1978(Speare and Berger 2005). Since then it has been found in the north and south, and it nowappears to be established in coastal regions from Far North Queensland on the east coast,southwards through New South Wales and Victoria, and along the southern coast to Adelaidein South Australia. On the west coast it has been found in Perth and across most of the highrainfall zone in south-western Western Australia (Speare and Berger 2005). The spread ofrecorded occurrences of the disease is continuing with amphibians infected with chytridbeing recorded in Tasmania for the first time in late 2004 (Obendorf 2005). It is possiblethat, if chytrid spreads into areas where it is not already present, more species will becomethreatened. However, chytrid fungus has relatively limited climatic tolerances with respectto both humidity and temperature (Woodhams et al. 2003). It might be less likely to havemajor impacts in the wet dry-tropical eucalypt woodland/grassland communities acrossmuch of northern Australia where dry seasons are too extreme and summer temperaturetoo high for persistence, or in south-western Australia for similar reasons: extreme summerdrought and associated high temperatures.In New Zealand the map of amphibian species richness and threatened species richnessare identical because all four native amphibians are threatened. In the Oceanic region, onlyone species is threatened, the Fijian Ground Frog Platymantis vitiana (EN), which is nowfound only on the small islands of Ovalau, Gau, Taveuni, and Viwa in Fiji (its tiny range isdifficult to see in Figure 3a).The Papuan sub-region (see Essay 6.4) has very few threatened species, particularly whenconsidering its high species richness. The documented distribution of threatened speciesis incomplete due to severe lack of knowledge, but may also partly reflect a lack of certainthreatening processes. For example, the chytrid fungus, which has had such a devastatingimpact on amphibians in Australia, has not been found in the region (though attempts todocument this are limited to non-existent). There has also been relatively less habitat lossand degradation compared with Australia. However, widespread environmentally destructivelogging throughout the Papuan sub-region (which is ongoing especially in parts of PapuaNew Guinea) may threaten numerous species in the future, particularly on smaller islandarchipelagos such as the Solomon Islands and the Admiralty and Bismarck Archipelagos.The distribution of Critically Endangered species is highly congruent with that ofthreatened species overall (Figure 3b). New Zealand and the east coast of Australia remainfocal points, with particular concentrations of Critically Endangered species in the WetTropics region of far northern Queensland, and in the central mountains from Fraser Islandto Sydney. Tasmania is no longer highlighted, possibly because the chytrid fungus has onlyvery recently been confirmed on the island and its impact on local amphibian populationsis not yet known. In the Papuan sub-region one Critically Endangered species, Albericussiegfriedi, is known 6 . It has been recorded from only one location, Mount Elimbari, in PapuaNew Guinea (barely visible in Figure 3b).Species Richness and Endemism within Countries<strong>Amphibian</strong> species richness in the Australasian Realm is greatest on the two largest landmasses of Australia and New Guinea (see Figure 2). Only three native amphibians occur inthe Oceanic region (0.05% of the global total), compared with 187 birds (2% of the globaltotal) (BirdLife International 2004). The only two countries in the Oceanic region that havenative amphibians are Fiji (Platymantis vitiana and P. vitiensis) and Palau (Platymantispelewensis). New Caledonia has one introduced species (Litoria aurea) as do the NorthernMariana Islands, American Samoa, the Bonin Islands, the Federated States of Micronesia,Guam and Tuvalu (Bufo marinus in each case).Papua New Guinea has the most native amphibians in the Australasian Realm (245species) and this number is predicted to almost double as species descriptions continue.Australia is the second-most diverse country (214 species), although as species descriptionscontinue it is likely that Indonesian New Guinea (Papua) will eventually overtakeAustralia’s total in the region. 7 The number of species in the Solomon Islands is relativelylow (19 species) and there will be a moderate increase in the known fauna with futureherpetofaunal surveys. Documentation of the New Zealand native frog fauna is almostcertainly complete, although recent genetic work on isolated populations of Leiopelmahochstetteri (Gemmel et al. 2003) suggests that there might be more than six distinct crypticspecies. New Zealand also has three species introduced from Australia, two of which arethreatened in their native ranges.The only overview of the amphibians of the whole region is that of Tyler (1999a). Thereis an extensive overview literature, and guide books, on the amphibians of Australia (e.g.,Barker et al. 1995; Glasby et al. 1993; Tyler 1999b; Cogger 2000), and recent assessments ofamphibian declines throughout Australia include Hero and Shoo (2003), Hero and Morrison(2004), Hero et al. (2005) and Hero et al. (2006). Slatyer et al. (2007) made an assessmentof endemism and species-richness patterns of Australian frogs. The most recent overviewof the small frog fauna of New Zealand is by Gill and Whitaker (1996). Menzies (2006)provides the first review of the amphibians of the Papuan sub-region.The percentage of species that are endemic to each country in the region varies from100% to 5% (Figure 5). Three countries in the region – New Zealand, Fiji and Palau – haveendemism of 100%, although all three of these countries have only very few species (four,two and one, respectively). Of the three countries with high species richness, Australiahas the highest level of endemism at 93%, followed by Papua New Guinea with 67% andIndonesia with 59% (the lower levels of endemism in the latter two countries are due to thebiogeographically arbitrary border between them, and the percentage of endemics on theisland of New Guinea is over 95%). The Solomon Islands has the lowest level of endemismwith only one of its nineteen native species, Discodeles malukuna (DD), being endemic.However, in a biogeographical context these levels of endemism are meaningless. Like theisland of New Guinea, the level of endemism in the Solomon Islands Archipelago wouldbe substantially greater if this natural and discrete biogeographic ‘unit’ had not been splitby political boundaries.All of the countries in the Australasian Realm that have native amphibians also havethreatened species with the exception of Palau (see Figure 6). Australia contains almostthree-quarters (71%) of the region’s 66 threatened species and all but two of these speciesare endemic to the country. Predicting the impact generated by the possible spread of thepathogenic chytrid fungus throughout Australia is difficult as its spread into semi-arid and aridareas across much of southern and northern Australia might have less impact than expected,as described above. In contrast, the most diverse country, Papua New Guinea, has only 10threatened species, of which eight are endemic. Indonesia and New Zealand, with 148 andfour native species, respectively, amazingly have the same number of threatened species.As more survey work is completed in the Papuan sub-region, the number of threatenedspecies in Indonesia, Papua New Guinea and the Solomon Islands probably will increase.This increase is likely to come from documenting newly described species with severelyconstrained ranges and threatened habitats, as well as from improved data that will permita more realistic assessment of species currently in the Data Deficient category.Figure 4. The number of amphibians presentin and endemic to each Australasian country.*denotes countries not entirely within the AustralasianRealm, hence only the species whoseranges fall within the region are included.Figure 5. Percentage of species endemic toeach Australasian country. *denotes countriesnot entirely within the Australasian Realm,hence only the species whose ranges fallwithin the region are included.Figure 6. The number of threatened amphibianspresent in and endemic to eachAustralasian country. Countries with nothreatened species are not included in thediagram. *denotes countries not entirelywithin the Australasian Realm, hence only thespecies whose ranges fall within the regionare included.Figure 7. Percentage of native species that arethreatened. Countries with no threatened speciesare not included in the diagram. *denotescountries not entirely within the AustralasianRealm, hence only the species whose rangesfall within the region are included.Papua New GuineaNew ZealandAustraliaNew ZealandAustraliaFijiPapua New GuineaFijiIndonesia*Solomon IslandsNew ZealandPalauAustraliaPapua New GuineaNew ZealandIndonesia*AustraliaSolomon IslandsFijiIndonesia*Solomon IslandsPapua New GuineaPalauSolomon IslandsFijiIndonesia*0 50 100 150 200 2500 20 40 60 80 1000 10 20 30 40 50Number of speciesPercentage of endemic speciesNumber of threatened speciesEndemics Non-endemicsEndemics Non-endemicsFigure 4 Figure 5 Figure 6 Figure 70 20 40 60 80 100Percentage of species threatened
68Threatened <strong>Amphibian</strong>s of the WorldLeft: Litoria prora (Least Concern) is a hylidtreefrog from New Guinea. It is an arborealspecies and is found near small streams andforest pools in lowland and foothill rainforests.It breeds in pools and slow-flowing portions ofstreams. © Stephen RichardsRight: The Sunset Frog Spicospina flammocaerulea(Vulnerable) in the Family Myobatrachidaeis known only from a small area of southwesternAustralia, where it was discoveredin 1994. It occurs only in a few isolated peatswamps. © Ross KnowlesThere is extreme variation in the percentage of species that are threatened in each countryin the region (see Figure 7). With 100% of its native species threatened, New Zealand istop of the list, followed by Fiji with 50%, but these countries only have four and two nativespecies, respectively. When considering countries with high species richness, Australia hasby far the greatest percentage of threatened species, 22% of extant species, compared withonly 4% in Papua New Guinea and 3% in Indonesia. These figures reflect the impact that chytridiomycosis,habitat loss and other threatening processes have had in Australia comparedwith the relatively low impact of threats in New Guinea, and perhaps also reflect the lackof data from Indonesia and Papua New Guinea. Australia, however, still has a significantlylower percentage of its species threatened than the global average of 33%.Assessments of the conservation status of Australasian amphibians at national levelhave been carried out in Australia (Tyler 1997; Campbell 1999; Hero and Morrison 2004;Hero et al. 2006; Clayton et al. 2006; and see Essay 6.3), and in New Zealand (Newman1996; Hitchmough 2002).There are only 16 Critically Endangered species in the Australasian Realm, but 14 ofthese occur in Australia (where the impacts of chytridiomycosis and habitat loss have beenmost severe) and one each in New Zealand and Papua New Guinea.HABITAT AND ECOLOGYHabitat PreferencesMost amphibians in the region are found in forests (73%), and in particular in tropical forest(68%) (Table 3; Figure 8). There are also large numbers of species in grassland (19%) andshrubland (13%). However, the percentage of species in each of these habitats that arethreatened is notably different: 14% of forest-dwelling species are threatened, but only6% of grassland species and 10% of shrubland species are threatened. Similar numbers ofamphibians are associated with flowing freshwater and still open freshwater; however, morethan twice the total number of species associated with flowing freshwater is threatenedcompared with species in still open freshwater. This reflects a global trend for amphibiansassociated with forests and flowing freshwater to be more likely to decline rapidly (Stuartet al. 2004). Hero and Morrison (2004), Hero et al. (2005) and Hero et al. (2006) previouslynoted that montane wetland and streamside species are the most likely ones to experienceenigmatic declines in Australia.Significantly more lowland tropical forest species below 1,000m (52%) than montanetropical forest species above 1,000m (33%) occur in the region, and a higher percentage oflowland species is threatened (16%) compared with montane species (11%). This is mostlikely because the mountain ranges in Australia, where most threatened species in the regionare found, are relatively low in elevation, and because the higher elevation mountain rangesof New Guinea are very poorly surveyed (so that a large proportion of montane species inthis region is considered Data Deficient).No amphibians occurring in savannah are considered threatened and this is largely areflection of the wide ranges of these species. Interestingly, 25% of species in the regionare found in secondary terrestrial habitats, and a significant proportion (7%) of these speciesis threatened.Breeding StrategiesThe most common reproductive mode amongst Australasian amphibians involves a freeswimminglarval stage or ‘larval development’ (53%), followed closely by ‘direct development’(47%) in which embryonic and larval development is completed within the egg capsule(Table 4). There are no known live-bearing species in the region, but the reproductiveReproductive mode All Species Threatened orExtinct speciesTable 4. Australasian amphibians categorized by reproductive mode.strategy of many species is inferred. When compared with global trends in reproductivemode, the Australasian Realm has a significantly higher proportion of direct developers(30% of species globally are direct developers), and a significantly lower proportion oflarval developers (68% of species globally are larval developers). This is largely causedby nearly 200 species of the family Microhylidae occurring mainly in New Guinea, all ofwhich are direct developers.The percentage of larval-developing species that are threatened is almost double that ofdirect developers (Table 4). This contradicts the global trend, where 45% of direct developersand 28% of larval developers are threatened. This apparent contradiction can be explainedby considering the geographical distribution of species exhibiting different breeding strategies.In Australia, where 47 of the region’s 66 threatened species are found, 188 of the217 native species are larval developers. In Papua New Guinea, where only 10 species arethreatened, 160 of the 244 native species are direct developers. The situation is similar inIndonesia, where only four species are threatened, and 83 of the 148 native species aredirect developers. Australia is the only country in the region in which the proportion of larvaldevelopers is higher than that of direct developers. Compared with the other two megadiversecountries in the region, Papua New Guinea and Indonesia, Australia is also the country mostimpacted by threats such as chytridiomycosis, introduced species, and habitat loss (Heroand Morrison 2004; Hero et al. 2005, 2006). Chytridiomycosis is more often implicated indeclines of stream-associated, usually larval-developing, species (Lips et al. 2003), althoughsome direct developers that are associated with streams have also been impacted by thedisease. In New Zealand, contrary to the general pattern, the fully terrestrial Leioipelmaarcheyi (CR) has experienced a decline due to chytridiomycosiss (Bell et al. 2004), whereasno declines have been detected in the sympatric stream-dwelling frog (L. hochstetteri, VU).In Fiji and Palau, all of the native species are fully terrestrial direct developers.MAJOR THREATS% Threatenedor ExtinctDirect development 255 24 9Larval development 288 45 16Live-bearing 0 0 -Not known 1 0 0The most significant threat to species in the region is habitat loss, impacting three-quartersof threatened species (Table 5; Figure 9). This trend is global and habitat loss has beenidentified as a major threat for birds and mammals as well as amphibians (Baillie et al.2004). Of particular interest is the second-most significant threat, invasive species 8 (primarilysalmonids and Gambusia; Gillespie and Hero 1999), which are affecting two-thirds of allthreatened species in the region, compared with only 11% of threatened species globally.This highlights the particularly severe impact that invasive species are having on nativewildlife in Australia, New Zealand, and oceanic islands such as Fiji.Pollution is a significant threat to almost half of the threatened species in the region,which is a higher proportion than the global figure of 29%. Disease is also having a majorimpact, and is believed to be affecting 24 threatened species in the region. The chytridfungus has now been identified in wild populations of 48 native Australian frogs, and alsoTable 3. The habitat preferences of amphibiansin the Australasian Realm.Figure 8. The habitat preferences of amphibiansin the Australasian Realm. The plot on theleft-hand side shows the number of species inthe region in each habitat type. On the righthandside, the percentage of these specieswhich are threatened is given.Habitat typeNumber ofspecies in eachhabitat% of allspeciesoccurring inthe habitatThreatenedand Extinctspecies% of speciesoccurringin habitat thatare Threatenedor ExtinctForest 398 73 55 14All tropical forest 372 68 47 13Lowland tropical forest 281 52 44 16Montane tropical forest 177 33 19 11Savannah 41 7 0 0Grassland 106 19 6 6Shrubland 70 13 7 10Secondary terrestrial habitats 136 25 10 7Flowing freshwater 177 32 35 20Marsh/swamp 95 17 14 15Still open freshwater 171 31 15 9Arid and semi-arid habitats 5 1 0 0ForestSavannahGrasslandShrublandSecondary terrestrial habitatsFlowing freshwaterMarsh/swampStill open freshwaterArid and semi-arid habitatsNumber of species% of species in habitat that are threatened0 100 200 300 400 0 5 10 15 20
Chapter 6. <strong>Amphibian</strong>s of the Australasian Realm 69Threat type Threatened species % Threatened speciesHabitat loss 50 76Agriculture – Crops 4 6Agriculture – Tree plantations 5 8Agriculture – Livestock 24 36Timber and other vegetation removal 17 26Urbanization and industrial development 29 44Invasive species 44 67Utilization 1 2Accidental mortality 2 3Pollution 31 47Natural disasters 12 18Disease 24 36Human disturbance 16 24Fire 16 24Table 5. The major threats to globally threatened amphibians in the Australasian Realm.Only present threats to species are tallied.All habitat lossInvasive speciesUtilizationAccidental mortalityPersecutionPollutionNatural disastersDiseaseHuman disturbanceChanges in native sp. dynamicsFireFigure 9. The major threats impacting threatened amphibians in the Australasian Realm.in the introduced cane toad, Bufo marinus (Speare and Berger 2005). Captive populations oftwo additional species have been infected, although there is no evidence of infection withintheir wild populations (Speare and Berger 2005). Not all species infected have declined, andthere are some species, for example Taudactylus eungellensis (CR), which have experienceddeclines in the past that might have been due to chytridiomycosis and are now showing signsof recovery. Why some species appear to be more resilient to the disease than others is stillnot known, although there is evidence that both innate immune defenses and environmentalfactors play a role (Woodhams and Alford 2005; Woodhams et al. 2006).A total of 30 species (three of which are threatened and two considered Extinct) arerecorded as being utilized by humans. The most common reason for harvesting Australasianamphibians is for local human consumption, and this occurs only in the Papuan sub-region.Some amphibians are harvested for the international pet trade; the most common speciesbeing treefrogs of the genus Litoria, which originate from both Australia and the Papuansub-region. Much of the harvesting of amphibians in the region is not considered to constitutea major threat to the species; of the 30 species being harvested, this activity is consideredto be a threat to just six species.POPULATION STATUS AND TRENDSEstimates of Population TrendsA summary of the inferred population trends of Australasian amphibians is presented in Table7. For many species, particularly those in the Papuan sub-region, these trends are inferredfrom broad trends in the state of the habitats on which the species depend. In Australiaand New Zealand, where most of the declining species are found, many of the populationtrends are based on field observations (for example, Campbell (1999) for Australia, andBishop (2006) for New Zealand). Compared with global trends, the population trends in theAustralasian Realm is quite different, with many more species considered to have stable,rather than decreasing, populations. More than half of the amphibians in the region areconsidered to have stable populations, compared with only 27% globally, and only 10% ofspecies in the region are considered to be in decline (vs. 42% globally). This would suggestthat although there have been dramatic declines, and in some cases extinctions, amongstsome populations of species in Australia and New Zealand, amphibian populations overallare relatively stable. In Australia, this stability might be because the major effects of feralintroductions, large-scale habitat clearance and chytridiomycosis have generally now playedout. The main feral predators (cats and foxes) and habitat-changers (rabbits and domesticlivestock) reached all parts of Australia some time ago. The large-scale clearance of importantnatural habitats was generally completed by 1950, and legislation to minimize such habitatclearance is now generally in place. The chytrid fungus had reached much of Australia bythe late 1990s. As a result, there is some relative stability compared with the situation 20,50 and 100 years ago. For a substantial proportion of species (37%), there is still insufficientinformation to determine a trend in population size.“Rapidly Declining” Species0 20 40 60 80 100Percentage of threatened species affectedThere are 35 “rapidly declining” species in the Australasian Realm, which is 7% of the globaltotal of 470 species (a full list of all “rapidly declining” species is provided in Appendix IVand includes their occurrence within each of the realms). Twenty-three of these species areexperiencing, or have experienced, “enigmatic declines”, in which the causal factors arePurpose Subsistence Sub-national/NationalRegional/InternationalNumber ofspeciesFood - human 15 (0) 1 (0) 0 15 (0)Food - animal 1 (0) 0 0 1 (0)Handicrafts, curios, etc. 0 1 (0) 0 1 (0)Pets, display animals 3 (2) 6 (3) 11 (2) 12 (3)Research 0 2 (2*) 0 2 (2*)Population Trend Number of species % of extant speciesDecreasing 53 10Stable 286 53Increasing 2 0.4Unknown 200 37FamilyNumber of Percentagespecies in of species in“rapid decline” family in“rapid decline”Number ofspecies in“enigmaticdecline”Percentageof speciesin family in“enigmaticdecline”Hylidae 13 8 10 6Leiopelmatidae 1 25 1 25Limnodynastidae 7 14 3 6Microhylidae 2 1 0 0Myobatrachidae 9 13 7 10Ranidae 1 2 0 0Rheobatrachidae 2 100 2 100not well understood, while the other 12 have experienced declines due to reduced habitat.Australia has the highest number of “rapidly declining” species in the region, with 31 species,followed by Papua New Guinea with three species, and New Zealand with one species. Allthree species in Papua New Guinea are declining as a result of reduced habitat, and thereason for the decline of the one New Zealand endemic species has been identified as mostlikely a result of chytridiomycosis (Bell et al. 2004). Most of the “enigmatic declines” in theregion are concentrated in eastern Australia, where chytrid is widespread.Of the 544 species occurring in the region, 6% are considered “rapidly declining” whichis slightly less than the global average of 8% of all amphibians. Considering that theregion has a significantly lower percentage of threatened species than the global average(12% compared with 33%), the number of “rapidly declining” species is relatively high.This highlights the severity of the threats impacting certain species in the region, and inparticular how quickly these threats can push species to the brink of extinction. Of the 66species that are currently considered threatened in the region, 29 are also “rapidly declining”.Consequently, although the region does not have a large proportion of threatened species,many species that are threatened, are also in serious decline.The “rapidly declining” species show a distinct taxonomic pattern (Table 8). Among thelarger families, the Limnodynastidae and the Myobatrachidae show the highest percentagesof species in serious decline, and in the Myobatrachidae almost 10% of species arein “enigmatic decline”. The largest number of species in serious decline is found in theHylidae, but percentage wise this family appears to be less seriously affected than the Limnodynastidaeand the Myobatrachidae. Some less speciose families have high percentagesof species in serious decline and “enigmatic decline”, most notably the Rheobatrachidaeand the Leiopelmatidae, the former family now being extinct (according to the traditionalfamily-level amphibian classification).Table 6. The purposes for which amphibiansare used in the Australasian Realm. Thenumbers in brackets are the number of specieswithin the total that are threatened species.The two species listed as being used in “Research”(Rheobatrachus silus and R. vitellinus)are now Extinct.Table 7. The population trends for all extantAustralasian amphibians.Table 8. The number of species in “rapiddecline” and “enigmatic decline” in theAustralasia Realm by Family.The Silver-eyed Barred Frog Mixophyes balbus(Vulnerable) in the Family Limnodynastidaeoccurs mainly in eastern New South Wales,Australia. The species has declined and disappearedfrom a number of locations whereit was once common. It is typically found inassociation with permanent streams in temperateand sub-tropical rainforest and in wetsclerophyll forest. © Frank Lemckert
70Threatened <strong>Amphibian</strong>s of the WorldThe Fiji Treefrog Platymantis vitiensis (NearThreatened) is widespread in Fiji on the islandsof Viti Levu, Vanua Levu, Ovalau and Taveuni. Itis naturally a forest species, living especiallyalong streams in giant bird’s nest ferns, butoccurs at much lower densities in secondaryhabitats. It is in the Family Ranidae and breedsby direct development, the eggs being laid inleaf axils. © Paddy RyanEndnotes1 P
Chapter 6. <strong>Amphibian</strong>s of the Australasian Realm 71ESSAY 6.1. GASTRIC-BROODING FROGSThe discovery in 1973 of a new species of frog, living in rainforest, nearBrisbane in eastern Australia, did not at first attract much attention. Theperson who discovered it, David Liem, erected a new genus, Rheobatrachus,for it and named the species Rheobatrachus silus (Liem 1973). Interest in thespecies initially hinged upon its position in the amphibian tree of life, but inthe following year a female was observed to give birth to baby frogs throughthe mouth (Corben et al. 1974). This remarkable breeding biology led to itbeing anointed the common name of the “Gastric-brooding Frog”.Gastric brooding represents a unique form of parental care amongamphibians (Corben et al. 1974). Following fertilization, the female ingeststhe eggs. The jelly surrounding the eggs contains a compound that switchesoff the cells in the lining of the stomach wall that secrete hydrochloric acidto aid digestion. The compound also paralyses the muscles in the stomachwall and increases the number of small blood vessels. In effect, collectivelythe changes convert the female’s stomach into a womb. The eggs changeinto cream-coloured tadpoles and finally metamorphose into young frogsafter a period of six to seven weeks. The young are believed to live entirelyupon their yolk for this period. Similarly, the mother does not actively feedduring this time, living instead upon her body fat and glycogen from theliver. Young eventually emerge as fully formed froglets, and after fourdays the female’s digestive tract returns to normal and she recommencesfeeding (Tyler and Davies 1983). Since the stomachs of all frog species areextremely similar, much of the initial research focusing on stomach acidsecretion in amphibians was done using an imported pest species, theCane Toad Bufo marinus.In 1979, the Gastric-brooding Frog disappeared and, following numerousfruitless searches, is now regarded as Extinct. Because of the unique natureof its breeding habits, the species had attracted worldwide interest, andso attention was focussed upon the many potential causes for its suddendisappearance. The first was habitat degradation due to timber harvesting,as although much of the habitat was pristine rainforest, other parts weregreatly disturbed. Stream siltation could have played a significant role,because it covered the large stones beneath which the frogs hid during theday. Excessive collecting was also suggested as a reason for the decline ofthe species, but this has since been disproved; a second species (the MountGlorious Day Frog, Taudactylus diurnus) disappeared simultaneously fromthe same site, and is now also considered Extinct.In 1984, a second species of Rheobatrachus was found approximately800km north of the range of Rheobatrachus silus, in vine forest near Mackayon the Queensland coast. It differed from its sibling species in its largersize and brilliant yellow markings on the ventral surfaces. The specieswas named the Northern or Eungella Gastric-brooding Frog R. vitellinus(Mahony et al. 1984) and evidence of gastric brooding and oral birth wasreported later that year (McDonald and Tyler 1984). Compared with Rheobatrachussilus, which gives birth to 18-25 young measuring 13mm, thefemale Northern Gastric-brooding Frog gives birth to 22 young measuringup to 16mm in length. Oddly, upon examination, the stomach of a femalecarrying young did not exhibit any of the physical changes observed in R.silus. Instead, it retained a normal muscular structure and cells secretinghydrochloric acid. It is presumed that the mechanism employed by R.vitellinus to avoid digesting its young was the same as that used by allvertebrate animals to avoid digesting the stomach wall, namely by coatingthe young with mucus.Sadly, some 18 months after its discovery, the Eungella Gastric-broodingFrog disappeared without trace and has not been seen since. It had inhabiteddense vegetation in the remote Eungella National Park and there were nosigns of habitat disturbance or any event linked to the species’ disappearance.The causes for the disappearance of this species, and along with ita unique mode of reproduction among amphibians, is unknown. Flannery(2006) asserts that the demise of the Southern Gastric-brooding Frog isattributable to climate change, but the rate of loss was simply too fast forthis to be the case. In any event, there was no drought and no detectableenvironmental change. However, there is some circumstantial evidence thatan environmental factor must have been involved because a small colonyremained alive in a laboratory in Adelaide for three years following theirdisappearance from the wild.At the Second World Congress of Herpetology held in Australia at the endof 1993, Australian researchers learned that their experience of disappearingfrogs was mirrored by other species on other continents. The search for acommon cause or causes has been ongoing ever since.ReferencesMichael J. TylerFlannery, T. 2006. We are the weather makers. Text Publishing Co., Melbourne,Australia.Corben, C., Ingram, G.J. and Tyler, M.J. 1974. Gastric Brooding: unique form of parentalcare in an Australian frog. Science 186:946-947.Liem, D.S. 1973. A new genus of frog of the family Leptodactylidae from SE Queensland,Australia. Memoirs of the Queensland Museum 16:459-470.Mahony, M., Tyler, M.J. and Davies, M. 1984. A new species of the genus Rheobatrachus(Anura: Leptodactylidae) from Queensland. Transactions of the Royal Society of SouthAustralia 108:155-162.McDonald, K.R. and Tyler, M.J. 1984. Evidence of gastric brooding in the Australianleptodactylid frog Rheobatrachus vitellinus. Transactions of the Royal Society ofSouth Australia 108:226.Tyler, M.J. 1994. Australian Frogs. A natural history. Reed, Chatswood, Australia.Tyler, M.J. and Davies, M. 1983. Larval development. In: M.J. Tyler (ed.), The GastricBrooding Frog, pp. 44-57. Croom Helm, London, UK.Birth of a gastric brooding frog Rheobatrachus silus. © Michael J. TylerPrematurely born tadpole aged approximately two weeks.© Michael J. TylerAn x-ray of a female gastric-brooding frog that has given birth. The dark spacein the abdomen is the stomach which held the young. © Michael J. TylerESSAY 6.2. LEIOPELMATID FROGS: THE WORLD’S MOST ARCHAIC FROGSThe Leiopelmatidae represent a unique evolutionary lineage among amphibians,and are thought to be the most archaic frogs in the world. Thesefrogs are found only in New Zealand, and all members belong to the genusLeiopelma. Three species are now extinct (L. auroraensis, L markhami andL.waitomoensis), and only four species are extant: L. archeyi, L. hamiltoni, L.hochstetetteri and L. pakeka. 1Members of the Leiopelmatidae exhibit a number of primitive traits thatseparate them from most other species, including: vestigial tail-waggingmuscles, cartilaginous inscriptional ribs, the presence of amphicoelousvertebrae, and nine presachral vertebrae (most frogs have eight). Ascaphustruei, the tailed frog of the North-western United States, is the only otherextant frog known to possess these features (Stephenson 1961). In addition,there is some evidence to suggest that Leiopelma evolved from an ancestorwith ‘normal’ tadpole development and the degree of cranial remodelingthat occurs in Leiopelma larvae at metamorphosis is intermediate betweensalamanders and Ascaphus (Bell and Wassersug 2003).In addition to these primitive traits, Leiopelma differ from most other frogsbecause they lack external eardrums and produce only limited vocalizations.There are no mating calls and the only noises that any of the four speciesare known to make are chirps or yelps when harassed. It is currently thoughtthat these frogs communicate more like salamanders than other frogs, usingchemosignals to recoginize size and individuality of conspecifics (Lee andWaldman 2002; Waldman and Bishop 2004).Although members of the genus Leiopelma have many similarities, eachspecies varies in its physical characteristics, habitat preferences, distributionrange, and threats faced. Hochstetter’s Frog Leiopelma hochstetteri (VU) is themore aquatic frog (albeit semi-aquatic) of the four extant species. It is widelydistributed in at least 10 fragmented and isolated populations in the northernhalf of the North Island. They are nocturnal and shelter by day in wet crevicesor under stones or logs close to the water’s edge in shaded streams. Males ofthis species exhibit sexual dimorphism in the form of more muscular, robustforelimbs than females. This is another distinctive trait, as the other threeLeiopelma species are not sexually dimorphic, apart from females reachinggreater body size. One of the main threats to this species is the destructionand modification of its habitat, which is still occurring either directly (e.g.afforestation, gold mining, storm water discharge) or indirectly (e.g. feralgoats and pigs causing erosion leading to stream siltation). The New ZealandDepartment of Conservation has purchased considerable amounts of suitableland to prevent further degradation of some of their habitat, and attemptsare being made to better monitor their populations.Archey’s Frog Leiopelma archeyi (CR) is the smallest of the indigenousspecies (
72Threatened <strong>Amphibian</strong>s of the Worldplace. Initial reports are that this appears to have been a success with frogsremaining in good condition through the first year.Leiopelma pakeka, like L. hamiltoni, was only found naturally on onesmall predator-free island, Maud Island, in the Marlborough Sounds. Thepopulation has been estimated at between 27,500 and 39,500 individualsfound mainly in a 16-ha patch of native bush. One hundred of these frogswere translocated to restored forest habitat on the same island in 1984-1985and, 20 years later, this new population appears to be thriving with newrecruitment and higher adult weights than the source population (Bell et al.2004b). Two inter-island translocations to predator-free islands have occurredsince then in order to increase the distribution of L. pakeka and thereforelower their risk of extinction. The first of these involved moving 300 frogs toMotuara Island in 1997 where the population survival has been high followinga 3-month settling in period and evidence of breeding success has beenrecorded. A second inter-island translocation to Long Island occurred in 2005and appears to be successful as all the recaptured frogs have gained weightand some appear to be gravid.The continued survival of these ancient species in New Zealand will largelydepend upon conservation measures and research carried out by the NativeFrog Recovery <strong>Group</strong> and the Department of Conservation.Population estimate (Nhat)7006005004003002001000Aug-83 Jan-84 Feb-85 Feb-86 Dec-86 Feb-88 Feb-89 Feb-90 Jun-91 Jan-93 Feb-94 Dec-94 Dec-96 Feb-97 Feb-98 Feb-99 Feb-00 Dec-00 Dec-01 Dec-02ReferencesPhil J. Bishop, Jen M. Germano and Ben D. BellFigure 1. Jolly-Seber population estimates of population size of Leiopelma archeyi (Critically Endangered) on the Tapu Ridge study plot, 1983-2002. Errorbars = 1SE. (Source: Bell et al. 2004a).Bell, B.D. and Wassersug, R.J. 2003. Anatomical Features of Leiopelma Embryos andLarvae: Implications for Anuran Evolution. Journal of Morphology 256:160-170.Bell, B.D., Daugherty, C.H. and Hay, J.M. 1998. Leiopelma pakeka, n. sp. (Anura: Leiopelmatidae),a cryptic species of frog from Maud Island, New Zealand, and a reassessmentof the conservation status of L. hamiltoni from Stephens Island. Journal of the RoyalSociety of New Zealand 28:39-54.Bell, B.D., Carver, S., Mitchell, N.J. and Pledger, S. 2004a. The recent decline of a NewZealand endemic: how and why did populations of Archey’s frog Leiopelma archeyicrash over 1996-2001. Biological Conservation 120:189-199.Bell, B.D., Pledger, S. and Dewhurst, P.L. 2004b. The fate of a population of the endemicfrog Leiopelma pakeka (Anura: Leiopelmatidae) translocated to restored habitat onMaud Island, New Zealand. New Zealand Journal of Zoology 31:123-131.Brown, D. 1994. Transfer of Hamilton’s frog, Leiopelma hamiltoni, to a newly createdhabitat on Stephens Island, New Zealand. New Zealand Journal of Zoology21:425-430.Holyoake, A., Waldman, B. and Gemmell, N.J. 2001. Determining the species status of oneof the world’s rarest frogs: a conservation dilemma. Animal Conservation 4:29-35.Lee, J.S.F. and Waldman, B. 2003. Communication by fecal chemosignals in an archaicfrog. Copeia 3:679-686.Stephenson, E.M. 1961. New Zealand native frogs. Tuatara 8:99-106.Tocher, M.D. and Brown, D. 2004. Leiopelma hamiltoni homing. Herpetological Review35:259-261.Waldman, B. and Bishop, P.J. 2004. Chemical communication in an archaic anuran amphibian.Behavioral Ecology 15:88-93.1 As noted in the <strong>Introductory</strong> chapter, Frost et al. (2006) include the Ascaphidae (TailedFrogs) in this family, with the result that this primitive family is expanded to containsix species, and its distribution is in New Zealand and the Pacific Northwest of NorthAmerica, with the New Zealand species breeding by direct development, and theAmerican ones by larval development.ESSAY 6.3. AMPHIBIAN DECLINES IN AUSTRALIAConcern about the status of Australian frogs first arose in the 1980s withthe disappearance of the famous gastric-brooding frogs: Rheobatrachussilus (described in 1973, and last seen in the wild in 1981), and R. vitellinus(described in 1984, and last seen in the wild in 1985) (Ingram and McDonald1993; and see Essay 6.1). Intensive searches for both of these species wereconducted in the late 1980s, with no individuals located then, or since, andthey are both now listed as Extinct on the IUCN Red List. This represents theloss of an entire family, as well as a unique reproductive strategy.Around the same time that the gastric-brooding frogs disappeared, concernwas raised over the status of another iconic myobatrachid – the CorroboreeFrog Pseudophryne corroboree (CR). Declines of the Corroboree Frog werefirst reported in the late 1980s (Osborne 1989). Although these declines anddisappearances raised concerns at the time, they were regarded as isolatedevents. However, increasing awareness that amphibian declines might be aglobal problem, and a review of the status of Australian frogs by Tyler (1991),revealed that the phenomenon of declines was more widespread. Tyleridentified 23 species that were thought to have suffered recent populationdeclines. The critical nature of the phenomenon was reinforced by Richardset al. (1993), whose survey of 47 sites in the Australian Wet Tropics showedthat declines were occurring on a regional scale; six species had disappearedfrom almost all sites above 400m elevation. These species subsequentlydisappeared from the few higher-elevation sites at which they were presentin the initial surveys (McDonald and Alford 1999).Fortunately, Australia has well-defined procedures in place at a nationallevel for dealing with threats to biodiversity, and these procedures were quicklymobilized. In the early 1990s, regional species recovery teams were organized,and regional and national meetings and workshops were held. Each regionalrecovery team was responsible for developing and implementing a recoveryplan for the species under its jurisdiction. These plans went through formalreview processes at the State and Federal levels. Initially, most plans calledprimarily for additional research, since the nature and causes of the declineswere not well understood. At a national level, the federal department of theenvironment sponsored the production of the first version of the Action Planfor Australian Frogs (Tyler 1997). Knowledge of Australian frog populationsand their status increased dramatically during the early to mid-1990s, largelyas a result of the work carried out under the species recovery process. Of the23 species identified as being of concern by Tyler (1991), sufficient data hadbeen collected to show that the apparent decline of 12 species was insteadjust a manifestation of local fluctuations. However, an additional 16 specieswere identified as suffering declines, such that there were now 27 species ofconcern. Observations confirmed that many of them were experiencing seriousdeclines. In late 1997, a meeting was held to review the action plan and discusswhat was known about the status of frogs across the country, and to attempt todevise some standard methods for investigating and mitigating the effects offrog declines. The outcomes of this meeting were published in the book Declinesand Disappearances of Australian Frogs (Campbell 1999).At the time of the 1997 meeting, declines of nine species were linked tospecific causes, including habitat loss and degradation, and the introductionof exotic predators. However, 18 species fell into a category since termed“enigmatic declines” by Stuart et al. (2004). Comparative analyses haveshown that these species share a variety of characteristics; for example,McDonald and Alford (1999) found that species closely associated with streamhabitats have a higher probability of declining, and many authors pointed outthat declines at high elevations had occurred in protected areas.In 1998, the pathogenic chytrid fungus, Batrachochytrium dendrobatidis,was described (Berger et al. 1998). Histological examination of deadand dying individuals collected at the time of some of the declines inQueensland confirmed that the affected frogs had been heavily infectedwith chytrid (Berger et al. 1999). It is now generally accepted thatchytridiomycosis was the proximate cause of mortality in the widespreaddie-offs of frogs in the Australian Wet Tropics in the late 1980s and early1990s, and was probably to blame for the earlier disappearances ofthe gastric-brooding frogs and day frogs (Taudactylus spp.) in southernQueensland. It also appears to be a factor in the decline of CorroboreeFrogs in southern Australia, and may be the cause of local die-offs ofmany other species. Since its discovery, chytrid has been detected in 48native frog species in the wild (Speare and Berger 2005), as well as in theintroduced and now widespread Cane Toad, Bufo marinus. The nomadicbehaviour of this introduced species means that it is one possible vector ofthe disease, at least on a local scale. The wide distribution of this diseaseand the serious threat that it constitutes to Australian amphibians, andindeed globally, was explored in detail at a conference in August 2000,attended by national and international experts (Speare et al. 2001).Nyctimystes dayi (Endangered) and Litoria nannotis (Endangered) arerainforest specialists from Australia’s Wet Tropics; both species vanishedfrom upland sites throughout the region, most likely due to the diseasechytridiomycosis. © Jodi Rowley
Chapter 6. <strong>Amphibian</strong>s of the Australasian Realm 73One of the outcomes of this conference was the formal nomination ofchytridiomycosis, to the Australian federal Department of Environmentand Heritage, as a threatening process. This nomination went throughseveral drafts and commenting stages, and was formally adopted in June2005. Even before its final adoption, the threatening process nominationprompted state and federal governments to increase levels of fundingof research and management aimed at reducing the threat. A threatabatement plan was prepared and accepted in 2006 (AGDEH 2006).Conservation actions targeting threatened amphibians in Australia haveincluded habitat creation and modification, introduced species control, andcaptive breeding. These actions have had some success at individual sites.Several frog species that survived at low elevations in the Wet Tropics, whendramatic population declines associated with chytridiomycosis were taking placeat high elevations, appear to be recolonizing some high-elevation sites withoutany management intervention. However, 47 species (more than 20%) of extantAustralian amphibians are still listed as threatened in the Global <strong>Amphibian</strong>Assessment, and remain susceptible to chytrid (as it spreads to new areas),continued habitat modification and destruction, and introduced species. A greatdeal of work remains before the status of Australian frogs is fully understood andmeasures to preserve their remaining diversity can be implemented.Ross A. Alford and Jodi J.L. RowleyReferencesBerger, L., Speare, R., Daszak, P., Green, D.E., Cunningham, A.A., Goggin, C.L., Slocombe,R., Ragan, M.A., Hyatt, A.D., McDonald, K.R., Hines, H.B., Lips, K.R., Marantelli, G.and Parkes, H. 1998. Chytridiomycosis causes amphibian mortality associated withpopulation declines in the rainforests of Australia and Central America. Proceedingsof the National Academy of Science USA 95:9031-9036.Berger, L., Speare, R. and Hyatt, A. 1999. Chytrid fungi and amphibian declines: Overview,implications and future directions. Declines and disappearances of Australian Frogs. In:A. Campbell (ed.), pp. 23-33. Environment Australia, Canberra, Australia.Campbell, A. 1999 Declines and disappearances of Australian Frogs. EnvironmentAustralia, Canberra, Australia. Avaliable as pdf at http://www.deh.gov.au/biodiversity/threatened/publications/pubs/frogs.pdfAustralian Government Department of the Environment and Heritage. 2006. Threat AbatementPlan: Infection of <strong>Amphibian</strong>s with Chytrid Fungus Resulting in Chytridiomycosis. Departmentof the Environment and Heritage, Commonwealth of Australia, Canberra, Australia.Ingram, G.J. and McDonald, K.R. 1993. An update on the decline of Queensland’s frogs.In Herpetology in Australia: A Diverse Discipline. In: D. Lunney and D. Ayers (eds.),pp.297-303. Surrey Beatty and Sons, Sydney, Australia.McDonald, K. and Alford, R.A. 1999. A review of declining frogs in northern Queensland.In Declines and disappearances of Australian Frogs. In: A. Campbell (ed.), pp. 14-22.Environment Australia, Canberra, Australia.Osborne, W.S. 1989. Distribution, relative abundance and conservation status of CorroboreeFrogs, Pseudophryne corroboree (Anura: Myobatrachidae). Australian WildlifeResearch 16:537-547.Richards, S.J., McDonald, K.R. and Alford, R.A. 1993. Declines in populations of Australia’sendemic tropical rainforest frogs. Pacific Conservation Biology 1:66-77.Speare, R, and Berger, L. 2005. Chytridiomycosis in amphibians in Australia. http://www.jcu.edu.au/school/phtm/PHTM/frogs/chyspec.htmSpeare, R., Alford, R.A., Aplin, K., Berger, L., Bishop, P., Cullen, B., Cunningham, A., Daszak,P., Dovey, L., Halliday, T. Hines, H., Lynch, M., Marantelli, G., McDonald, K., Orchard,S. and Owens, L. 2001. Developing management strategies to control amphibiandiseases: Decreasing risks due to communicable diseases. School of Public Health andTropical Medicine, James Cook University, Townsville, Australia. Available as a pdf athttp://www.jcu.edu.au/school/phtm/PHTM/frogs/adms/AmpDisStrategies.pdfStuart, S.N., Chanson, J.S., Cox, N.A., Young, B.E., Rodrigues, A.S.L., Fischman, D.L.and Waller, R.W. 2004. Status and Trends of <strong>Amphibian</strong> Declines and ExtinctionsWorldwide. Science 306:1783-1786.Tyler, M. 1997. The action plan for Australian Frogs. Wildlife Australia, Canberra,Australia.Tyler, M.J. 1991. Declining amphibian populations – a global phenomenon? An Australianperspective. Alytes 9:43-50.ESSAY 6.4. AMPHIBIANS OF THE PAPUAN REGIONThe Papuan region extends from Indonesia’s Maluku Islands, in the west,to the Solomon Islands and Fiji, in the east. It is dominated by the world’slargest and highest tropical island, New Guinea, and includes thousands ofislands, ranging from tiny coral atolls to forest-covered ranges that rise severalkilometres above the ocean. The amphibian fauna here consists entirely offrogs; salamanders and caecilians do not extend east of Wallace’s Line, whichextends between Bali and Lombok, and Borneo and Sulawesi.The Papuan frog fauna has been poorly documented compared withmost other regions of the globe, despite the fact that many new speciesare being discovered and described each year. More than 320 species areknown from the region, although it has been estimated that the total willexceed 600 given the current rates of discovery (Günther 2006). Threefamilies dominate the frog fauna: Microhylidae, Hylidae, and Ranidae.The Microhylidae is the most species-rich group of frogs on New Guinea.They occupy a diverse range of environments, from sea level to around4,000m asl, and can be found in semi-aquatic, terrestrial, subterranean,and arboreal (canopy) habitats. The New Guinea microhylids include someof the smallest frogs on earth (such as Oreophryne minuta, DD) that is adultat just 9-11.5mm; Richards and Iskandar 2000), but also include a number ofvery large species, including one of the few species (Asterophrys turpicola,LC) known to attack and bite as a means of self-defence (Richards et al.1994). All New Guinean microhylids share the habit of laying their eggsout of water. Embryos develop directly into small froglets, by-passing afree-swimming tadpole stage. It appears that the father is always responsiblefor guarding the embryos and, in the case of the sharp-snouted frogSphenophryne cornuta (LC), for carrying the freshly hatched youngstersaround on their back (Bickford 2004).The Hylidae, or treefrogs, are generally found in bushes or trees. However,in the savannah habitats of southern New Guinea, there are two species(Litoria nasuta, LC, and L. nigrofrenata, LC) that live exclusively on the ground.Their long legs and slender build allow them to jump enormous distances toescape predators. Treefrogs reach their greatest diversity in the mountainsand forests of New Guinea’s interior. Here, one can find bizarre species, suchas Litoria prora (LC), with its elongated nose spike, and its habit of hangingits eggs from leaves over small forest pools. New Guinea is dominated bya mountainous spine running across its centre, including the highest peaksbetween the Himalaya and Andes. These precipitous mountains are drainedby a myriad of torrential streams, providing a challenging environment forfrogs. Many New Guinean treefrogs in the genera Litoria and Nyctimysteshave taken advantage of these extreme habitats, laying large eggs, gluedunder stones, in steep streams. The eggs hatch into tadpoles with enormoussucker-mouths that cling to rocks, in even the fastest of torrents (e.g.,Günther 2006).The Ranidae, or ‘true-frogs’, a family dominating much of the temperatenorthern hemisphere, is poorly represented on New Guinea. However, onegroup of ranid frogs, the platymantines, dominates the smaller archipelagosto the west, north, and north-east of New Guinea. Like the microhylids,these frogs have a ‘direct-development’ reproductive strategy, and it hasbeen suggested that this has assisted their colonization of far-flung islandsin the South Pacific. Frogs of the genus Platymantis occur on nearly all ofthe smaller archipelagos north of New Guinea, and have occupied thewide range of habitats used by microhylids on mainland New Guinea.The platymantine radiation is most evident on the Solomon Islands, withPlatymantis and several endemic genera (Batrachylodes, Ceratobatrachusand Palmatorrapia) dominating the fauna. Many platymantine species areendemic to single islands or small island groups, and so may be susceptibleto the massive habitat destruction occurring on most archipelagos frommajor logging operations.Three other frog families are poorly represented in the Papuan region:Limnodynastidae, Myobatrachidae and Bufonidae. Limnodynastidae andMyobatrachidae dominate the nearby Australian fauna, but only sevenspecies occur here and they all occur on New Guinea. Perhaps the mostinteresting of these are the three species of Lechriodus (Limnodynastidae)– large, broad-headed frogs that construct floating foam ‘nests’ into whichthey place their small eggs during reproduction. Bufonidae, or Toads, do notoccur naturally in New Guinea and are represented by two exotic species,Bufo marinus and Bufo melanostictus. Bufo marinus, from the Neotropics, iswidespread in eastern New Guinea and in many islands of Melanesia (Lever2001). Bufo melanostictus is native to western Indonesia and has recentlybeen introduced to Papua Province (New Guinea) (Iskandar and Colijn 2000;Menzies and Tapilatu 2000). The impacts of these species (if any) on nativePapuan frogs are poorly understood, and require urgent assessment.Male Sphenophryne cornuta (Least Concern) are responsible for carrying thefreshly hatched youngsters around on their back. © Stephen RichardsLitoria prora (Least Concern) hangs its eggs from leaves over small forestpools. © Stephen RichardsAlbericus siegfriedi (Critically Endangered) is known only from high elevationson Mt Elimbari in Papua New Guinea. © Stephen RichardsGlobally, the Papuan region has the highest proportion of Data Deficientfrog species. Many species are known from only one or two localities, andrugged terrain and logistical and bureaucratic hurdles have hindered attemptsto relocate and assess the conservation status of these frogs. Although fewspecies appear to be at immediate risk of extinction, the severely restricteddistributions of some species, coupled with increasing rates of forest destruction,have raised concerns that a number of species may be susceptibleto extinction in the future. One such example is the small, shrub-dwellingmicrohylid Albericus siegfriedi (CR), which is found only at high elevationson Mt Elimbari in Papua New Guinea, where the only known population isisolated in a patch of forest that is being gradually consumed by an expandinglocal human population.Further research is required to better understand the distribution andconservation status of Data Deficient frogs in this poorly documented region.Given a land-tenure system throughout the region that largely precludes thedesignation of protected areas by the central government, conservation ofthe region’s unique frog fauna will depend on developing education programsfor, and conservation initiatives with, local landowners. Fortunately, thePapuan region retains one of the largest blocks of tropical forest on earth,and appropriate action now will help to ensure the long-term survival of itsspectacular frog fauna.ReferencesStephen RichardsBickford, D.P. 2004. Male parenting of New Guinea froglets. Nature 418:601-602.Günther, R. 2006. Derived reproductive modes in New Guinean anuran amphibians anddescription of a new species with paternal care in the genus Callulops (Microhylidae).Journal of Zoology 268:153-170.Iskandar, D.T. and Colijn, E. 2000. Preliminary Checklist of Southeast Asian and NewGuinean Herpetofauna I. <strong>Amphibian</strong>s. Treubia 31(Suppl.):1-134.Lever, C. 2001. The Cane Toad. The history and ecology of a successful colonist. WestburyAcademic and Scientific, Yorkshire, UK.Menzies, J.I. and R.F. Tapilatu. 2000. The introduction of a second species of toad (Amphibia:Bufonidae) into New Guinea. Science in New Guinea 25:70-73.Richards, S.J. and Iskandar, D.T. 2000. A new minute Oreophryne (Anura: Microhylidae) fromthe mountains of Irian Jaya, Indonesia. Raffles Bulletin of Zoology 48:257-262.Richards, S.J., Johnston, G.R. and Burton, T.C. 1994. A remarkable new asterophryinemicrohylid frog from the mountains of New Guinea. Memoirs of the QueenslandMuseum 37:281-286.
CHAPTER 7. AMPHIBIANS OF THE INDOMALAYAN REALMFigure 1. Summary of Red List categoriesfor amphibians in the Indomalayan Realm.The percentage of species in each categoryis also given.Red List Category Number of speciesExtinct (EX) 20Extinct in the Wild (EW) 0Critically Endangered (CR) 32Endangered (EN) 134Vulnerable (VU) 143Near Threatened (NT) 104Least Concern (LC) 311Data Deficient (DD) 255Total Number of Species 99926%31%SpeciesAdenomus kandianusNannophrys guentheriPhilautus adspersusPhilautus dimbullaePhilautus eximiusPhilautus extirpoPhilautus halyiPhilautus hypomelasPhilautus leucorhinusPhilautus malcolmsmithiPhilautus nanusPhilautus nasutusPhilautus oxyrhynchusPhilautus rugatusPhilautus stellatusPhilautus temporalisPhilautus travancoricus 1Philautus variabilisPhilautus zalPhilautus zimmeri2% 3%13%10%Table 1. The Extinct amphibians of the IndomalayanRealm.CountrySri LankaSri LankaSri LankaSri LankaSri LankaSri LankaSri LankaSri LankaSri LankaSri LankaSri LankaSri LankaSri LankaSri LankaSri LankaSri LankaIndiaSri LankaSri LankaSri Lanka14%Raoul Bain, S.D. Biju, Rafe Brown, Indraneil Das, Arvin Diesmos, Sushil Dutta,David Gower, Robert Inger, Djoko Iskandar, Yoshio Kaneko, Michael Wai NengLau, Madhava Meegaskumbura, Annemarie Ohler, Theodore Papenfuss,Rohan Pethiyagoda, Bryan Stuart, Mark Wilkinson and Feng XieTHE GEOGRAPHIC AND HUMAN CONTEXTThe Indomalayan Realm (sometimes termed the Oriental region) encompasses all of Southand Southeast Asia, including the Indonesian and Philippine archipelagos, and incorporatingthe major offshore islands of Sri Lanka, Hainan, and Taiwan, as well as Japan’s Ryukyuarchipelago. The western and northern boundaries follow that of Olson et al. (2001), reachingPakistan, the Himalaya, and southern subtropical China, although the boundary betweenthe Palaearctic and Indomalayan Realm is somewhat unclear in south-east China. However,as here defined, the eastern boundary between Indomalaya and Australasia, which is usuallytaken as Wallace’s line (an imaginary line named for Alfred Russell Wallace runningbetween Borneo and Sulawesi, and between Bali and Lombok in Indonesia), is here takento lie further to the east, such that the region includes all of Nusa Tenggara and a numberof islands in Maluku (but excluding Seram, Amboin, Buru, Obi, Halmahera, Tanimbar and afew other smaller islands) (see Tyler 1999).The geological, evolutionary, and climatic history of this region is complex and is reflectedby the evolutionary history and diversity of its fauna. Peninsular India, which includes SriLanka, consists of a single tectonic plate (the Deccan or Indian Plate) that separated fromGondwanaland about 130 Ma and, after breaking away from Madagascar and the Seychellesaround 90 Ma, rafted across the Tethys Sea eventually colliding with Eurasia at about 65-40 Ma (Beck et al. 2005). This massive collision resulted in the uplift of the Himalaya andthe Tibetan plateau, which caused dramatic climatic changes over vast expanses acrossSouth Asia. Although the climate of almost the whole of Peninsular India is monsoonal,the region is varied both in terms of topography and vegetation, including, for example,rainforests (e.g., in the Western Ghats, south-western Sri Lanka, and Myanmar), arid areas(such as the Thar Desert in north-western India), low-lying swamps and mangroves (in theSundarbans), and island systems (Andamans and Nicobars). Peninsular India is relativelyflat, and is highest in the south-west, with the western flank of the plateau being formedby the Western Ghats.Similarly, the coming together of the Indian plate with the Asian continental landmasshas influenced much of the topography in mainland Southeast Asia, including the generalnorth-south orientation of the mountains and main rivers. Much of this region (often referredto more generally as Indo-Burma) is characterized by distinct seasonal weather patterns (forexample, in northern Vietnam and southern coastal China, the dominant weather pattern isthe north or north-easterly monsoon during the northern winter and east or south-easterlymonsoon in the summer). Originally, most of the region was dominated by broadleaf forests;the most diverse forests are the lowland mixed wet evergreen forests, which occur inclimates with one to four dry months.Another geological highlight of the region is the islands forming part of the Malay Archipelago,comprising the Greater Sundas – including Borneo and Sumatra (the third and sixthlargest islands on earth, respectively), Java, and Sulawesi – the Lesser Sundas, the Philippines,and several islands of the Moluccas). This is one of the most active seismic regionsin the world, and the site of some of the most dramatic seismic events known, includingthe eruption of Krakatau in 1883 and the earthquake that caused a massive tsunami in theIndian Ocean, just off the coast of Aceh, Sumatra, on December 26 th , 2004. The highest pointin the region is Gunung Kinabalu in northern Borneo at 4,101m. The islands of the Sundashelf were connected to mainland Southeast Asia through most, if not all, of the Tertiary,and were also periodically connected during episodes of northern glaciation during theQuaternary, which is why the fauna and flora of these two regions have much in common.At the same time, oscillations in sea levels caused periodic severing of these ephemeralland bridges, isolating nearby continental islands, and presumably allowing for the evolutionand accumulation of endemic species. The climate is tropical, and the vegetation, at leastup until a few decades ago, comprised mainly lowland evergreen rainforest.Theloderma gordoni (Least Concern) is an Asian treefrog in the family Rhacophoridae. This species is known from monsoon forests in Thailandand Vietnam, and is believed to breed in cavities in trees. © Nikolai L. OrlovHuman population density is very high across this region (averaging 124 people persquare kilometre across Southeast Asia), including, as it does, several of the most populouscountries on earth, such as India (with an estimated 1.1 billion people) and Indonesia (220million). Population density ranges from a whopping 336 people per square kilometre inIndia, to 277 per square kilometre in the Philippines, 117 people per square kilometre inIndonesia, to 25 people per square kilometre in Lao P.D.R. The percentage of the populationconcentrated in urban areas also varies, with nearly 20% of people in Cambodia concentratedin urban areas, 30% in India, around 48% in Indonesia, and nearly two-thirds of people inthe Philippines and Malaysia. With the exception of Singapore (gross national income percapita of US$24,000), all countries have a GNI per capita of less than US$5,000.Given the high human population densities in the region, the impact of society on ecosystemshas been severe. Mainland Southeast Asia was probably one of the first regionswhere agriculture developed (Diamond 1997), and there has been a long history of shiftingor permanent small-scale agriculture. More recently, though, the exploitation of SoutheastAsia’s valuable timber for commercial trade, and the demand for land to grow cash-cropsand trees, have led to widespread and rampant forest loss, particularly of lowland evergreenforest, dominated mainly by the giant dipterocarps. Several estimates of forest loss acrossthe region are available; one recent study estimates that Kalimantan’s protected lowlandforests declined by 56% between 1985 and 2001 primarily from logging (Curran et al. 2004),and that less than 33% of lowland forest and peat swamp remains across all of IndonesianBorneo (Whitten et al. 2005). Unfortunately, even where rainforest habitat remains relativelyintact, the unmitigated harvest and trade of some of the larger species of animals has beenso intensive that the term “empty forest syndrome” was coined (Redford 1992); this “emptyforest” phenomenon is particular apparent in China, Vietnam, Laos and Cambodia.GLOBAL CONSERVATION STATUSA total of 329 (33%) of the amphibian species in the Indomalayan Realm are considered tobe globally threatened or Extinct (Figure 1). This is very similar to the global average. TheIndomalayan Realm contains 17% of all globally threatened amphibians. When looking atthe Red List Categories, Indomalaya accounts for only 7% of the world’s CR species, but 17%of the EN species, and 21% of the VU species. Hence, on the basis of current knowledge,threatened Indomalayan amphibians are more likely to be in a lower category of threat,when compared with the global distribution of threatened species amongst categories. Thepercentage of DD species, 26% (255 species), is also similar to, though slightly higher than,the global average of 23%. This high percentage is not surprising, given that much of theregion is still very poorly surveyed for amphibians.Twenty of the world’s 34 known amphibian extinctions (59%) have occurred in this region(Table 1), 19 of these in Sri Lanka and one in southern India. Eighteen of these species arefrogs from the genus Philautus, and most of these probably had tiny ranges and died outas a result of extensive forest loss, perhaps as long ago as the late 1800s or early 1900s(Manamendra-Arachchi and Pethiyagoda 2005). In addition, one Critically Endangeredspecies in the Indomalayan Realm is considered to be possibly extinct, Philautus jacobsonifrom central Java, Indonesia. It is suspected that the apparent concentration of extinctionsin Sri Lanka, as opposed to other parts of the region, is a result of better knowledge of thiscountry due to recent herpetological work (e.g., Manamendra-Arachchi and Pethiyagoda2005; and see Essay 4.1), in which the extant fauna has been extensively surveyed andcompared with the historical baseline provided by museum specimens.SPECIES RICHNESS AND ENDEMISMSpecies Richness and Endemism Across TaxaThe 999 native amphibian species in the Indomalayan Realm represent 17% of the currentlyknown global total of 5,915 species. Of these, 800 (or 80%) are endemic to the region (Table2). All three amphibian orders, are represented in the Indomalayan Realm, but the frogsaccount for 92% of the species. Contrary to the situation in some other regions, endemismis much lower in the salamanders (46%) as compared with the frogs and toads (80%). This isbecause most of the Indomalayan salamanders occur in central China, on the poorly definedboundary (which is in fact a broad overlap zone) with the Palaearctic, thus occurring in bothregions. Caecilian endemism is 100%. Although Indomalaya has the second highest numberof species of any realm (though well behind the Neotropics), it has only 14 families, whichis fewer than any realm except Australasia. Three of these families are endemic. Only 45species (5% of the species in the region) are members of these endemic families, althoughthe treefrog family Rhacophoridae occurs only marginally in the Palaearctic and AfrotropicalRegions and is predominantly Indomalayan.Under current climatic conditions, there is essentially no isolation between the Palaearcticand Indomalayan Realms, especially in China, and the boundary between these two faunas issomewhat arbitrary. The effect of this indistinct boundary is to reduce the level of endemismof both regions. Summaries of the amphibian fauna of the Indomalayan Realm are providedby Bourret (1942), Inger (1999), Iskandar and Colijn (2000), and Zhao (1999).There are 81 genera (18% of the global total) occurring in the region, of which 37 (46%)are also endemic. Endemism at the generic level is much lower among the salamanders (withno endemic genera) than it is among the frogs and toads (46%), contrary to the situation inthe Palaearctic. Generic level endemism is 100% among the caecilians. The most specioseendemic genera in the region are Ichthyophis (34 species), Ansonia (22 species), Kalophrynus(15 species), Nyctibatrachus (12 species) and Micrixalus (11 species). At the opposite endof the spectrum, there are 11 monotypic genera endemic to the Indomalayan Realm, allof which are frogs. The 44 non-endemic genera in Indomalaya include 37 frog genera (13genera from the Ranidae, eight from the Megophryidae, seven from the Rhacophoridae,five from the Microhylidae, two from the Hylidae, and one each from Bombinatoridae andBufonidae) and seven salamander genera (five from the Salamandridae, and one each fromthe Cryptobranchidae and the Hynobiidae). These non-endemics include the widespreadgenera Bufo, Rana and Litoria. It should be noted that future taxonomic changes are likelyto have a major impact on the patterns outlined above, with a tendency for the number ofgenera (including monotypic genera) to increase.
Chapter 7. <strong>Amphibian</strong>s of the Indomalayan Realm 75As noted already, 29% (14/48) of the world’s amphibian families occur in the IndomalayanRealm, and three of these are endemic: Nasikabatrachidae, Ichthyophiidae, andUraeotyphlidae. 2 The characteristics of these families are provided in Chapter 1. Amongthe non-endemic families, the majority of Indomalayan species are in the Bufonidae (truetoads), Megophryidae (Asian spadefoots), Microhylidae (narrow-mouthed toads), Ranidae(true frogs), Rhacophoridae (Asian treefrogs), and Salamandridae (newts and relatives). TheBufonidae occur widely in the Indomalayan Realm as far south and east as Sulawesi andthe southern parts of the Philippines, with 84 species in eight genera. 3 Most species in theregion are endemic, but 12 species are shared with the Palaearctic. All Indomalayan speciesbreed by larval development, and occur in many different habitats.There are 90 species across 10 genera in the Megophryidae in the Indomalayan Realm.This family is predominantly Indomalayan, with over 70% of its species occurring in theregion, and 44% of them globally endemic (all other species occurring in the PalaearcticRegion). Thirty-four species in China cross the Indomalayan-Palaearctic boundary. The familyranges from Nepal, Bangladesh, and north-eastern India, through central and southern China,and Southeast Asia as far as Java, Borneo and the Philippines.The Microhylidae range very widely through the region, with 88 species, 77 of whichare endemic. They occur in a wide variety of habitats, and all Indomalayan species breed bylarval development, except for eight species of the genus Oreophryne in the eastern partsof Indonesia and the Philippines which are direct developers. Most of the non-endemicspecies are shared with the Palaearctic.The Ranidae constitute the largest family in the Indomalayan Realm, accounting forover one-third of the total amphibian fauna of the region. One-third of the ranids are inthe genus Rana 4 . The family is found throughout the region, occurring in most habitats,and all species breed by larval development, except in the genera Ingerana (5 species) andPlatymantis (27 species). 5The Rhacophoridae are a predominantly Indomalayan family, with 263 species (andeight genera) occurring in the region, of which 230 are endemic. The family occurs widelythrough the region, east to the Philippines and Sulawesi. Many of the species are arboreal,and this family includes the flying frogs. The family is split approximately evenly betweendirect developers (many species in the genus Philautus) and larval developers (some ofwhich use foam nests). 6The Salamandridae are predominantly a Palaearctic family, but 21 species occur in theIndomalayan Realm, 10 of which are endemic. Most of the Indomalayan species occur insouthern China. All Indomalayan species breed by larval development.Among the smaller non-endemic families, the Bombinatoridae (fire-bellied toads) havean unusual distribution. This family occurs mainly in the Palaearctic, but two species alsooccur in southern China (one extending into northern Vietnam), and another two (in thegenus Barbourula) are highly isolated from the rest of the family in Kalimantan (southernBorneo) and in the Palawan island group (south-western Philippines). Some of these arehighly aquatic species, with the genus Bombina breeding by larval development (the breedingremaining unknown in Barbourula).The Hylidae are absent from much of the region, but eight species in the genus Hylaoccur in the northern parts of the region (mainly in China) and four species in the genusLitoria occur on islands in the extreme east of the region in Indonesia.The giant salamanders (Cryptobranchidae) are represented in the region by a single nonendemicspecies (the Chinese Giant Salamander Andrias davidianus), which until recentlyoccurred widely in southern China. These animals are aquatic and are associated with clearstreams where they breed by larval development.The Asian salamanders (Hynobiidae) are mainly a Palaearctic family having their distributioncentred on Japan and China, with six species occurring in the Indomalayan Realm. Allspecies have larval development.The caecilian family Caeciliidae occurs predominantly in the Neotropics and Afrotropics,but 10 species occur in India, mainly in the Western Ghats in the south of the country, thoughone species is present in the north-east. All Indomalayan species are assumed to haveterrestrial eggs and breed by direct development, although direct evidence is very scarce(only known for one species, Gegeneophis ramaswamii).There are high percentages of threatened and extinct species in most families in theIndomalayan Realm (Table 3). The three small families Bombinatoridae, Nasikabatrachidae,and Cryptobranchidae are entirely composed of threatened species, and all but one speciesof Hynobiidae is threatened. The threat level among the salamanders is much higherthan that of the frogs, with over half of the species at risk. The salamander faunas of thePalaearctic, Nearctic and Neotropics also face high threat levels. In the Indomalayan Realm,over-harvesting for medicine and food, coupled with habitat loss and/or restricted range,are probably the most significant threats facing these species (see later). Conversely, threatlevels among caecilians appear to be very low, but this is probably an artefact of over 85%of the species in the region being Data Deficient (see Gower and Wilkinson 2005).FamilyNative species(endemics toregion)Percentage of Percentage ofspecies in region species in familythat are endemic that are endemicto regionNative genera(endemics toregion)Percentage ofgenera in regionthat are endemicPercentage ofgenera in familythat are endemicto regionAnuraBombinatoridae 4 (3) 75 30 2 (1) 50 50Bufonidae 84 (72) 86 15 8 (7) 88 21Hylidae 12 (4) 33 0.5 2 (0) 0 0Megophryidae 90 (56) 62 44 10 (2) 20 20Microhylidae 88 (77) 89 18 14 (9) 64 13Nasikabatrachidae 1 (1) 100 100 1 (1) 100 100Ranidae 375 (290) 77 44 24 (11) 46 28Rhacophoridae 263 (230) 87 84 8 (1) 13 11TOTAL ANURA 917 (733) 80 14 69 (32) 46 9CaudataCryptobranchidae 1 (0) 0 0 1 (0) 0 0Hynobiidae 6 (3) 50 7 1 (0) 0 0Salamandridae 21 (10) 48 14 5 (0) 0 0TOTAL CAUDATA 28 (13) 46 2 7 (0) 0 0GymnophionaCaeciliidae 10 (10) 100 9 2 (2) 100 8Ichthyophiidae 39 (39) 100 100 2 (2) 100 100Uraeotyphlidae 5 (5) 100 100 1 (1) 100 100TOTAL GYMNOPHIONA 54 (54) 100 31 5 (5) 100 15TOTAL ALL AMPHIBIANS 999 (800) 80 14 81 (37) 46 8Table 2. The number of Indomalayan amphibiansin each taxonomic Family presentin the region.The Hole-in-the-Head Frog Huia cavitympanum(Least Concern) is in the Family Ranidae andis endemic to central and northern Borneo,where it inhabits rainforests in hilly terrain.The tadpoles cling to rocks in strong rapids inclear streams. © Nikolai L. OrlovThis close-up view of the head of Ichthyophistricolor (Least Concern) shows the tentaclewhich is characteristic of caecilians. Thissubterranean species from the Western Ghatsin India lives in soil in wet semi-evergreentropical forest, but also occurs in farmland andrubber plantations. Like other members of theFamily Ichthyophiidae, it has aquatic larvae instreams. © Photo by John Measey, courtesy ofThe Natural History Museum, LondonTable 3. The number of species within eachIUCN Red List Category in each Family andOrder in the Indomalayan Realm. Introducedspecies are not included.Figure 2. The species richness of amphibians in the Indomalayan Realm, with darker colourscorresponding to regions of higher richness. Colour scale based on 10 quantile classes;maximum richness equals 84 species.Family EX CR EN VU NT LC DD Total numberof speciesNumber threatenedor Extinct% Threatenedor ExtinctAnuraBombinatoridae 0 0 1 3 0 0 0 4 4 100Bufonidae 1 3 17 13 11 27 12 84 34 40Hylidae 0 0 0 0 0 9 3 12 0 0Megophryidae 0 1 6 20 10 34 19 90 27 30Microhylidae 0 1 8 12 11 31 25 88 21 24Nasikabatrachidae 0 0 1 0 0 0 0 1 1 100Ranidae 1 8 43 55 43 141 84 375 107 29Rhacophoridae 18 17 50 33 25 57 63 263 118 45TOTAL ANURA 20 30 126 136 100 298 206 917 312 34CaudataCryptobranchidae 0 1 0 0 0 0 0 1 1 100Hynobiidae 0 0 3 2 0 0 1 6 5 83Salamandridae 0 1 5 3 4 6 2 21 9 43TOTAL CAUDATA 0 2 8 5 4 6 3 28 15 54GymnophionaCaeciliidae 0 0 0 0 0 1 9 10 0 0Ichthyophiidae 0 0 0 2 0 5 32 39 2 5Uraeotyphlidae 0 0 0 0 0 0 5 5 0 0TOTAL GYMNOPHIONA 0 0 0 2 0 6 46 54 2 4TOTAL ALL AMPHIBIANS 20 32 134 143 104 310 255 999 329 33
76Threatened <strong>Amphibian</strong>s of the WorldFigure 3. a) The richness of threatenedamphibians in the Indomalayan Realm, withdarker colours corresponding to regions ofhigher richness. Colour scale based on 10quantile classes; maximum richness equals29 species. b) The richness of CR amphibiansin the Indomalayan Realm, with darker colourscorresponding to regions of higher richness.Colour scale based on four quantile classes;maximum richness equals eight species.a. b.Figure 4. The number of extant amphibianspresent in and endemic to each Indomalayancountry. *denotes countries not entirely withinthe Indomalayan Realm, hence only the specieswhose ranges fall within the region areincluded. Note that 102 described speciesare known from Sri Lanka, but because 19of these are extinct, only 83 are included inthis figure.Figure 5. Percentage of species endemic toeach Indomalayan country. Countries with noendemic species are not included. *denotescountries not entirely within the IndomalayanRealm, hence only the species whose rangesfall within the region are included.Figure 6. The number of threatened amphibianspresent in and endemic to eachIndomalayan country. Countries with nothreatened species are not included in thediagram. *denotes countries not entirelywithin the Indomalayan Realm, hence only thespecies whose ranges fall within the regionare included.Figure 7. Percentage of native species that arethreatened. Countries with no threatened speciesare not included in the diagram. *denotescountries not entirely within the IndomalayanRealm, hence only the species whose rangesfall within the region are included.In general, the largest families in the region house the highest number of threatenedfrog species: Rhacophoridae, Ranidae, Bufonidae, Megophryidae and Microhylidae (Table3). The Rhacophoridae has a particularly high percentage (45%) of threatened species, muchof this reflecting high threat levels (54% of species) in the genus Philautus, in which manyspecies have tiny ranges and can be seriously affected, even by the loss of small patchesof habitat. In the Bufonidae, over 40% of the species are threatened, which is similar toconfamilial levels in the Neotropics and Afrotropics (but not in the Palaearctic). Mostthreatened bufonid species (75%) are dependent on clear mountain streams in forests forbreeding, a very threatened habitat (their larvae can be adversely affected by even modestlevels of silt in the stream, which is a common affect of logging and other forms of forestclearance). The Megophryidae are dependent on the same habitats, are similarly impactedby siltation, and also face a high threat level (30%). The Indomalayan species of the familyRanidae are also facing extensive threats from both over-harvesting for human food andfrom habitat loss. The Microhylidae have the lowest level of threat among the larger frogfamilies, but over 27% of the species are Data Deficient, higher than any other frog family,so this may be an underestimate. There are no threatened Hylidae in the region.The great majority (90%) of the threatened amphibians in the Indomalayan Realm areeither Endangered or Vulnerable. Furthermore, 17 of the 32 Critically Endangered speciesare rhacophorids, and 15 are in the genus Philautus (seven of these in India, seven in SriLanka, and one from Indonesia).Geographic Patterns of Species Richness andEndemismA map of overall species richness of amphibians in the Indomalayan Realm (Figure 2) shows greatvariation across the region. However, more than perhaps any other major biogeographic region,this map is somewhat biased by sampling intensity, and probably represents a misleading pictureof amphibian species richness in this part of the world. Some of the overall patterns are probablyaccurate; for example, the large areas of low species richness in the drier parts of northern,central and eastern India, and in the lower Mekong Delta, and the peaks of highest speciesrichness in the Western Ghats, south-western Sri Lanka, the Malaysian Peninsula, and northernBorneo. The overall patterns of species richness in southern China are also likely to be reasonablyaccurate. Through most of mainland Southeast Asia (excluding Malaysia), north-eastern India,Nepal, Bhutan, Sumatra, Kalimantan (Indonesian Borneo), Sulawesi, the Lesser Sunda Islands,and the Philippines, the patterns on Figure 2 are likely to reflect sampling intensity. Areas thatare particularly poorly surveyed, include Bhutan, Myanmar, Thailand, Laos, Cambodiag, Vietnamand most of Indonesia (the stark contrast in recorded species richness between Malaysian andIndonesian Borneo emphasizes this point) (see Essay 7.1). As the results of future surveys andtaxonomic work are incorporated into the Global <strong>Amphibian</strong> Assessment, our understanding ofthe patterns of Indomalayan amphibian species richness will change considerably.The same caveats apply to the interpretation of the distribution of threatened species(Figure 3a) in the Indomalayan Realm. The concentrations of threatened species in theWestern Ghats, Sri Lanka, southern China, northern Borneo, Java, and the Philippinesprobably reflect reality because these areas have been relatively heavily surveyed. However,there are likely to be important concentrations in places such as Myanmar, Thailand,Laos, Cambodia, Sumatra, Kalimantan, and Sulawesi that remain undetected due to lowersampling effort. Not surprisingly, given the small number of species involved, there are fewnoteworthy concentrations of Critically Endangered species in the region (Figure 3b), themost important being in Sri Lanka and southern India around the Western Ghats (see Essay7.2; Essay 1.2). Much of the apparent concentration in China reflects the originally widedistribution of one species, the Chinese Giant Salamander.Species Richness and Endemism within Countries<strong>Amphibian</strong>s occur naturally in 20 countries in the Indomalayan Realm (all except the Maldives).India has the largest number of species (236 extant) in the region (Figure 4), followedquite closely by China, Indonesia, and Malaysia (all have over 200 extant species). Vietnamand Thailand have over 100 extant species (Sri Lanka has 102 described species, but 19 arenow considered extinct), but many countries have very low totals that almost certainly reflectinadequate survey effort (most notably Myanmar, Laos, Nepal, Cambodia, and Bhutan). Indiahas by far the largest number of endemics (151 species), and China, Philippines, Indonesia,Sri Lanka, and Malaysia each have more than 50 endemics.The amphibian fauna of parts of the Indomalayan Realm has been summarized in numerousnational-level publications, including: India (Tiwari 1992; Dutta 1997; Das 1999, 2002;Daniel 2002; Daniels 2005); Pakistan (Khan 2006); Sri Lanka (Dutta and Manamendra-Arachchi1996); Nepal (Schleich and Kästle 2002); China (Ye et al. 1993; Zhao and Adler 1993; Fei etal. 1999, 2005; Zhao et al. 2000); Japan (Maeda and Matsui 1999; Uchiyama et al. 2002;Goris and Maeda 2004); Peninsular Malaysia (Berry 1975); Thailand (Nabhitabhata 1989;Chan-ard 2003); Vietnam (Bain and Nguyen 2004; Bourret 1942; Inger et al. 1999; Ohleret al. 2000; Orlov et al. 2001, 2002; Ziegler 2002); Laos (Bourret 1942; Stuart 1999, 2005;Teynie et al. 2004); Cambodia (Ohler et al. 2002; Stuart et al. 2006; Stuart and Emmett inpress); Thailand and Peninsular Malaysia (Chan-ard et al. 1999); Singapore (Lim and Lim2002); Borneo (Inger 1966; Inger and Stuebing 1997; Malkmus et al. 2002); Java and Bali(Iskandar 1998; McKay 2006); and Philippines (Alcala and Brown 1998).Although India has many more endemics than any other country in the region, Japanh, SriLanka and the Philippines (see Essay 7.3) have higher percentages of endemic species (allabove or around 80%; Figure 5). Endemism is over 60% in India, over 50% in China, over 40%in Taiwan, and over 30% in Indonesia. The percentage endemism in a number of countries,such as Indonesia, can be expected to rise as the fauna becomes better known.India has more threatened species (63) than any other country in the Indomalayan Realm(Figure 6). Countries with over 40 threatened species are Sri Lanka, Philippines, Malaysiaand China. Indonesia has 29 threatened species; this surprisingly small number is probablya reflection of how poorly the amphibian fauna is known in this country (Essay 7.1). Vietnamhas 15 threatened species, also probably a significant under-estimate (30% of the speciesin this country are Data Deficient). In much of mainland Southeast Asia, the numbers ofthreatened species are likely to be seriously under-estimated (partly because much of theamphibian fauna remains to be discovered, for example in Cambodia, Laos, Myanmar andThailand; and see Essay 7.4).The percentage of threatened amphibian species is highest in island nations (Figure 7),notably Sri Lanka (63%), the Philippines (49%), and Japan (46%). All other IndomalayanIndia*China*Indonesia*MalaysiaViet NamThailandPhilippinesSri LankaMyanmarLao P.D.R.Brunei DarussalamNepalCambodiaTaiwan, Provinceof ChinaBangladeshSingaporeJapan*Pakistan*BhutanTimor-LesteJapan*Sri LankaPhilippinesIndia*China*Taiwan, Provinceof ChinaIndonesia*MalaysiaViet NamNepalMyanmarBhutanLao P.D.R.ThailandCambodiaPakistan*SingaporeBangladeshIndia*Sri LankaPhilippinesMalaysiaChina*Indonesia*Viet NamJapan*Taiwan, Provinceof ChinaLao P.D.R.CambodiaNepalBrunei DarussalamThailandBhutanBangladeshSri LankaPhilippinesJapan*Taiwan, Provinceof ChinaIndia*MalaysiaChina*BhutanIndonesia*Viet NamCambodiaNepalBrunei DarussalamLao P.D.R.BangladeshThailand0 50 100 150 200 250 3000 20 40 60 80 1000 20 40 60 80Number of speciesPercentage of endemic speciesNumber of threatened speciesFigure 4Endemics Non-endemicsFigure 5 Figure 6Endemics Non-endemicsFigure 70 20 40 60 80Percentage of species threatened
Chapter 7. <strong>Amphibian</strong>s of the Indomalayan Realm 77countries have levels of threat that are much lower than global average of 33%, though asmentioned above, this is likely to be under-estimated in several countries.Assessments of the conservation status of Indomalayan amphibians have been carried outin only a few countries, for example: India (Molur and Walker 1998); Japan (Japan Agencyof Environment 2000; Ota 2000); China (Zhao 1998; Xie and Wang 2004); and Philippines(Wildlife Conservation Society of the Philippines 1997). A regional overview of the threatenedstatus of amphibians and reptiles in South Asia was published by Bamabaradeniya andSamarasekara (2001), and Pawar et al. (2007) carried out an assessment and prioritizationof areas for amphibian conservation in north-eastern India.There are only 32 Critically Endangered Indomalayan species, but 13 of these occur inIndia and 11 in Sri Lanka. Outside these two countries, there are three Critically Endangeredspecies each in China and Indonesia, and one each in Malaysia and the Philippines.HABITAT AND ECOLOGYHabitat PreferencesMost Indomalayan amphibians (82%) occur in forests, including 66% in lowland tropicalforest, and 47% in montane tropical forest (Table 4). As in other regions, forest species aremore threatened than those occurring in other terrestrial habitats, and montane forest speciesare more threatened than those in lowland forest. However, the level of threat to lowlandtropical forest species in the Indomalayan Realm (33%) is higher than that in the AfrotropicalRegion (23%), though very similar to that in the Neotropical Region (30%). Among theaquatic habitats, the level of threat is highest in flowing freshwater. So, as in other regions,forest-dwelling and stream-associated amphibians are more likely to be threatened thanthose occurring in any other habitats. This is the combination of habitat preferences that hasbeen associated with rapid declines in amphibian populations worldwide (Stuart et al. 2004).Almost one-quarter of the fauna (23%) can survive in secondary terrestrial habitats (Table 4;Figure 8). This latter figure is higher than in either the Afrotropics or the Neotropics. Table 4and Figure 8 show that amphibians occurring in savannahs, shrubland, and arid and semi-aridhabitats are less likely to be threatened than those occurring in other habitats.Reproductive modesLarval development is by far the most common reproductive mode in the Indomalayan Realm(81% of species), compared with 18% for direct development (Table 5). There are no livebearingspecies in the region. These figures compare with the global picture of 68% larvaldevelopment, 30% direct development, and 1% live-bearing. The presumed direct-developingIndomalayan amphibians are dominated by rhacophorid treefrogs in the genus Philautus,and also include the ranid frog genera Platymantis and Ingerana, and the microhylid genusOreophryne, as well as perhaps the caecilian genera Gegeneophis and Indotyphlus.In the Indomalayan Realm, the percentage of globally threatened or Extinct direct-developingspecies is much higher than in the larval-developing species (Table 5), a patternrepeated in several other regions.MAJOR THREATSAs is the case in all other regions, habitat loss is overwhelmingly the major threat to amphibiansin the Indomalayan Realm (Table 6; Figure 9), affecting nearly 90% of the threatenedspecies. Pollution is the next most serious threat, impacting nearly one-third of threatenedspecies. All other threats have much lower impacts, although utilization is implicated inthe rapid decline of over 20 species (see below). Many of those species being utilized arelisted as Near Threatened, so they do not show in this analysis. Chytridiomycosis has notbeen recorded in the region.The impacts of vegetation removal (mainly via logging) (affecting 64% of the threatenedspecies) and expanding croplands (61%) are the most severe types of habitat loss impactingamphibians, followed by urbanization and industrial development (46%) and tree plantations(18%). Livestock constitutes a less important threat in most cases.Habitat typeNumber ofspecies ineach habitat% of allspeciesoccurring inthe habitatThreatenedor ExtinctspeciesTable 4. The habitat preferences of amphibians in the Indomalayan Realm.Reproductive mode All Species Threatened orExtinct speciesTable 5. Indomalayan amphibians categorized by reproductive mode.% of speciesoccurringin habitat thatare Threatenedor ExtinctForest 823 82 298 36All tropical forest 800 80 291 36Lowland tropical forest 655 66 218 33Montane tropical forest 474 47 195 41Savannah 17 2 0 0Grassland 95 10 21 22Shrubland 116 12 14 12Secondary terrestrial habitats 229 23 50 22Flowing freshwater 505 51 155 31Marsh/swamp 113 11 19 17Still open freshwater 300 30 55 18Arid and semi-arid habitats 3 0.4 0 0% Threatenedor ExtinctDirect development 181 121 67Larval development 807 204 25Live-bearing 0 0 -Not known 11 4 36A total of 143 species (26 of which are threatened) are recorded as being harvested bypeople in the region. The most common reasons for harvesting are for human consumption(112 species, mostly at local and national levels), pet trade (31 species, mostly at internationaland national levels), and medicine (27 species, mostly at local and national levels) (Table 7).Not all of the amphibian harvesting in the region is considered to constitute a major threatto these species. Of the 143 species being harvested, utilization is considered to be a threatfor 87 (of which 26 are threatened species for which harvesting is believed to be contributingto a deterioration in their status). Twenty of these 26 species seriously threatened by overharvestingoccur in China, where many species of amphibians are extensively harvested forhuman food and medicines. Examples include 16 species of ranid frog (eight in the genusPaa), and six species of salamander (including the Chinese Giant Salamander). Threatenedspecies outside China that are heavily harvested include three species of ranid frog in thePhilippines and two in Indonesia.POPULATION STATUS AND TRENDSEstimates of Population TrendsA summary of the inferred population trends of Indomalayan amphibians is presented inTable 8, inferred from trends in the state of the habitats on which the species depend (thoughin some cases, population declines have been noted, especially for species that are beingover-harvested). The overall population trends of Indomalayan amphibians are worse thanthe global trends (where 42% are decreasing and only 27% are stable). In both cases, thepercentage of increasing species is very small.“Rapidly Declining” SpeciesOf the 470 globally “rapidly declining” species, 58 (12%) occur within the IndomalayanRealm. Twenty of these 58 species are in decline due to over-exploitation, 37 due to reducedhabitat, and one due to so-called “enigmatic declines”. Not surprisingly for this region, moredeclines are attributed to reduced habitat and over-exploitation than to enigmatic declines.The Indomalayan Realm accounts for 53% of the world’s rapid declines due to over-exploitation,but only 18% of the reduced habitat declines, and 0.4% of the enigmatic declines.Although one species in the region, Leptophryne cruentata (CR) from Java, has been recordedas undergoing an enigmatic decline, the causes of this decline are not known, and have notso far been linked to either chytridiomycosis or climate change (although these two threatshave now been associated with many such declines that have taken place elsewhere in theForestSavannahGrasslandShrublandSecondary terrestrial habitatsFlowing freshwaterMarsh/swampStill open freshwaterArid and semi-arid habitatsNumber of species% of species in habitat that are threatened0 200 400 600 800 0 10 20 30This unidentified, and possibly undescribed,species of Leptobrachium from the AnnamiteMountains in Cambodia is from the Asianspadefoot Family Megophryidae. Like mostother members of the Family, it is associatedwith streams in hilly forested areas. ©David EmmettFigure 8. The habitat preferences of Indomalayanamphibians. The plot on the left-handside shows the number of species in the regionin each habitat type. On the right-hand side,the percentage of these species which arethreatened is given.
78Threatened <strong>Amphibian</strong>s of the WorldTable 6. The major threats to globally threatenedamphibians in the Indomalayan Realm.Only present threats to species are tallied.Threat type Threatened species % Threatened SpeciesHabitat loss 272 88Agriculture – Crops 188 61Agriculture – Tree plantations 57 18Agriculture – Livestock 15 5Timber and other vegetation removal 198 64Urbanization and industrial development 142 46Invasive species 10 3Utilization 26 8Accidental mortality 10 3Pollution 100 32Natural disasters 25 8Disease 1 0.3Human disturbance 18 6Fire 17 6Figure 9. The major threats impacting threatenedamphibians in the Indomalayan Realm.Table 7. The purposes for which amphibiansare used in the Indomalayan Realm. Thenumbers in brackets are the number of specieswithin the total that are threatened species.Table 8. The population trends for all extantIndomalayan amphibians.Table 9. The number of species in “rapiddecline” and “over exploited decline” in theIndomalayan Realm by Family.Breeding and larval development in themicrohylid frog Metaphrynella sundana(Least Concern) takes place in water-filledtree holes from where the males call. It livesin lowland primary rainforest, and is widelydistributed in Borneo, with a single specimenhaving been collected from northern Sumatra.© Björn LardnerPurposeSubsistence Sub-national/NationalRegional/InternationalNumberof speciesFood – human 109 (22) 32 (8) 8 (1) 112 (22)Food – animal 1 (0) 0 0 1 (0)Medicine – human and veterinary 27 (2) 13 (2) 3 (0) 27 (2)Pets, display animals 5 (2) 21 (6) 30 (6) 31 (7)Research 1 (1) 6 (1) 1 (0) 7 (1)Specimen collecting 1 (1) 0 0 1 (1)Population Trend Number of species % of extant speciesDecreasing 509 52Stable 161 16Increasing 2 0.2Unknown 307 31FamilyAll habitat lossInvasive speciesUtilizationAccidental mortalityPersecutionPollutionNatural disastersDiseaseHuman disturbanceChanges in native sp. dynamicsFire0 20 40 60 80 100Percentage of threatened species affectedNumber of Percentagespecies in of species“rapid decline” in family in“rapid decline”Number ofspecies in“over-exploiteddecline”Percentageof speciesin family in“over-exploiteddecline”Bufonidae 8 10 0 0Megophryidae 2 2 0 0Microhylidae 6 7 2 2Ranidae 30 8 15 4Rhacophoridae 9 3 0 0Cryptobranchidae 1 100 1 100Salamandridae 2 10 2 10The Shanjing Emperor Newt Tylototriton shanjing (Near Threatened) from the Family Salamandridaeis known only from Yunnan in southern China where it inhabits hill forests andsecondary forest. It is subject to over-collection for traditional Chinese medicine, and smallnumbers are also exported for the international pet trade. © Henk Wallaysworld (Lips et al. 2006; Pounds et al. 2006). A full list of all “rapidly declining” species isprovided in Appendix IV and includes their occurrence within each of the realms.The “rapidly declining” species in the Indomalayan Realm show a distinct taxonomicpattern (Table 9), as over half of them, and 75% of “over-exploited” species are ranids.Among the larger families, the Bufonidae, Salamandridae, Ranidae and Microhylidae show ahigher tendency to serious decline than the Megophryidae and Rhacophoridae. There are noIndomalayan species in serious decline in the Bombinatoridae, Hylidae, Nasikabatrachidae,Hynobiidae, Caeciliidae, Ichthyophiidae and Uraeotyphlidae (though these last three are verypoorly known caecilian families in which most species are Data Deficient). In one small family,Cryptobranchidae, the only species in the region is in “rapid decline” and “over-exploiteddecline”. Among the larger families, “over-exploited declines” are concentrated in theRanidae and the Salamandridae.Species in “rapid decline” in the Indomalayan Realm show a clear geographic patternas well, since the major concentration of declines is in Malaysia (32 species) and Indonesia(31 species), followed by China (15), Vietnam (seven), and Thailand and the Philippines (bothwith five). For Malaysia and Indonesia, most of the declining species are on Borneo, wherethere has been very severe loss of lowland rainforest (see Essay 7.5). Of the “over-exploiteddeclines”, 14 are in China, and seven in Vietnam.KEY FINDINGS• A total of 999 species are recorded from the Indomalayan Realm, of which 329 (33%)are considered threatened or Extinct.• At the species level, 800 amphibians (80%) are endemic to the Indomalayan Realm;of the 14 families found in the region, three are endemic, and of 81 amphibian generaoccurring, 37 are endemic. Endemism would be higher, were it not for the unclear andsomewhat arbitrary boundary with the Palaearctic Region, especially in China.• The percentage of threatened and/or extinct species is higher than in many other parts ofthe world, and highest in the families Bombinatoridae (100%), Nasikabatrachidae (100%),Cryptobranchidae (100%), Hynobiidae (83%), Rhacophoridae (45%), Salamandridae(43%), and Bufonidae (40%).• Overall, the threat levels are much higher among salamander species (54%) than frogs(34%). Caecilians are very poorly known in the region, with over 85% of the speciesbeing Data Deficient.• Geographic concentrations of threatened species in the Indomalayan Realm occur in theWestern Ghats (southern India), Sri Lanka, southern China, northern Borneo, Java and thePhilippines; there are likely to be important concentrations in places such as Myanmar,Thailand, Laos, Cambodia, Sumatra, Kalimantan, and Sulawesi that remain undetected.• India has the largest number of species (236) in the region, followed quite closely byChina, Indonesia and Malaysia (all have over 200 species). Many countries have verylow totals that almost certainly reflect inadequate survey efforts.• India has by far the largest number of endemics (151 species) within the region,and China, Philippines, Indonesia, Sri Lanka, and Malaysia each have more than 50endemics.• India has more threatened species (63) than any other country in the Indomalayan Realm.Countries with over 40 threatened species are Sri Lanka, Philippines, China, and Malaysia.• The percentage of threatened amphibian species is highest in island nations, notablySri Lanka (63%), the Philippines (49%), and Japan (46%).• Threatened species tend to show distinct habitat preferences, with forest-dwelling andstream-associated species being the most threatened (36% and 31%, respectively). Thismirrors patterns seen elsewhere in the world.• Habitat loss, primarily due to the impacts of vegetation removal (mainly logging),expanding croplands, and urbanization and industrial development is affecting nearly90% of the threatened species in the region. Pollution impacts nearly one-third of thethreatened species. Chytridiomycosis, the emerging amphibian fungal disease, has notbeen recorded as a significant threat in the region so far.• Of the 470 globally “rapidly declining” species, 12% occur within the region. Most ofthese rapid declines (69%) are caused by severe habitat loss, and 34% are due to overexploitation.Over-exploitation is a more serious threat in the Indomalayan Realm thanin any other part of the world, except the Palaearctic.• Twenty amphibian extinctions have been recorded from the Indomalayan Realm, 19 inSri Lanka and one in India. One species (from Indonesia) is possibly extinct.REFERENCESAlcala, A.C. and Brown, W.C. 1998. Philippine <strong>Amphibian</strong>s: An Illustrated Field Guide. Bookmark Press,Makati City, Philippines.Bain, R.H. and Nguyen, Q.T. 2004. Herpetofaunal diversity of Ha Giang Province in northeastern Vietnam,with descriptions of two new species. American Museum Novitates 3453:1-42.
Chapter 7. <strong>Amphibian</strong>s of the Indomalayan Realm 79Bamabaradeniya, C.N.B. and Samarasekara, V.N. (eds.) 2001. An Overview of the Threatened Herpetofaunaof South Asia. IUCN, Colombo, Sri Lanka.Beck, R.A., Burbank, D.W., Sercombe, W.J., Riley, G.W., Barndt, J.K. Berry, J.R., Afzal, J., Khan, A.M.,Jurgen, H., Metje, J., Cheema, A., Shafique, N.A., Lawrence, R.D., and Khan, M.A. 1995. Stratigraphicevidence for an early collision between northwest India and Asia. Nature 373:55-58.Berry, P.Y. (1975) The <strong>Amphibian</strong> Fauna of Peninsula Malaysia. Tropical Press, Kuala Lumpur, Malaysia.Biju, S.D. and Bossuyt, F. 2003. New frog family from India reveals an ancient biogeographical link withthe Seychelles. Nature 425:711-714.Bourret, R. 1942. Les Batraciens de l’Indochine. Institut Océanographique de l’Indochine 6:1-547Cha-nard, T. 2003. A Photographic Guide of <strong>Amphibian</strong>s in Thailand. Darnsutha Press Co. Ltd, Bangkok,Thailand.Chan-ard, T., Grossmann, W., Gumprecht, A. and Schulz, K.-D. 1999. <strong>Amphibian</strong>s and Reptiles of PeninsularMalaysia and Thailand - An Illustrated Checklist. Bushmaster Publications, Wuerselen, Germany.Curran, L.M., Trigg, S.N., McDonald, A.K, Astiani, D., Hardiono, Y.M., Siregar, P., Caniago, I. and Kasischke,E. 2004. Lowland forest loss in protected areas of Indonesian Borneo. Science 303:1000-1003.Daniel, J.C. 2002. The Book of Indian Reptiles and <strong>Amphibian</strong>s. Bombay Natural History Society and OxfordUniversity Press, Mumbai, India.Daniels, R.J.R. 2005. <strong>Amphibian</strong>s of Peninsular India. Universities Press, Hyderabad, India.Das, I. 1999. Biogeography of the amphibians and reptiles of the Andaman and Nicobar Islands. In: H.Ota (ed.), Tropical Island Herpetofauna. Origin, Current Diversity and Conservation, pp. 43-77. ElsevierScience B.V., Amsterdam, The Netherlands.Das, I. 2002. An Introduction to the <strong>Amphibian</strong>s and Reptiles of Tropical Asia. Natural History Publications(Borneo), Sabah, Malaysia.Diamond, J. 1997. Guns, Germs and Steel – a Short History of Everybody for the Last 13,000 Years. Chatto& Windus, UK.Dutta, S.K. 1997. <strong>Amphibian</strong>s of India and Sri Lanka. Odyssey Publishing House, Bhubaneswar, India.Dutta, S.K. and Manamendra-Arachchi, K. 1996. The <strong>Amphibian</strong> Fauna of Sri Lanka. Wildlife Heritage Trustof Sri Lanka, Colombo, Sri Lanka.Fei, L., Ye, C.-Y., Huang, Y.-A. and Liu, M.-Y. 1999. Atlas of <strong>Amphibian</strong>s of China. Henan Science andTechnical Press, Zhengzhou, ChinaFei, L., Ye, C.-Y., Jiang, J.-P., Xie, F. and Huang, Y. 2005. An Illustrated Key to Chinese <strong>Amphibian</strong>s. SichuanPublishing House of Science and Technology, Chengdu, China.Frost, D.R., Grant, T., Faivovich, J.N., Bain, R.H., Haas, A., Haddad, C.F.B., de Sá, R.O., Channing, A.,Wilkinson, M., Donnellan, S.C., Raxworthy, C.J., Campbell, J.A., Blotto, B.L., Moler, P., Drewes, R.C.,Nussbaum, R.A., Lynch, J.D., Green, D.M. and Wheeler, W.C. 2006. The amphibian tree of life. Bulletinof the American Museum of Natural History 297:1-370.Goris, R.C. and Maeda, N. 2004. Guide to the <strong>Amphibian</strong>s and Reptiles of Japan. Krieger, Malabar,Florida, USA.Gower, D.J. and Wilkinson, M. 2005. Conservation biology of caecilian amphibians. Conservation Biology19:45-55.Inger, R.F. 1966. The systematics and zoogeography of the Amphibia of Borneo. Fieldiana: Zoology52:1-402.Inger, R.F. 1999. Distribution of amphibians in southern Asia and adjacent islands.. In: W.E. Duellman (ed.),Patterns of Distribution of <strong>Amphibian</strong>s: A Global Perspective, pp. 445-482. Johns Hopkins UniversityPress, Baltimore, Maryland, USA.Inger, R.F. and Stuebing, R.B. 1997 (and 2005 update). A Field Guide to the Frogs of Borneo. Borneo NaturalHistory Publishers, Kota Kinabalu, Malaysia.Inger, R.F., Orlov, N. and Darevsky, I.S. 1999. Frogs of Vietnam: A report on new collections. Fieldiana:Zoology 92:1-46.Iskandar, D.T. 1998. The <strong>Amphibian</strong>s of Java and Bali. LIPI Field Guide Series, Yayasan Hayati, Bogor,Indonesia.Iskandar, D.T. and Colijn, E. 2000. Preliminary Checklist of Southeast Asian and New Guinean HerpetofaunaI. <strong>Amphibian</strong>s. Treubia 31(3) supplement: 1-134. Research and Development Centre for Biology, LIPI,Bogor, Indonesia.Japan Agency of Environment 2000. Threatened Wildlife of Japan - Red Data Book. 2nd ed. Reptilia/Amphibia(in Japanese with English summary). Japan Wildlife Research Center, Tokyo, Japan.Khan, M.S. 2006. <strong>Amphibian</strong>s and Reptiles of Pakistan. Krieger Publishing Company, Malabar, Florida, USA.Lim, K.P. and Lim, F.L.K. 1992. A Guide to the <strong>Amphibian</strong>s and Reptiles of Singapore. Singapore ScienceCentre, Singapore.Lips, K.R., Brem, F., Brenes, R., Reeve, J.D., Alford, R.A., Voyles, J., Carey, C., Livo, L., Pessier, A.P. andCollins, J.P. 2006. Emerging infectious disease and the loss of biodiversity in a Neotropical amphibiancommunity. Proceedings of the National Academy of Sciences 103:3165-3170.Maeda, N. and Matsui, M. 1999. Frogs and Toads of Japan. Bun-ichi Sogo, Shuppan, Japan.Malkmus, R., Manthey, U., Vogel, G., Hoffmann, P. and Kosuch, J. 2002. <strong>Amphibian</strong>s and Reptiles of MountKinabalu (North Borneo). A.R.G. Gantner Verlag Kommanditgesellschaft, Ruggell (Liechtenstein).Manamendra-Arachchi, K. and Pethiyagoda, R. 2005. The Sri Lankan shrub-frogs of the genus PhilautusLaurent, 1943 (Ranidae, Rhacophorinae), with description of 27 new species. Raffles Bulletin of ZoologySupplement 12:163-303.McKay, J.L. 2006. A Field Guide to the <strong>Amphibian</strong>s and Reptiles of Bali. Krieger Publishing Company,Malabar, Florida, USA.Molur, S. and Walker, S. 1998. Conservation assessment of the herpetofauna of India – an overview.Hamadryad 23:169-178.Morrison, J.C., Olson, D.M., Loucks, C.J., Dinerstein, E., Allnutt, T.F., Wikramanayake, E.D., Ricketts,T.H., Burgess, N.D., Kura, Y., Powell, G.V.N., Lamoreux, J.F., Underwood, E.C., Wettengel,W.W., D’Amico, J.A., Hedao, P., Itoua, I., Kassem, K.R. and Strand, H.E. 2001. Terrestrial ecoregionsof the world: a new map of life on earth. BioScience 51:933-938Nabhitabhata, J. 1989. Species diversity of Thai herpetofauna. In: S. Wongsiri and S. Laolohakarn (eds.),Biodiversity in Thailand, pp. 169-204, The Science Society of Thailand, Bangkok, Thailand.Ohler, A., Marquis, O., Swan, S. and Grosjean, S. 2000. <strong>Amphibian</strong> biodiversity of Hoang Lien Nature Reserve(Lao Cai Province, northern Vietnam) with description of two new species. Herpetozoa 13:71-87.Ohler, A., Swan, S.R. and Daltry, J.C. 2002. A recent survey of the amphibian fauna of the CardamomMountains, southwest Cambodia with descriptions of three new species. Raffles Bulletin of Zoology50:465-481.Orlov, N.L., Ananjeva, N.B. and Ho, T.C. 2006. A new cascade frog (Amphibia: Ranidae) from Central Vietnam.Russian Journal of Herpetology 13:155-163.Orlov, N.L., Murphy, R.W., Ananjeva, N.B., Ryabov, S.A. and Ho, C.T., 2002. Herpetofauna of Vietnam, achecklist. Part I. Amphibia. Russian Journal of Herpetology 9:81-104.Ota, H. 2000. Current status of the threatened amphibians and reptiles of Japan. Population Ecology42:5-9.Pawar, S., Koo, M.S, Kelley, C., M. Ahmed, M.F., Chaudhuri, S., Sarkar, S. 2007. Conservation assessmentand prioritization of areas in Northeast India: priorities for amphibians and reptiles. BiologicalConservation 136:346-361.Pounds, J.A., Bustamante, M.R., Coloma, L.A., Consuegra, J.A., Fogden, M.P.L., Foster, P.N., La Marca,E., Masters, K.L., Merino-Viteri, A., Puschendorf, R., Ron, S.R., Sánchez-Azofeifa, G.A., Still, C.J. andYoung, B.E. 2006. Widespread amphibian extinctions from epidemic disease driven by global warming.Nature 439:161-167.Redford, K.H. 1992. The empty forest. BioScience 42:412-422.Schleich, H.H. and Kästle, W. (eds.). 2002. <strong>Amphibian</strong>s and Reptiles of Nepal. A.R.G. Gantner VerlagK.G., Ruggell.Stuart, B.L. 1999. <strong>Amphibian</strong>s and reptiles. In: W. Duckworth, R. Salter and Khounboline (eds.), Wildlife inLao PDR: 1999 Status Report, pp. 43-67. IUCN/WCS/CPAWM, Vientiane.Stuart, B.L. 2005. New frog records from Laos. Herpetological Review 36:473-479.Stuart, B.L. and Emmett, D.A. in press. A collection of amphibians and reptiles from the Cardamom Mountains,southwestern Cambodia. Fieldiana: Zoology.Stuart, B.L., Sok, K. and Neang, T. 2006. A collection of amphibians and reptiles from hilly Eastern Cambodia.Raffles Bulletin of Zoology 54:129-155.Stuart, S.N., Chanson, J.S., Cox, N.A., Young, B.E., Rodrigues, A.S.L., Fischman, D.L. and Waller, R.W. 2004.Status and trends of amphibian declines and extinctions worldwide. Science 306:1783-1786.Teynie, A., David, P., Ohler, A. and Luanglath, K. 2004. Notes on a collection of amphibians and reptiles fromsouthern Laos, with a discussion of the occurrence of Indo-Malayan species. Hamadryad 29:33-62.Tiwari, S.K. 1991. Zoogeography of Indian <strong>Amphibian</strong>s. Today and Tomorrow’s Printers and Publishers,New Delhi, India.Tyler, M.J. 1999. Distribution patterns of amphibians in the Australo-Papuan region. In: W.E. Duellman(ed.), Patterns of Distribution of <strong>Amphibian</strong>s. A Global Perspective, pp. 541-556. The Johns HopkinsUniversity Press, Baltimore, Maryland, USA.Uchiyama, R., Maeda, N., Numata, K. and Seki, S. 2002. A Photographic Guide: <strong>Amphibian</strong>s and Reptilesin Japan. Heibonsha, Tokyo, Japan.Whitten, T., van Dijk, P.P., Curran, L., Meijaard, E., Supriatna, J. and Ellis, S. 2005. Sundaland. In: R.A. Mittermeier,P. Robles-Gil, M. Hoffmann, J.D. Pilgrim, T.M. Brooks, C.G. Mittermeier, J.L. Lamoreux andG. Fonseca (eds.), Hotspots Revisited: earth’s biologically richest and most threatened ecoregions, pp.164-172. CEMEX, Mexico City, Mexico.Wildlife Conservation Society of the Philippines. 1997. Philippine Red Data Book. Bookmark, Manila,Philippines. 262 pp.Xie, Y. and Wang, S. 2004. China Species Red List, Vol. 1 Red List, Higher Education Press, Beijing,China.Ye, C.-Y, Fei, L. and Hu, S.Q. 1993. Rare and Economic <strong>Amphibian</strong>s of China. Sichuan Publishing House ofScience and Technology, Chengdu, China.Zhao, E.M. 1998. China Red Data Book of Endangered Animals – Amphibia. Science Press, Beijing,China.Zhao, E.M. 1999. Distribution patterns of amphibians in temperate East Asia. In: W.E. Duellman, W.E.,Patterns of Distribution of <strong>Amphibian</strong>s: A Global Perspective, pp. 421-443, Johns Hopkins UniversityPress, Baltimore, Maryland, USA.Zhao, E.M. and Adler, K. 1993. Herpetology of China. Society for the Study of <strong>Amphibian</strong>s and Reptiles,Lawrence, Kansas, USA.Zhao, E.M., Chang, H.W., Zhao, H. and Adler, K. 2000. Revised checklist of Chinese Amphibia and Reptilia.Sichuan Journal of Zoology 19:196-207.Ziegler, T. 2002. Die Amphibien und Reptilien eines Tieflandfeuchtwald-Schutzgebietes in Vietnam. NTVWissenschaft, Münster.The treefrog Polypedates feae (Least Concern)from the Family Rhacophoridae is widely, butsparsely, distributed in southern China, Vietnam,Laos, Thailand and Myanmar. It is generallyassociated with closed-canopy evergreen rainforest,and breeds in streams, ponds and paddyfields and holes in trees. © Nikolai L. OrlovEndnotes1 Note that at the time of writing, this species wasrediscovered at the type locality by S.D. Biju (pers.comm.).2 According to taxonomic changes proposed byFrost et al. (2006), there are 18, as opposed to14, families in the Indomalayan Realm, threeof which (Nyctibatrachidae, Micrixalidae andIchthyophiidae) are endemic.3 Frost et al. (2006) transfer many of the Indomalayanspecies of Bufo to other genera.4 Frost et al. (2006) transfer many of these to othergenera.5 Under Frost et al’s. (2006) arrangement, the Ranidaeare split into several families, resulting in the followingchanges in the Indomalayan Realm: a) 13 speciesin the genera Nyctibatrachus and Lankanectes aretransferred to the family Nyctibatrachidae, whichis endemic to southern India and Sri Lanka; b) 141Indomalayan species in the genera Chaparana, Euphlyctis,Fejervarya, Hoplobatrachus, Limnonectes,Minervarya, Nannophrys, Nanorana, Occidozyga,Paa and Sphaerotheca are transferred to the predominantlyIndomalayan family Dicroglossidae; c) 10species from the genus Indirana from southern Indiaare transferred to the predominantly Afrotropicalfamily Petropedetidae; d) 11 species in the genusMicrixalus are transferred to the family Micrixalidaewhich is endemic to southern India; e) 32 species inthe genera Ingerana and Platymantis are transferredto the predominantly Oceanian family Ceratobatrachidae;and f) 168 species in the genera Amolops,Huia, Meristogenys, Pseudoamolops, Pterorana,Rana and Staurois are retained in the Ranidae.6 Frost et al. (2006) changes to the Ranidae result inthe Rhacophoridae becoming the largest family inthe Indomalayan Realm.7 At the time of writing, Stuart et al. 2006 (RafflesBulletin of Zoology 54:129) presented the descriptionof two new species, and no fewer than 11 newcountry records for Cambodia alone from the hillyregions of eastern Cambodia.8 Note that most of Japan is in the Palaearctic Region,but the Ryukyu Islands are in the IndomalayanRealm.The ranid frog Nyctibatrachus hussaini (Endangered)is currently only known from KudremukhNational Park in the Western Ghats of India. Ithas been recorded from torrential hill streamsin tropical evergreen forest, and its habitat isthreatened by mining activities, and by theharvesting of wood and timber. © Rohit S.Naniwadekar
80Threatened <strong>Amphibian</strong>s of the WorldESSAY 7.1. AN OVERVIEW OF OUR KNOWLEDGE ON INDONESIAN AMPHIBIANSOreophryne minuta (Data Deficient) from the Derewo River Basin in the mountainsof western Papua, Indonesia, at 2,000m asl. © Djoko IskandarStraddling the tropics with more than 17,000 islands, Indonesia has thelongest coastline of any country in the world, and also has among the highestmountains in the tropics. Indonesia consists of three bioregions, namelySundaland, Wallacea, and the Papuan realm. Sundaland comprises the threelarge islands of Borneo, Sumatra and Java, although politically Borneo isdivided among three nations. Wallacea includes the large island of Sulawesi,and the smaller islands of two extensive archipelagos: the Malukus and theLesser Sundas (Nusa Tenggara). The Papuan realm comprises Indonesia Papua(on New Guinea), plus a number of offshore islands.That Indonesia is ranked as the second richest country in terms of knownbiodiversity in the world (Mittermeier et al. 1997) is significant when oneconsiders that much of the region remains unexplored or poorly surveyed.Nonetheless, the remarkable diversity and endemism of its flora and faunais underscored in the reports of numerous undescribed species discovered inpractically every new expedition undertaken in the country. According to theresults of the Global <strong>Amphibian</strong> Assessment, there are nearly 350 species ofamphibians documented from Indonesia (ranking Indonesia as the sixth mostimportant country for amphibian diversity), of which nearly half (46%) areendemic. However, as an indication of just how poorly known the fauna is,one-third of amphibian species in the country are classed as Data Deficienton the IUCN Red List (significantly higher than the global average).The amphibian fauna on Indonesia has been for the most part overlookedsince the end of World War II. The islands of Sumatra and Sulawesi areparticularly poorly known, and very few publications deal with these twolarge islands. The faunas of Kalimantan (Indonesia Borneo) and IndonesianPapua, on the other hand, are relatively better documented, but only as a directresult of the influence of herpetological surveys undertaken in neighbouringSabah and Sarawak (Malaysia) in Borneo, and Papua New Guinea in NewGuinea. Whereas the number of described amphibians on Sumatra stood at68 in 1923, the total now stands at around 100 species mainly due to newdiscoveries, although this number is likely to increase exponentially givenour current knowledge of undescribed forms. There is a particular paucity ofinformation on amphibian species in montane or even or at medium elevationson Sumatra (Inger and Voris 2001; Inger and Iskandar 2005). This is also thecase for Borneo. For example, at the time of the publication of the first editionof their guide to the frogs of Borneo, Inger and Stuebing (1997) recorded 15Philautus species from Borneo, though not a single species was observedin the Indonesian part (Kalimantan) even though this area occupies roughlytwo-thirds of the land mass. More than 80% of the amphibian species ofBorneo have been described from either Sabah or Sarawak.Sulawesi has very few species in common with other islands. At present,the island is considered to be species poor, although there are indicationsthat numerous species await formal description, especially in the generaLimnonectes and Rhacophorus (Iskandar and Tjan 1994; Evans et al. 2002).Iskandar and Tjan (1994) reported at least 13 undescribed amphibian speciesNyctixalus margaritifer (Vulnerable) occurs on the island of Java, Indonesia,at elevations above 700m asl. It was rediscovered in 1997 after a long periodwithout any records. © Djoko Iskandarand several other new records and doubled the number of species hithertoknown from the island. However, the low number of amphibian generarepresented is an indication that this island may truly have an impoverishedfauna. The Lesser Sunda Islands are essentially arid and consequently lowin species diversity, as is the case for the Malukus. When a workshop onthe Biodiversity of New Guinea was held in Biak 1 , a study revealed that theratio of publications on Indonesian Papua compared with Papua New Guineawas roughly 1 to 14, suggesting that very few works have been done in theIndonesian part. This is also evident in the number of amphibian species inIndonesian Papua, which currently has at least 100 fewer described speciesthan Papua New Guinea, even though Indonesia represents roughly half theland mass (see also Essay 6.4).Of the three greater regions, Sundaland is richest in terms of species,although amphibian composition differs greatly among the three main islands,particularly at the generic level. The island of Borneo, the largest and themost ecologically diverse of three, has an extremely high number of endemicspecies (see Essay 7.5), though bearing in mind that most Bornean specieshave been described from Sabah or Sarawak. By contrast, the Wallaceanregion is depauperate in species (especially in the Lesser Sundas), with alittle over 30 species recorded.There is much variation in body-size among Indonesia amphibians, rangingfrom about 10mm in Oreophryne minuta (DD) from Papua (Richards andIskandar 2000) – one of the smallest amphibian species in the world – toabout 300mm in Limnonectes blythii (NT) of Sumatra, one of the largest frogspecies. Reproductive strategies include parental care (Inger 1966; Inger andVoris 1988; Brown and Iskandar 2002; Günther 2006) to tadpole laying in an asyet unnamed Sulawesian species (Iskandar and Tjan 1994; and see Chapter1). Most eggs are laid in a single gelatinous mass, but many Limnonectesand Platymantis and all the New Guinean microhylids have a derived modeof reproduction (parental care).Unfortunately, Indonesia is a country experiencing an exceptionally highrate of forest loss due to a combination of land conversion and forest fires,and while only 10% of the country’s amphibians are listed as threatened,this probably will be shown to be considerably higher with further surveywork. Most forest loss has occurred in the last three decades, a result ofcommercial logging and major agricultural projects (including oil palm plantations)in combination with government policies. In Sumatra, for example,illegal and unsustainable logging and non-timber forest product extractionare widespread, and fueled by high demand for hardwood timber from China,North America, Europe, and Japan. Fires have become a major threat in recentyears, and may often be linked to logging operations that create flammableconditions by both leaving fuelwood on the forest floor, and through exposingthe understory to drying (Whitten et al. 2004). It may be suspected thatglobal climate change is resulting in the drying and dessication of a numberof large aquatic areas, such as the Fly River Basin and lowland areas, butfurther detailed study is needed.In conclusion, our knowledge of Indonesia’s amphibians is scattered andlargely based on what is known from faunistic surveys in a few areas only; nosingle area, even on Java, has reliable data on the ecology and distributionof amphibians. Survey work is hampered by the fact that many areas in theregion are too remote or inaccessible for quick study and assessment, andthe facilities and resources available for study are generally lacking. However,notwithstanding, there are several regions within Indonesia that representurgent priorities for further survey work, particularly since they are likelyto be characterized by high levels of endemism, including: Mounts Leuserand Kerinci in Sumatra, the Muller and Meratus ranges in Kalimantan, theMengkoka Mountains in Sulawesi, and most parts of Indonesian Papua. Furthermore,we have virtually no amphibian records for small- to medium-sizedislands such as Karimata in the west and most of the Malukus, especially asmany of them have relatively unexplored high mountains.ReferencesDjoko T. IskandarBrown, R.M. and Iskandar, D.T. 2000. Nest Site Selection, Larval Hatching and AdvertisementCalls of Limnonectes arathooni from southwestern Sulawesi (Celebes) Island,Indonesia. Journal of Herpetology 34.3:404-413.Evans, B.J., Brown, R.M., McGuire, J.A., Supriatna, J., Andayani, N., Diesmos, A., Iskandar,D., Melnick, D.J., Canatella, D.C. 2003. Phylogenetics of Fanged Frogs: TestingBiogeographical Hypotheses at the Interface of the Asian and Australian Faunal Zone.Systemic Biology 52:794-819.Günther, R. 2006. Derived reproductive modes in New Guinean anuran amphibians anddescription of a new species with paternal care in the genus Callulops (Microhylidae).Journal of Zoology 268:153-170Inger, R.F. 1966. The systematics and zoogeography of the Amphibia of Borneo. FieldianaZoology 52:1-402.Inger, R.F. and Iskandar, D.T. 2005. A collection of <strong>Amphibian</strong>s from West Sumatra, withdescription of a new species of Megophrys (amphibia: Anura) Raffles Bulletin ofZoology 53:133-142.Inger, R.F. and Voris, H.K. 1988. Taxonomic status and reproductive biology of Borneantadpole-carrying frogs. Copeia 1988:1060-1062.Inger, R.F. and Voris, H.K. 2001. The biogeographical relations of the frogs and snakes ofSundaland. Journal of Biogeography 28:863-891.Inger, R.F. and Stuebing, R.B. A Field Guide to the Frogs of Borneo. Natural History Publications,Kota Kinabalu, Borneo.Iskandar, D.T. and Tjan, K.N. 1996. The <strong>Amphibian</strong>s and Reptiles of Sulawesi, with noteson the distribution and chromosomal number of frogs. In: D.J. Kitchener and A. Suyanto(eds.), Proc. of the First International Conference on Eastern Indonesian-AustralianVertebrates, pp.39-46. Western Australian Museum for Lembaga Ilmu PengetahuanIndonesia, Perth, Western Australia, Australia.Mittermeier, R.A., Gil, P.R. and Mittermeier, C.G. 1997. Megadiversity. Earth’s BiologicallyWealthiest Nations. CEMEX, Mexico City, Mexico.Richards, S.R. and Iskandar, D.T. 2000. A new tiny species of frog of the genus Oreophryne(Anura, Microhylidae) from the mountains of Irian Jaya, Indonesia Raffles Bulletin ofZoology 48:257-262.Whitten, T., van Dijk, P.P., Curran, L., Meijaard, E., Wood, P., Supriatna, J. and Ellis, S.2004. Sundaland. In: R.A. Mittermeier, P. Robles-Gil, M. Hoffmann, J.D. Pilgrim, T.M.Brooks, C.G. Mittermeier, J.L. Lamoreux and G. Fonseca (eds.), Hotspots Revisited:Earth’s Biologically Richest and Most Endangered Terrestrial Ecoregions, pp. 164-172.CEMEX, Mexico City, Mexico.1 The Irian Jaya Biodiversity Conservation Priority-Setting Workshop. ConservationInternational. Biak 7-11 January 1997.ESSAY 7.2. DIVERSITY AND CONSERVATION STATUS OF THE WESTERN GHATS AMPHIBIANSThe Western Ghats are a chain of mountains in western India running parallelto the coast for over 1,600km. The mountains in the northern portion beginas low-lying hills close to the Tapti River in Gujarat, increase in height asthey pass southwards through the States of Maharashtra, Goa, Karnatakaand Kerala, and end abruptly in the Mahendragiri Hills of Tamil Nadu State- the southernmost tip of Peninsular India. Along their entire length, there isonly one major discontinuity, the biogeographically important ‘Palghat Gap’of Kerala, which is approximately 30km wide and has an elevation of lessthan 100m above sea level (Figure 2).Perhaps surprisingly for such a populous country as India, about one-thirdof the Western Ghats is still covered by natural vegetation, including about20,000km 2 of rapidly diminishing tropical moist forest (Collins 1990). Althoughthese areas may constitute only around 5% of the total land area of India, theycontain at least 30% of India’s native species (Rodgers and Panwar 1988).The results of the Global <strong>Amphibian</strong> Assessment indicated that 237 amphibianspecies are present within India 1 . This impressive diversity includes212 species of frogs and toads in seven families and 37 genera, at least 25species of caecilians, and a single species of salamander (Tylototriton verrucosus)that lives in the mountains of the north-east. The amphibian faunaof India as a whole has been discussed in a number of publications, includingInger and Dutta (1986), Inger et al. (1987), Daniels (1992), Dutta (1997), Pillaiand Ravichandran (1999), and Das (2000) 2 .The amphibian diversity of the Western Ghats is distinctive both in itsdiversity and endemism (Biju 2001; Biju and Bossuyt 2003). These mountainscurrently hold 131 recognized amphibian species in 25 genera, with 114 ofthese species (87%) being entirely restricted to this biodiversity hotspot.Higher-taxonomic-level endemism clearly makes this region important inthe Asiatic region (Roelants et al. 2004; Bossuyt et al. 2004), with twofamilies (Nasikabatrachidae and Uraeotyphlidae), and eight genera (Indirana,Indotyphlus, Melanobatrachus, Micrixalus, Minervarya, Nasikabatrachus,Nyctibatrachus, Uraeotyphlus) being endemic 3 .According to the results of the GAA, 53 amphibian species of the WesternGhats, or 40% of the amphibian fauna, are threatened with extinction 4 (Figure1). In addition to the high number of threatened species, it is also worryingthat many of the once locally common species (e.g., Nyctibatrachus aliciae,N. minor, Micrixalus fuscus, Rhacophorus lateralis and several of the morewidespread Philautus species) appear to have visibly declined in recent years(S.D. Biju pers. obs.). Several species have not been recorded since theiroriginal descriptions (e.g., Philautus flaviventris and P. chalazodes), and thepossibility exists that they are extinct.It is very likely that the leading threat to the amphibian species of theWestern Ghats is the continuing conversion or modification of naturalhabitats. This loss of habitat is largely driven by the continuing growth ofthe human population in this area, and the basic needs of these people forboth agricultural and urban land. Significant threats to the remaining naturalforests also come from the ongoing expansion of plantations (including bothnon-native timber plantations and tea and coffee estates); commercial loggingoperations; the extensive extraction of forest products such as firewood; and,perhaps more localized, but nonetheless highly damaging, mining for metalores and gemstones. While there are no records to date in the Western Ghatsof the disease chytridiomycosis, which has been implicated in the consider-
Chapter 7. <strong>Amphibian</strong>s of the Indomalayan Realm 81Ansonia2 species‘Bufo’10 speciesPedostibes1 speciesKaloula1 speciesMelanobatrachus1 speciesMicrohyla3 speciesRamanella6 speciesUperodon1 speciesNasikabatrachus1 speciesEuphlyctis2 speciesFejervarya10 speciesHoplobatrachus2 speciesSphaerotheca4 speciesMinervarya1 species‘Rana’4 speciesIndirana10 speciesMicrixalus11 speciesNyctibatrachus12 species‘Philautus’21 speciesPolypedates2 speciesRhacophorus5 speciesGegeneophis7 speciesIndotyphlus2 speciesIchthyophis7 speciesUraeotyphlus5 speciesable declines of amphibian communities in Latin America and Australia, thereis a need for field surveys to confirm the current absence of this pathogen.The primary means of protecting the amphibians of the Western Ghats isthrough the region’s extensive system of protected areas. There are a totalof nine National Parks and 45 Wildlife Sanctuaries in the mountain range(Kothari et al. 1989; recent updating), covering a total area of 16,935km 2 or11% of the Ghats (Collins 1990). Many of the threatened amphibian specieshave at least some part of their range within these parks and reserves, butit will be important to rapidly characterize how many Critically Endangeredand Endangered species are not present within these protected areas. Urgentsteps are needed to also protect the remaining habitat of these species toprevent imminent extinctions.One of the largest problems for conserving the amphibian fauna of theWestern Ghats is the lack of detailed systematic and other biological informationfor much of the region’s amphibian species. Some 41 species fromthe Western Ghats are categorized as Data Deficient – these are species forwhich insufficient details are available on the taxonomic identity, distribution,or threats to determine whether these animals are of global conservationconcern. A number of the Data Deficient species from the Western Ghats areknown only from the original, historical description, which can often be brief orincomplete in a contemporary context, and in many instances does not includeenough specifi c details about the initial collection locality. Additionally, thetype-series has sometimes been lost or misplaced, meaning that there is verylittle information available to guide contemporary workers.However, the greatest impediment to conservation and managementof this rich amphibian fauna may be hidden in the vast number of speciesthat remain to be described. Intense fi eldwork (Biju 2001) has revealed thatmany clearly morphologically distinct species have not yet been scientifi -cally documented. In addition, the intra-population structure of several ofthe currently well-recognized species remains very poorly known. It isbecoming increasingly clearer that some of the taxa that are considered tobe common and widespread in the Western Ghats may actually representcryptic ‘species complexes’ – groups of similar looking taxa that form distinctevolutionary lineages (Bickford et al. 2007). In view of the ongoing threatsto the remaining natural habitat of the Western Ghats, and considering thata number of species currently hidden within these complexes will haverestricted ranges, these species may, in turn, be of signifi cant conservationconcern. Molecular approaches, such as DNA barcoding (see Essay 11.11),Red List CategoryNumberof speciesExtinct (EX) 1Extinct in the Wild (EW) 0Critically Endangered (CR) 10Endangered (EN) 27Vulnerable (VU) 16Near Threatened (NT) 6Least Concern (LC) 30Data Defi cient (DD) 41Total taxa 13131.3%22.9%0.7%7.6%4.6%20.6%12.3%Figure 1. Summary of the Red List status for amphibians in the Western Ghats,based on the results of the Global <strong>Amphibian</strong> Assessment.
82Threatened <strong>Amphibian</strong>s of the WorldFigure 2. Map of the Western Ghats showing a generalized boundary of theregion, elevation, and protected areas in white.will be extremely useful to rapidly map many aspects of amphibian diversityin the Western Ghats.Urgent work is now needed to describe, document, and protect these exceptionalbiota. To resolve the existing confusion, greater emphasis is neededon serious coordinated research activities for the Western Ghats amphibians.Perhaps most urgently, detailed collaborative studies by scientists workingin different geographical areas of this long mountain chain are needed tofinally determine the correct taxonomic identification of many of the region’samphibians. The conservation management of the exceptional amphibianfauna of the Western Ghats, and the biological diversity of this mountainrange as a whole, can only benefit from such an investment.S D Biju, Rachunliu G Kamei, Bhatta, G., Varad Giri, Neil Cox,Indraneil Das and Franky BossuytReferencesBhatta, G., Dinesh, K.P., Prashanth, P. and Kulkarni, N.U. 2007. A new species of GegeneophisPeters (Amphibia: Gymnophiona: Caeciliidae) from Goa, India. Zootaxa1409:51-59.Bickford, D., Lohman, D.J., Sodhi, N.S., Ng, P.K.L., Meier, R., Winker, K., Ingram, K. andDas, I. 2007. Cryptic species as a window on diversity and conservation. Trends inEcology and Evolution 22(3):148-155.Biju, S.D. 2001. A Synopsis to the Frog Fauna of the Western Ghats, India. OccasionalPapers of the Indian Society for Conservation Biology 1:1-24.Biju, S.D and Bossuyt, F. 2003. New frog family from India reveals an ancient biogeographicallink with the Seychelles. Nature 425:283-284.Bossuyt, F., Meegaskumbara, M., Beenaerts, N., Gower, D., Pethiyagoda, R., Roelants,K., Mannaert, A., Wilkinson, M., Bahir, M.M., Manamendra-Arachchi, K., Ng, P.K.L.,Schneider, C.J., Oommen, O.V. and Milinkovitch, M.C. 2004. Local endemism withinthe Western Ghats-Sri Lanka biodiversity hotspot. Science 306:479-481.Collins, D. 1990. The Last Rain Forests. Mitchell Beazley and IUCN, London.Daniels, R.J. 1992. Geographical distribution patterns of amphibians in the Western Ghats,India. Journal of Biogeography 19:521-529.Das, I. 2000. Updates in amphibian systematics and nomenclature for the Indian region.Biodiversity India, ISCB Newsletter 8-12:3-5.Das, I. and Dutta, S.K. 2006. New species of Polypedates (Anura: Rhacophoridae) from theWestern Ghats, southwest India. Journal of Herpetology. 40(2):214-220.Dutta, S.K. 1997. <strong>Amphibian</strong>s of India and Sri Lanka (Checklist and bibliography). OdessyPublishing House, Bhubaneswar. 342 pp.Frost, D.R. 2007. <strong>Amphibian</strong> Species of the World: an online reference. Version 5.0 (12July 2007). Electronic Database accessible at http://research.amnh.org/herpetology/amphibia/index.html. American Museum of Natural History, New York, USA.Frost, D.R., Grant, T., Faivovich, J.N., Bain, R.H., Haas, A., Haddad, C.F.B., de Sá, R.O.,Channing, A., Wilkinson, M., Donnellan, S.C., Raxworthy, C.J., Campbell, J.A., Blotto,B.L., Moler, P., Drewes, R.C., Nussbaum, R.A., Lynch, J.D., Green, D.M. and Wheeler,W.C. 2006. The amphibian tree of life. Bulletin of the American Museum of NaturalHistory 297:1-370.Inger, R.F. and Dutta, S.K. 1986. An overview of the amphibian fauna of India. Journal ofthe Bombay Natural History Society 83:135-146.Inger, R.F., Shaffer, H.B., Koshy, M. and Bakde, R. 1987. Ecological structure of a herpetologicalassemblage in South India. Amphibia-Reptilia 8:189-202.Kothari, A., Pratibha, P., Shekhar, S. and Dilnavaz, V. 1989. Management of NationalParks and Sanctuaries in India: A Status Report. Ministry of Environment and Forests,Government of Kerala, New Delhi.Pillai, R.S. and Ravichandran, M.S. 1999. Gymnophiona (Amphibia) of India, a taxonomicstudy. Records of the Zoological Survey of India, Occasional Paper No. 172. 117 pp.Rodgers, W.A. and Panwar, H.S. 1988. Planning a Wildlife Protected Area, Network India.Wildlife Institute of India, Dehra Dun.Roelants, K., Jiang, J. and Bossuyt, F. 2004. Endemic ranid (Amphibia: Anura) generain southern mountain ranges of the Indian subcontinent represent ancient froglineages: evidence from molecular data. Molecular Phylogenetics and Evolution31:730-740.Roelants, K., Gower, D.J., Wilkinson, M., Loader, S.P., Biju, S.D., Guillaume, K., Moriau, L.and Bossuyt, F. 2007. Global patterns of diversification in the history of modern amphibians.Proceedings of the National Academy of Sciences, USA 104:887-892.Van Bocxlaer, I., Roelants, K., Biju, S.D., Nagaraju, J. and Bossuyt, F. 2006. Late CretaceousVicariance in Gondwanan <strong>Amphibian</strong>s. PLoS ONE 1(1):e74.1 Frost (2007) currently recognizes 265 amphibian species present in India. This totalincludes a number of recently described species, such as the tree frog Polypedatesoccidentalis Das and Dutta (2006), not included in the 2005 results of the GAA.2 Frost (2007) recognizes a diversity of 237 species of frogs and toads in 12 families(including the Western Ghats endemic Micrixalidae) and 50 genera, 27 species ofcaecilians, and a single species of salamander. Since this last version, a few additionalnew species of amphibian, such as the caecilian Gegeneophis goaensis (Bhatta et al.2007), have been described from the Western Ghats.3 Also, see Frost et al. (2006), Van Bocxlaer et al. (2006), Frost (2007) and Roelants etal. (2007), for emerging information on the high biological diversity of the WesternGhats.4 In addition to the 52 threatened species (Critically Endangered, Endangered orVulnerable), there are six Near Threatened species, and a single species regarded asExtinct.ESSAY 7.3. PHILIPPINE AMPHIBIAN SPECIES BIODIVERSITY IS INCREASING BY LEAPS AND BOUNDSThe discovery and description of the diversity of Philippine amphibians beganwith early European and American professional naturalist collectors whomade ancillary collections of amphibian specimens and returned these tomuseums in their native countries. Descriptions of these specimens were laterprepared by early herpetologists such as Duméril, Bibron, Peters, Boettger,Boulenger, Günther, Mertens, Wiegmann, and Stejneger, among others. Thefirst published descriptions of endemic Philippine species were soon followedby discoveries of strange and unique species that captured the attention andcuriosity of biologists around the world.Looking back as students of the history of herpetology in the Philippines,it is convenient now for us to think of five separate chapters in the study ofPhilippine herpetological diversity (Brown et al. 2002). These include the initialperiod of exploration described above, followed by the career of Edward Taylor(1913-1975). We think of Taylor as the “father” of Philippine herpetology becausehis work, involving multiple detailed monographs, resulted in descriptions of somany of the truly spectacular Philippine endemics and a first true appreciationof the staggering magnitude of herpetological diversity in the archipelago. Thethird phase was marked by the work of Robert Inger and the publication of hismonograph “Systematics and zoogeography of Philippine Amphibia (Inger 1954).Inger’s comprehensive review of Philippine amphibians marked a turning pointin the history of herpetology in the country because of his systematic applicationof an explicitly stated species concept, statistical treatment of natural variation,and other advances. The fourth stage of Philippine herpetology includes thelengthy and productive collaboration of Angel Alcala and the late Walter Brown(1958-2000). This body of work included numerous comprehensive taxonomicreviews, new species descriptions, and a variety of the first ecological anddevelopmental studies in Philippine herpetology. Finally, we consider the presentday, on-going effort to review the amphibians and reptiles of the Philippines afifth phase in the development of the study of the herpetofauna of the country.An examination of species accumulation over these years (Figure 1) providesus with an appreciation of the magnitude of taxonomic contributions from eachof these five distinct periods in Philippine herpetology.In 1993, the discovery of a new species of forest frog in the genus Platymantisfrom the mossy forests of Panay Island in central Philippines triggereda major reconsideration of species boundaries within this group. The newspecies (P. panayensis, EN) differed from an adjacent population (P. hazelae,EN) on nearby Negros Island by subtle differences in morphological proportions,slight differences in coloration, and by its distinct male advertisementcall (Brown et al. 1997). The realization that closely related species maydiffer primarily by advertisement call unleashed a plethora of active fieldworkand taxonomic studies, resulting in a doubling of the number of species ofPlatymantis from 12 to 24 species, between 1997 and 2001 (summarized inAlcala and Brown 1999). With the appreciation that advertisement calls mayprovide us with insight into truly biologically meaningful suite of characters,we undertook a comprehensive assessment of the acoustic diversity of Philippineforest frogs along with a thorough re-evaluation of the species diversityin the Philippine members of the genus Platymantis. The other major advancein improving our understanding of species diversity in the Philippines has beenthe application of molecular phylogenetic approaches (Brown and Guttman2002; Evans et al. 2003; Brown 2004) to new collections of genetic samplesof amphibian species from a robust geographic coverage throughout the majorisland groups of the country. The combination of these new tools have providednew insights into species boundaries and helped uncover the presenceof numerous cryptic species that had gone unnoticed for so many decades.Initial results of this ongoing work fortified our understanding of the degreeto which biodiversity in Philippine Amphibia has been grossly underestimatedby traditional, primarily morphology-based taxonomic practices (Figure 1).The result is a new appreciation of diversity that provides a fuller, more balanced,and biologically meaningful appreciation of the complex interactionsof characteristics that have surfaced as most meaningful for the process oflineage diversification in Philippine amphibians (Figure 2).Our current understanding of amphibian species diversity in the Philippinesstands at 97 indigenous species (Brown et al. 2002; Diesmos et al. 2002).However, species descriptions of new frogs of the genus Platymantis currentlyin progress will soon increase that number to around 130 taxa. And, if work onother undescribed species of frogs of other genera that we are aware of wereto be completed, the total number would eventually reach at least 165 species.If current trends in rates of species discoveries hold as biologists explore thestill many biologically unexplored regions of the country, we expect a possibledoubling of the richness of Philippine Amphibia within the next two decades.Cumulative Total2001801601401201008060402001840Linnaeus18501860Günther, Peters, Boulenger,Boettger, Stejneger, etc.18701880189019001910Taylor1920The irony of the astonishing rates of species discovery, even as so manyspecies are declining (Hanken 1999; Stuart et al. 2004; Köhler et al. 2005),coupled with the devastating loss of forested habitat in the Philippines,convinces us that no higher conservation urgency in the world exists thanthat of the megadiverse Philippine global biodiversity hotspot (Myers etal. 2000; Catibog-Sinha and Heaney 2006). With so few trained workersactively working to discover and describe new species of Philippine amphibians,we are left with doubt as to whether we can survey and characterizePhilippine amphibian biodiversity within the timeframe of our own careers.Consequently, there can be no greater priority than training new students inamphibian field studies and doing everything possible to overcome logisticaland bureaucratic obstacles to field work while at the same time investing incollections and related repositories. It is through the building of natural historycollection resources (including digital photographic archives, sound libraries,and genetic collection resources) that will enable tomorrow’s generationsof biologists the opportunity to re-assess our work in light of technologicaladvances of the future. Coupled with constant and regular conservationstatus assessments, we are convinced that these efforts provide the bestchances of preventing impending catastrophic amphibian extinctions thatloom on the horizon if we fail to take action now (Lips et al. 2003; Sodhi etal. 2004; Stuart et al. 2004).Rafe Brown, Arvin Diesmos, and Angel AlcalaFigure 1. Species accumulation curve for Philippine amphibians, including endemic (circles) and non-endemic (squares) species. Estimates of numbers of newspecies awaiting description are based on a combination of morphological, behavioural, and ecological character differences, with species’ distinctivenessconfirmed by bioacoustic and molecular data.1930Year of descriptionInger19401950Anticipated in 4-5 years given current rate ofdescriptions and number of currently knownnew amphibian species1960Brown and Alcala197019801990Today20002010
Chapter 7. <strong>Amphibian</strong>s of the Indomalayan Realm 83ReferencesAlcala, A.C. and Brown, W.C. 1999. Philippine frogs of the genus Platymantis (Amphibia:Ranidae). Philippine Journal of Science 128:281-287.Brown, R.M. 2004. “Evolution of ecomorphological variation and acoustic diversity inmate-recognition signals of Southeast Asian forest frogs (subfamily Platymantinae)”.Ph.D. Dissertation, University of Texas, Austin, Texas, USA.Brown, R.M., Diesmos, A.C. and Alcala, A.C. 2002 (“2001”). The state of Philippineherpetology and the challenges for the next decade. Silliman Journal42:18-87.Brown, R.M. and Guttman, S.I. 2002. Phylogenetic systematic of the Rana signata complexof Philippine and Bornean stream frogs; reconsideration of Huxley’s modification ofWallace’s Line at the Oriental-Australian faunal zone interface. Biological Journal ofthe Linnean Society 76:393-461.Brown W.C., Brown, R.M. and Alcala, A.C. 1997. Species of the hazelae group of Platymantis(Amphibia: Ranidae) from the Philippines, with descriptions of two new species.Proceedings of the California Academy of Sciences 49:405-421.Catibog-Sinha, C.S. and Heaney, L.R. 2006. Philippine biodiversity: Principles andPractice. Haribon Foundation for Conservation of Natural Resources, Quezon City,Philippines.Diesmos, A.C., Brown, R.M., Alcala, A.C., Sison, R.V., Afuang, L.E. and Gee, G.V.A. 2002.Philippine amphibians and reptiles. In: P.S. Ong, L.E. Afuang and R.G. Rosell-Ambal(eds.), Philippine Biodiversity Conservation Priorities: a Second Iteration of the NationalBiodiversity Strategy and Action Plan, pp.26-44. Department of the Environment andNatural Resources–Protected Areas and Wildlife Bureau, Conservation InternationalPhilippines, Biodiversity Conservation Program–University of the Philippines Centerfor Integrative and Developmental Studies, and Foundation for the Philippine Environment.Quezon City, Philippines.Evans, B.J., Brown, R.M., McGuire, J.A., Supriatna, J., Andayani, N., Diesmos, A.C.,Iskandar, D., Melnick, D.J. and Cannatella, D.C. 2003. Phylogenetics of fanged frogs:testing biogeographical hypotheses at the interface of the Asian and Australian faunalzones. Systematic Biology 52:794-819.Hanken, J. 1999. Why are there so many new amphibian species when amphibians aredeclining? Trends in Ecology and Evolution 14:7-8.Inger, R.F. 1954. Systematics and zoogeography of Philippine Amphibia. Fieldiana33:181-531.Köhler, J., Vieites, D.R., Bonett, R.M., García, F.H., Glaw, F. Skeinke, D. and Vences, M.2005. New amphibians and global conservation: a boost in species discoveries in ahighly endangered vertebrate group. BioScience 55:693-696.Lips, K.R., Reeve, J. and Witters, L.R., 2003. Ecological factors predicting amphibianpopulation declines in Central America. Conservation Biology 17:1078-1088.Sodhi, N.S., Koh, L.P., Brook, B.W. and Ng, P.K.L. 2004. Southeast Asian biodiversity: animpending disaster. Trends in Ecology and Evolution 19:654-660.Stuart, S.N., Chanson, J.S., Cox, N.A., Young, B.E., Rodrigues, A.S.L., Fischman, D.L. andWaller, R.W. 2004. Status and trends of amphibian declines and extinctions worldwide.Science 306:1783-1786.Figure 2. Representatives of the species complexes defined by Brown et al. (1997), in part corresponding to the ecomorph classes defined by Brown (2004):P. indeprensus of the Platymantis dorsalis Species <strong>Group</strong> (ground frogs; A); P. isarog of the Platymantis hazelae Species <strong>Group</strong> (shrub frogs; B); P. banahaoof the Platymantis guentheri Species <strong>Group</strong> (treefrogs; C); and an example of an enigmatic intermediate: Platymantis insulata (a terrestrial species, nestedwithin the treefrog clade; D). All photos © Rafe Brown, 2006. Courtesy of HerpWatch Philippinesa. c.b.d.ESSAY 7.4. AMPHIBIAN SPECIES DISCOVERY IN MAINLAND SOUTHEAST ASIAThe global number of recognized amphibian species has risen dramatically overthe past two decades (Hanken 1999; Köhler et al. 2005), making amphibiansone of the animal groups with the highest proportional rate of description ofnew species (Hanken 1999). This increase is primarily due to the discovery oftruly ‘novel’ forms by intensified scientific collecting in previously unexploredparts of the world. Molecular genetic and bioacoustic tools in systematicstudies have also aided the discovery of ‘cryptic’ species that were previouslyoverlooked because they morphologically resemble other species.Mainland Southeast Asia (defined in Figure 1) is no exception to this globaltrend of rapid, recent discovery of new amphibian species. Beginning in 1834with the description of Hoplobatrachus rugulosus from Hong Kong, a total of299 currently recognized species of limbed amphibians (excluding caecilians)were discovered and described from the region (Figure 1). Most strikingly, theyears 2005 and 2006 (through the time of writing in early November) eachyielded 16 new amphibian species, the highest number of annual descriptionsfrom the region since the advent of Linnean classification. The descriptions of2005-2006 came from every country in the region, suggesting that the very recentboost is not explained by scientific collecting in a localized ‘hotspot’. Priorto the last few years, there have been three peaks of discovery in mainlandSoutheast Asia, with 10-11 currently recognized species described in eachof the years 1937, 1962, and 1983 (Figure 1). Two of these peaks reflect thesignificant contributions of 11 new species from Vietnam by Bourret (1937)and seven new species from Guangxi Province, China, by Liu and Hu (1962),while the third peak is primarily a coincidence of species descriptions fromsouthern China by a number of Chinese authors.Every amphibian species described to date from mainland Southeast Asiahas been distinguished from its closest relatives on the basis of morphologicaldifferences. However, a number of studies have used bioacoustic data (e.g.,Kuramoto and Wang 1987; Wogan et al. 2003) or molecular genetic data (e.g.,Li et al. 2001; Bain et al. 2003) to either discover a new species, or corroboratethe morphological distinctiveness of a new species. Every molecular geneticstudy to date that has broadly sampled populations across the range of awidespread frog species in mainland Southeast Asia has uncovered geneticdiversity that has been interpreted as unrecognized species diversity (Stuartet al. 2006). These findings suggest that species diversity in the region remainssignificantly underestimated. Molecular genetic and bioacoustic toolsare likely to play increasingly important roles in the process of discoveringamphibian species diversity in the region.One of the most striking examples of recent Southeast Asian amphibianspecies discoveries is found in the cascade frogs of the genus Odorrana. Of the30 species of Odorrana described from the region, 19 have been described since2001. Many of these new Odorrana are morphologically very similar and havebeen confused with other species for over a century (Bain et al. 2003; Stuart et al.2006). Molecular genetic tools have shown that several morphologically similar,but genetically distinct, lineages of Odorrana coexist in the same streams. Theecological and behavioural mechanisms that these coexisting species use tomaintain their genetic distinctiveness are currently unknown.The sociological nature of species discovery and description in the rangehas changed over time. Historically, scientists working on amphibians in theregion tended to work and publish alone or with very few colleagues. Today,the process of discovering and describing species in the region involves collaborationamong scientists from within and outside of range countries. Forexample, the average number of authors on species descriptions increasedover time in peak years, with 1.0 in 1937, 1.73 in 1962, 2.0 in 1983, 2.38in 2005, and 2.94 in 2006. The 2005-2006 boom in species descriptions ofamphibians from mainland Southeast Asia represented papers authoredby (alphabetically) American, Burmese, Cambodian, Canadian, Chinese,French, German, Indian, Japanese, Russian, Thai, and Vietnamese authors.The exchange of expertise and division of labour inherent in these growingcollaborations may partly explain the increasing productivity of amphibiantaxonomists working in the region.Our current understanding of amphibian species diversity in the Philippinesstands at 102 indigenous species and five or six introduced species (Brown etal. 2002; Diesmos et al. 2002; Brown 2007). However, species descriptions ofnew frogs of the genus Platymantis currently in progress will soon increasethat number to around 140 taxa. Novel findings await discovery in the vastareas that are still under-surveyed. A number of geographically widespread,single species that are suspected to represent species complexes have notyet been studied with molecular genetic or bioacoustic tools. Some of thesewidespread species may be found to contain multiple, morphologically crypticNumber of species20181614121086420species, each having much smaller geographic ranges. Conversely, newlydiscovered species are often prematurely labeled as endemic to a limitedgeographic area only because scientists have just become aware of them. Althoughinternational cooperation among amphibian taxonomists is increasing,many studies have been restricted by political boundaries. As a result, somespecies have been described on opposite sides of borders under differentnames, and their known geographic distributions are limited by these samplingrestrictions. These challenges indicate that much remains to be learned, anddiscovery efforts in the field and laboratory promise to rapidly improve ourunderstanding of amphibian species diversity in the region.ReferencesBryan L. Stuart and Raoul H. BainBain, R.H., Lathrop, A., Murphy, R.W., Orlov, N.L. and Ho, C.T. 2003. Cryptic species of acascade frog from Southeast Asia: taxonomic revisions and descriptions of six newspecies. American Museum Novitates 3417:1-60.Bourret, R. 1937. Notes herpétologiques sur l’Indochine française. XIV. Les batraciensde la collection du Laboratoire des Sciences Naturelles de l’Université. Descriptionsde quinze espèces ou variétés nouvelles. Annexe au Bulletin Général de l’InstructionPublique 4:5-56.18351840184518501855186018651870187518801885189018951900190519101915192019251930193519401945195019551960196519701975198019851990199520002005Year of descriptionFigure 1. Annual amphibian species descriptions (n = 299 descriptions) from mainland Southeast Asia, defined as Vietnam, Laos, Cambodia, Thailand (north ofthe Isthmus of Kra), Myanmar (north of the Isthmus of Kra), and southern China (Yunnan, Guangxi, Guangdong, Fujian, Hainan, Hong Kong and Taiwan). Data wereobtained from Frost (2006) and subsequently published literature, except that Hoplobatrachus rugulosus was not treated as a junior synonym of H. chinensis. Othersynonyms, species having the vague type locality of “China,” and caecilians (owing to poorly defined species boundaries) were not included.
84Threatened <strong>Amphibian</strong>s of the WorldBrown, R.M. 2007. Introduction, Robert F. Inger’s Systematics and Zoogeography ofPhilippine Amphibia (Foreword to the 2007 reprint of Inger’s 1954 monograph). In:Systematics and Zoogeography of Philippine Amphibia, pp. 1-17. Natural HistoryPublications, Kota Kinabalu.Frost, D.R. 2006. <strong>Amphibian</strong> Species of the World: an Online Reference. Version 4 (17August 2006). Electronic database accessible at http://research.amnh.org/herpetology/amphibia/index.php.American Museum of Natural History, New York, USA.Hanken, J. 1999. Why are there so many new amphibian species when amphibians aredeclining? Trends in Ecology & Evolution 14:7-8.Köhler, J., Vieites, D.R., Bonett, R.M., Garcia, F.H., Glaw, F., Steinke, D. and Vences, M.2005. New <strong>Amphibian</strong>s and Global Conservation: A Boost in Species Discoveries ina Highly Endangered Vertebrate <strong>Group</strong>. BioScience 55:693-696.Kuramoto, M. and Wang, C.-S. 1987. A new rhacophorid treefrog from Taiwan, withcomparisons to Chirixalus eiffingeri (Anura, Rhacophoridae). Copeia 1987:931-942.Li, C., Ye, C.-Y. and Fei, L. 2001. Taxonomic studies of Odorrana andersonii in China (Anura:Ranidae). Acta Zootaxonomica Sinica 26:234-238.Liu, C.-C. and Hu, S.-Q. 1962. A herpetological report of Kwangsi. Acta Zoologica Sinica14(Suppl.):73-104.Stuart, B.L., Inger, R.F. and Voris, H.K. 2006. High level of cryptic species diversity revealedby sympatric lineages of Southeast Asian forest frogs. Biology Letters 2:470-474.Wogan, G.O.U., Htun Win, Thin Thin, Kyi Soe Lwin, Awan Khwi Shein, Sai Wunna Kyi,and Hla Tun. 2003. A new species of Bufo (Anura: Bufonidae) from Myanmar (Burma),and redescription of the little-known species Bufo stuarti Smith 1929. Proceedings ofthe California Academy of Sciences 54:141-153.ESSAY 7.5. AMPHIBIANS OF BORNEOBorneo, the world’s third largest island, straddles the equator and until relativelyrecently was entirely covered in tropical forests. Given this favorableenvironment, it is not surprising that Borneo is one of the global hot spotsfor frogs. No fewer than 148 species are now known from Borneo (Inger andStuebing 2005) and new species continue to be discovered. Most explorationsof this rich fauna have concentrated on the Malaysian portions of the island,Sarawak and Sabah. Relatively little work has been carried out in Kalimantan,which occupies roughly two-thirds of the land mass.This rich fauna is diverse taxonomically and consists of species in sixfamilies, most of which are also very rich in species in the adjacent landmasses of Sumatra and the Malay Peninsula. These frogs vary in size fromthe tiny Microhyla perparva (NT) at 15mm to the giant Bufo juxtasper (LC) at215mm in body length. The fauna is also ecologically diverse, demonstratingalmost all the modes of life that frogs are capable of, from species thatburrow (e.g., Calluella smithi DD), to those that live mostly high in trees (e.g.,Rhacophorus pardalis LC).The breeding habits of the Bornean species also cover almost the entirerange of variation known for frogs (Inger and Tan 1996). Most species deposittheir eggs in the water of ponds or streams, but a few lay their eggs in watercontainingtree holes (e.g., Metaphrynella sundana LC). Some even lay theireggs under leaf litter on the forest floor (e.g., Limnonectes palavanensis LC),where they are guarded by the male who later transports the small tadpoleson his back to a small rain pool on the forest floor. Tadpoles vary also in shapeand size (Inger 2005). Those that develop in ponds, such as the tadpoles ofPolypedates otilophus (LC), have fat, almost spherical bodies and are large(up to about 65mm), while those that develop in streams tend to have moreslender bodies. The tadpoles of the Slender Litter Frogs (genus Leptolalax)have very lithe bodies and wriggle into the crevices between the rocks liningthe bottoms of the swift streams in which they live. Some tadpoles, forexample, those of the Torrent Frogs (genus Meristogenys), live in rapids andhave a large sucker on the underside that enables them to cling to rocks in thestrongest currents. There are also a few kinds of small tadpoles, like those ofthe Sticky Frogs (genus Kalophrynus) that do not feed, but subsist through theirshort developmental periods on the store of yolk in the eggs. These tadpolesare usually found in very small, shallow pools of rain water, sometimes thosethat form in rotting logs. There is also a group of species, the Bush Frogs(genus Philautus) that do not have free-swimming tadpoles. These frogs havevery large (relative to their body size) eggs, rich in yolk, which are usually laidunder the moist leaf litter of the forest floor. The embryo develops within thegelatinous envelope of the egg and hatches out as a tiny froglet.From many points of view this is a rich, very diverse frog fauna. But,because it is a tropical forest fauna, it is at risk because of forest conversionand clearing, primarily due to logging, agriculture and mining. The entire forestA Bornean endemic, Ansonia spinulifer (Near Threatened), is a characteristicspecies reported from lowland localities throughout Borneo from 150-750 masl. © Djoko Iskandarfauna depends on the very high humidities and moderate temperatures createdby the closed canopy of the forest. Nearly one-third of the Bornean frogspecies (29%) – all but one of them known only from Borneo – are listed asthreatened on the IUCN Red List, and all because of serious habitat modification.Although economic development poses a hazard to all of these rainforestfrogs, it is clear that certain ecological or behavioral characteristics put somespecies at particular risk. The frog fauna of Borneo is roughly equally dividedbetween those species that breed in streams (61 of 148 species) and thosethat breed in small bodies of standing water (64 species). However, when oneconsiders only the threatened species, then those that breed in streams (19 of42 species) outnumber those that that breed in standing water (10 species).The majority (14 species) of these threatened stream-breeding amphibianshave tadpoles specialized for living in strong, clear currents.One of the immediate consequences of selective logging, which harvestsonly the largest trees, is stream siltation, which results in the accumulationof a fine layer of silt covering the stream bottom. Forest clearing results in aneven deeper layer of silt. This silt clogs the bottom crevices in which somekinds of tadpoles live (e.g., tadpoles of the genus Leptolalax) and preventsthe growth of rock-clinging algae on which other kinds of tadpoles feed(e.g., tadpoles of the Torrent Frogs, Meristogenys). The result is a sharp,rapid decline in the populations of these two groups of species that breed instreams having clear water and gravel or rock bottoms.Opening of the forest exposes the leaf litter in which many frog species liveto much higher temperatures and lower humidity. The Bush Frogs (Philautus)place their fertilized eggs under dead leaves, which in undisturbed forests,remain continually moist. As soon as the forest is opened, more sunlightreaches the floor raising the temperature and drying out the floor litter. Tenof the 16 Bornean species of Philautus are considered to be threatened.While there has been no direct study of the impact of high temperature andlow humidity on litter-dwelling frogs, the failure to find these species inopen areas, such as surrounding agricultural fields, suggests a direct relationbetween forest clearance and disappearance of these species.Yet some species manage to survive in secondary forests, those forestsfrom which some trees have been removed. Large areas cleared of forest inBorneo have been converted to non-native tree plantations, mostly oil palm,but also Acacia mangium. These tree plantations have some of the physicalcharacteristics of natural forest, such as a closed canopy, reduction in sunlightreaching the floor, and high humidity. If these plantations are adjacent to forest,even secondary forest, it is possible that some rain forest frogs may moveinto and survive in these environments. In fact, an as yet incomplete surveyof the frogs living in Acacia plantings in Sarawak has discovered species offrogs characteristic of rain forests in these exotic environments. At least onethreatened floor-dwelling species, Kalophrynus intermedius (VU), has beenrecorded within an Acacia planting. These particular plantations are adjacentto secondary forests, and this secondary forest is probably the source of theAcacia-dwelling frogs. It may also be significant that pesticides have notbeen broadcast in these plantings, and more investigation of the fauna oftree plantations is needed to determine what portion of the fauna can adjustto living in that kind of exotic environment, and for how long populations canpersist. Until such study is completed, we may not know how grim the futureis for this interesting, unique amphibian fauna.ReferencesRobert F. IngerInger, R.F. 2005. The systematics and zoogeography of the Amphibia of Borneo. NaturalHistory Publications, Kota Kinabalu (reprint), Malaysia.Inger, R.F. and Stuebing, R.B. 2005. A field guide to the frogs of Borneo. 2 nd edn. NaturalHistory Publications, Kota Kinabalu, Malaysia.Inger, R.F. and Tan, F.-L. 1996. The natural history of amphibians and reptiles in Sabah.Natural History Publications, Kota Kinabalu, Malaysia.A calling male tree hole frog Metaphrynella sundana (Least Concern), withthe vocal sac inflated. Some tree holes may be as much as 10 metres or moreabove the ground (©) Björn LardnerLimnonectes rhacoda (Near Threatened) is a lowland rainforest species currently known only from Indonesian Borneo. © Djoko Iskandar
CHAPTER 8. AMPHIBIANS OF THE NEARCTIC REALMDon Church, David M. Green, Geoffrey Hammerson, Joseph Mitchell,Gabriela Parra Olea and Georgina Santos BarreraTHE GEOGRAPHIC AND HUMAN CONTEXTThe Nearctic Realm includes most of mainland North America, south to central Mexico(excluding the Caribbean coast of Mexico, and extreme southern Florida in the UnitedStates). North America currently has a land connection to South America that was formedrelatively recently, beginning in the late Pliocene, some 3.5 Ma. Even earlier in the Permianto early Jurassic Periods, some 285-190 Ma, North America had land connections withEurasia and Africa. Biogeographic relationships between these regions are seen today, forexample, in the presence of giant salamanders in the Appalachians and in China and Japan.The Appalachian Mountains in the eastern United States began to uplift some 680 Ma,when the European and African plates pressed against the east side of the North Americanplate, long before the time when the first amphibians crawled or hopped. These mountainshad eroded almost entirely by the Mesozoic Era, but further uplift during the Cenozoic Eraand subsequent erosion by newly formed rivers and streams shaped the Appalachians aswe know them today. The moist temperate forests that now cover these mountains growon severely eroded remnants of a formerly towering cordillera that was putatively higherthan the Himalaya.The western part of the region is much more mountainous and includes the RockyMountains, the Cascade Range, the Alaskan Range, and many others. The topographicaland geological histories of this region are complex. Three major mountain-building episodesrestructured the topography of the west during the period of about 170 to 40 Ma (Jurassicto Cenozoic Periods). Orogenous uplift continues today in the Cascades and other westernmostranges as seen in modern eruptions of mountain peaks like Mount Saint Helens. TheRockies and the Sierra Madre Mountains in Mexico date from uplifts that occurred duringthe Laramide orogeny some 70-40 Ma in the Palaeocene and Eocene Epochs. The highestpoint in the Nearctic Realm is Mount McKinley in Alaska at 6,194m.During the more recent geological past, as in the Pleistocene, sea levels rose and fellduring several glacial-interglacial episodes. The eastern coastline of North America duringthe last major glacial event (that ended about 10,000 years ago) was as far as 100km east ofits current location and -130m to -180m below current sea level. The Coastal Plain terracesare the result of previous sea level rise and fall events. Glacial and interglacial episodes inthe Pleistocene had dramatic effects on the flora and fauna in most of North America withmajor latitudinal and elevational shifts in ranges of entire communities and ecosystems (Flint1971). Many of the current distributions of amphibians in the Nearctic are the result of thesehistorical events. Many amphibians that now range northward to New York or nearly so, forexample, expanded their ranges up the Coastal Plain following glacial retreat.Boreal coniferous forests dominate the northern part of the region through Alaska andCanada, although high-elevation mountains such as in the southern Appalachians and theRocky Mountains also support such forests. The eastern part of the region was originallycovered with mixed and broad-leaved forests after the Pleistocene glaciations, giving wayto vast grasslands in the central part of the continent east of the Rockies. The south-easternportion of the Nearctic Realm was dominated by pine forests after the last glaciation some10,000 years ago. In keeping with the topography, habitats are much more complex in thewest, ranging from hot deserts, to sagebrush, Mediterranean-type chaparral, montaneconiferous forests, alpine tundra, and extremely wet temperate rainforests in the PacificNorthwest. The Mexican portion of the Nearctic Realm supports desert and desert grasslandbetween the Sierra Madre Oriental and the Sierra Madre Occidental. High mountains inthese regions support xeric oak and pine vegetation. Descriptions of biotic communities,vegetation, and ecoregions in the Nearctic Realm are in Scott (1995), Brown et al. (1998),Ricketts et al. (1999), and Barbour and Billings (2000), among others.Compared with other parts of the world, the Nearctic Realm has a low human populationdensity (approximately 15 people per square km in 2005), only 23% of which lives in ruralareas, and a low population growth rate (1.2% per annum), which is gradually decreasing.The human population is distributed very unevenly, with high concentrations in southernCanada, on the Coastal Plain and Piedmont in the eastern and north-eastern United States,and in California and Florida. Gross income per capita in the United States and Canada wasover US$38,000 in 2004, but the southern part of the region in northern Mexico is poorer,with a gross income per capita of less than US$10,000 in 2004. The high wealth of muchof the region helps to explain why damage to natural ecosystems has been extensive inrelation to the low human population density; due to large-scale agriculture, urbanization,roads, wetland loss. Economic growth rates in the region have been relatively high (3.5%in 2005), especially for a wealthy region.The human impact on Nearctic ecosystems varies greatly through the region. Therehave been high levels of anthropogenic disturbance over the last 300 years, with veryextensive forest loss in the eastern and southern United States and conversion of theformerly extensive grasslands to commercial agriculture in the centre of the country. Overthe last century, there has been some forest regeneration in parts of the east, although thisregrowth has recently been targeted for much timber harvesting. Damage to ecosystemshas been as severe in the drier west due to timbering and cattle grazing. The coniferousstands in the northern boreal zone were relatively untouched until recently. Urbanization andsuburbanization are expanding rapidly in all cities and towns and contributes substantiallyto habitat loss. Pollution of rivers, streams and lakes is a problem in many areas of theNearctic, and approximately 40% of these in the United States are classified by the UnitedStates Environmental Protection agency as polluted. Freshwater wetland loss has been high(Fretwell et al. 1996) because of land conversion to urbanization and agriculture. Overviewsof threats to and losses of animals, habitats, and ecosytems in North America are in LaRoeet al. (1995) and Noss et al. (1995).GLOBAL CONSERVATION STATUSA total of 83 species (24%) of the 337 amphibian species in the Nearctic Realm is consideredto be globally threatened or Extinct (Figure 1). This is significantly less than the globalaverage of 33% 1 , but very similar to the situation in the Palaearctic. The Nearctic Realmcontains 4% of all globally threatened amphibians. It accounts for only 2% of CR speciesand 3% of the EN species, but 7% of the VU species. Hence, threatened Nearctic amphibiansare more likely to be in a lower category of threat, when compared with the globaldistribution of threatened species amongst categories. The percentage of DD species, 7%(25 species), is also less than the global average of 23%. This result is not surprising forsuch a well-surveyed region.Two of the world’s 34 known amphibian extinctions have occurred in this region, namelythe Vegas Valley Leopard Frog Rana fisheri and the poorly known Catahoula SalamanderPlethodon ainsworthi in Mississippi. In addition, the only amphibian in the world currentlylisted as Extinct in the Wild with only captive populations in existence, the Wyoming ToadBufo baxteri, is also found here. Three Critically Endangered species in the Nearctic Realmare also considered possibly extinct: Tlaloc’s Leopard Frog Rana tlaloci from the MexicanPlateau, the Bigfoot Splayfoot Salamander Chiropterotriton magnipes 2 from San Luis Potosiand Queretaro, Mexico, and the Cave Splayfoot Salamander Chiropterotriton mosaueri fromnorthern Hidalgo, Mexico (the first two of these also occur in the Neotropical Region). Thesetaxa represent 2.3% of the 130 possibly extinct species in the world. There is little in theway of overall discernible pattern in Nearctic amphibian extinctions thus far.SPECIES RICHNESS AND ENDEMISMSpecies Richness and Endemism Across TaxaThe 337 native amphibian species in the Nearctic Realm represent 6% of the currentlyknown global total of 5,915 species. Of these 337 species, 230 (or 68%) are endemic to theNearctic (Table 1). Both salamanders and frogs occur in the region, but no caecilians. Unlikethe situations in all other major biogeographic realms, there are more species of salamanders(Caudata) than frogs and toads (Anura), the former accounting for 58% of the species inthe Nearctic. Endemism is also much higher in the salamanders (89%), as compared withfrogs and toads (39%). This presumably reflects a more fine-grained pattern of isolationand speciation, and accordingly generally much smaller range sizes, among salamandersin the Appalachian Mountains in the east and Sierra Nevada Mountains in the west. Of the17 families that are native to the region, only three of them are endemic (Table 1). Only 10species (3%) are members of these endemic families, but this low percentage is a reflectionof the fact that several families occur only marginally in other regions.Under current climatic conditions, there is less isolation between the Nearctic andNeotropical Realms than there is between the Afrotropical and Palaearctic Realms, andthere are points of contact between the two faunas along the Caribbean coast of Mexicoand in Florida (although the transvolcanic belt in central Mexico does form a barrier to faunaldispersal). The result of this indistinct boundary is to reduce the level of endemism of bothregions. The families Scaphiopodidae, Ambystomatidae, Amphiumidae, and Sirenidae arenearly endemic to the Nearctic, and Leptodactylidae and Rhinophrynidae are almost endemicto the Neotropics. Proteidae is also overwhelmingly Nearctic with just one species in thePalearctic. Duellman and Sweet (1999), Green (1997) and Lannoo (2005) provide summariesof the amphibian fauna of the Nearctic.Of the 51 genera (11% of the global total) that occur in the region, 22 (33%) are alsoendemic. Endemism at the generic level is much higher among the salamanders (67%) thanit is among frogs and toads (4.2%), a pattern mirrored in the Palaearctic. The most speciosegenera in the region are Plethodon (48 species), Rana (38 species), Bufo (28 species), Eurycea(24 species), and Ambystoma (21 species). At the opposite end of the spectrum, there arenine monotypic genera endemic to the Nearctic Realm, eight of which are salamandersand seven of which are in the family Plethodontidae. The 32 non-endemic genera in theNearctic include 23 frog genera (13 genera in Hylidae, three in Leptodactylidae, two each inMicrohylidae and Scaphiopodidae, and one each in Bufonidae, Ranidae and Rhinophrynidae)and nine salamander genera (four in Plethodontidae, two in Sirenidae, and one each inAmbystomatidae, Amphiumidae, and Salamandridae). These non-endemics include thewidespread genera Bufo and Rana.FamilyNative species(endemics toregion)Percentage of Percentage ofspecies in region species in familythat are endemic that are endemicto regionNative genera(endemicsto region)Figure 1. Summary of Red List categoriesfor amphibians in the Nearctic Realm. Thepercentage of species in each category isalso given.Red List Category Number of speciesExtinct (EX) 2Extinct in the Wild (EW) 1Critically Endangered (CR) 10Endangered (EN) 24Vulnerable (VU) 46Near Threatened (NT) 40Least Concern (LC) 189Data Deficient (DD) 25Total Number of Species 3377% 1% 3%The Lesser Siren Siren intermedia (LeastConcern) is one of the four species of siren inthe family Sirenidae, a group of highly aquaticsalamanders with small front legs and no backlegs. It ranges from the south-eastern UnitedStates to north-eastern Mexico, and livesin shallow water with abundant vegetation(burrowing into the bottom mud if the waterdries up). © Michael GrazianoTable 1. The number of Nearctic amphibians ineach taxonomic Family present in the region.Percentage ofgenera in regionthat are endemicPercentage ofgenera in familythat are endemicto regionAnuraAscaphidae 2 (2) 100 100 1 (1) 100 100Bufonidae 28 (12) 43 3 1 (0) 0 0Hylidae 39 (14) 36 2 13 (0) 0 0Leptodactylidae 23 (3) 13 0.2 3 (0) 0 0Microhylidae 4 (0) 0 0 2 (0) 0 0Ranidae 38 (21) 55 3 1 (0) 0 0Rhinophrynidae 1 (0) 0 0 1 (0) 0 0Scaphiopodidae 7 (4) 57 57 2 (0) 0 0TOTAL ANURA 142 (56) 39 1 24 (1) 4 0.3CaudataAmbystomatidae 21 (16) 76 53 1 (0) 0 0Amphiumidae 3 (2) 67 67 1 (0) 0 0Cryptobranchidae 1 (1) 100 33 1 (1) 100 50Dicamptodontidae 4 (4) 100 100 1 (1) 100 100Plethodontidae 147 (136) 93 37 17 (13) 76 45Proteidae 5 (5) 100 83 1 (1) 100 50Rhyacotritonidae 4 (4) 100 100 1 (1) 100 100Salamandridae 6 (4) 67 6 2 (1) 50 6Sirenidae 4 (2) 50 50 2 (0) 0 0TOTAL CAUDATA 195 (174) 89 33 27 (18) 67 29TOTAL ALL AMPHIBIANS 337 (230) 68 4 51 (19) 37 456%7%14%12%
86Threatened <strong>Amphibian</strong>s of the WorldThe Marbled Salamander Ambystoma opacum(Least Concern) occurs in the eastern UnitedStates in various wooded habitats, in the vicinityof swamps and vernal pools. For most ofthe year the adults are subterranean in rodenttunnels, but in the autumn they congregate,sometimes in large numbers as shown here, tolay eggs in forest depressions such as vernalpool basins. © Don ChurchThe Wood Frog Rana sylvatica (Least Concern)ranges farther north than any otherNorth American amphibian. It is abundantand widespread, and occurs in various kindsof forest and woodland habitats, and alsowillow thickets and grass/willow/aspenassociations. The eggs are laid, and larvaedevelop, usually in small fish-free pondsin wooded or, sometimes, open areas.© Don ChurchTable 2. The number of species within eachIUCN Red List Category in each Family andOrder in the Nearctic Realm. Introduced speciesare not included.As noted already, 17 of the world’s 48 amphibian families (35%) occur in the Nearctic, withthree endemic: Ascaphidae, Dicamptodontidae and Rhyacotritonidae 3 . The characteristicsof these families are provided in Chapter 1.Among the non-endemic families, the majority of Nearctic species are in the Bufonidae,Hylidae, Leptodactylidae, Ranidae, Ambystomatidae and Plethodontidae. Of the NearcticBufonidae, all 28 species are in the widespread genus Bufo 4 . This family occurs through mostof the region, and 16 species (57%) are shared with the Neotropics. All Nearctic specieshave free-living aquatic larvae.There are 39 species of Hylidae in the Nearctic currently placed in 13 genera (Faivovichet al. 2005). This family is also very widespread within the region; 25 species (64%) rangeinto the Neotropics. Within this region, these species include treefrogs, chorus frogs andcricket frogs, and are associated with many different habitats. All Nearctic species havefree-living aquatic larvae.Although the family Leptodactylidae is almost endemic to the Neotropics, 23 speciesoccur in the Nearctic in Mexico, and some range into the southern United States. Theseinclude representatives of the genera Eleutherodactylus and Craugastor, which breed bydirect development on land, and Leptodactylus, which have free-living aquatic larvae. 5All of the Nearctic Ranidae are in the genus Rana 6 , The family is very widespread inthe region, occurring in most aquatic and wetland habitats, and all members in the regionhave free-living aquatic larvae.The mole salamanders (Ambystomatidae) are mainly a Nearctic family, with 21 species(70% of the global total) occurring in the region, 16 of which are endemic. The species aremainly subterranean as adults and juveniles, with aquatic larvae that develop mainly intemporary pools and occasionally in streams.The Plethodontidae (lungless salamanders) is by far the largest family in the Nearctic,with 147 species (40% of the global total), of which 136 are endemic. The family includesboth direct-developing species, which breed terrestrially with no association with water(for example, Plethodon, Aneides, and Batrachoseps), and aquatic larval developing species,typically associated with streams (for example, Desmognathus and Eurycea). Although thefamily is widespread through much of the region (but avoiding highest latitudes), it reachesextraordinary diversity in the southern Appalachians (see Essay 8.1). Most species in thisfamily are strongly tied to forest habitats (though some, especially in the genus Eurycea,live in caves).As home to four small salamander families that occur mainly in the eastern United States,the Nearctic contributes uniquely to global amphibian diversity. Both the Amphiumidae(amphiumas) and Sirenidae (sirens) occur largely on the Coastal Plain of the eastern andsouthern United States (ranging only marginally into the Neotropics). The Cryptobranchidae(giant salamanders) has one species in the Nearctic (the Hellbender Cryptobranchus alleganiensis;NT); two others are in East Asia. The Proteidae (mudpuppies and waterdogs) hasfive species in the Nearctic (all in the eastern United States), with one species in Europe.Family EX EW CR EN VU NT LC DD Total number Number Threatened % Threatenedof species or Extinct or ExtinctAnuraAscaphidae 0 0 0 0 0 0 2 0 2 0 0Bufonidae 0 1 0 4 1 2 20 0 28 6 21Hylidae 0 0 0 2 1 2 34 0 39 3 8Leptodactylidae 0 0 1 2 5 1 9 5 23 8 35Microhylidae 0 0 0 0 0 0 4 0 4 0 0Ranidae 1 0 4 1 5 5 20 2 38 11 29Rhinophrynidae 0 0 0 0 0 0 1 0 1 0 0Scaphiopodidae 0 0 0 0 0 1 6 0 7 0 0TOTAL ANURA 1 1 5 9 12 11 96 7 142 28 20CaudataAmbystomatidae 0 0 3 1 2 1 13 1 21 6 29Amphiumidae 0 0 0 0 0 1 2 0 3 0 0Cryptobranchidae 0 0 0 0 0 1 0 0 1 0 0Dicamptodontidae 0 0 0 0 0 1 3 0 4 0 0Plethodontidae 1 0 2 12 31 21 63 17 147 46 31Proteidae 0 0 0 1 0 1 3 0 5 1 20Rhyacotritonidae 0 0 0 0 1 2 1 0 4 1 25Salamandridae 0 0 0 1 0 1 4 0 6 1 17Sirenidae 0 0 0 0 0 0 4 0 4 0 0TOTAL CAUDATA 1 0 5 15 34 29 93 18 195 55 28TOTAL ALL AMPHIBIANS 2 1 10 24 46 40 189 25 337 83 24Figure 2. The species richness of amphibians in the Nearctic Realm, with darker colourscorresponding to regions of higher richness. Colour scale based on 10 quantile classes;maximum richness equals 52 species.The members of all four families are mainly large salamanders that are completely aquaticas both larvae and adults.The Rhyacotritonidae (torrent salamanders) and Dicamptodontidae (Pacific giantsalamanders) are wholly restricted to the Pacific north-west. Members of both families areinhabitants of coldwater mountain streams.The small frog family Scaphiopodidae (American spadefoots), with just seven species,occurs mainly in the Nearctic, but three of the species also range into the Neotropics. Theremaining families include the Microhylidae (globally widespread, with just four speciesin the region, none of which are endemic), the primitive Rhinophrynidae (which marginallyranges into the region), and the Salamandridae (mainly a Palaearctic family, with six speciesin the region).The threatened and extinct species in the Nearctic are overwhelmingly in the Plethodontidae(46, 84% of the total in the region; Table 2). This is a reflection of the many specieswith small ranges that occur in mountainous regions (especially in the Appalachians and inMexico), where they are threatened in many places by forest loss. Nearly one-third (31%) ofthe lungless salamanders in the region are globally threatened or extinct. There is also a highpercentage of threatened species (29%) among the mole salamanders (Ambystomatidae),which are also threatened mainly by habitat loss.Most threatened frog species occur in the larger families, namely Bufonidae, Leptodactylidae,and Ranidae (Table 2). The threatened toads (Bufonidae) occur mainly in thewestern United States, where they have been impacted by habitat degradation, and insome cases by introduced bullfrogs (Rana catesbeiana) and the disease chytridiomycosis.The eight threatened species of Leptodactylidae are all Mexican endemics threatened byhabitat loss (and perhaps, in a few cases, by chytridiomycosis). The threatened Nearcticspecies in the Ranidae range widely in Mexico and the western and southern UnitedStates. As with the other families, they are impacted by habitat loss and chytridiomycosis,but invasive species and water pollution have also been detrimental. It is noteworthy thatthe percentage of threatened treefrogs (Hylidae) in the region is much lower than for theother large families.The great majority (88%) of the threatened amphibians in the Nearctic are in the Endangeredand Vulnerable categories. The generally low number of Critically Endangered speciesmasks some important family-level differences, with 14% of the Nearctic Ambystomatidae,and 11% of the Nearctic Ranidae falling into this category.Geographic Patterns of Species Richnessand EndemismOverall species richness of amphibians in the Nearctic Realm (Figure 2) is highest in thesoutheastern United States, especially on the Coastal Plain and in the Appalachian Mountains.Species richness is low in the drier parts of northern Mexico, through much of thecentral and western United States (although there are more species in moist areas alongthe northwest Pacific coast), and in Canada. The Nearctic Realm is well studied, and Figure2 probably reflects genuine patterns of amphibian species richness.Concentrations of threatened species (Figure 3a) in the Nearctic are less marked than inmany tropical regions. Nevertheless, there are some notable concentrations in the southernAppalachians (centred on the Great Smoky Mountains), the mountains of northern Mexico,along the Edwards Plateau in Texas, and in the mountains of California. These geographicconcentrations generally reflect the topographically diverse montane parts of the region whereamphibians have naturally small ranges and where habitat destruction is ongoing. The Texanconcentration largely reflects subterranean salamanders in the genus Eurycea and blind speciesin the genus Typhlomolge. Not surprisingly, given the small number of species involved,there are no noteworthy concentrations of Critically Endangered species in the region, withthe exception perhaps of the California floristic region (see Essay 8.2) (Figure 3b).Species Richness and Endemism within CountriesAlthough Mexico as a whole has more amphibian species than the United States, withinthe Nearctic Realm the United States has more than double the number of species (261species vs. 116) (Figure 4). Species richness in Canada is low, with just 45 species.The amphibian fauna in Mexico is less well known than that of either the UnitedStates or Canada, although the Nearctic parts of Mexico are probably better surveyedthan the more diverse Neotropical areas to the south. The Mexican amphibian faunais not well summarized in review literature other than in Flores-Villela (1993) andFlores-Villela et al. (1995). However, there are some recent regional publications fromnorthern Mexico (Lemos-Espinal et al. 2004; Vazquez-Díaz and Quintero-Díaz 2005). The
Chapter 8. <strong>Amphibian</strong>s of the Nearctic Realm 87Figure 3. a) The richness of threatened amphibiansin the Nearctic Realm, with darkercolours corresponding to regions of higherrichness. Maximum richness equals four species.b) The richness of CR amphibians in theNearctic Realm. Maximum richness equalsone species.a. b.United Statesof America*United Statesof America*United Statesof America*Mexico*Mexico*Mexico*Mexico*United Statesof America*CanadaCanadaCanadaCanada0 50 100 150 200 250 3000 20 40 60 800 10 20 30 40 50 600 5 10 15 20 25 30Number of speciesPercentage of endemic speciesNumber of threatened speciesPercentage of species threatenedFigure 4 Endemics Non-endemicsFigure 5 Figure 6 Endemics Non-endemicsFigure 7amphibians of the United States and Canada are amongst the best known in the world,with a very extensive review literature and many books, including Green (1997), Harding(1997), Conant and Collins (1998), Petranka (1998), Stebbins (2003), and Lannoo (1998,2005). Summaries of the amphibian fauna of the Nearctic are provided by Duellmanand Sweet (1999) and Lannoo (2005). There are numerous State and Province levelsummaries of the amphibian fauna, such as Stebbins (1972), Mount (1975), Martofet al. (1980), Nussbaum et al. (1983), Green and Pauley (1987), Dundee and Rossman(1989), Klemens (1993), Leonard et al. (1993), Russell and Bauer (1993), Degenhardt etal. (1996), Weller and Green (1997), Bartlett and Bartlett (1999), Hammerson (1999),Hunter et al. (1999), Dixon (2000), Johnson (2000), Hulse et al. (2001), Minton (2001),MacCulloch (2002), Dodd (2004), Trauth et al. (2004), Werner et al. (2004), Corkran andThoms (2006) and Matsuda et al. (2006).The United States has far more endemic Nearctic species (182) than the other twocountries in the Nearctic (Figure 4). Mexico has 68 endemic Nearctic species, but thereare no endemic amphibians in Canada. In the United States, 70% of the Nearctic speciesare endemic, compared with 59% in Mexico (Figure 5).Only one globally threatened amphibian species occurs in Canada, compared with 31in Mexico and 52 in the United States (Figure 6). The percentage of threatened amphibianspecies is highest in Mexico (27%) compared with the United States (20%) (Figure 7). Inboth cases, this level of threat is lower than the global average of 33%.Assessments of the conservation status of Nearctic amphibians at the national levelhave been carried out by NatureServe (e.g., Stein et al. 2000), since updated as part of theGlobal <strong>Amphibian</strong> Assessment (Young et al. 2004). There are also official governmentalthreatened species listing processes in Canada (http://www.cosewic.gc.ca/index.htm) andin the United States (http://www.fws.gov/Endangered/esa.html). An official Mexican redlist of amphibians is in preparation (the draft is on http://www.semarnat.gob.mx/leyesynormas/Normas%20Oficiales%20Mexicanas%20vigentes/NOM-ECOL-059-2001.pdf).The proportion of Critically Endangered Nearctic species is highest in Mexico (6%),being 1% in the United States, and zero in Canada. This reflects the generally poorconservation situation for amphibians in Mexico (see Neotropical section). However,the only Extinct and Extinct in the Wild species in the region are in the United States,although, as mentioned above, two of the Critically Endangered species in Mexico arepossibly extinct.HABITAT AND ECOLOGYHabitat PreferencesMost Nearctic amphibians (79%) occur in forests; only 17% of which can survive in secondaryterrestrial habitats (Table 3; Figure 8). As in other regions, forest-dwelling and stream-associatedamphibians are more likely to be threatened than are those occurring in any otherhabitats, with nearly 20% of species being globally threatened. This combination of habitatpreferences is associated with rapid declines in amphibian populations worldwide (Stuartet al. 2004). <strong>Amphibian</strong>s occurring in savannahs, marshes and swamps, arid and semi-aridhabitats, and secondary terrestrial habitats are less likely to be threatened than thoseoccurring in these other habitats (Table 3; Figure 8).Reproductive ModesLarval development is the most common reproductive mode in the Nearctic (65% of species),compared with 35% for direct development and no live-bearing species (Table 4; this compareswith the global picture of 68% larval development, 30% direct development, and 1% live-bearing).The Nearctic amphibians clearly have a larger proportion of direct-developing species than theglobal average. Most of the direct-developing Nearctic amphibians are plethodontid salamanders,especially in the genera Plethodon (48 species), Batrachoseps (19), Chiropterotriton (10), and Pseudoeuryceaand Aneides (both 6). The other concentration of direct-developing frogs in the region isamong the leptodactylid frogs in the genus Eleutherodactylus (12 species) and Craugastor (9).In the Nearctic, the percentage of globally threatened or Extinct direct-developingamphibians is much higher than for larval-developing species (33% as apposed to 20%).As in other regions, this is probably because direct-developing species have smaller rangeson average, and are therefore more seriously affected by habitat loss.MAJOR THREATSAs in other parts of the world, habitat loss is overwhelmingly the major threat to amphibiansin the Nearctic Realm (Table 5; Figure 9), affecting nearly 80% of the threatened species.Figure 4. The number of amphibians presentin and endemic to each Nearctic country.*denotes countries not entirely within theNearctic Realm, hence only the species whoseranges fall within the region are included.Figure 5. Percentage of species endemic toeach Nearctic country. *denotes countriesnot entirely within the Nearctic Realm, henceonly the species whose ranges fall within theregion are included.Figure 6. The number of threatened amphibianspresent in and endemic to each Nearcticcountry. *denotes countries not entirelywithin the Nearctic Realm, hence only thespecies whose ranges fall within the regionare included.Figure 7. Percentage of native speciesthat are threatened. *denotes countries notentirely within the Nearctic Realm, henceonly the species whose ranges fall within theregion are included.Habitat typeNumberof species ineach habitat% of allspeciesoccurringin the habitatThreatenedand Extinctspecies% of speciesoccurringin habitat thatare Threatenedor ExtinctForest 266 79 51 19Savannah 10 3 0 0Grassland 70 21 10 14Shrubland 77 23 8 10Secondary terrestrial habitats 56 17 5 9Flowing freshwater 169 50 32 19Marsh/swamp 87 26 8 9Still open freshwater 141 42 16 11Arid and semi-arid habitats 21 6 2 10Number of speciesForestSavannahGrasslandShrublandSecondary terrestrial habitatsFlowing freshwaterMarsh/swampStill open freshwaterArid and semi-arid habitats0 50 100 150 200 250% of species in habitat that are threatened0 5 10 15 20Table 3. The habitat preferences of amphibiansin the Nearctic Realm.Figure 8. The habitat preferences of Nearcticamphibians. The plot on the left-hand sideshows the number of species in the regionin each habitat type. On the right-hand side,the percentage of these species which arethreatened is given.
88Threatened <strong>Amphibian</strong>s of the WorldThe Columbia Torrent Salamander Rhyacotritonkezeri (Near Threatened) is restricted to asmall area in the Coastal Ranges of Oregonand Washington in the United States. It isone of only four torrent salamander species inthe Family Rhyacotritonidae, which is endemicto the Pacific Northwest. All the species arestrictly associated with streams in forest.© Henk WallaysCouch’s Spadefoot Scaphiopus couchii (LeastConcern) occurs in northern Mexico and thesouth-western United States in arid and semiaridshrublands, short grass plains, mesquitesavannah, creosote bush desert and cultivatedareas. It burrows underground or occupiesrodent burrows when inactive, but emerges tobreed explosively when temporary pools areformed by the rain. © Twan LeendersReproductive mode All species Threatened orExtinct speciesTable 4. Nearctic amphibians categorized by reproductive mode.% Threatenedor ExtinctDirect development 118 39 35Larval development 219 44 65Live-bearing 0 0 -Not known 0 0 -Threat type Threatened species % Threatened speciesAll habitat loss 63 79Agriculture – Crops 23 29Agriculture – Tree plantations 12 15Agriculture – Livestock 11 14Timber and other vegetation removal 39 49Urbanization and industrial development 31 39Invasive species 17 21Utilization 6 8Accidental mortality 6 8Persecution 1 1Pollution 27 34Natural disasters 9 11Disease 14 18Human disturbance 12 15Changes in native species dynamics1 1(excluding disease)Fire 13 16Table 5. The major threats to globally threatened amphibians in the Nearctic Realm. Onlypresent threats to species are tallied.All habitat lossInvasive speciesUtilizationAccidental mortalityPersecutionPollutionNatural disastersDiseaseHuman disturbanceChanges in native sp. dynamicsFire0 20 40 60 80 100Percentage of threatened species affectedFigure 9. The major threats impacting threatened amphibians in the Nearctic Realm.Pollution is the next most serious threat, affecting one-third of the threatened species.Invasive and introduced species, disease, human disturbance, and fire also have significantimpacts on certain species. Most other threats are of relatively minor importance. Althoughchytridiomycosis has been recorded widely in the region (e.g., Fellers et al. 2001; Bradley etal. 2002), and is associated with some serious declines, its overall impacts still seem to beless than in the Neotropics. However, there have been some reports of crashes in amphibianpopulations in North America (e.g., Kagarise Sherman and Morton 1993; Drost and Fellers1996) that could well be attributable to chytridiomycosis. Ongoing research may show thatthis fungal disease is a greater threat than current documentation indicates.Of the types of habitat loss impacting amphibians in the Nearctic, the impacts of vegetationremoval, mainly via logging (which affects nearly half of the threatened species),and urbanization and industrial development (nearly 40%) are the most severe, followedby expanding croplands (nearly 30%) (Table 5). Tree plantations and livestock are lessimportant threats in most cases.A total of 31 species (only nine of which are threatened) are recorded as being usedfor some or other purpose in the region (Table 6). The most common reasons for harvestingNearctic amphibians are for the pet trade and human consumption. Much of the harvestingof amphibians in the region is not considered to constitute a major threat to the species.Of the 31 species being harvested, utilization is considered to be a threat for just 14 (ofwhich only six are threatened species for which harvesting is believed to be contributingto deterioration in their status, most prominently the Critically Endangered AxolotlAmbystoma mexicanum).POPULATION STATUS AND TRENDSEstimates of Population TrendsRoughly half of Nearctic amphibian species are believed to have stable populations whereasnearly one-third are thought to be decreasing (Table 7). The population trend is unknown fora substantial percentage of species. For the majority of species, these trends are inferredfrom trends in the state of the habitats on which the species depend (although in a few casespopulation declines and increases have been noted). Species with decreasing populationsare typically forest-dependent species that can tolerate little disturbance to their habitats.Overall trends for Nearctic amphibians reflect a healthier situation than is the case globallywhere 43% are decreasing and only 27% are stable. In both cases, however, the percentageof increasing species is very small.“Rapidly Declining” SpeciesOf the 470 globally “rapidly declining” species, only 24 (5%) occur within the NearcticRealm (a full list of all “rapidly declining” species is provided in Appendix IV and includestheir occurrence within each of the realms). One of these 24 species, Rana megapoda, isin decline due to over-exploitation, 14 due to reduced habitat, and nine due to so-called“enigmatic declines” (now generally attributed to the synergistic effects of chytridiomycosisand climate change (Lips et al. 2006; Pounds et al. 2006)).The “rapidly declining” species show a distinct taxonomic pattern (Table 8). Among thelarger families, the Ranidae and Bufonidae show by far the highest percentages of speciesin serious decline and in “enigmatic decline”. There are no Nearctic species in seriousdecline in the Hylidae, and the percentages are also low in the Leptodactylidae and thePlethodontidae. Some small families have high percentages of species in serious decline,most notably the Proteidae, Salamandridae and Scaphiopodidae. The relatively smallnumber of “rapid declines” in the Nearctic are widely scattered across the region withoutany clear geographic pattern.KEY FINDINGS• A total of 337 species are recorded from the Nearctic Realm, of which 80 (24%) areconsidered threatened.• The Nearctic is the only region of the world in which salamanders outnumber frogs (195as opposed to 142 species).• At the species level, 230 amphibians (68% of those present) are endemic to the Nearctic;of the 17 families found in the region, three are endemic, and of 51 amphibian generaoccurring, 19 are endemic. Endemism is lower in the Nearctic than in some other regions,especially due to the unclear and somewhat arbitrary boundary with the Neotropics inseveral places.• The percentage of threatened or Extinct species is lower than in many other parts ofthe world, but highest in the families Leptodactylidae (35%), Plethodontidae (31%),Ranidae (29%), Ambystomatidae (29%), Rhyacotritonidae (25%), Bufonidae (21%), andSalamandridae (17%).• Geographic concentrations of threatened species in the Nearctic are less marked thanin many tropical regions, but there are some notable concentrations in the southern Appalachians(centred on the Great Smoky Mountains), the mountains of northern Mexico,the Edwards Plateau in Texas, and the mountains of California.• The United States has the largest number of species in the Nearctic Realm (261 species),and also has more endemics (182). Mexico has 68 species endemic to the Nearctic,whereas Canada has none.• The United States has the largest number of threatened species (52), followed by Mexico(31). However, the percentage of threatened species is higher in Mexico (27% versus20%).• Threatened species tend to show distinct habitat preferences, with forest-dwelling andstream-associated species being the most threatened (19% and 19%, respectively). Thispattern is mirrored elsewhere in the world.• Habitat loss, primarily due to vegetation removal (mainly logging), urbanization/industrialdevelopment, and expanding croplands is affecting almost 80% of the threatenedspecies in the region. Pollution impacts over one-third, and invasive species over 20%,of the threatened species. Disease (usually chytridiomycosis) is negatively affecting18% of globally threatened species in the region, but is implicated in 38% of the rapiddeclines.• Only 5% of the 470 globally “rapidly declining” species occur within the region. Mostof these rapid declines (58%) are caused by severe habitat loss, but chytridiomycosis isa growing concern.• Two amphibian extinctions have been recorded from the Nearctic, and one species isExtinct in the Wild, all of these being from the United States. A further two species arepossibly extinct (both from Mexico).
Chapter 8. <strong>Amphibian</strong>s of the Nearctic Realm 89REFERENCESAbell, R.A., Olson, D.M., Dinerstein, E., Hurley, P.T., Diggs, J.T., Eichbaum, W., Walters, S., Wettengel, W.,Allnutt, T., Jacobs, C.T. and Hedao, P.. 2000. Freshwater Ecosystems of North America, A ConservationAssessment. Island Press, Washington, D.C., USA.Barbour, M.G. and Billings, W.D. (eds.). 2000. North American Terrestrial Vegetation. Cambridge UniversityPress, Cambridge, United Kingdom.Bartlett, R.D. and Bartlett, P.P. 1999. A Field Guide to Florida Reptiles and <strong>Amphibian</strong>s. Gulf PublishingCompany, Houston, Texas, USA.Bradley, G.A., Rosen, P.C., Sredl, M.J., Jones, T.R. and Longcore, J.E. 2002. Chytridiomycosis in nativeArizona frogs. Journal of Wildlife Diseases 38:206-212.Brown, D.E., Reichenbacher, F. and Franson, S.E. 1998. A Classification of North American Biotic Communities.University of Utah Press, Salt Lake City, Utah, USA.Conant, R. and Collins, J.T. 1998. A Field Guide to the <strong>Amphibian</strong>s and Reptiles: Eastern and CentralNorth America. Third edition, expanded. Houghton Mifflin Company, Boston, Massachusetts,USA.Corkran, C.C. and Thoms, C. 2006. <strong>Amphibian</strong>s of Oregon, Washington and British Columbia. Revised andupdated edition. Lone Pine Publishing, Edmonton, Alberta, Canada.Degenhardt, W.G., Painter, C.W. and Price, A.H. 1996. <strong>Amphibian</strong>s and Reptiles of New Mexico. Universityof New Mexico Press, Albuquerque, New Mexico, USA.Dixon, J.R. 2000. <strong>Amphibian</strong>s and Reptiles of Texas. Second edition. Texas A & M University Press, CollegeStation, Texas, USA.Dodd, C.K., Jr. 2004. The <strong>Amphibian</strong>s of Great Smoky Mountains National Park. University of TennesseePress, Knoxville, Tennessee, USA.Drost, C.A. and Fellers, G.M. 1996. Collapse of a regional frog fauna in the Yosemite area of the CaliforniaSierra Nevada, USA. Conservation Biology 10:414-425.Duellman, W.E., and Sweet, S.S. 1999. Distribution patterns of amphibians in the Nearctic region of NorthAmerica. In: W.E. Duellman (ed.), Patterns of Distribution of <strong>Amphibian</strong>s: A Global Perspective, pp.31-109, Johns Hopkins University Press, Baltimore, Maryland, USA.Dundee, H.A. and Rossman, D.A. 1989. The <strong>Amphibian</strong>s and Reptiles of Louisiana. Louisiana State UniversityPress. Baton Rouge, Louisiana, USA.Faivovich, J., Haddad, C.F.B., Garcia, P.C.O., Frost, D.R., Campbell, J.A. and Wheeler, W.C. 2005. Systematicreview of the frog family Hylidae, with special reference to Hylinae: phylogenetic analysis and taxonomicrevision. Bulletin of the American Museum of Natural History 294:1-240.Fellers, G.M., Green, D.E. and Longcore, J.E. 2001. Oral chytridiomycosis in the mountain yellow-leggedfrog (Rana muscosa). Copeia 2001:945-953.Flint, R.F. 1971. Glacial and Quaternary Geology. John Wiley and Sons, New York, New York, USA.Flores-Villela, O. 1993. Herpetofauna Mexicana. Carnegie Museum of Natural History. Special Publications17:1-73.Flores-Villela, O.A., Mendoza-Quijano, F. and Gonzalez-Porter, G. 1995. Recopilacion de claves para ladeterminacion de anfibios y reptiles de Mexico. Publicaciones Especiales del Museo de ZoologiaUniversidad Nacional de Autonoma de Mexico 10:1-285.Fretwell, J.D., Williams, J.S. and Redman, P.J. (compilers). 1996. National Water Summary on WetlandResources. United States Geological Survey. Water-Supply Paper 2425, Reston, Virginia, USA.Frost, D.R. 2004. <strong>Amphibian</strong> Species of the World: an Online Reference. Version 3.0 (22 August, 2004).Electronic Database accessible at http://research.amnh.org/herpetology/amphibia/index.html. AmericanMuseum of Natural History, New York, USA.Frost, D.R., Grant, T., Faivovich, J.N., Bain, R.H., Haas, A., Haddad, C.F.B., de Sá, R.O., Channing, A.,Wilkinson, M., Donnelly, S.C., Raxworthy, C.J., Campbell, J.A., Blotto, B.L., Moler, P., Drewes, R.C.,Nussbaum, R.A., Lynch, J.D., Green, D.M. and Wheeler, W.C. 2006. The amphibian tree of life. Bulletinof the American Museum of Natural History 297:1-370.Gibbs, J.P., Breisch, A.R., Ducey, A.R., Johnson, G., Behler, J.L. and Bothner, R.C. In press. <strong>Amphibian</strong>sand Reptiles of New York State: Identification, Natural History, and Conservation. Oxford UniversityPress, New York, New York, USA.Green, D.M. (ed.) 1997. <strong>Amphibian</strong>s in Decline: Canadian Studies of a Global Problem. HerpetologicalConservation, Number 1, Society for the Study of <strong>Amphibian</strong>s and Reptiles, St. Louis, Missouri, USA.Green, N.B. and Pauley, T.K. 1987. <strong>Amphibian</strong>s and Reptiles in West Virginia. University of Pittsburgh Press,Pittsburgh, Pennsylvania, USA.Hammerson, G.A. 1999. <strong>Amphibian</strong>s and Reptiles in Colorado. Second edition. University Press of Colorado,Boulder, Colorado, USA.Harding, J.H. 1997. <strong>Amphibian</strong> and Reptiles of the Great Lakes Region. University of Michigan Press, AnnArbor, Michigan, USA.Hulse, A.C., McCoy, C.J. and Censky, E.J. 2001. <strong>Amphibian</strong>s and Reptiles of Pennsylvania and the Northeast.Cornell University Press, Ithaca, New York, USA.Hunter, M.L., Jr., Calhoun, A.J.K. and McCollough, M.1999. Maine <strong>Amphibian</strong>s and Reptiles. University ofMaine Press, Orono, Maine, USA.Johnson, T.R. 2000. The <strong>Amphibian</strong>s and Reptiles of Missouri. Second edition. Missouri Department ofConservation, Jefferson City, Missouri, USA.Kagarise Sherman, C. and Morton, M.L. 1993. Population declines of Yosemite toads in the eastern SierraNevada of California. Journal of Herpetology 27:186-198.Klemens, M.W. 1993. <strong>Amphibian</strong>s and Reptiles of Connecticut and Adjacent Regions. State Geological andNatural History Survey of Connecticut, Bulletin 112, Hartford, Connecticut, USA.Lannoo, M. (ed.). 1998. Status and Conservation of Midwestern <strong>Amphibian</strong>s. University of Iowa Press,Iowa City, Iowa, USA.Lannoo, M. (ed.). 2005. <strong>Amphibian</strong> Declines: The Conservation Status of United States Species. Universityof California Press, Berkeley and Los Angeles, California, USA.LaRoe, W.T., Farris, G.S., Puckett, C.E., Doran, P.D. and Mac, M.J. (eds.). 1995. Our Living Resources: A Reportto the Nation on the Distribution, Abundance, and Health of U.S. Plants, Animals, and Ecosystems. UnitedStates Department of the Interior, National Biological Service, Washington, D.C., USA.Lemos-Espinal, J., Smith, H.M. and Chiszar, D. 2004. Introducción a los Anfibios y Reptiles del Estado deChihuahua. UNAM-CONABIO, México, D.F.Leonard, W.P., Brown, H.A., Jones, L.L.C., McCallister, K.R. and Storm, R.M. 1993. <strong>Amphibian</strong>s of Washingtonand Oregon. Seattle Audubon Society, Seattle, Washington, USA.Lips, K.R., Brem, F., Brenes, R., Reeve, J.D., Alford, R.A., Voyles, J., Carey, C., Livo, L., Pessier, A.P. andCollins, J.P. 2006. Emerging infectious disease and the loss of biodiversity in a Neotropical amphibiancommunity. Proceedings of the National Academy of Sciences 103:3165-3170.MacCulloch, R.D. 2002. The ROM Field Guide to <strong>Amphibian</strong>s and Reptiles of Ontario. Royal Ontario Museumand McClelland and Stewart Ltd., Toronto, Ontario.Martof, B.S., Palmer, W.M., Bailey, J.R. and Harrison III, J.R. 1980. <strong>Amphibian</strong>s and Reptiles of the Carolinasand Virginia. University of North Carolina Press, Chapel Hill, North Carolina, USA.Matsuda, B., Green, D.M. and Gregory, P.T. 2006. The <strong>Amphibian</strong>s and Reptiles of British Columbia. RoyalBritish Columbia Museum, Victoria, Canada.Minton, S.A. Jr. 2001. <strong>Amphibian</strong>s and Reptiles of Indiana. Indiana Academy of Science, Indianapolis,Indiana, USA.Mount, R.H. 1975. The Reptiles and <strong>Amphibian</strong>s of Alabama. Auburn University Agricultural ExperimentStation. Auburn, Alabama, USA.Purpose Subsistence Sub-national/NationalRegional/InternationalNumberof speciesFood – human 11 (5) 5 (1) 3 (0) 13 (5)Medicine – human and2 (1) 0 0 2 (1)veterinaryWearing apparel, accessories 1 (0) 0 0 1 (0)Handicrafts, curios, etc. 1 (0) 1 (0) 1 (0) 1 (0)Pets, display animals 3 (1) 7 (2) 11 (2) 14 (2)Research 0 2 (1) 3 (1) 4 (1)Specimen collecting 1 (1) 8 (4) 1 (1) 8 (4)Population Trend Number of species % of speciesDecreasing 103 31Stable 162 48Increasing 2 0.6Unknown 68 20FamilyNumber of Percentagespecies in of species“rapid decline” in family in“rapid decline”Number ofspecies in“enigmaticdecline”Percentageof speciesin family in“enigmaticdecline”Bufonidae 5 18 3 11Leptodactylidae 1 4 1 4Ranidae 8 21 4 11Scaphiopodidae 1 14 0 0Ambystomatidae 1 5 0 0Plethodontidae 6 4 3 2Proteidae 1 20 0 0Salamandridae 1 17 0 0Noss, R.F., LaRoe, E.T., III and Scott, J.M. 1995. Endangered Ecosystems of the United States: A PreliminaryAssessment of Loss and Degradation. United States Department of the Interior, National BiologicalService, Washington, D.C., USA.Nussbaum, R.A., Brodie, E.D., Jr. and Storm, R.M. 1983. <strong>Amphibian</strong>s and Reptiles of the Pacific Northwest.University Press of Idaho, Moscow, Idaho, USA.Petranka, J.W. 1998. Salamanders of the United States and Canada. Smithsonian Institution Press,Washington D.C., USA.Pounds, J.A., Bustamante, M.R., Coloma, L.A., Consuegra, J.A., Fogden, M.P.L., Foster, P.N., La Marca,E., Masters, K.L., Merino-Viteri, A., Puschendorf, R., Ron, S.R., Sánchez-Azofeifa, G.A., Still, C.J. andYoung, B.E. 2006. Widespread amphibian extinctions from epidemic disease driven by global warming.Nature 439:161-167.Ricketts, T.H., Dinerstein, E., Olson, D.M., Loucks, C.J., Eichbaum, W., Dellasaia, D., Kavanagh, K., Hedao,P., Hurley, P.T., Carney, K.M., Abell, R. and Walters, S. 1999. Terrestrial Ecosystems of North America,A Conservation Assessment. Island Press, Washington, D.C., USA.Russell, A.P. and Bauer. A.M. 1993. The <strong>Amphibian</strong>s and Reptiles of Alberta. University of Calgary Press,Calgary, Alberta, and University of Alberta Press, Edmonton, Alberta.Scott, G.A.J. 1995. Canada’s Vegetation, A World Perspective. McGill-Queen’s University Press, Montrealand Kingston, Canada.Stebbins, R.C. 1972. California <strong>Amphibian</strong>s and Reptiles. University of California Press. Berkeley, California,USA.Stebbins, R.C. 2003. A field guide to western reptiles and amphibians. Third edition. Houghton MifflinCompany, Boston, USA.Stein, B.A., Kutner, L.S. and Adams, J.S. (eds.). 2000. Precious Heritage: The Status of Biodiversity in theUnited States. Oxford University Press, New York, New York, USA.Stuart, S.N., Chanson, J.S., Cox, N.A., Young, B.E., Rodrigues, A.S.L., Fischman, D.L. and Waller, R.W. 2004.Status and trends of amphibian declines and extinctions worldwide. Science 306:1783-1786.Trauth, S.E., Robinson, H.W. and Plummer, M.V. 2004. The <strong>Amphibian</strong>s and Reptiles of Arkansas. Universityof Arkansas Press, Fayetteville, Arkansas, USA.Vazquez-Díaz, J. and Quintero-Díaz, G.E. 2005. Anfibios y Reptiles de Aguascalientes. CONABIO-CIEMA-Internacional de Relojes, México.Weller, W.F. and Green, D.M. 1997. Checklist and current status of Canadian amphibians. HerpetologicalConservation 1:309-328.Werner, J.K., Maxell, B.A., Hendricks, P. and Flath, D.L. 2004. <strong>Amphibian</strong>s and Reptiles of Montana. MountainPress Publishing Company, Missoula, Montana, USA.Young, B.E., Stuart, S.N., Chanson, J.S., Cox, N.A. and Boucher, T.M. 2004. Disappearing Jewels: The Statusof New World <strong>Amphibian</strong>s. NatureServe, Arlington, Virginia, USA.The Two-toed Amphiuma Amphiuma means(Least Concern) is one of three species inthe Amphiumidae, a Family of three eel-likesalamanders from the south-eastern UnitedStates with vestigial limbs. It can be found ina variety of still-water habitats, and may leavewater, especially on rainy nights. © SuzanneL. Collins, CNAHTable 6. The purposes for which amphibiansare used in the Nearctic Realm. The numbersin brackets are the number of species withinthe total that are threatened species.Table 7. The population trends for all extantNearctic amphibians.Table 8. The number of species in “rapid decline”and “enigmatic decline” in the NearcticRealm by Family.The Coastal Tailed Frog Ascaphus truei (LeastConcern) ranges from southern British Columbiaand northern California, and is one ofonly two species in the Family Ascaphidae.Both species are associated with clear, cold,swift-moving mountain streams in forests andlay eggs in long strings under stones in water.© Suzanne L. Collins, CNAHEndnotes1 P
90Threatened <strong>Amphibian</strong>s of the WorldESSAY 8.1. APPALACHIAN AMPHIBIANSAlthough widely distributed throughout much of the United States, southernCanada south to northern Mexico in the Sierra Madre Occidental, the TigerSalamander Ambystoma tigrinum (Least Concern) is absent from most of theAppalachian Mountains and occurs only in the Shenandoah Valley at the baseof the Blue Ridge Mountains in west-central Virginia. © Don ChurchThe Appalachian Mountains lie in a 2,414km north-east to south-weststretch of eastern North America from Newfoundland and Labrador inCanada to north-central Alabama in the United States (with their foothills innorth-eastern Mississippi). The topographic system is divided into a seriesof ranges, with the highest of the group being Mt. Mitchell in North Carolina(2,040m). This summit is also the highest point on the continent east of theMississippi River. Because North America and Africa were once connected,the Appalachians were once part of the same mountain chain as the AtlasMountains in Morocco. Many floristic and some animal species (e.g., giantsalamanders) are also related to those in the mountains of western Chinabased on ancient continental connections.The Appalachian region supports a startling diversity of amphibians, allthe more so since more than one-third of the species (37 of the 98 present)are endemic. Salamander genetic diversity in the Appalachians is the highestin the world, although Central America supports a higher species richness(see Essay 9.3). In total, 72 salamander species inhabit the region, with 60representatives of the family Plethodontidae (the lungless salamanders). Allof the region’s endemic amphibians are plethodontids. Although the area’ssalamander fauna has been intensively studied for over 150 years, new speciesare still being discovered. Several species with restricted distributionsremained hidden to herpetologists among mountains and caves until themiddle of the 20 th century. Dunn (1926) recognized 22 species in his seminalrevision of the Plethodontidae. By 1967, the plethodontid count was at 26species (Brame 1967). However, the advent of molecular genetic techniquesin the mid-1960s sparked another scientific inquisition into the region’ssalamander fauna. The number of described plethodontid species morethan doubled by the beginning of the 21 st century. For example, Conant andCollins (1998) recognized 56 Appalachian species in their field guide. Geneticanalyses continue to discover cryptic species that are difficult to resolve withonly morphological differences.Colour, pattern, and morphological variation abound geographically andamong species in the Appalachians. Green Salamanders, Aneides aeneus (NT),have, for example, a bright green moss-like pattern, splayed limbs, and largefeet used for climbing and living in rock crevices. Seepage and streamsidesalamanders include the bright yellow, sleek Two-lined Salamanders, membersof the genus Eurycea, the robust, brilliant Red Salamander, Pseudotritonruber (LC), and the large Spring Salamander, Gyrinophilus porphyriticus (LC),a predator of all of the rest. The many streamside salamanders in the genusDesmognathus have dull brown to black colours and varying dull reticulateand spot patterns, but are amazingly abundant in mountain streams. Somespecies are fully aquatic, like the Shovel-nosed Salamander, Desmognathusmarmoratus (LC), whereas others spend as much time on land as in the water,like the Allegheny Mountain Dusky Salamander, Desmognathus ochrophaeus(LC). The many species in the completely terrestrial salamander group, genusPlethodon, lay eggs in moist microhabitats in forests where all embryonicdevelopment occurs within the egg capsule. Hatchlings are adult forms andfully terrestrial. The Red-backed Salamander, Plethodon cinereus (LC), may bethe most abundant vertebrate in the Appalachians. Their biomass per squaremeter can be higher than all the mammals and equal to that of all the birdsin the area (Burton and Likens 1975).The lungless salamanders within the Appalachian region have been veryvaluable to our understanding of speciation and other evolutionary processes(Frost 2000). The diversity of the Appalachian amphibian fauna is enhancedby a few species from other families that have small relict populations. Forexample, the Tiger Salamander Ambystoma tigrinum (LC) is found patchilyalong the Coastal Plain, but is also known to occur in only a single locationwithin the Appalachian region. This disjunct population is dependent upona unique complex of ancient sinkhole ponds in the Shenandoah Valleyat the base of the Big Levels massif of the Blue Ridge Mountain chain inwest-central Virginia (Buhlmann and Hoffman 1990; Mitchell and Buhlmann1999). Although the next nearest Tiger Salamander population occurs onVirginia’s Coastal Plain, mitochondrial DNA evidence reveals that this relictmountain population is most closely related to a population in west-centralSouth Carolina, but became isolated 100,000-300,000 years ago (Church etal. 2002). Genetic and fossil data strongly suggest that the Tiger Salamanderonce had a more continuous distribution throughout the Appalachian regionbut became isolated in the Big Levels area before or during the last Pleistoceneglaciation event. Interestingly, these Shenandoah Valley sinkhole pondsalso support disjunct populations of plant, dragonfly, and damselfly species(Fleming and Van Alstine 1999; Roble 1999) suggesting that this region ofAppalachia may have provided Pleistocene refugia for entire communities.Future studies of these relict populations will reveal how species rangeshave contracted and expanded and, hence, what the consequences may befrom future climate change.Several of the endemic Appalachian plethodontid salamander species haveextremely restricted distributions. These species are susceptible to habitatloss and climate change and are, therefore, important flagship species forthe region. The Shenandoah Salamander, Plethodon shenandoah (VU), forexample, is restricted to talus slopes between 914 and 1,143m asl on thenorth and north-west slopes of Hawksbill Mountain, Stony Man Mountain,and The Pinnacles in the Blue Ridge of north-central Virginia (Petranka1998; Mitchell and Reay 1999). The conservation status of this species isapparently secure for the immediate future given that its entire range lieswithin Shenandoah National Park. The Peaks of Otter Salamander, P. hubrichti(VU), is another small, entirely terrestrial species restricted to a 19-km highelevation length of the Blue Ridge Mountains in west-central Virginia.Although abundant within parts of its range, this salamander is susceptibleto timbering and habitat fragmentation due to its very low dispersal rateand restricted distribution (Kramer et al. 1993). The Junaluska Salamander,Eurycea junaluska (VU), is another rare Appalachian salamander found patchilyand in low abundance in the Cheoah River drainage of North Carolina andalong Fighting Creek and Tellico River in Tennessee. This very rare specieshas a biphasic life history, with stream-dwelling larvae and adults that enterforests. Thus, the Junaluska Salamander is vulnerable to degradation of bothstream and forest habitats.Although not endemic to Appalachia, the Hellbender, Cryptobranchusalleganiensis (NT), is another important flagship amphibian for the region.This species is the sole representative of its genus, and one of only threesurviving species within the family of giant salamanders, Cryptobranchidae.Hellbenders are bizarre animals with fleshy folds of skin undulating alongtheir sides and are capable of reaching 74 cm in total length. Living theirentire lives in large, fast-flowing streams, they have laterally compressedtails and are capable of swimming quickly underwater. Their large, dorsallyflattened heads support only diminutive eyes, but have huge mouths capableof engulfing crayfish and small fish, the mainstays of their diet. A mature maleconstructs a nesting cavity under a large flat rock during the breeding seasonand aggressively guides gravid females to enter, whereupon he detains heruntil she oviposits her clutch of up to 750 eggs. The male then fertilizes theeggs, evicts the mother, and subsequently guards the nest from intrudersfor a period of the incubation (Bishop 1943; Dodd 2004). Hellbenders weretraditionally eaten by Native Americans, who probably skinned them first astheir slimy skin secretions are toxic to many predators (McCoy 1982). Themajority of the Hellbender’s range occurs within the Appalachian region,where it was undoubtedly abundant in streams prior to European colonization(Petranka 1998). Populations have since declined drastically across much oftheir range and have gone locally extinct due to their susceptibility to streamimpoundment, siltation from timber harvest operations and development, andpollution from industry (Bury et al. 1980; Mitchell et al. 1999). Although manyriver systems within the Hellbender’s range are protected, this species, likemany amphibians, is highly susceptible to anthropogenic activities outsidethe primary habitat.Despite the high species richnessand abundance of the salamanders inthe Appalachian Mountains of NorthAmerica, many of them are threatened.Population extinction and rangecontraction is occurring for severalof these unique vertebrates. Noneappears to be in imminent dangerof complete extinction, but urbansprawl, pollution, climate change, andsome types of agriculture and timberharvesting are causing declines inmany areas. Fortunately, large partsof the Appalachian Mountain chain,especially in the southern Appalachians,are in U.S. National Park andNational Forest Service ownership.Conservation and management ofthese spectacular amphibians isongoing at many levels, such as withthe Habitat Management Guidelinesproduced by Partners in <strong>Amphibian</strong>and Reptile Conservation (Bailey et al.2006; Mitchell et al. 2006).Don R. Church, Thomas S.B.Akre, and Joseph C. MitchellReferencesBailey, M.A., Holmes, J.N., Buhlmann, K.A.and Mitchell, J.C. 2006. Habitat ManagementGuidelines for <strong>Amphibian</strong>s and Reptilesof the Southeastern United States,pp. 88. Partners in <strong>Amphibian</strong> and ReptileConservation, Technical Publication HMG-2, Montgomery, Alabama, USA.Bishop, S.C. 1943. Handbook of Salamandersof the United States and Canada. CornellUniversity Press, Ithaca, New York, USA.Brame, A.H., Jr. 1967. A list of the world’s recent and fossil salamanders. Herpeton2:1-26.Buhlmann, K.A. and Hoffman, R.L. 1990. Geographic distribution: Ambystoma tigrinumtigrinum. Herpetological Review 21:36.Burton, T.M. and Likens, G.E. 1975. Salamander populations and biomass in the HubbardBrook Experimental Forest, New Hampshire. Copeia 1975:541-546.Bury, R.B., Dodd, C.K., Jr., and Fellers, G.M. 1980. Conservation of the amphibia of theUnited States: a review. U.S. Department of the Interior, Fish and Wildlife Service.Resource Publication 134:1-34.Church, S.A., Kraus, J.M., Mitchell, J.C., Church, D.R., and Taylor, D.R. 2002. Phylogeographyof the eastern tiger salamander: Effects of the Pleistocene glaciation on currentgenetic relationships. Evolution 57:372-383.Conant, R., and Collins, J.T. 1998. A Field Guide to Reptiles and <strong>Amphibian</strong>s, Eastern andCentral North America. Third, expanded edition. Houghton Mifflin Company, Boston,Massachusetts, USA.Dodd, C.K., Jr. 2004. The <strong>Amphibian</strong>s of Great Smoky Mountains National Park. Universityof Tennessee Press, Knoxville, Tennessee. USA.Dunn, E.R. 1926. The Salamanders of the Family Plethodontidae. Smith College, Northampton,Massachusetts, USA.Fleming, G.P. and Van Alstine, N.F. 1999. Plant communities and floristic features ofsinkhole ponds and seepage wetlands in southeastern Augusta County, Virginia.Banisteria 13:67-94.Frost, D. 2000. Species, descriptive efficiency, and progress in systematics. In: R.C. Bruce,R.G. Jaeger and L.D. Houck (eds.), The Biology of Plethodontid Salamanders, pp. 7-29.Kluwer Academic/Plenum Publishers, New York, USA.Kramer, P., Reichenbach, N., Hayslett, M. and Sattler, P. 1993. Population dynamicsand conservation of the Peaks of Otter salamander, Plethodon hubrichti. Journal ofHerpetology 27:431-435.McCoy, C.J. 1982. <strong>Amphibian</strong>s and reptiles in Pennsylvania. Special Publications of theCarnegie Museum of Natural History 6:1-91.Mitchell, J.C., Breisch, A.R. and Buhlmann, K.A. 2006. Habitat Management Guidelinesfor <strong>Amphibian</strong>s and Reptiles of the Northeastern United States, pp. 106. Partners in<strong>Amphibian</strong> and Reptile Conservation, Technical Publication HMG-3, Montgomery,Alabama, USA.Mitchell, J.C. and Buhlmann, K.A. 1999. <strong>Amphibian</strong>s and reptiles of the Shenandoah ValleySinkhole Pond System in Virginia. Banisteria 13:129-142.Mitchell, J.C., Pauley, T.K., Withers, D.I., Cupp, P.V., Braswell, A.L., Miller, B., Roble, S.M.and Hobson, C.S. 1999. Conservation status of the southern Appalachian herpetofauna.Virginia Journal of Science 50:13-36.Mitchell, J.C. and Reay, K.K. 1999. Atlas of <strong>Amphibian</strong>s and Reptiles of Virginia. VirginiaDepartment of Game and Inland Fisheries, Special Publication Number 1, Richmond,Virginia, USA.Petranka, J.W. 1998. Salamanders of the United States and Canada. Smithsonian InstitutionPress, Washington D.C., USA.Roble, S.R. 1999. Dragonflies and damselflies (Odonata) of the Shenandoah Valley SinkholePond System and vicinity, Augusta County, Virginia. Banisteria 13:101-127.The Blue Ridge Red Salamander Pseudotriton ruber (Least Concern) rangesfrom the Hudson River in New York southwestward to Indiana and southwardto Louisiana and the Gulf Coast; adults are both aquatic and terrestrial.© Don Church
Chapter 8. <strong>Amphibian</strong>s of the Nearctic Realm 91ESSAY 8.2. AMPHIBIAN DECLINES IN CALIFORNIACalifornia, along with Central America and Australia, has been a focal areafor the study of amphibian population declines, because of the severe declinesof many of its species. The region is recognized as one of the world’sbiodiversity hotspots (the “California Floristic Province”) and contains aheterogeneous landscape that sustains a wide variety of ecosystems, suchas Sonoran deserts, marshes and wetlands, oak woodlands, high-elevationalpine systems, temperate rain forests, and many others. The amphibian faunais diverse and, at the time of writing, includes 64 recognized native species(Figure 1a), including 40 species of salamanders from five families and ninegenera, and 24 species of frogs and toads from five families and six genera(plus two introduced species; AmphibiaWeb 2006). <strong>Amphibian</strong>s in Californiacan be found in nearly all habitat types ranging from near Mount Whitney (at3,657 m, the highest peak in the contiguous United States) to Death Valley(85 m below sea level). Despite the fact that California contains some of thelargest contiguous protected habitats in the continental United States, nearlyone-quarter of amphibians in California are threatened (Figure 1b).Many potential causes for the widespread declines of amphibians havebeen proposed. In general these can be grouped into two major categories:1) factors general to the overall biodiversity crisis, including habitat destruction,alteration and fragmentation, introduced species and over-exploitation,and 2) factors associated with amphibians that might account for declinesin relatively undisturbed habitats. The first category includes relatively wellunderstood direct ecological phenomena, whereas the second includes complexand elusive mechanisms, such as climate change, increased ultraviolet(UV-B) radiation, chemical contaminants, infectious diseases, and the causesof deformities (or malformations). The underlying mechanisms behind thesefactors are complex and may be working synergistically with more evidentfactors, such as habitat destruction and introduced species, to exacerbatedeclines. Many biologists believe that there are some dominant causes, suchas new infectious diseases, whereas others are not convinced that there isa single overarching cause for global declines, but that many factors arethreatening amphibian populations to a greater or lesser extent.In California, amphibian declines are associated with many of the varioushypotheses. Habitat destruction, alteration, and fragmentation have affecteda large number of species including the Foothill Yellow-legged Frog R. boylii(NT), the Arroyo Toad Bufo californicus (EN), and the California Tiger SalamanderAmbystoma californiense (VU), to name a few (Lannoo 2005). Someamphibians suffered declines long ago. In the 19 th century, the CaliforniaGold Rush brought waves of new settlers who quickly over-exploited somefrog species for food. They also altered the environment in ways that havehad much more substantial effects on amphibians. Cities were built, riversdammed and diverted, forests were cleared, and the waterways of GreatCentral Valley were completely altered for agriculture and to provide waterfor cities and industrial growth. The effect on California’s ecosystems has beenprofound. As elsewhere, habitat conservation has become a central themein efforts to preserve the region’s biodiversity. However, recent amphibiandeclines in California have occurred in remote habitats well protected fromdevelopment.Beginning in the 1980s, scientists began to document alarming amphibiandisappearances in protected habitats in California, Central America, andAustralia. Some of the best documented examples of declines can be foundin the Sierra Nevada, which not only contains large sections of roadless,undisturbed habitat, but also has a rich history of biological surveys goingback to the turn of the 20 th century (Grinnell and Storer 1924). These dataare useful for comparisons with present day distributions of amphibians.For example, historical surveys noted abundant amphibians throughout theSierra Nevada, and at higher elevations (>1500 m) the Mountain YellowleggedFrog Rana muscosa (CR) (Figure 2) was termed the most abundant ofall vertebrates! But, in the last three decades, nearly the entire amphibianfauna of the Sierra Nevada has collapsed. Air pollution, increases in harmfulultraviolet radiation (UV-B), introduced predators, and emerging diseases haveall been proposed as key factors that may explain the enigmatic declines inthis protected landscape.The first reports of amphibian collapse in the Sierra Nevada came fromYosemite Toads Bufo canorus (EN) (Stebbins and Cohen 1995). Hundredsof animals were found dead and dying, and many populations simplydisappeared. A similar pattern was found with Mountain Yellow-leggedFrogs (Stebbins and Cohen 1995), while Western Toads Bufo boreas (NT),Foothill Yellow-legged Frogs, and even Long-toed Salamanders Ambystomamacrodactylum (LC) also suddenly declined throughout their ranges. On theother hand, Pacific Chorus Frogs Pseudacris regilla (LC) remained abundant(Stebbins and Cohen 1995).The Sierra Nevada became a testing ground for hypotheses that couldaccount for disappearances in remote, seemingly pristine, habitats. Oneexample is the UV-B hypothesis, which states that human-induced climatemodification results in increased levels of harmful UV-B that can kill amphibianeggs exposed to direct sunlight. A correlational analysis showedthat there was no negative pattern between expected high UV-B dose anddisappearance of frogs, but did reveal that frog populations occurring closerto pesticide and fertilizer sources were more likely to have gone extinctthan populations in more remote areas (Davidson et al. 2001). Disease, inparticular chytridiomycosis, is also a factor and responsible for the collapseof amphibian populations in Central and South America (Berger et al. 1998;Lips et al. 2006), and Australia (Berger et al. 1998). This disease was foundin collapsing populations of Mountain Yellow-legged Frogs in the SierraNevada (Rachowicz et al. 2006), although it also appears to be endemic inother amphibian species that have stable populations.<strong>Amphibian</strong> declines may be the window into the future of what we canexpect as humans continue to alter their environment on a global scale. As welearn more about the mechanisms responsible for declines, we may be ableto reverse some of them, though there remain few examples. In the SierraNevada, one study has shown that, in the absence of disease, populationrecovery of threatened frogs is possible (Vredenburg 2004). Trout have beenextensively introduced throughout the Sierra Nevada for sport fishing, andmore than 90% of the naturally fishless lakes now contain non-native trout.The Mountain Yellow-legged Frog, which is adapted to living in environmentswithout any fish, has declined dramatically (more than 93% of historicalpopulations are now extinct; Vredenburg et. al. 2007), and while there areseveral potential causes, removal of introduced trout from entire lakes leadsto recovery of local frog populations.Vance T. Vredenburg, Michelle S. Koo, and David B. WakeReferencesAmphibiaWeb. 2006. AmphibiWeb: Information on amphibian biology and conservation[web application]. in. Available: http://amphibiaweb.org/, Berkeley, California:AmphibiaWeb. (Accessed 2006).Berger, L., Speare, L., Daszak, P., Green, D.E., Cunningham, A.A., Goggin, C.L., Slocombe,R., Ragan, M.A., Hyatt, M.A., McDonald, K.R., Hines, H.B., Lips, K.R., Marantelli, G.,and Parkes, H. 1998. Chytridiomycosis causes amphibian mortality associated withpopulation declines in the rain forests of Australia and Central America. Proceedingsof the National Academy of Sciences USA 95:9031-9036.Davidson, C., Shaffer, H.B. and Jennings, M.R. 2001. Declines of the California red-leggedfrog: Climate, UV-B, habitat, and pesticides hypotheses. Ecological Applications11:464-479.Gastner, M.T. and Newman, M.E.J. 2004. Diffusion-based method for producingdensity-equalizing maps. Proceedings of the National Academy of Sciences USA101:7499-7504.Grinnell, J. and Storer, T. 1924. Animal life in the Yosemite. University of CaliforniaPress, Berkeley, USA.Lannoo, M.J. (eds.). 2005. <strong>Amphibian</strong> declines: the conservation status of the UnitedStates species. University of California Press, Berkeley, USA.Lips, K.R., Brem, F., Brenes, R., Reeve, J.D., Alford, R.A., Voyles, J., Carey, C., Livo, L.,Pessier, A.P.,and Collins, J.P. 2006. Emerging infectious disease and the loss of biodiversityin a Neotropical amphibian community. Proceedings of the National Academyof Sciences USA 103:3165-3170.Rachowicz, L.J., Knapp, R.A., Morgan, J.A.T., Stice, M.J., Vredenburg, V.T., Parker, J.M.and Briggs, C.J. 2006. Emerging infectious disease as a proximate cause of amphibianmass mortality in Rana muscosa populations. Ecology 87:1671-1683.Stebbins, R.C. and Cohen, N.W. 1995. Declining <strong>Amphibian</strong>s. A Natural History of <strong>Amphibian</strong>s.Princeton University Press, Princeton, NJ, USA.Stuart, S., J.S. Chanson, N.A. Cox, B.E. Young, A.S.L. Rodrigues, D.L. Fishman, and R.W.Waller. 2004. Status and trends of amphibian declines and extinctions worldwide.Science 306:1783-1786.Vredenburg, V.T. 2004. Reversing introduced species effects: Experimental removal ofintroduced fish leads to rapid recovery of a declining frog. Proceedings of the NationalAcademy of Sciences USA 101:7646-7650.Vredenburg, V.T., Bingham, R., Knapp, R., Morgan, J.A.T., Moritz, C. and Wake, D. 2007.Concordant molecular and phenotypic data delineate new taxonomy and conservationpriorities for the endangered mountain yellow-legged frog (Ranidae: Rana muscosa).Journal of Zoology, London 271:361-374.The Mountain Yellow-legged Frog Rana muscosa (Critically Endangered)from California and Nevada, USA, has declined by the loss of over 93% ofhistoric populations. This frog is extinct in the state of Nevada, but scatteredpopulations remain in the Sierra Nevada along eastern California and in threemountain tops surrounding Los Angeles (fewer than 200 individuals survive inonly eight populations in the southern mountains). Major threats to remainingpopulations include air pollution, disease and introduced predators (trout).© Vance VredenburgFigure 1. <strong>Amphibian</strong> speciesdiversity by U.S. state (A),and percent of threatenedamphibian species by state(b) visualized using densityequalizing cartograms(technique after Gastner andNewman 2004). State sizeand shape are purposefullydistorted in proportion to(in A) the total number ofamphibian species, and (B)the percentage of threatenedspecies by state (data sources;A: AmphibiaWeb 2006; B:Stuart et al. 2004).
CHAPTER 9. AMPHIBIANS OF THE NEOTROPICAL REALMCochranella vozmedianoi (Data Deficient) isa poorly known species endemic to Cerro ElHumo, in the Península de Paria, in northernVenezuela. It is a glass frog from the FamilyCentrolenidae that inhabits tropical humidforests, along streams. It lays its eggs on theupper side of leaves overhanging streams. Thelarvae fall into the stream below after hatching.© Juan Manuel GuayasaminFigure 1. Summary of Red List categories foramphibians in the Neotropical Realm.Red List Category Number of speciesExtinct (EX) 7Extinct in the Wild (EW) 0Critically Endangered (CR) 358Endangered (EN) 456Vulnerable (VU) 324Near Threatened (NT) 140Least Concern (LC) 956Data Deficient (DD) 675Total Number of Species 2,91633%23%0.2%12%5%16%11%Table 1. The Critically Endangered (PossiblyExtinct) amphibian species in the NeotropicalRealm (*denotes species that also occur in theNearctic Region). A full list of CR(PE) speciescan be found in Appendix IX.Federico Bolaños, Fernando Castro, Claudia Cortez, Ignacio De la Riva, TaranGrant, Blair Hedges, Ronald Heyer, Roberto Ibáñez, Enrique La Marca, EstebanLavilla, Debora Leite Silvano, Stefan Lötters, Gabriela Parra Olea, SteffenReichle, Robert Reynolds, Lily Rodríguez, Georgina Santos Barrera, NormanScott, Carmen Ubeda, Alberto Veloso, Mark Wilkinson and Bruce YoungTHE GEOGRAPHIC AND HUMAN CONTEXTThe Neotropical Realm includes all of mainland South America, much of Mesoamerica(except parts of northern Mexico), all of the Caribbean islands, and extreme southern Texasand Florida in the United States.South America has a long history of geographic isolation that began when this continentseparated from other Southern Hemisphere land masses 40-30 Ma. The Andes, one of thelargest mountain ranges on earth and reaching 6,962m at Acongagua in Argentina, began touplift 80-65Ma as South America drifted west from Africa. The other prominent mountainousareas on the continent are the Tepuis of the Guianan Shield, and the highlands of southeasternBrazil. The complex patterns of wet and dry habitats on the continent are the resultof an array of factors, including the climatic effects of cold ocean currents interacting withthese mountain ranges, orographic barriers to winds carrying humidity within the continent,and the constant shifting of the intertropical convergence zone, among others.The geological history of Mesoamerica is very complex and still not completely understood.The land north of the Isthmus of Tehuantepec in southern Mexico is historically partof the North American continent, with the highest point at Pico de Orizaba at 5,610m asl.The land south of the Isthmus to the southern Nicaragua lowlands is a mosaic of plates thathave rearranged themselves and alternately been submerged and exposed by the sea severaltimes during the last 65 million years. The region encompassed by Panama, Costa Rica, andsouthern Nicaragua formed over the last three to ten million years through a combination ofvolcanic activity and uplift. The result is a jumble of mountain ranges interrupted by valleysand lowlands, with the highest point being Volcán Tajumulco at 4,220m asl in Guatemala.The closing of these different blocks of land in present-day Nicaragua during the Pliocene(5.3 - 1.8 Ma) has had a marked impact on the distribution of amphibians today.The geological history of the Caribbean also remains under intense study, but mostgeologists now agree that the Greater Antilles (Cuba, Jamaica, Hispaniola, and Puerto Rico)are geological cousins of the plates that make up northern Central America. Some 100 Ma,these islands were lined up more or less between North and South America in approximatelythe location of present day Central America. Over the last 70 million years, these islandshave drifted east to their current positions. The trailing edge of this parade of islands hasfused to North America and now makes up northern Central America. Some of the GreaterAntilles may have had temporary land connections with North and/or South America asthey drifted eastward. The Lesser Antilles formed in a completely different manner. As theCaribbean Plate carrying the Greater Antilles moved eastward, the America Plate subductedbeneath it, creating an island arc known today as the Lesser Antilles.The region is enormously varied ecologically. Equatorial South America is dominated by thelowland rainforest of the Amazon Basin. South of this the habitats become progressively drierand less suitable for amphibians, with the exception of the now extensively cleared AtlanticForest of southern and eastern Brazil, eastern Paraguay, and north-eastern Argentina, and thetemperate forests of Chile. There are important wetland areas in the Llanos of Venezuela andColombia, and the Pantanal of Brazil, Paraguay and Bolivia. The topographically varied Andeanregion includes all varieties of habitats, from some of the wettest lowland rainforest in the Pacificlowlands of Colombia to the Atacama Desert in northern Chile (the driest place on earth), andfrom cold temperate habitats in the extreme south of the continent to high mountain paramos inthe tropics. In Mesoamerica there is a very complex patchwork of natural habitats, with humidmountain slopes rising above both dry (generally on the Pacific side) and wet (Caribbean side)lowland habitats. The Caribbean islands are also a complex mosaic of habitats, with low-lyingislands tending to be semi-arid, and wetter environments occurring where trade winds encounterthe higher Caribbean mountains giving rise to a variety of moist tropical forest types.On average, the Neotropics have a relatively low human population density (approximately27 people per square kilometre in 2005), only 22% of which lives in rural areas, anda population growth rate (1.4% per annum) that is decreasing. However, some Caribbeanislands are among the most densely populated places on Earth. Historically, South Americahas been subject to relatively low levels of anthropogenic disturbance, but human impacthas been higher in northern Mesoamerica and on the Caribbean islands. The low impactin much of the region is related to low human population densities. The gross income percapita was around US$3,500 in the region in 2004. However, 33% of the region’s GrossDomestic Product is concentrated in Mexico and a further 30% in Brazil, where the humanimpacts on natural ecosystems and biodiversity have been much more severe. Economicgrowth rates in the region have been modest (2.7% in 2003).The human impact on ecosystems is very variable through the region. Natural habitatshave been particularly severely damaged on many of the Caribbean islands (and especiallyin Haiti), and in the northern part of Mesoamerica (from central Mexico, south to Guatemala,Honduras and El Salvador). There has also been extensive habitat loss through much of theAndes, and especially in the Atlantic Forests and Cerrado of central, southern and easternBrazil, and in the native southern temperate forests of Chile. The forests of the AmazonBasin and Guianan Shield are still largely intact, although there is much clearance currentlytaking place along the southern edge of the forest zone in Brazil. Habitat loss in the regionhas been driven largely by expanding subsistence agriculture to support growing humanpopulations, and also by commercial agriculture and logging.GLOBAL CONSERVATION STATUSA total of 2,916 amphibian species (49% of the world’s total) are recorded from the NeotropicalRealm, of which 1,145 (39%) are considered to be globally threatened (Figure 1). This issignificantly more than the global average of 33% 1 . As is the case globally, the percentageof threatened species is expected to increase as the status of DD species is clarified, asnew species (some of which are likely to be rare, and/or have small ranges) are discovered,and as the taxonomic status of many species complexes is resolved.ANURABufonidaeAndinophryne colomaiAtelopus arthuriAtelopus baliosAtelopus carbonerensisAtelopus chiriquiensisAtelopus chrysocorallusAtelopus coyneiAtelopus famelicusAtelopus guanujoAtelopus halihelosAtelopus lozanoiAtelopus lynchiAtelopus mindoensisAtelopus muiscaAtelopus nanayAtelopus oxyrhynchusAtelopus pachydermusAtelopus peruensisAtelopus pinangoiAtelopus planispinaAtelopus sorianoiAtelopus senexAtelopus sernaiBufo fastidiosusBufo fluviaticusBufo holdridgeiMelanophryniscus macrogranulosus 2Rhamphophryne rostrataCentrolenidaeCentrolene balluxCentrolene helodermaHyalinobatrachium crybetesDendrobatidaeAromobates nocturnesColostethus dunniColostethus edwardsiColostethus jacobuspetersiColostethus ruiziColostethus vertebralisDendrobates abditusMannophryne neblinaHylidaeAplastodiscus flumineusBromeliohyla dendroscartaBokermannohyla claresignataBokermannohyla izecksohniCharadrahyla altipotensCharadrahyla truxEcnomiohyla echinataHyla bocourtiHyla chlorosteaHypsiboas cymbalumIsthmohyla calypsaIsthmohyla debilisIsthmohyla graceaeIsthmohyla rivularisIsthmohyla ticaMegastomatohyla pellitaPlectrohyla calvicollinaPlectrohyla celataPlectrohyla cembraPlectrohyla cyanommaPlectrohyla ephemeraPlectrohyla hazelaePlectrohyla siopelaPlectrohyla thorectesScinax heyeriLeptodactylidaeCraugastor ancianoCraugastor andiCraugastor angelicusCraugastor coffeusCraugastor cruziCraugastor escocesCraugastor fecundusCraugastor fleischmanniCraugastor guerreroensisCraugastor merendonensisCraugastor omoaensisCraugastor polymniaeCraugastor saltuariusCraugastor stadelmaniCraugastor trachydermusCrossodactylus trachystomusCryptobatrachus niceforiCycloramphus ohausiEleutherodactylus bernaliEleutherodactylus emleniEleutherodactylus eneidaeEleutherodactylus glanduliferoidesEleutherodactylus jasperiEleutherodactylus karlschmidtiEleutherodactylus olanchanoEleutherodactylus orcuttiEleutherodactylus schmidtiEleutherodactylus semipalmatusEleutherodactylus zongoensisGastrotheca lauzuricaeHoloaden bradeiOdontophrynus moratoiParatelmatobius lutziiParatelmatobius mantiqueiraPhrynopus spectabilisTelmatobius cirrhacelisTelmatobius nigerTelmatobius vellardiRanidaeRana omiltemanaRana pueblaeRana tlaloci*RhinodermatidaeRhinoderma rufumCAUDATAPlethodontidaeBolitoglossa jacksoniBradytriton silusChiropterotriton magnipes*Ixalotriton parvaOedipina paucidentataPseudoeurycea aquaticaPseudoeurycea naucampatepetlPseudoeurycea nigromaculataPseudoeurycea praecellensThorius infernalisThorius magnipesThorius narismagnusThorius narisovalis
Chapter 9. <strong>Amphibian</strong>s of the Neotropical Realm 93The Neotropical Realm contains 60% (1,145) of all globally threatened amphibians. Theregion accounts for a massive 79% of CR species, 59% of the EN species, and 48% of theVU species in the world. In other words, unlike the case elsewhere, threatened Neotropicalamphibians are more likely to be in a higher category of threat (CR or EN), when comparedwith the global distribution of threatened species amongst categories. This tendency forthreatened species to be in CR and EN is probably explained in part by the effects of habitatloss on species with very small ranges, in particular in the Andes, Mesoamerica, and theCaribbean islands, and also the very severe impact of enigmatic declines that are probablydue to the synergistic effects of the pathogenic chytrid fungus and climate change, especiallythrough the higher elevations of the region.There have been seven recorded recent extinctions of amphibians in the NeotropicalRealm (21% of the global total): Atelopus ignescens (the Jambato Toad from Ecuador); Atelopuslongirostris (Ecuador); Atelopus vogli (Venezuela); Bufo periglenes (the famous GoldenToad from Monteverde, Costa Rica); Phrynomedusa fimbriata (southern Brazil); Craugastorchrysozetetes (Honduras); and Craugastor milesi (Honduras). With the exception of theGolden Toad, all of these were stream-associated species that occurred at middle to highelevations (above 700m asl) – the typical ecological profile of species that have experiencedrapid declines (Lips et al. 2003; Ron et al. 2003; Burrowes et al. 2004; Stuart et al. 2004; LaMarca et al. 2005). Some additional undescribed species are possibly extinct, especially inthe genus Atelopus (see Pounds et al. [2006] for details).In addition, 121 Critically Endangered species in the Neotropics are considered possiblyextinct. This represents 93% of the 130 possibly extinct species in the world, thus dramaticallyhighlighting the extinction crisis that has unfolded with the Neotropical amphibians.Most of the Critically Endangered (Possibly Extinct) species (listed in Table 1) share thesame ecological characteristics as those that have gone extinct. Of the 121 possibly extinctspecies, 22 are harlequin toads in the genus Atelopus (representing 29% of the describedspecies in the genus), which have experienced catastrophic declines, especially in southernMesoamerica, and in the Andes south at least to Peru (La Marca et al. 2005; Pounds et al.2006; and see Essay 9.1). Four genera concentrated in Mesoamerica also have large proportionsof possibly extinct species: Isthmohyla (36%), Plectrohyla (20%), Craugastor (14%)and Thorius (17%) (see, for example, Lips et al. [2004, 2006] and Mendelson et al. [2004]).In each of these cases, further work is likely to show that the percentage of possibly extinctspecies has been underestimated. Another genus for which the percentage of possibly extinctspecies might have been underestimated is Cycloramphus from southern Brazil (see Eterovicket al. [2005] and Heyer et al. [1988] for more details). The genus Telmatobius, which occursin the Andes from Ecuador southwards, is also subject to extensive disappearances, butmuch of this information is only just now becoming available, and for the most part is notyet included in these results (De la Riva 2005; and see Essay 9.2). Possibly extinct speciesrange very widely in the Neotropics, generally in mountainous regions from southern Mexico(for example, Plectrohyla cyanomma) south to Chile (for example, Rhinoderma rufum). Anumber of recent declines and possible extinctions in Colombia have come to light sincethe GAA data were collected (F. Castro pers. obs.).The percentage of DD species is very similar to the global average of 23%. As mentionedabove, many of these DD species are likely to be threatened, but many others could beLC, especially those that occur in poorly surveyed low-lying areas, such as in parts of theAmazon basin, and the Cerrado of Brazil.SPECIES RICHNESS AND ENDEMISMSpecies Richness and Endemism Across TaxaOf the 2,916 native amphibian species in the Neotropical Realm, 2,808 (or 96%) are endemicto the Neotropics (Table 2). All three orders of amphibians are represented in the NeotropicalRealm. The overwhelming majority of Neotropical amphibians (89%) are frogs and toads(Anura), 97% of which are endemic. All species of Neotropical caecilians (Gymnophiona),and 91% of Neotropical salamanders (Caudata), are endemic. Only 392 species (13%) aremembers of families that are endemic to the region, but this low percentage is really areflection of the fact that the very large family Leptodactylidae (accounting for 42% ofNeotropical amphibian species) marginally occurs in the Nearctic Region.Under current climatic conditions, there is less isolation between the Neotropical and NearcticRegions than there is between the Afrotropical and Palaearctic Regions, and there arepoints of contact between the two faunas along the Caribbean coast of Mexico, and Florida(although the transvolcanic belt in central Mexico does form a barrier to faunal dispersal).The result of this indistinct boundary is to reduce the level of endemism of each region.The families Leptodactylidae and Rhinophrynidae are nearly endemic to the Neotropics, andScaphiopodidae, Ambystomatidae, Amphiumidae and Sirenidae are almost endemic to theNearctic. Salamandridae is also a northern element that is only marginally present in theNeotropics. Of the 20 families that are native to the region, six are endemic. <strong>Amphibian</strong>family-level diversity is higher than in any other biogeographic realm, but endemism is lowerthan in the Afrotropics (where there are nine endemic families) because of the relative lackof isolation. From the perspective of amphibian biogeography, the region is almost definedby the distribution of the Neotropical frogs (family Leptodactylidae), which are presentthrough nearly all of Mexico, Central America, South America, and the Caribbean islands.Summaries of the amphibian fauna of the Neotropics are provided by Campbell (1999a),Duellman (1999) and Hedges (1999).There are 189 genera occurring in the region (41% of the global total), of which 157 arealso endemic. These endemic genera represent over one-third (34%) of the 460 amphibiangenera worldwide. The Neotropics, therefore, account for a larger proportion of the overalldiversity of amphibians at the species level than at the generic level. The most species-richgenus in the region is Eleutherodactylus (607 species, and 715 if the genus Craugastor isincluded within it, contra Crawford and Smith [2005]). At the opposite end of the spectrum,there are 46 monotypic genera endemic to the Neotropical Realm, which equates to justover one-third (33%) of the 126 monotypic genera of amphibians worldwide. Interestingly,nine of these monotypic genera are in the family Microhylidae, which is not particularlydiverse in the region. The 32 non-endemic genera in the Neotropics include 13 genera fromHylidae, four from Plethodontidae, three from Leptodactylidae, two each from Microhylidae,Scaphiopodidae and Sirenidae, and one each from Bufonidae, Ranidae, Rhinophrynidae,Ambystomatidae, Amphiumidae and Salamandridae. These non-endemics include thewidespread genera Bufo and Rana.Of the 20 amphibian families that occur in the Neotropics (42% of the global total), sixare endemic to the region: Allophrynidae, Brachycephalidae, Centrolenidae, Dendrobatidae,Rhinodermatidae, and Rhinatrematidae. 3 The characteristics of these families are providedin Chapter 1.Among the non-endemic families, the majority of Neotropical species are in Bufonidae,Hylidae, Leptodactylidae and Microhylidae. Of the Neotropical Bufonidae, 121 species(47% of those occurring in the region) are within the widespread genus Bufo. There are 77The Strawberry Poison Frog Dendrobatespumilio (Least Concern) is a poison frog fromthe Family Dendrobatidae, a Family famousfor the stunning coloration of its species. Thisspecies lives on the floor of lowland rainforestin Nicaragua, Costa Rica and Panama. Thefemales lay egg clutches on the forest floor,and carry the larvae, after hatching, to waterfilledbromeliads, where they complete theirdevelopment. © Piotr NaskreckiThe Burrowing Toad Rhinophrynus dorsalis(Least Concern) is the only member of theFamily Rhinophrynidae. It is a lowland speciesranging from southern Texas to Costa Rica. Itcan be found in forest, thorn scrub, savannah,and cultivated areas with friable soils.It is usually subterranean, except after heavyrains, when it emerges to breed explosively intemporary pools. © Paddy RyanTable 2. The number of Neotropical amphibiansin each taxonomic Family present inthe region.Figure 2. The species richness of amphibians in the Neotropical Realm, with darker colourscorresponding to regions of higher richness. Colour scale based on 10 quantile classes;maximum richness equals 144 species.FamilyNative species(endemics toregion)Percentage of Percentage ofspecies in region species in familythat are endemic that are endemicto regionNative genera(endemics toregion)Percentage ofgenera in regionthat are endemicPercentage ofgenera in familythat are endemicto regionAnuraAllophrynidae 1 (1) 100 100 1 (1) 100 100Brachycephalidae 8 (8) 100 100 1 (1) 100 100Bufonidae 256 (240) 94 50 13 (12) 92 35Centrolenidae 138 (138) 100 100 3 (3) 100 100Dendrobatidae 234 (234) 100 100 9 (9) 100 100Hylidae 610 (585) 96 73 46 (33) 72 67Leptodactylidae 1,235 (1,215) 98 98 55 (52) 95 95Microhylidae 56 (52) 93 12 19 (17) 89 25Pipidae 7 (7) 100 23 1 (1) 100 14Ranidae 34 (17) 50 3 1 (0) 0 0Rhinodermatidae 2 (2) 100 100 1 (1) 100 100Rhinophrynidae 1 (0) 0 0 1 (0) 0 0Scaphiopodidae 3 (0) 0 0 2 (0) 0 0TOTAL ANURA 2,585 (2,499) 97 48 153 (130) 85 36CaudataAmbystomatidae 15 (9) 60 30 1 (0) 0 0Amphiumidae 1 (0) 0 0 1 (0) 0 0Plethodontidae 221 (210) 95 58 14 (10) 71 34Salamandridae 2 (0) 0 0 1 (0) 0 0Sirenidae 2 (0) 0 0 2 (0) 0 0TOTAL CAUDATA 241 (219) 91 41 19 (10) 53 16GymnophionaCaeciliidae 81 (81) 100 72 15 (15) 100 58Rhinatrematidae 9 (9) 100 100 2 (2) 100 100TOTAL GYMNOPHIONA 90 (90) 100 52 17 (17) 100 52TOTAL ALL AMPHIBIANS 2,916 (2,808) 96 47 189 (157) 83 34
94Threatened <strong>Amphibian</strong>s of the WorldFamily EX CR EN VU NT LC DD Total numberof speciesNumberThreatenedor Extinct% Threatenedor ExtinctAnuraAllophrynidae 0 0 0 0 0 1 0 1 0 0Brachycephalidae 0 0 0 1 1 1 5 8 1 13Bufonidae 4 73 29 30 10 77 33 256 136 53Centrolenidae 0 6 16 29 10 28 49 138 51 37Dendrobatidae 0 20 29 16 14 58 97 234 65 28Hylidae 1 65 58 35 24 312 115 610 159 26Leptodactylidae 2 145 246 172 61 350 259 1,235 565 46Microhylidae 0 0 2 5 2 37 10 56 7 13Pipidae 0 0 1 0 0 6 0 7 1 14Ranidae 0 5 2 7 4 14 2 34 14 41Rhinodermatidae 0 1 0 1 0 0 0 2 2 100Rhinophrynidae 0 0 0 0 0 1 0 1 0 0Scaphiopodidae 0 0 0 0 0 3 0 3 0 0TOTAL ANURA 7 315 383 296 126 888 570 2,585 1,001 39CaudataAmbystomatidae 0 8 2 0 0 3 2 15 10 67Amphiumidae 0 0 0 0 0 1 0 1 0 0Plethodontidae 0 35 70 28 14 28 46 221 133 60Salamandridae 0 0 1 0 0 1 0 2 1 50Sirenidae 0 0 0 0 0 2 0 2 0 0TOTAL CAUDATA 0 43 73 28 14 35 48 240 144 60GymnophionaCaeciliidae 0 0 0 0 0 29 52 81 0 0Rhinatrematidae 0 0 0 0 0 4 5 9 0 0TOTAL GYMNOPHIONA 0 0 0 0 0 33 57 90 0 0TOTAL ALL AMPHIBIANS 7 358 456 324 140 956 675 2,915 1,145 39Table 3. The number of species within eachIUCN Red List Category in each Family andOrder in the Neotropical Realm. Introducedspecies are not included.Figure 3. a) The richness of threatenedamphibians in the Neotropical Realm, withdarker colours corresponding to regions ofhigher richness. Colour scale based on 10quantile classes; maximum richness equals42 species. b) The richness of CR amphibiansin the Neotropical Realm. Colour scale basedon five quantile classes; maximum richnessequals 18 species.a)b)species in Atelopus, 19 in Melanophryniscus, and 10 in Rhamphopryne, but the remainingnine genera have small numbers of species. Most of the Neotropical species breed by larvaldevelopment, but breeding (where it is known) is by direct development in Metaphryniscus,Oreophrynella and Osornophryne and unknown in Andinophryne, Crepidophryne, Rhamphopryneand Truebella. The family is widely distributed through most of the Neotropics, withhighest species richness in the equatorial regions.Hylidae is overwhelmingly a Neotropical family, the main radiation outside the regionoccurring in Australia and New Guinea. At the species level, 73% of the family (585species) is endemic to the Neotropics, where it occurs widely through most of the region(excluding Chile), with especially high species richness in Brazil (over 300 species, withvery high diversity in the Atlantic Forest). There are over 160 species in Mesoamerica. Twosubfamilies, Phyllomedusinae and Hylinae, occur in the Neotropics (and see Essay 1.5).The genera have recently been extensively revised (Faivovich et al. 2005), and under thisnew arrangement, the genera Dendropsophus, Scinax, Hypsiboas, Plectrohyla, Hyloscirtus,Phyllomedusa, Hyla and Bokermannohyla all have more than 20 species. The Neotropicalhylids are associated with many different habitats, but species richness is highest in forests,and all known breeding is by larval development.The family Leptodactylidae, which is almost endemic to the Neotropics, is by far thelargest family of amphibians worldwide. It ranges widely throughout the region, with thehighest species richness in the tropical Andes from Venezuela and Colombia south to Bolivia(over 550 species), with significant diversity in Brazil (nearly 300 species), Mesoamerica (c.160 species), the Caribbean islands (c. 160 species) and the Southern Cone (c. 130 species).The family includes the largest genus of vertebrates, Eleutherodactylus (607 species) with thefollowing genera including more than 20 species: Craugastor, Leptodactylus, Gastrotheca,Telmatobius, Physalaemus, Phrynopus, Cycloramphus, and Hylodes. The family includesspecies that breed by direct development and larval development. Although these frogsoccur in many habitats, species richness is highest in forests. 4The Neotropical Microhylidae species are widely distributed within the region, fromMexico south to central Argentina, but not on the Caribbean islands (except Trinidad). Withthe exception of Chiasmocleis (19 species), all genera are small. Most species occur at lowelevations, with highest species richness in the equatorial regions. In the Neotropics, allspecies breed by larval development, and many are subterranean when not breeding.The Neotropical Ranidae species (all of which are in the widespread genus Rana) are alllarval developers, and occur predominantly in Mesoamerica, with three species reaching SouthAmerica, and none on the Caribbean islands (except Trinidad). Of the remaining families, thehighly aquatic Pipidae, with a single genus in the region, Pipa, ranges from Panama southto Bolivia. Scaphiopodidae, Amphiumidae, Salamandridae and Sirenidae are Nearctic taxathat only marginally occur in the northern Neotropics. Ambystomatidae (mole salamanders)is also a Nearctic element, but there is an important radiation of species in central Mexico,including the famous Axolotl Ambystoma mexicanum (CR). Ambystomatidae breed by larvaldevelopment, and some retain their aquatic larval features throughout their life cycles.Most Neotropical salamanders are in the large family Plethodontidae (lungless salamanders).This family has its highest species richness in the Nearctic, but there are c. 110 speciesin Mexico, c. 40 in Guatemala, c. 25 in Honduras, c. 40 in Costa Rica, c. 25 in Panama, butonly 28 in the whole of South America (12 of these being endemic to Colombia). The largestNeotropical genus is Bolitoglossa (91 species), with Pseudoeurycea, Oedipina and Thoriuseach having more than 20 species. Lungless salamanders occur as far south as Bolivia. Withthe possible (but even then unlikely) exception of a single species (Pseudoeurycea aquatica),all Neotropical species breed by direct development, and almost all are associated withforest habitats (and see Essay 9.3).The caecilian family Caeciliidae is very poorly known in the Neotropics, as in other partsof the world. A total of 81 species (in 15 genera) is recorded from the region, comprising 72%of the family at the species level. Species richness is highest in the Amazon Basin, with only16 species in Mesoamerica (as far north as southern Mexico), and four species reachingnorthern Argentina. The species exhibit a wide variety of reproductive modes, from larvaland direct development, to live-bearing. The majority are subterranean species in the forestfloor, but certain species (in the genera Atretochoana, Potomotyphlus and Typhlonectes) areaquatic, sometimes referred to as “rubber eels”.Not surprisingly, the larger families – Bufonidae, Centrolenidae, Dendrobatidae, Hylidae,Leptodactylidae and Plethodontidae – have the largest absolute numbers of globally threatenedspecies (Table 3). The percentage of threatened species ranges greatly between thefamilies, from zero for the Allophrynidae, Rhinophrynidae, Scaphiopodidae, Amphiumidae,Sirenidae, Caeciliidae, and Rhinatrematidae, to 100% for the endemic Rhinodermatidae ofChile and Argentina. The zero percentages of threatened species in the caecilian families isprobably because these species are so poorly known (with >50% of species Data Deficientin both the Caeciliidae and Rhinatrematidae). The percentages of threatened species arealso very high in the salamander families Ambystomatidae (67% - reflecting the seriousconservation problems on the Mexican plateau) and Plethodontidae (60% - reflecting the poorstate of forest conservation in the pine-oak regions of Mexico, Guatemala, and Honduras).The percentage levels of threat are also high (>30%) in the Bufonidae (53% - reflecting, inpart, the devastating declines in the genus Atelopus), Leptodactylidae (46% - with severalgenera, including Craugastor, Eleutherodactylus and Telmatobius showing high levels ofthreat), Ranidae (41%), and Centrolenidae (37%).Some of the larger families have more species in the Endangered category than inCritically Endangered or Vulnerable (e.g., Dendrobatidae, Leptodactylidae, Plethodontidae).However, Centrolenidae show a similar pattern to birds and mammals (Baillie et al. 2004),with least in Critically Endangered and most in Vulnerable. Conversely, Bufonidae and Hylidaehave most in Critically Endangered and least in Vulnerable, showing how severely impactedthese families have been by recent dramatic declines (indeed, 55% of threatened NeotropicalBufonidae are Critically Endangered). Among the smaller families, there is also a highpercentage of Critically Endangered species in Rhinodermatidae and Ambystomatidae.Geographic Patterns of Species Richness andEndemismA map of overall species richness of amphibians in the Neotropical Realm (Figure 2), showsthat species richness is highest in the tropical regions, notably Costa Rica and Panama,the Pacific lowlands of western Colombia and north-western Ecuador, the Guianan Shield,the Atlantic Forest of southern Brazil, and in particular in the Amazon Basin (especially inthe west). Species richness is lowest in more temperate regions (Mexico, Argentina andChile), on the Caribbean islands, and especially in arid regions, such as northern Mexicoand northern Chile (there being no amphibians at all in most of the Atacama Desert region).The higher taxon diversity is particularly low in the Caribbean islands, where there are justfour families and five genera (compared with 15 families and 67 genera in Mesoamerica).The vast majority (88%) of the Caribbean’s amphibian species belong to just one genus,Eleutherodactylus. No salamanders or caecilians occur on these islands.
Chapter 9. <strong>Amphibian</strong>s of the Neotropical Realm 95BrazilColombiaEcuadorPeruMexico*VenezuelaBoliviaPanamaCosta RicaArgentinaGuatemalaGuyanaHondurasFrench GuianaSurinameParaguayNicaraguaCubaChileHaitiUnited States of America*UruguayBelizeDominican RepublicTrinidad and TobagoEl SalvadorJamaicaPuerto RicoVirgin Islands (British)DominicaGuadeloupeVirgin Islands (US)GrenadaMartiniqueSt Vincent and the GrenadinesAntigua and BarbudaBahamasCayman IslandsMontserratAnguillaBarbadosNetherlands AntillesSt Kitts and NevisSt Lucia0 200 400 600 800Number of speciesEndemics Non-endemicsJamaicaCubaPuerto RicoMexico*ChileBrazilVenezuelaHaitiGuadeloupeColombiaPeruUnited States of America*EcuadorHondurasDominican RepublicGrenadaMartiniqueSt Vincent and the GrenadinesArgentinaGuatemalaBoliviaDominicaVirgin Islands (US)Costa RicaVirgin Islands (British)Trinidad and TobagoPanamaGuyanaSurinameFrench GuianaUruguayNicaraguaParaguayBelize0 20 40 60 80 100Percentage of endemic speciesColombiaMexico*EcuadorBrazilPeruGuatemalaVenezuelaCosta RicaHondurasPanamaCubaHaitiDominican RepublicArgentinaBoliviaChileJamaicaPuerto RicoNicaraguaEl SalvadorTrinidad and TobagoBelizeGuyanaUruguayFrench GuianaDominicaGuadeloupeSurinameUnited States of America*Virgin Islands (British)GrenadaMartiniqueMontserratSt Vincent and the GrenadinesVirgin Islands (US)HaitiDominican RepublicJamaicaCubaPuerto RicoMexico*GuatemalaDominicaGuadeloupeMontserratHondurasVirgin Islands (British)EcuadorChileCosta RicaGrenadaMartiniqueSt Vincent and the GrenadinesColombiaPanamaEl SalvadorTrinidad and TobagoVirgin Islands (US)VenezuelaPeruArgentinaBelizeBrazilNicaraguaBoliviaUruguayGuyanaUnited States of America*French GuianaSuriname0 50 100 150 200 250Number of threatened speciesEndemics Non-endemicsFigure 4 Figure 5 Figure 6 Figure 70 20 40 60 80 100Percentage of species threatenedAs with other parts of the tropics, Figure 2 probably does not reflect genuine patternsof amphibian species richness everywhere in the region, due to uneven survey effort.In particular, species richness is probably under-sampled in the Guianan Shield, in theVenezuelan, Colombian and Bolivian Amazon, in the Peruvian and Bolivian Andes, and inthe Cerrado of Brazil. However, sampling appears to be less uneven than in the Old Worldtropics (similar maps for the Afrotropical, Indomalayan and Australasian Realms makemuch less overall biogeographic sense). New species continue to be discovered at a rapidrate almost everywhere in the Neotropics, but nevertheless the overall patterns of speciesrichness are probably reasonably clear.Over 85% of the threatened amphibian species in the Neotropics occur in the regionfrom southern Mexico to Ecuador and northern Venezuela, and on the Greater Antilles(Cuba, Hispaniola, Jamaica and Puerto Rico) (see Figure 3a). This region represents by farthe greatest concentration of threatened amphibian species anywhere in the world. Withinthis region there are peaks of threatened species in montane areas in southern Mexico,Guatemala, Honduras, Costa Rica, western Panama, Cuba, Hispaniola, Jamaica, PuertoRico, and the Andes of Venezuela, Colombia and Ecuador. Outside this region, the largestconcentration of threatened amphibian species in the Neotropics is in the Atlantic Forestsof southern Brazil. There are lesser concentrations in the Peruvian and Bolivian Andes, andin the austral forest zone of Chile. It is possible that, due to the poor state of knowledge,the levels of threat have been under-estimated in the Peruvian and Bolivian Andes; further,with very recently recorded declines in Telmatobius species (De la Riva 2005), and probablyin other species too, not yet included in our data, it is likely that a new concentration ofthreatened species will soon be identified in the Andes running from Peru south to Bolivia,Chile, and Argentina. These concentrations of threatened species correlate with those forother taxa (Baillie et al. 2004). These geographic concentrations reflect the topographicallydiverse (usually montane) parts of the region where amphibians have naturally smallranges, and where habitat destruction is ongoing (and in central and southern Peru is inpart a reflection of the over-harvesting of some frogs (e.g., in the genus Telmatobius) forhuman consumption). However, these are also the places where rapid population declinesand disappearances have been noted due to chytridiomycosis and climate change (Heyeret al. 1988; La Marca and Reinthaler 1991; Young et al. 2001; Lips et al. 2003, 2004, 2006;Ron et al. 2003; Burrowes et al. 2004; Mendelson et al. 2004; De la Riva 2005; Eterovick etal. 2005; La Marca et al. 2005; Pounds et al. 2006).The concentrations of Critically Endangered species (Figure 3b) broadly match thoseof threatened species as a whole. The greatest concentrations of these most severelythreatened species are in southern Mexico (in particular Veracruz and Oaxaca), Guatemala,Honduras, Costa Rica, western Panama, the Ecuadorian Andes, and Haiti (especially theMassif de la Hotte and Massif de la Selle). Lesser concentrations of Critically Endangeredspecies are found in the Andes of Venezuela, Colombia, Peru, southern Brazil, central Chile,Puerto Rico, Dominican Republic, Jamaica, and eastern Cuba (although recent data from theColombian Andes suggest that the next update of the GAA might reveal this region to be amajor concentration of Critically Endangered species (F. Castro pers. obs.).Species Richness and Endemism within Countries<strong>Amphibian</strong>s occur naturally in every mainland country in Mesoamerica and South America,and on all but the smallest Caribbean islands (Figure 4). However, only one extant speciesoccurs naturally in St. Lucia, St. Kitts and Nevis, the Netherlands Antilles, Barbados andAnguilla, and only two on Antigua and Barbuda, the Bahamas, the Cayman Islands andMontserrat. There are no indigenous amphibians on the Galapagos Islands.The two countries with the largest number of species in the Neotropical Realm are Brazil(751 species; and see Essay 9.4) and Colombia (697 species; see Essay 9.5). There is alsovery high species richness in Ecuador (447 species), Peru (411), Mexico (336), Venezuela (298)and Bolivia (209). Brazil, Colombia, Ecuador, Peru, and Mexico are the top five countries inthe world in terms of amphibian species richness. Another eight Neotropical countries havemore than 100 species (Panama – 195, Costa Rica – 179, Argentina – 157, Guatemala – 138,Guyana – 118, Honduras – 116, French Guiana – 104, Suriname – 103).These figures are, of course, a reflection of current knowledge, and as mentioned earlier,certain regions and countries have been better studied than others. In certain places, theexisting knowledge has been well summarized in review literature, and in books, including:Mexico (Flores-Villela 1993; Flores-Villela et al. 1995; Calderon Mandujano et al. 2005);Yucatán (Campbell 1999b; Lee 1996, 2000); Guatemala (Lee 2000, Campbell 1999b, 2001);Belize (Campbell 1999b, Lee 2000); Honduras (McCranie and Wilson 2002; McCranie et al.2006); El Salvador (Köhler et al. 2005); Nicaragua (Köhler 2001); Costa Rica (Savage 2002;Guyer and Donnelly 2005); Panama (Ibáñez et al. 1999, 2000); Colombia (Ruiz-Carranza et al.1996); Venezuela (La Marca 1992, 1997; Barrio Amorós 2004); Ecuador (Coloma 2005); Peru(Lehr 2002); Bolivia (De la Riva et al. 2000, Köhler 2000); Argentina (Cei 1980, 1987; Lavilla etal. 2000; Lavilla and Cei 2001); Chile (Veloso and Navarro 1988; Formas 1995); Brazil (SociedadeBrasileira de Herpetologia 2004); the Guianas (Hoogmoed 1979); the Guianas (Señaris andMacCulloch 2005); French Guiana (Lescure and Marty 2000); the Caribbean islands (Crother1999; Schwartz and Henderson 1988; Powell and Henderson 1999); the Lesser Antilles(Malhotra and Thorpe 1999); Guadeloupe (Breuil 2002); Netherlands Antilles (Powell et al.2005; van Buurt 2005); and Trinidad and Tobago (Murphy 1997). There have also been someimportant reviews of particular taxonomic groups, for example on the Hylidae of Mesoamerica(Duellman 2001), on the western Ecuadorian Eleutherodactylus (Lynch and Duellman 1997),and Neotropical plethodontid salamanders (Wake and Lynch 1976; Wake 2003).Brazil has more endemic species (489) than any other country in the Neotropics (Figure4), or in the world, followed by Colombia (337), Mexico (234), Peru (181), Ecuador (159), andVenezuela (155). More than 50 endemic species are also known from Cuba and Bolivia. Interms of percentage of the fauna being endemic, the highest endemism is on the GreaterAntilles (Figure 5), with Jamaica at 100%, Cuba at 97% and Puerto Rico at 78%. Althoughthe percentage endemism in Haiti and the Dominican Republic is lower, for the island ofHispaniola as a whole it is 100%. On the mainland the highest percentage endemism isfound in Mexico (70%), Chile (69%), and Brazil (65%), with levels over 40% in Venezuela,Haiti, Guadeloupe, Colombia, and Peru (Figure 5).Threatened species occur in 35 of the 44 countries in which there are native amphibians(Figure 6). In fact, threatened species are concentrated in relatively few countries. Colombiahas more threatened amphibian species than any other country in the Neotropics (209),followed by Mexico (190), Ecuador (163) and Brazil (110). A further 12 countries have 20or more threatened species: Peru, Guatemala, Venezuela, Costa Rica, Panama, Honduras,Cuba, Haiti, Dominican Republic, Argentina, Bolivia and Chile. The percentage of threatenedamphibian species is highest in the Greater Antilles (Figure 7), with Haiti at a staggering92%, the Dominican Republic at 86%, Jamaica at 81%, Cuba at 80% and Puerto Rico at72%. Overall, the percentage threat levels for amphibians on the Caribbean islands areworse than anywhere else in the world, and is a reflection of the very poor state of habitatconservation, coupled with chytridiomycosis in some places (see Essay 9.6) (of course, inthese relatively species-poor countries, even a limited number of threatened species canresult in a high percentage of species at risk of extinction). The highest percentage ofthreatened species on the mainland is in Mexico (57%), closely followed by Guatemala(55%), with a further 12 countries having levels greater than 30%: Guadeloupe, Dominica,Figure 4. The number of amphibians presentin and endemic to each Neotropical country.*denotes countries not entirely within theNeotropical Realm, hence only the specieswhose ranges fall within the region areincluded.Figure 5. Percentage of species endemic toeach Neotropical country. *denotes countriesnot entirely within the Neotropical Realm,hence only the species whose ranges fallwithin the region are included.Figure 6. The number of threatened amphibianspresent in and endemic to each Neotropicalcountry. Countries with no threatened speciesare not included in the diagram. *denotescountries not entirely within the NeotropicalRealm, hence only the species whose rangesfall within the region are included.Figure 7. Percentage of native species that arethreatened. Countries with no threatened speciesare not included in the diagram. *denotescountries not entirely within the NeotropicalRealm, hence only the species whose rangesfall within the region are included.Rhinatrema bivittatum (Least Concern) is acaecilian from the small Family Rhinatrematidae,occurring in Brazil, Guyana, Suriname andFrench Guiana. It is a subterranean species inlowland rainforest, and is presumed to breedin streams by larval development, like othermembers of its Family. © Peter Stafford
96Threatened <strong>Amphibian</strong>s of the WorldHabitat typeNumber ofspecies ineach habitat% of allspeciesoccurring inthe habitatThreatenedor Extinctspecies% of speciesoccurringin habitat thatare Threatenedor ExtinctForest 2,478 85 1,029 42All tropical forest 2,407 83 1,007 42Lowland tropical forest 1,405 48 427 30Montane tropical forest 1,494 51 773 52Savannah 200 7 6 3Grassland 429 15 120 28Shrubland 343 12 73 21Secondary terrestrial habitats 621 21 110 18Flowing freshwater 1,133 39 505 45Marsh/swamp 168 6 23 14Still open freshwater 746 26 116 16Arid and semi-arid habitats 25 1 5 21Table 4. The habitat preferences of amphibians in the Neotropical Realm.ForestSavannahGrasslandShrublandSecondary terrestrial habitatsFlowing freshwaterNumber of species% of species in habitat that are threatenedThe Upland Coqui Eleutherodactylus portoricensis(Endangered) is one of more than 600species in the genus Eleutherodactylus in theFamily Leptodactylidae. It occurs in mesic,upland broadleaf forests, and calls frombushes and tree trunks, and has not beenrecorded outside forest habitat. The eggsare laid in bromeliads, and these developdirectly without a free-living larval stage.© Alejandro SanchezMontserrat, Honduras, British Virgin Islands, Ecuador, Chile, Costa Rica, St Vincent and theGrenadines, Martinique, Grenada, and Colombia (Figure 7). Overall, percentage threat levelsare high in the Neotropics compared with the rest of the world, but the overall levels ofthreat do appear to be lower in the Guianan Shield and Amazonian Brazil.Assessments of the conservation status of Neotropical amphibians at national level arestill at an early stage, but there have been assessments in El Salvador (Greenbaum andKomar 2005), Panama (Young et al. 1999), Venezuela (Rodríguez and Rojas-Suárez 1995),Brazil (Ministério do Meio Ambiente 2003), Argentina (Lavilla et al. 2000), Chile (Glade 1993)and Bolivia (Reichle 2006). An official Mexican red list of amphibians is in preparation (thedraft is on http://www.semarnat.gob.mx/leyesynormas/Normas%20Oficiales%20Mexicanas%20vigentes/NOM-ECOL-059-2001.pdf. Hedges (2006) provided an overview of theconservation of Caribbean amphibians.Some countries have particularly high proportions of Critically Endangered species. Themost extreme example is Haiti, where 31 species are CR, 10 are EN and five are VU (out of atotal amphibian fauna of 50 species). In the neighbouring Dominican Republic, the situationis marginally less severe (10 CR, 16 EN, 5 VU out of 36 species), though still very serious.Puerto Rico has 7 CR, 5 EN and 1 VU out of a fauna of 18 species. On the mainland, things areparticularly bad in Honduras (30 CR, 24 EN, 19 VU out of 116 species), and also very disturbingin Chile (9 CR, 4 EN, 7 VU out of 55), Mexico (69 CR, 80 EN, 41 VU out of 335), Guatemala (27CR, 30 EN, 19 VU out of 140), and Costa Rica (19 CR, 22 EN, 20 VU out of 179).In general, the levels of threat are worse in Mesoamerica than South America, becausehabitat loss has in general been more severe in the former, and also chytridiomycosis hasbeen especially severe in this region (and see Essay 9.7). The situation is also serious anddeteriorating in the Andean countries, where there is also significant habitat loss, andchytridiomycosis is currently spreading (De la Riva 2005; La Marca et al. 2005). However,because most of the Andean countries also have large, intact Amazonian amphibian faunas,the percentage of threatened species is not usually as high as in some of the Mesoamericancountries. The percentage of threatened species in Peru and Bolivia is almost certainlyunderestimated due to paucity in knowledge.HABITAT AND ECOLOGYHabitat PreferencesMost Neotropical amphibians (85%) occur in forests, and only just over 20% can survivein secondary terrestrial habitats (Table 4; Figure 8). Compared with Afrotropical species,for example, Neotropical amphibians appear to be less able to survive in disturbed areas.They also appear to make more use of flowing water habitats than still, open freshwaterhabitats, or marshes and swamps. This is presumably a reflection of the great diversity ofstream-associated species in the Andes and Mesoamerica. Forest-dwelling amphibiansare more likely to be threatened than those occurring in any other terrestrial habitats, withover 40% of them being globally threatened. A similar percentage of amphibians associatedwith flowing water (generally streams) is threatened. Forest-associated amphibians thatlive along streams are particularly likely to be threatened, a combination that has also beenassociated with rapid declines worldwide (Stuart et al. 2004).The percentage of threatened species varies considerably between different types offorest. In montane tropical forest, over 50% of known species are threatened, compared withjust over 30% in lowland tropical forest. These figures probably reflect smaller range sizes ofmontane species, the lack of effective habitat conservation measures in many mountainousparts of the region, and the high incidence of chytridiomycosis in montane areas (Lips etal. 2003; Burrowes et al. 2004). <strong>Amphibian</strong>s occurring in savannahs, marshes and swamps,still open freshwater habitats, and secondary terrestrial habitats are much less likely to bethreatened than those occurring in other habitats (Table 4; Figure 8).Reproductive ModesOf those species where reproduction is known or reasonably inferred, larval development isthe most common reproductive mode in the Neotropics (59% of species), compared with 38%for direct development and 1% live-bearing (this compares with the global picture of 68%larval development, 30% direct development, and 1% live-bearing) (Table 5). The NeotropicalMarsh/swampStill open freshwaterArid and semi-arid habitatsReproductive mode All species Threatened orExtinct speciesTable 5. Neotropical amphibians categorized by reproductive mode.amphibians clearly have a larger proportion of direct-developing species than the globalaverage, and this is largely because of the enormous genus Eleutherodactylus (607 species),all but one of which (the possibly extinct Eleutherodactylus jasperi from Puerto Rico) arebelieved to be direct developers, but also because of other large genera such as Craugastorand Phrynopus. In addition, all but one of the 221 Neotropical plethodontid salamanders arebelieved to be direct developers. Although live-bearing is uncommon, the Neotropics accountfor 39% of the world’s known live-bearing amphibians (all but one of these live-bearingspecies are caecilians, with the exception of the aforementioned E. jasperi).In the Neotropics, the percentage of globally threatened direct-developing amphibiansis much higher than for larval-developing species. This is probably because direct-developingspecies have smaller ranges on average, and are therefore more seriously impactedby habitat loss. This result is interesting because chytridiomycosis appears to have itsgreatest impact on stream-associated, usually larval-developing species (Lips et al. 2003)(though it should be noted that some stream-associated species, such as the species inthe Craugastor rugulosus group, are direct-developers, and have been severely impacted bychytridiomycosis). The low percentage of threatened live-bearing species in the Neotropicscould be a reflection of the high number of Data Deficient caecilians.MAJOR THREATS0 800 1,600 2,400 0 15 30 45Figure 8. The habitat preferences of Neotropical amphibians. The plot on the left-hand sideshows the number of species in the region in each habitat type. On the right-hand side, thepercentage of these species which are threatened is given.% Threatenedor ExtinctDirect development 1,105 584 53Larval development 1,719 555 32Live-bearing 24 1 4Not known 68 5 7Habitat loss is overwhelmingly the major threat to amphibians in the Neotropics (Table 6;Figure 9), affecting nearly 90% of the threatened species. The two other most commonlyrecorded threats are pollution and disease (both affecting nearly 30% of threatened species).With the exception of fire (17%), all other threats are of minor importance. Over-utilizationappears to be a minor threat in the region as a whole (at least, based on current knowledge),but it can have a serious impact on some species (e.g., on the genus Telmatobius in Peru,and probably elsewhere).In terms of the types of habitat loss that are impacting amphibians in the Neotropics,the impacts of expanding croplands (affecting just over 70% of threatened species) andvegetation removal (mainly logging) (64%) are the most severe, but urbanization / industrialdevelopment and livestock grazing are each affecting more than 40% of threatened species.However, the importance of different types of habitat loss varies within the region. Forexample, removal of vegetation for charcoal production is a major mechanism of habitatloss in the Greater Antilles, especially in Haiti (Hedges 2006).The distribution of chytridiomycosis in the Neotropics is only gradually becomingclear. Ron (2005) documented confirmed records of the disease widely in Mesoamerica(southern Mexico, Guatemala, Costa Rica, Panama), the Caribbean (Dominican Republic,Puerto Rico), and north-western South America (Ecuador, Venezuela). More recently the
Chapter 9. <strong>Amphibian</strong>s of the Neotropical Realm 97Threat type Threatened species % Threatened SpeciesHabitat loss 1,007 89Agriculture – Crops 806 71Agriculture – Tree plantations 143 13Agriculture – Livestock 478 42Timber and other vegetation removal 728 64Urbanization and industrial development 538 47Invasive species 81 7Utilization 34 3Accidental mortality 3 0.3Pollution 336 29Natural disasters 73 6Disease 324 28Human disturbance 101 9Changes in native species dynamics1 0.1(excluding disease)Fire 197 17Table 6. The major threats to globally threatened amphibians in the Neotropical Realm.Only present threats to species are tallied.All habitat lossInvasive speciesUtilizationAccidental mortalityPersecutionPollutionNatural disastersDiseaseHuman disturbanceChanges in native sp. dynamicsFire0 20 40 60 80 100Percentage of threatened species affectedFigure 9. The major threats impacting threatened amphibians in the Neotropical Realm.Population Trend Number of species % of speciesDecreasing 1313 45Stable 725 25Increasing 15 0.5Unknown 856 29Table 8. The population trends for all extant Neotropical amphibians.The Titicaca Water Frog Telmatobius culeus(Critically Endangered) in the Family Leptodactylidaeis endemic to Lake Titicaca in Peruand Bolivia. It is a wholly aquatic species,breeding in shallow waters close to theshoreline. It was previously common, but hasdeclined massively due to the over-harvestingof adults, the presumed predation of larvaeby introduced trout, water extraction fromthe lake, and domestic and agricultural waterpollution. © Mikael LundbergPurpose Subsistence Sub-national/NationalTable 7. The purposes for which amphibians are used in the Neotropical Realm. The numbersin brackets are the number of species within the total that are threatened species. *One ofthe species in the brackets is actually now listed as Extinct.disease has been recorded more widely in the continent, for example in southern Peru(Seimon et al. 2005), southern Brazil (Carnaval et al. 2005) and the Pampas region ofArgentina (Herrera et al. 2005). The earliest records of the fungus in the region date fromthe early 1980s, and coincide roughly with the onset of amphibian declines (Carnaval etal. 2006; Lips et al. 2006).A total of 181 species are recorded as being used for some or other purpose in the region(61 of which are threatened (though not necessarily by use) and one now considered Extinct).The most common reason for harvesting Neotropical amphibians is for the international pettrade, followed by local human consumption (Table 7). Well-known examples of utilizationin the region include the pet trade in colourful, poisonous frogs in the genera Dendrobates,Epipedobates and Phyllobates, and the horned frogs (in the genus Ceratophrys), andharvesting Telmatobius frogs for local human consumption in parts of the Andes. Much ofthe harvesting of amphibians in the region is not considered to constitute a major threatto the species, but there are exceptions (for example, in the case of several species ofTelmatobius). Of the 180 extant species being harvested, utilization is considered to be amajor threat for 71 (of which only 34 are threatened species for which harvesting is believedto be contributing to deterioration in their status).POPULATION STATUS AND TRENDSEstimates of Population TrendsRegional/InternationalNumberof speciesFood – human 41 (20) 16 (7) 5 (1) 44 (21)Food – animal 1 (0) 1 (1) 0 2 (1)Medicine – human and15 (12*) 5 (2) 4 (1) 19 (13*)veterinaryPoisons 5 (0) 0 2 (0) 7 (0)Wearing apparel, accessories 1 (0) 0 0 1 (0)Handicrafts, curios, etc. 2 (0) 1 (0) 1 (0) 2 (0)Pets, display animals 10 (2) 29 (8) 125 (38*) 132 (38*)Research 0 6 (1) 6 (1) 11 (1)Specimen collecting 0 0 1 (1) 1 (1)A summary of the inferred population trends of Neotropical amphibians is presented in Table8. In the absence of more rigorous population monitoring studies, these trends are largelyinferred from trends in the state of the habitats on which the species depend (though in somecases, dramatic population declines have been noted). Species with decreasing populationsare typically forest-dependent species that can tolerate little disturbance to their habitats.The overall trends of Neotropical amphibians are very similar to the global results.FamilyNumber of Percentagespecies in of species“rapid decline” in family in“rapid decline”“Rapidly declining” speciesNumber ofspecies in“enigmaticdecline”Percentageof speciesin family in“enigmaticdecline”Bufonidae 89 35 76 30Centrolenidae 4 3 4 3Dendrobatidae 17 7 11 5Hylidae 53 9 39 6Leptodactylidae 110 9 53 4Ranidae 6 18 4 12Rhinodermatidae 1 50 1 50Ambystomatidae 5 36 0 0Plethodontidae 20 9 6 3The Neotropics are home not only to nearly 50% of the world’s amphibian species, but tonearly two-thirds (65%; 305 species) of the world’s “rapidly declining” species (Stuart etal. 2004) (a full list of all “rapidly declining” species is provided in Appendix IV and includestheir occurrence within each of the regions). The Neotropics are the global epicentre foramphibians in catastrophic decline. Twelve of these 305 species are in decline due to overexploitation,99 due to reduced habitat, and 194 due to so-called “enigmatic declines”,which are currently attributed to chytridiomycosis and climate change (Lips et al. 2006;Pounds et al. 2006).The “rapidly declining” species show a distinct taxonomic pattern (Table 9). Amongthe larger families, Bufonidae show by far the highest percentage of species in seriousdecline, and in particular in “enigmatic decline”. Most of this very serious situation canbe accounted for by the genus Atelopus (73 species in “rapid decline”, 72 in “enigmaticdecline”). There are many species in serious decline in Hylidae and Leptodactylidae, butpercentage wise these families are much less seriously affected than Bufonidae. However,some genera seem to be particularly affected, notably Isthmohyla (6 out of 14 species inserious decline), Plectrohyla (21 out of 41), Craugastor (22 out of 108), Telmatobius (14out of 52), and Thoropa (3 out of 6). The 43 species of Eleutherodactylus (especially fromthe Caribbean islands) in rapid decline should be seen in the context of a genus of 610species. Some small families have high percentages of species in serious decline, mostnotably Rhinodermatidae and Ambystomatidae. The two species in the Rhinodermatidae,in particular, require comment. One of them, Darwin’s Frog Rhinoderma darwinii (VU) iscurrently in “enigmatic decline”. The other, Rhinoderma rufum (CR), also has declinedenigmatically and was last seen in 1978; however, it is not recorded as a “rapidly declining”species, as its population crashed prior to 1980, the year from which “rapid declines” havebeen measured (Stuart et al. 2004).The “rapid declines” in the Neotropics are concentrated in particular regions, mostespecially in Mesoamerica (from central Mexico south to Panama, as typified by thegenera Isthmohyla, Plectrohyla and Craugastor) and the Andes (as typified by Atelopus andTable 9. The number of species in “rapiddecline” and “enigmatic decline” in theNeotropical Realm by Family.Flectonotus pygmaeus (Least Concern), in theFamily Leptodactylidae, occurs in Venezuelaand Colombia. It is a species of pre-montanehumid forests, and is particularly associatedwith bromeliads. The eggs are carried on theback of the female in a pouch, and the larvaeare deposited in bromeliad axils. © FranciscoJosé López-López
98Threatened <strong>Amphibian</strong>s of the WorldBolitoglossa pesrubra (Endangered) is a lungless salamander from the Family Plethodonitidae, and is restricted to the Cordillera de Talamancain Costa Rica. It still occurs in many places within its range, but has drastically declined in some sites where it was formerly abundant, whileappearing to be stable in others. © Twan LeendersTelmatobius). There have also been many declines in the Greater Antilles, for the most partin the genus Eleutherodactylus. In addition, there are some smaller foci of “rapid declines”in Chile (especially in Alsodes and Rhinoderma) and the Brazilian Atlantic Forest (wheredeclines are still poorly documented, but involve several genera, including Cycloramphusand Thoropa (Heyer et al. 1988; Eterovick et al. 2005). The growing evidence suggests thatthe Neotropics is in the process of losing most of its montane, stream-associated amphibianfauna in the space of just a few decades.KEY FINDINGS• A total of 2,916 species are recorded from the Neotropical Realm, of which 1,145 (39%)are considered threatened.• At the species level, 2,808 amphibians (96% of those present) are endemic to theNeotropics - roughly half of all recognized amphibians worldwide; of the 20 familiesfound in the region, six are endemic, and of 189 amphibian genera occurring, 157 areendemic.• The percentage of threatened species is very high in the families Rhinodermatidae (100%),Ambystomatidae (67%), Plethodontidae (60%), Bufonidae (53%), Salamandridae (50%),Leptodactylidae (46%) and Ranidae (41%), reflecting both habitat loss and declines mostlikely related to chytridiomycosis and climate change.• Geographic concentrations of threatened species occur in the Greater Antilles (Cuba,Hispaniola, Jamaica and Puerto Rico); Mesoamerica (Central America south to Panama);the tropical Andes (especially in Colombia and Ecuador, but also increasingly in Peru andBolivia); the Venezuelan highlands; central Chile; and the Atlantic Forests of southernBrazil.• Brazil has the largest number of species in the Neotropical Realm (751 species), andhas more endemics than any other country (489). Thirteen other countries have morethan 100 species (Colombia, Ecuador, Peru, Venezuela, Bolivia, Panama, Costa Rica,Argentina, Guatemala, Guyana, Honduras, French Guiana, and Suriname), with the firstfive of these countries having more than 50 endemics.• Colombia has the largest number of threatened species (209), followed by Mexico(190), Ecuador (163), and Brazil (110). Peru, Guatemala, Venezuela, Costa Rica, Panama,Honduras, Cuba, Haiti, Dominican Republic, Argentina, Bolivia, and Chile each have 20or more globally threatened species.• Among species occurring in tropical forests, 52% of species in montane tropicalforest are threatened, compared with 30% in lowland tropical forest, probablyreflecting smaller range sizes of montane species, the lack of effective habitatconservation in many montane regions, higher human population densities inmountainous areas, the widespread incidence of chytridiomycosis, and theincreased vulnerability of montane species to the impacts of climate change.Further, 45% of Neotropical amphibians associated with flowing water (most ofwhich are montane) are threatened.• Habitat loss, primarily due to expanding croplands, vegetation removal (mainly logging),urbanization/industrial development, and livestock grazing, is affecting almost 90% ofthe threatened species in the region. Disease (usually chytridiomycosis) and pollutionare both impacting nearly 30% of globally threatened species.• A massive 65% of the 470 globally “rapidly declining” species occur within the region;these are concentrated in Mesoamerica, the Andes and the Greater Antilles wherehabitat loss and chytridiomycosis have been especially severe. A total of 63% of the“rapid declines” in the Neotropics are classified as “enigmatic declines” (probably dueto chytridiomycosis and climate change).• Seven amphibian extinctions have been recorded from the Neotropics, and a further 121species are possibly extinct (again concentrated in Mesoamerica, the Andes, and theGreater Antilles).REFERENCESBaillie, J.M., Stuart, S.N. and Hilton-Taylor, C. (eds). 2004 IUCN Red List of Threatened Species. A GlobalSpecies Assessment. IUCN, Gland, Switzerland and Cambridge, UK.Barrio Amorós, C.L. 2004. <strong>Amphibian</strong>s of Venezuela: systematic list, distribution and references. An update.La Revista De Ecología Latinoamericana 9(3):1-48.Breuil, M. 2002. Histoire Naturelle des Amphibiens et Reptiles Terrestres de l’Archipel Guadeloupéen:Guadeloupe, Saint-Martin, Saint-Barthélemy. Muséum National d’Histoire Naturelle, Paris, France.Burrowes, P.A., Joglar, R.L. and Green, D.E. 2004. Potential causes for amphibian declines in Puerto Rico.Herpetologica 60:141-154.Calderon Mandujano, R., Bahena Basave, H. and Calmé, S. 2005. Anfibios y Reptiles de la Reserva de laBiosfera de Sian Ka’an y Zonas Aledañas. COMPACT-ECOSUR-CONABIO, México.Campbell, J.A. 1999a. Distribution patterns of amphibians in Middle America. In: W.E. Duellman (ed.),Patterns of Distribution of <strong>Amphibian</strong>s: A Global Perspective, pp. 111-210. Johns Hopkins UniversityPress, Baltimore, Maryland, USA.Campbell, J.A. 1999b. <strong>Amphibian</strong>s and Reptiles of Northern Guatemala, Yucatan and Belize. University ofOklahoma Press, Oklahoma, USA.Campbell, J.A. 2001. Guide to the Reptiles and <strong>Amphibian</strong>s of Guatemala. Web published: http://www.uta.edu/biology/campbell. University of Texas, Arlington, Texas, USA.Carnaval, A.C.O.Q., Puschendorf, R., Peixoto, O.L., Verdade, V.K. and Rodrigues M.T. 2006. <strong>Amphibian</strong> chytridfungus broadly distributed in the Brazilian Atlantic Rain Forest. EcoHealth 3:41-48.Cei, J.M. 1980. <strong>Amphibian</strong>s of Argentina. Monitore Zoologico Italiano N.S. Monografia 2:1-609.Cei, J.M. 1987. Additional notes to “<strong>Amphibian</strong>s of Argentina”: an update, 1980-1986. Monitore ZoologicoItaliano (N.S.) 21:209-272.Coloma, L.A. 2005. AmphibiaWeb Ecuador. http://www.puce.edu.ec/zoologia/vertebrados/amphibiawebec/index.html.Pontificia Universidad Católica del Ecuador, Quito.Crawford, A.J. and Smith, E.N. 2005. Cenozoic biogeography and evolution in direct-developing frogs ofCentral America (Leptodactylidae: Eleutherodactylus) as inferred from a phylogenetic analysis of nuclearand mitochondrial genes. Molecular Phylogenetics and Evolution 35:536-555.Crother, B.I. ed. 1999. Caribbean <strong>Amphibian</strong>s and Reptiles. Academic Press, London, UK and New York, USA.De la Riva, I. 2005. Bolivian frogs of the genus Telmatobius (Anura: Leptodactylidae): synopsis, taxonomiccomments, and description of a new species. In: E.O. Lavilla and I. De la Riva (eds.), Studies on theAndean Frogs of the Genera Telmatobius and Batrachophrynus, pp. 65-101. Asociación HerpetológicaEspañola, Monografías de Herpetología 7, Valencia, Spain.De la Riva, I., Köhler, J., Lötters, S. and Reichle, S. 2000. Ten years of research on Bolivian amphibians:updated checklist, distribution, taxonomic problems, literature and iconography. Revista Espanola deHerpetologia 14:19-164.Duellman, W.E. 1999. Distribution patterns of amphibians in South America. In: W.E. Duellman (ed.),Patterns of Distribution of <strong>Amphibian</strong>s: A Global Perspective, pp. 255-328, Johns Hopkins UniversityPress, Baltimore, Maryland, USA.Duellman, W.E. 2001. The Hylid Frogs of Middle America. Society for the Study of <strong>Amphibian</strong>s and Reptiles,Ithaca, New York, USA.Eterovick, P.C., Carnaval, A.C.O.Q., Borges-Nojosa, D.M., Silvano, D.L., Segalla, M.V. and Sazima, I. 2005.<strong>Amphibian</strong> declines in Brazil: an overview. Biotropica 37:166-179.Faivovich, J., Haddad, C.F.B., Garcia, P.C.A., Frost, D.R., Campbell, J.A. and Wheeler, W.C. 2005. Systematicreview of the frog family Hylidae, with special reference to Hylinae: phylogenetic analysis and taxonomicrevision. Bulletin of the American Museum of Natural History 294:1-240.Flores-Villela, O. 1993. Herpetofauna Mexicana. Carnegie Museum of Natural History. Special Publications17:1-73.Flores-Villela, O.A., Mendoza-Quijano, F. and Gonzalez-Porter, G. 1995. Recopilacion de claves para ladeterminacion de anfibios y reptiles de Mexico. Publicaciones Especiales del Museo de ZoologiaUniversidad Nacional de Autonoma de Mexico 10:1-285.Formas, J.R. 1995. Anfibios. In: Simonetti, J.M., Arroyo, T.K., Spotorno, A. and Loz, E. (eds.), DiversidadBiológica en Chile, pp. 314-325, Comisión Nacional de Ciencia y Tecnología (CONICYT), Santiago.Frost, D.R. 2004. <strong>Amphibian</strong> Species of the World: an Online Reference. Version 3.0 (22 August, 2004).Electronic Database accessible at http://research.amnh.org/herpetology/amphibia/index.html. AmericanMuseum of Natural History, New York, USA.Frost, D.R., Grant, T., Faivovich, J.N., Bain, R.H., Haas, A., Haddad, C.F.B., de Sá, R.O., Channing, A.,Wilkinson, M., Donnellan, S.C., Raxworthy, C.J., Campbell, J.A., Blotto, B.L., Moler, P., Drewes, R.C.,Nussbaum, R.A., Lynch, J.D., Green, D.M. and Wheeler, W.C. 2006. The amphibian tree of life. Bulletinof the American Museum of Natural History 297:1-370.Glade, A. ed. 1993. Red List of Chilean Terrestrial Vertebrates. Corporación Nacional Forestal (CONAF),Santiago, Chile.Grant, T., Frost, D.R., Caldwell, J.P., Gagliardo, R., Haddad, C.F.B., Kok, P.J.R., Means, D.B., Noonan, B.P., SchargelW.E. and Wheeler. W.C. 2006. Phylogenetic systematics of dart-poison frogs and their relatives (Amphibia:Athesphatanura: Dendrobatidae). Bulletin of the American Museum of Natural History 299:1-262.Greenbaum, E. and Komar, O. 2005. Threat assessment and conservation prioritization of the herpetofaunaof El Salvador. Biodiversity and Conservation 14:2377-2395.Guyer, C. and Donnelly, M.A. 2005. <strong>Amphibian</strong>s and Reptiles of La Selva, Costa Rica, and the CaribbeanSlope. California University Press, Berkeley, California, USA.Hedges, S.B. 1999. Distribution patterns of amphibians in the West Indies. In: W.E. Duellman (ed.), Patternsof Distribution of <strong>Amphibian</strong>s: A Global Perspective, pp. 211-254. Johns Hopkins University Press,Baltimore, Maryland, USA.Hedges, S.B. 2006. An overview of the evolution and conservation of West Indian amphibians and reptiles.Applied Herpetology 3: 281-292.Herrera, R.A., Steciow, M.M. and Natale G.S. 2005. Chytrid fungus parasitizing the wild amphibianLeptodactylus ocellatus (Anura: Leptodactylidae) in Argentina. Diseases of Aquatic Organisms64:247-252.Heyer, W.R., Rand, A.S., Cruz, C.A.G. and Peixoto, O.L. 1988. Decimations, extinctions, and colonizations offrog populations in southeast Brazil and their evolutionary implications. Biotropica 20:230-235.Hoogmoed, M.S. 1979. The herpetofauna of the Guianan region. In: W.E. Duellman (ed.), The SouthAmerican herpetofauna: its origin, evolution, and dispersal. Monograph of the Museum of NaturalHistory, University of Kansas 7: 241-279.Ibáñez, R., Rand, A.S. and Jaramillo, C.A. 1999. The <strong>Amphibian</strong>s of Barro Colorado Nature Monument,Soberanía National Park and Adjacent Areas. Editorial Mizrachi Pujol, Panama.Ibáñez, R., Solís, F., Jaramillo, C. and Rand, S. 2000. An overview of the herpetology of Panama. In: J.D. Johnson,R.G. Webb and O.A. Flores-Villela (eds.), Mesoamerican Herpetology: Systematics, Zoogeographyand Conservation, pp. 159-170, The University of Texas at El Paso, El Paso, Texas, USA.Köhler, G. 2001. Anfibios y Reptiles de Nicaragua. Herpeton, Offenbach, Germany.Köhler, G., Vesely, M. and Greenbaum, E. 2005. The <strong>Amphibian</strong>s and Reptiles of El Salvador. KriegerPublishing, Melbourne, Florida, USA.Köhler, J. 2000. <strong>Amphibian</strong> diversity in Bolivia: a study with special reference to montane forest regions.Bonner Zoologische Monographien 48:1-243.La Marca, E. 1992. Catalogo taxonómico, biogeográfico, bibliográfico de las ranas de Venezuela. CuadernosGeográficos, Universidad de Los Andes 1:1-197.La Marca, E. 1997. Lista actualizada de los anfibios de Venezuela. In: E. La Marca (ed.), VertebradosActuales y Fósiles de Venezuela, pp. 103-120. Museo de Ciencias y Tecnología de Mérida, Mérida,Venezuela.La Marca, E., Lips, K.R., Lötters, S., Puschendorf, R., Ibáñez, R., Rueda-Almonacid, J.V., Schulte, R., Marty,C., Castro, F., Manzanilla-Puppo, J., Garcia-Perez, J.E., Toral, E., Bolaños, F., Chaves, G., Pounds, J.A.and Young, B. 2005. Catastrophic population declines and extinctions in Neotropical harlequin frogs(Bufonidae: Atelopus). Biotropica 37:190-201.
100Threatened <strong>Amphibian</strong>s of the WorldESSAY 9.1. THE EXTRAORDINARY CASE OF THE NEOTROPICAL HARLEQUIN FROGS (ATELOPUS): MASS EXTINCTION WITHIN A GENUSAtelopus sorianoi (Critically Endangered) has the most restricted geographic range of any Venezuelan Atelopus species, being known from a single stream inan isolated cloud forest in the Cordillera de Mérida. The last record of the species was in 1990. © Pascual Sorianitrend, estimated at about 0.18ºC per decade, has been to the benefit of thefungal pathogen. The rise in temperatures has most probably increasedthe amount of evaporation in the tropical montane environments inhabitedby harlequin frogs, which in turn has been translated into increased cloudformation. Increased cloud cover in turn leads to a decrease in incomingsolar radiation, thus reducing daytime temperatures, and by night mayresult in a green-house effect that impedes natural heat loss from theground, with resulting warmer night-time temperatures. These cooler daysand warmer nights brings the pathogenic fungus to near optimum thermalconditions, believed to be between17 and 25ºC, thereby encouraging itsgrowth, reproduction and propagation. The theory gains support sincemost of the species have disappeared in the altitudinal band between1,000 and 2,400m elevation, while recent “re-appearances” have occurredeither in low-elevation (humid lowland forests) or high-elevation (paramo)habitats (Lötters et al. 2005). Both extremes in temperature conditions forthe fungal pathogen may act as “thermal refuges” for the few survivingAtelopus populations.Unfortunately, the problem of declines and extinctions in Atelopus is notlikely to diminish in the foreseeable future. Under a scenario of double CO 2concentrations within the next century (Malcolm et al. 2006), the rate ofamphibian extinctions is expected to increase in many regions, including theTropical Andes, where most harlequin frogs are known to occur. Atelopus mayactually be a good indicator of what is happening to other less conspicuousspecies that could experience similar declines. The loss of these importantlinks in the trophic web has unforeseeable consequences (Ranvestel etal. 2004). Furthermore, the resulting impoverished biodiversity may alsorepresent a loss in potential advances in biomedicine and biotechnology(Mendelson et al. 2006).Currently, there is no known effective protection against Batrachochytriumdendrobatidis in the wild. Therefore, one of the most tempting alternatives tocope with the Atelopus declines is to initiate captive-breeding programmes(see Essay 11.5). The success with the Panamanian Golden Frog, Atelopuszeteki (Zippel 2002), which is now available in breeding colonies in numerouszoos, is promising in this regard. Nevertheless, comprehensive captive-breedingprograms for all Atelopus species threatened with extinction appear tobe impossible due to the many species involved.Figure 1. Richness map of species in the genus Atelopus, with dark redcolours corresponding to regions of higher richness. Maximum richnessequals four species.The harlequin frogs (genus Atelopus) are small, colourful “jewels” distributedin the humid forests and paramos of Central and South America.The genus is the largest in the family Bufonidae, with about 80 describedspecies distributed from Costa Rica south to Bolivia and eastward throughthe Amazon basin into the Guianas (Figure 1). Despite interest by scientistsin these species, their conservative morphology and variable colorationhave often obscured their taxonomy. Many species have highly variablecolour patterns, and different species frequently have similar colour patterns.Recent genetic studies reveal both unappreciated genetic diversityamong populations, but also great variation within a given taxon. Morethan 30 previously unrecognized species are currently in the process ofbeing described or being elevated to the species level.Most Atelopus species are associated with streams, although manyoccur part time of the year in terrestrial habitats (Lötters 1996). Theyrange from sea level to approximately 4,800m elevation, but the majoritylive in highlands at 1,500-3,000m. Some species, such as A. varius (CR), A.chiriquiensis (CR), A. carbonerensis (CR), and the now Extinct A. ignescensand A. vogli, have been characterized as locally abundant, with hundreds ofanimals seen in a few hundred meters, often during annual breeding events(La Marca and Reinthaler 1991; Manzanilla and La Marca 2004; Pounds andCrump 1994; Ron et al. 2003). Local endemism is common in the genus,making species particularly vulnerable to extinction. At least 26 speciesare known from only one site (per Ricketts et al. 2005).Sadly, these beautiful and once common diurnal amphibians are nowvanishing. A recent study based on 113 Atelopus species (i.e., includingalso undescribed forms and a few just recently named), revealed that 37%of these species have undergone significant declines, and only 10 specieshave what are believed to be stable populations (La Marca et al. 2005).The majority of the declining species have disappeared in the last twodecades only, and many, such as Atelopus sorianoi (CR) are feared extinct;at least 30 species have been missing from all known localities for atleast eight years. All species restricted to elevations of above 1000m havedeclined and 75 percent have disappeared. At least three Atelopus speciesare considered as Extinct according to the IUCN Red List Categories andCriteria, namely Atelopus ignescens and A. longirostris from Ecuador, andA. vogli from Venezuela (Lötters et al. 2004). To put things in perspective,harlequin frogs represent about 15% of the 442 Critically Endangered (CR)amphibian species on the IUCN Red List.The first red flag that something was amiss came many years ago (LaMarca and Reinthaler 1991). Several potential causes were then discussedtrying to explain the observed declines, but today the most commonly citedcause is the pathogenic chytrid fungus Batrachochytrium dendrobatidis,which strikes even in undisturbed montane habitats. Habitat loss mayexplain a few of the disappearances. However, it is not considered tobe a major cause in the case of the Atelopus species, since almost 20%of the harlequin frogs have disappeared from protected areas. Otherpotential causes of declines, such as introduced species, trade, andpollution may partly explain a few cases, too, but are unlikely to haveaffected the majority of the species. Synergistic combinations of factorsare expected to affect some harlequin frogs, as illustrated by the case ofAtelopus zeteki (CR), believed to be nearly extinct in the wild due to thecombined effects of habitat change, illegal collecting, and fungal disease(Mendelson et al. 2006).A recent finding suggests that large-scale warming of our planet is correlatedwith mass extinction in Atelopus (Pounds et al. 2006). The warmingReferencesEnrique La Marca and Stefan LöttersLa Marca, E. and Reinthaler, H.P. 1991. Population changes in Atelopus species of theCordillera de Mérida, Venezuela. Herpetological Review 22:125-128.La Marca, E., Lips, K.R., Lötters, S., Puschendorf, R., Ibáñez, R., Rueda-Almonacid, J.V.,Schulte, R., Marty, C., Castro, F., Manzanilla-Puppo, J., García-Pérez, J.E., Bolaños,F., Chaves, G., Pounds, J.A., Toral, E. and Young, B.E. 2005. Catastrophic populationdeclines and extinctions in neotropical harlequin frogs (Bufonidae: Atelopus).Biotropica 37:190-201.Lötters, S. 1996. The Neotropical toad genus Atelopus. Checklist—biology—distribution.M. Vences and F. Glaw, Verlags GbR, Cologne, Germany.Lötters, S., La Marca, E., Stuart, S., Gagliardo, R. and Veith, M. 2004. A new dimensionof current biodiversity loss? Herpetotropicos 1:29-31.Lötters, S., La Marca, E., Gagliardo, R.W., Señaris, C.J. and Veith, M. 2005. Harlequinfrogs back? Some thoughts and speculations. Froglog 70:1-3.Malcolm, J.R., Canran, L., Neilson, R.P., Hansen, L. and Hannah, L. 2006. Global warmingand extinctions of endemic species from biodiversity hotpots. Conservation Biology20:358-548.Manzanilla, J. and La Marca, E. 2004. Population status of the Rancho Grande harlequinfrog (Atelopus cruciger Lichtenstein and Martens 1856), a proposed critically endangeredspecies from the Venezuelan Coastal Range. Memoria de la Fundación La Sallede Ciencias Naturales, Caracas, 62(157):5-29.Mendelson III, J.R., Lips, K.R., Gagliardo, R.W., Rabb, G.B., Collins, J.P., Diffendorfer, J.E.,Daszak, P., Ibáñez, R., Zippel, K.C., Lawson, D.P., Wright, K.M., Stuart, S.N., Gascon, C., daSilva, H.R., Burrowes, P.A., Joglar, R.L., La Marca, E., Lötters, S., du Preez, L.H., Weldon,C., Hyatt, A., Rodriguez-Mahecha, J.V., Hunt, S., Robertson, H., Lock, B., Raxworthy, C.J.,Frost, D.R., Lacy, R.C., Alford, R.A., Campbell, J.A., Parra-Olea, G., Bolaños, F., CalvoDomingo, J.J., Halliday, T., Murphy, J.B., Wake, M.H., Coloma, L.A., Kuzmin, S.L., StanleyPrice, M., Howell, K.M., Lau, M., Pethiyagoda, R., Boone, M., Lannoo, M.J., Blaustein,A.R., Dobson, A., Griffiths, R.A., Crump, M.L., Wake, D.B. and Brodie, E.D., Jr. 2006.Confronting <strong>Amphibian</strong> Declines and Extinctions. Science 313:48.Pounds, J.A. and Crump, M.L. 1994. <strong>Amphibian</strong> declines and climate disturbance: The caseof the golden toad and the harlequin frog. Conservation Biology 8:72-85.Pounds, J.A., Bustamante, M.R., Coloma, L.A., Consuegra, J.A., Fogden, M.P.L., Foster, P.N.,La Marca, E., Masters, K.L., Merino-Viteri, A., Puschendorf, R., Ron, S.R., Sanchez-Azofeifa, G.A., Still, C.J. and Young, B.E. 2006. Widespread amphibian extinctionsfrom epidemic disease driven by global warming. Nature 439:161-167.Ranvestel, T.W., Lips, K.R., Pringle, C.M., Whiles, M.R. and Bixby, R.J. 2004. Neotropicaltadpoles influence stream benthos: evidence for ecological consequences of amphibiandeclines. Freshwater Biology 49:274-285.Ricketts, T.H., Dinerstein, E., Boucher, T., Brooks, T.M., Butchart, S.H.M., Hoffmann, M.,Lamoreux, J.F., Morrison, J., Parr, M., Pilgrim, J.D., Rodrigues, A.S.L., Sechrest, W.,Wallace, G.E., Berlin, K., Bielby, J., Burgess, N.D., Church, D.R., Cox, N., Knox, D.,Loucks, C., Luck, G.W., Master, L.L., Moore, R., Naidoo, R., Ridgely, R., Schatz, G.E.,Shire, G., Strand, H., Wettengel, W. and Wikramanayake, E. 2005. Pinpointing andpreventing imminent extinctions. Proceedings of the National Academy of SciencesUSA 102:18497-18501.Ron, S.R., Duellman, W.E., Coloma, L.A. and Bustamante, M.R. 2003. Population declineof the jambato toad Atelopus ignescens (Anura: Bufonidae) in the Andes of Ecuador.Journal of Herpetology 37:116-126.Stuart, S.N., Chanson, J.S., Cox, N.A., Young, B.E., Rodrigues, A.S.L., Fischman, D.L. andWaller, R.W. 2004. Status and trends of amphibian declines and extinctions worldwide.Science 306:1783-1786.Zippel, K. 2002. Conserving the Panamanian golden frog: Proyecto Rana Dorada. HerpetologicalReview 33:11-12.
Chapter 9. <strong>Amphibian</strong>s of the Neotropical Realm 101ESSAY 9.2. CONSERVATION STATUS OF THE ANDEAN FROGS OF THE GENERA TELMATOBIUS AND BATRACHOPHRYNUSThe frogs of the genera Telmatobius and Batrachophrynus constitute aremarkable group of endemic Andean anurans that occur from centralEcuador in the north, to northern Chile and Argentina in the south (Figure1). The most recent classification of Telmatobius (Lavilla 2005) includes 56species, with Peru harbouring the highest diversity (23 species), followed byBolivia (15 species), Argentina (14 species), Chile (9 species; the descriptionof an additional species was in press at the time of writing this report) andEcuador (3 species). Batrachophrynus includes two species (endemic tocentral Peru), and while we treat it as distinct in the current essay, recentstudies have indicated that Batrachophynus is not a valid genus and shouldrather be included in Telmatobius (Aguilar and Pacheco 2005; Córdova andDescailleaux 2005; Sinsch et al. 2005).The genus Telmatobius is mostly aquatic, occupying a wide, albeitmontane, altitudinal range (1,300-5,000m asl), and inhabiting habitats asdiverse as cloud forests to humid paramos and dry puna. Many species haveco-existed with humans for centuries, and, undoubtedly, habitat destruction,mining, agricultural practices and livestock (especially camelids) haveinfluenced the distribution and local abundance of some taxa (De la Riva2005). Several species are captured either for food or because of certainputative medicinal or magical properties; other potential threats includewater pollution and the introduction of trout for fishing. Particularly concerningis the case of the giant Lake Titicaca Frog (Telmatobius culeus, CR) andthe even larger Lake Junin Frog (B. macrostomus, EN), both of which havebeen affected by over-fishing and other problems. Although some protectionmeasures have been implemented (such as captive breeding), they haveproved to be mostly unsuccessful (Pérez 2005).Since Telmatobius and Batrachophrynus frogs inhabit montane areasand are stream- or lake-breeders, their biology and ecology render themparticularly susceptible to chytrid infection. Indeed, there is growingevidence that chytridiomycosis is having a direct impact on populationsof these frogs. Reports of serious population declines in Telmatobius firstcame from Ecuador, and a recent summary of the conservation statusof Ecuadorian Telmatobius yields conclusive evidence of a catastrophicdecline of the three species endemic to that country (Merino-Viteri etal. 2005). Specimens found in the 1980s and 1990s had malformationsand symptoms of diseases, including chytridiomycosis. Despite intensivesurveys for living animals in recent years (including 2005), the last livingTelmatobius specimen seen in Ecuador was a tadpole of T. niger (CR) withsevere epidermal damages, collected on 1 December 1994; T. vellardi (CR)was last seen in 1987, and T. cirrhacelis (CR) in 1981. The three EcuadorianTelmatobius are now likely extinct.While the situation in Ecuador has been thoroughly investigated, thereis almost no published information for other range countries. In Perú, Lehr(2005) stated that these frogs are threatened due to agricultural practices,water pollution, and commercial utilization. Seimon et al. (2005) reporteda case of chytridiomycosis affecting T. marmoratus (VU), collected in July2002 in the department of Cusco, although without reference to populationdeclines. This species has the broadest distribution of any Telmatobius,and occurs in the Altiplano and Puna highlands above the tree line. Healthyspecimens were found in the department of Puno in southern Peru duringrecent fieldwork (February 2006; De la Riva, unpubl.), and although it isplausible that some populations of this widespread species are extinctor have declined due to chytridiomycosis, the presence of larvae andadults in many sites indicates that, overall, the species is not severelythreatened. However, this situation could change in the future if climatechange facilitates a shift to favorable conditions for chytrid in previouslyunsuitable zones.Unfortunately, more alarming data, albeit preliminary, concern speciesfrom the humid paramos and upper cloud forest regions of Peru. In1999-2001, Telmatobius were largely extirpated from the department ofCajamarca, where farmers frequently encountered dead animals (R. Schulte,in. litt.). Recent fieldwork (February 2006) by a team of five herpetologistssurveying nine Andean valleys in the department of Puno and southernCusco did not yield a single specimen of Telmatobius, despite thoroughsearches in appropriate sites. In several places, local people explained thatall “kaylas” frogs (=Telmatobius) vanished two years ago.In Bolivia, the situation seems to be similar. De la Riva (2005) documenteda severe decline of a newly described upper cloud forest species,T. espadai. Tadpoles of this species were extremely abundant in Río Apaza(Cochabamba) in 1990, but no tadpoles were found in 1994 and 1999, andonly a single one in 1998. A recent examination of the oral structures of thisindividual showed an almost complete destruction of keratinized structures,which is consistent with chytridiomycosis. Another paramo/upper cloudforest species, T. sanborni, occurred at least between Pelechuco (La Paz,Bolivia), where it was abundant at least in 2001, and Ollachea (Puno, Peru)(De la Riva 2005). No trace of this species was found during the recentsurveys in Peru in February 2006, although it has yet to be searched for inBolivia. The last records of two other threatened species, T. sibiricus (EN)and T. verrucosus (VU), are from 2004 (De la Riva 2005).Chilean species of Telmatobius occur in mostly desertic conditionsand dry puna, and are subject to the same general threats as otherhighland species (Formas et al. 2005). At present, there is no direct orindirect evidence of chytrid infection in Chilean Telmatobius. The availableinformation in Argentina is not promising (Lavilla and Barrionuevo2005). Early in 2006, S. Barrionuevo (pers. comm.) found evidence ofchytrid fungus in individuals of Telmatobius atacamensis (CR; a speciesalready threatened by mining activities) in the environs of San Antoniode los Cobres (Salta) and in a population of Telmatobius pisanoi (EN)near El Pichao (Tucumán). Another species, T. laticeps (EN), fairly commonin the past in the area of Tafí del Valle (Tucumán) disappeared fromits range in the last few years due to unknown causes; the same mighthave happened with the forest-dwelling T. ceiorum (EN; S. Barrionuevoand M.L. Ponssa, pers. comm.).In summary, frogs of the genera Telmatobius (and Batrachophynus) areseverely threatened, and at a scale comparable only to the bufonid genusAtelopus (see Essay 9.1). In Telmatobius, as with Atelopus, many speciesare still to be named, many of those already described are known only fromthe type locality or nearby, and several extinctions have already taken place.However, there is one important difference: Telmatobius has no lowlandspecies, and thus the entire genus faces the very real danger of extinctionin the very near future. Unfortunately, the case of Telmatobius frogs seemsto strongly support Lips et al.’s (2006) statement: “…it is no longer correctto speak of global amphibian declines but, more appropriately, of globalamphibian extinctions.”Ignacio De la Riva and Esteban O. LavillaReferencesAguilar, C. and Pacheco, V. 2005. Contribución de la morfología bucofaríngea larval a lafilogenia de Batrachophrynus y Telmatobius. In: E.O. Lavilla and I. De la Riva (eds.),Studies on the Andean frogs of the genera Telmatobius and Batrachophrynus (Anura:Leptodactylidae), pp. 219-238. Monog. Herpetol. 7, AHE, Valencia, Spain.Córdova, J.H. and Descailleaux, J. 2005. El análisis cladístico preliminar de los cariotiposde cinco especies de Telmatobius y dos de Batrachophrynus no apoya su separacióngenérica. In: E.O. Lavilla and I. De la Riva (eds.), Studies on the Andean frogs of thegenera Telmatobius and Batrachophrynus (Anura: Leptodactylidae), pp. 187-217.Monog. Herpetol. 7, AHE, Valencia, Spain.De la Riva, I. 2005. Bolivian frogs of the genus Telmatobius: synopsis, taxonomic comments,and description of a new species. In: E.O. Lavilla and I. De la Riva (eds.), Studies on theAndean frogs of the generaTelmatobius and Batrachophrynus (Anura: Leptodactylidae),pp. 65-101. Monog. Herpetol. 7, AHE, Valencia, Spain.Formas, J.R., Veloso, A. and Ortiz, J.C. 2005. Sinopsis de los Telmatobius de Chile. In: E.O.Lavilla and I. De la Riva (eds.), Studies on the Andean frogs of the generaTelmatobiusand Batrachophrynus (Anura: Leptodactylidae), pp. 103-114. Monog. Herpetol. 7,AHE, Valencia, Spain.Lavilla, E.O. 2005. Lista sistematica y bibligráfica comentada sobre el género Telmatobius.In: E.O. Lavilla and I. De la Riva (eds.), Studies on the Andean frogs of the generaTelmatobiusand Batrachophrynus (Anura: Leptodactylidae), pp. 283-349. Monog.Herpetol. 7, AHE, Valencia, Spain.Lavilla, E.O. and Barrionuevo, J.S. 2005. El género Telmatobius en la República Argentina:una síntesis. In: E.O. Lavilla and I. De la Riva (eds.), Studies on the Andean frogs ofthe genera Telmatobius and Batrachophrynus (Anura: Leptodactylidae), pp. 115-165.Monog. Herpetol. 7, AHE, Valencia, Spain.Lehr, E. 2005. The Telmatobius and Batrachophrynus species of Peru. In: E.O. Lavillaand I. De la Riva (eds.), Studies on the Andean frogs of the generaTelmatobius andBatrachophrynus (Anura: Leptodactylidae), pp. 39-64. Monog. Herpetol. 7, AHE,Valencia, Spain.Lips, K.R., Brem, F., Brenes, R., Reeve, J.D., Alford, R.A., Voyles, J., Carey, C., Livo, L.,Pessier, A.P. and Collins, J.P. 2006. Emerging infectious disease and the loss of biodiversityin a Neotropical amphibian community. Proceedings of the National Academyof Sciences USA 103:3165-3170.Merino-Viteri, A., Coloma, L.A. and Almendáriz, A. 2005. Los Telmatobius de los Andesde Ecuador y su disminución poblacional. In: E.O. Lavilla and I. De la Riva (eds.),Studies on the Andean frogs of the generaTelmatobius and Batrachophrynus (Anura:Leptodactylidae), pp. 9-37. Monog. Herpetol. 7, AHE, Valencia, Spain.Pérez Béjar, M.E. 2005. Crianza en cautividad y uso sostenible de la rana gigante del lagoTiticaca (Telmatobius culeus). In: E.O. Lavilla and I. De la Riva (eds.), Studies on theAndean frogs of the generaTelmatobius and Batrachophrynus (Anura: Leptodactylidae),pp. 261-271. Monog. Herpetol. 7, AHE, Valencia, Spain.Seimon, T.A., Hoernig, G., Sowell, P., Halloy, S. and Seimon, A. 2005. Identification ofchytridiomycosis in Telmatobius marmoratus at 4450 m in the Cordillera Vilcanota ofsouthern Peru. In: E.O. Lavilla and I. De la Riva (eds.), Studies on the Andean frogs ofthe genera Telmatobius and Batrachophrynus (Anura: Leptodactylidae), pp. 273-284.Monog. Herpetol. 7, AHE, Valencia, Spain.Sinsch, U., Hein, K. and Glump, B. 2005. Reassessment of central Peruvian Telmatobiinae(genera Batrachophrynus and Telmatobius): osteology, palmar morphology and skinhistology. In: E.O. Lavilla and I. De la Riva (eds.), Studies on the Andean frogs of thegenera, Telmatobius and Batrachophrynus (Anura: Leptodactylidae), pp. 239-260.Monog. Herpetol. 7, AHE, Valencia, Spain.Telmatobius marmoratus (Vulnerable) has the widest range of any species inthe genus, being known from the Andean region of southern Peru, northernand central Bolivia, and northern Chile. © Ignacio de la RivaFigure 1. Richness map of species in the genera Telmatobius and Batrachophrynus,with dark red colours corresponding to areas of higher richness.Maximum richness equals four species.
102Threatened <strong>Amphibian</strong>s of the WorldESSAY 9.3. NEOTROPICAL SALAMANDERSLiving salamanders comprise about 550 species, representing approximatelyone-tenth of living amphibians. The order Caudata hosts the largest amphibian,the Chinese Giant Salamander (Andrias davidianus, CR), in which adultsmeasure 180cm from nose to tip of tail (and see Essay 4.7), as well as oneof the smallest, Thorius arboreus (EN), one of several species of the genusthat achieve sexual maturity at about 15mm in length. Although the numberof salamander species is small compared with that of frogs, the diversityof species and life histories, coupled with late 20th century declines anddisappearances worldwide, make salamanders an important model forunderstanding the causes of global change (i.e., climate change, pollution,habitat loss, etc) and their effect on biodiversity.Salamanders are more commonly representatives of the northerntemperate regions. Only a few groups have colonized tropical regions: theSalamandridae in south-eastern Asia and the Plethodontidae in tropicalAmerica. The magnitude and extent of these tropical invasions differs greatly.While tropical Asia has been colonized by only a few species, the Neotropicshave been the stage for a large-scale radiation encompassing almost 40%of all salamander species.The main Neotropical salamander radiation is restricted to a single clade,the supergenus Bolitoglossa (Parra-Olea et al. 2004), which is representedby more than 180 species and 12 genera, and ranges from northern Méxicoto Brazil (Figure 1). Bolitoglossine salamanders share fully terrestrial lifehistories, internal fertilization, direct development within encapsulated eggs,and a highly specialized feeding mechanism. These derived traits have playeda major role in the success of bolitoglossines in the tropics (Wake 1987). Asecond radiation in the Neotropics can be found in the genus Ambystoma inthe Transvolcanic Axis of central Mexico. Although this radiation has producedrelatively few species, it includes several independently evolved paedomorphiclineages. A prime example is the Axolotl (Ambystoma mexicanum, CR),which is widely used to illustrate paedomorphosis in vertebrate evolution.“Cryptic speciation” is common in salamanders. Their morphological evolutionis conservative, and different populations often share traits that havearisen through convergence or that have evolved in parallel. Genetic studiesare thus often necessary to identify new species. Such studies, coupled withfieldwork, have shown that salamanders in the tropics often exhibit a patternof local isolation, with extreme genetic differentiation occurring over shortdistances (“tropicality” syndrome) (Garcia-Paris et al. 2000). Units that havebeen previously treated as single species often comprise multiple and geneticallydistinct lineages. Accordingly, the total number of salamander speciesremains unknown, and new forms are steadily being described. In Mexico,for example, the number of recognized species has risen from 93 to 128 in thepast 10 years — a 39% increase (Flores-Villela and Canseco 2004).<strong>Amphibian</strong> populations are declining worldwide and Neotropical salamandersare no exception. In several localities where salamanders were seen orcollected by the hundreds in the 1970s and 1980s, it is now difficult to find asingle individual. Some declines have occurred in seemingly pristine areas,such as Cerro San Felipe in Oaxaca, Mexico, and Reserva de Monte Verdein Costa Rica (Parra-Olea et al. 1999). The results of the Global <strong>Amphibian</strong>Assessment found that out of a total of 226 species in the Neotropics, 36 areCritically Endangered, 74 Endangered, and 28 Vulnerable. An additional 42were listed as Data Deficient. Habitat loss and water pollution is the majorthreat to most species of salamanders, and, for some species, over-collecting(e.g., for food), the introduction of exotic species, and urban developmentare significant threats. Other factors such as climate change, increasedUV-B radiation, chemical contamination, and emerging infectious diseaseare currently being evaluated.To date, the chytrid fungus Batrachochytrium dendrobatidis has beenfound in four species of plethodontid salamanders (Lips et al. 2006) and infour ambystomatid species (G. Parra-Olea, unpubl.), but massive die offs ofsalamanders have, as yet, not been linked to this pathogen. Climate changeand forest fragmentation could have important impacts on salamanders,especially considering the limited dispersal abilities of these animals.Bioclimatic envelope modelling suggests that the terrestrial salamanderPseudoeurycea leprosa (VU) in Mexico could lose almost 75% of its rangearea over the next 50 years because of climate change (Parra-Olea et al.2005). This will be true for all terrestrial salamanders that inhabit pine and/orpine-oak forests, and will be exacerbated for the majority of species withsmall distributional ranges.Traditionally, aquatic salamanders of the genus Ambystoma, such as theAxolotl and the Achoque, A. mexicanum, have played an important role in localcommunities. The Aztecs considered the Axolotl as the transfiguration of thedeity Xolotl, and both species are exploited by local communities as a foodsource and as a remedy for respiratory infections (see Essay 2.3). The mainthreats to most Ambystoma species include contamination and drying out oftheir aquatic habitats, the introduction of exotic species, and over-exploitation.For example, the local conditions of Lake Pátzcuaro, to which the Achoqueis endemic, have changed following an increase in water temperature, adecrease in the mean depth of the lake, and the introduction of exotic fish(Centrarchidae, Cyprinidae and Cyclidae) and their accompanying parasites(i.e. Bothriocephalus acheilognathi) (García et al. 1993). Furthermore, between1987 and 2000 the harvest of the Achoque was approximately 27,592 kg(Huacuz 2002). A management plan has been proposed for the Achoque and acaptive-breeding program was started by a group of nuns from the Pátzcuaroconvent, with the main objective of sustainably harvesting the species fromthe wild for the production of cough syrup for the community. However, westill know little about the size of the population, its genetic structure, or itsdynamics, so evaluating its chances of survival is difficult.Given the alarming declines and disappearances that have been witnessedamong Neotropical salamanders, examining the various potential threats isurgent, particularly where these threats act in synergy (Pounds et al. 2006).Most importantly, we cannot begin to propose adequate management plansfor species, unless we know and understand the taxonomic and phylogeneticidentity of the species of concern. Resolving taxonomic uncertainties isthus fundamentally important. Studies involving the use of phylogeneticsfor uncovering cryptic species diversity will help reveal the true diversity ofthe group, and in turn also help identify unique lineages and hot spots ofdiversity. Finally, they will identify the affinities of individual populations,thus facilitating appropriate decisions about the translocation or reintroductionof salamanders.ReferencesGabriela Parra-OleaFlores-Villela, O. and Canseco-Marquez, L. 2004. Nuevas especies y cambios taxonomicospara la herpetofauna de México. Acta Zoologica Mexicana 2:115-144.Huacuz, E.D. 2002. Programa de Conservación y Manejo de Ambystoma dumerili. ElAchoque del Lago de Patzcuaro. Universidad Michoacana de San Nicolas de Hidalgo,Fondo Mexicano para la Conservación de la Natraleza, A. C. y Secretaria de MedioAmbiente y Reccursos Naturales. Michoacán, México.García, A.I., Pérez-Ponce de León, G. and García, P.L. 1993. Contribución al conocimiento deFigure 1. Richness map of Neotropical salamander species (n=242) in the generaBatrachoseps, Bolitoglossa, Chiropterotriton, Cryptotriton, Dendrotriton,Ixalotriton, Nototriton, Nyctanolis, Oedipina, Parvimolge, Pseudoeurycea andThorius. Dark red colours correspond to higher richness. Colour scale basedon five quantile classes. Maximum richness equals 17 species.las comunidades de helmintos de dos especies de anfibios endémicos del Lago de Pátzcuaro,Michoacán: Rana dunni y Ambystoma dumerilii. Cuad. Mex. Zool. 1:73-80.García-Paris, M., Good, D.A., Parra-Olea, G. and Wake D.B. 2000. Biodiversity of CostaRican salamanders: Implications of high levels of genetic differentiation and phylogeographicstructure for species formation. Proceedings of the National Academy ofSciences, USA 97:1640-1647.Lips, K.R., Brem, F., Brenes, R., Reeve, J.D., Alford, R.A., Voyles, J., Carey, C., Livo, L.,Pessier, A.P.,and Collins, J.P. 2006. Emerging infectious disease and the loss of biodiversityin a Neotropical amphibian community. Proceedings of the National Academyof Sciences, USA 103:3165-3170.Parra-Olea, G., García-Paris, M., and Wake, D.B. 1999. Status of some populations ofMexican salamanders (Amphibia: Plethodontidae). Revista de Biologia Tropical47:217-223.Parra-Olea, G., García-Paris, M. and Wake, D.B. 2004. Molecular diversification of the genusBolitoglossa and its evolutionary and biogeographic consequences for the invasion ofAmerican tropics. Biological Journal of the Linnean Society 81:325-346.Parra-Olea, G., Martínez-Meyer, E. and Pérez Ponce de León, G. 2005 Forecasting climatechange effects on salamander distribution in the highlands of Central Mexico.Biotropica 37:202-208.Pounds, J.A., Bustamante, M.R., Coloma, L.A., Consuegra, J.A., Fodgen, M.P., Foster, P.N.,La Marca, E., Masters, K.L., Merino-Viteri, A., Puschendorf, R., Ron, S.R., Sanchez-Azofeifa, A., Still, C.J. and Young, B.E. 2006. Widespread amphibian extinctions fromepidemic disease driven by global warming. Nature 439:160-167.Wake, D.B. 1987. Adaptive radiation of salamanders in Middle American cloud forests.Annals of the Missouri Botanical Garden 74:242-264.ESSAY 9.4. BRAZIL: THE WORLD LEADER IN AMPHIBIAN DIVERSITYMore than 8.5 million km 2 in size, Brazil is the fifth largest country in the worldand the largest among those in the tropics. It has the largest continental biotaon Earth, and inspired the concept of Megadiversity countries (Mittermeier etal. 1997). Conservative estimates indicate that Brazil is home to 13% of globalbiodiversity, and has the richest flora with more than 56,000 species.Not surprisingly, then, Brazil is also the world leader in amphibian diversityand endemism. The Global <strong>Amphibian</strong> Assessment records 751 native species,of which around 65% are endemic. However, the rate of description ofnew species is very high, and according to an updated list of the BrazilianSociety of Herpetology (SBH) there are now 794 amphibian species in Brazil.Only Colombia can come close to rivaling Brazil in terms of absolute numbersof amphibians present (see Essay 9.5). Further, even the current number ofrecognized amphibians is an underestimate, as evidenced by the number ofspecies that have been discovered and described just in recent years. Severalareas have never been inventoried and likely would reveal many new specieswaiting to be described, including large areas in the Cerrado and Amazon,such as southern Pará and Maranhão states, western Bahia state, northernMato Grosso, and almost all of Tocantins state.<strong>Amphibian</strong> diversity is not evenly distributed across the country, andthere is a noticeable concentration of species in some regions, for examplein the Atlantic Forest (Figure 1). Unfortunately, the Atlantic Forest is alsothe center of origin for reports of amphibian declines in Brazil (Eterovicket al. 2005) (Figure 2). The Atlantic Forest (or Mata Atlântica) stretchesalong Brazil’s Atlantic coast from the northern state of Rio Grande do Nortesouth to Rio Grande do Sul, extending from 4º to 32ºS. Long isolated fromother major rainforest blocks in South America, the Atlantic Forest has anextremely diverse and unique mix of vegetation and forest types, with elevationvarying from the sea level to about 2,900m. Unfortunately, this biomehas been largely destroyed, and only about 7% of its original native forestcover remains intact, and it is regarded as a recognized global biodiversityhotspot (Mittermeier et al. 2004).In a recent review of amphibian declines in Brazil, Eterovick et al. (2005)found that most species experiencing declines in the Atlantic Forest arerecorded at elevations up to 1,000m, some of them associated with streams(Colostethus olfersioides VU, Bokermannohyla langei DD, Crossodactylus disparDD, C. gaudichaudii LC, Hylodes babax DD, Cycloramphus boraceiensis LC,C. mirandaribeiroi DD, C. semipalmatus NT, Hyalinobatrachium uranoscopumLC), others with cliffs dripping with water for tadpole development (Cycloramphusduseni DD, Thoropa lutzi EN, T. petropolitana VU). The species are eitherdirect developers (Adelophryne baturitensis VU), or their mode of reproductionis unknown (Colostethus carioca DD, Cycloramphus eleutherodactylus DD). Afew species are recorded only above 1,500m (Eleutherodactylus paranaensisDD, Cycloramphus granulosus DD, Paratelmatobius lutzii DD).But declines are not only reported from the Atlantic Forest. The BrazilianCerrado, another global biodiversity hotspot, makes up one-fifth of thecountry, and is the most extensive woodland-savannah in South America.The Cerrado receives abundant rainfall between October and April, while therest of the year is characterized by a pronounced dry season. The Cerradoalso contains a rich montane meadow vegetation found at higher portionsof some of the mountain ranges in south-eastern Brazil, such as the Serra doEspinhaço. Eterovick et al. (2005) reported the first declines of amphibiansin the Cerrado, among the species Crossodactylus bokermanni (DD) andEpipedobates flavopictus (LC). They recorded only a few adult individuals ofCrossodactylus bokermanni, from the Serra do Cipó in 2001 in the ParqueNacional da Serra do Cipó, and yet the species was known to be common inthe same study area in 1971-1974.The main cause for declines in amphibians in Brazil is undoubtedlyhabitat destruction, largely as a consequence of deforestation, agriculturalexpansion, mining, fire, and infrastructure development and urbanization.However, other factors, such as severe winters, pollution and acid rain, andextended dry periods, are all possible causative factors (Eterovick et al. 2005).Furthermore, disease may also play an important role. Carnaval et al. (2006)conducted histological screenings of 96 preserved specimens of anuranscollected at 10 sites in the Atlantic Forest and found chytrid fungus to bewidely distributed, having recorded the disease in specimens of Colostethusolfersioides, Bokermannohyla gouveai DD and Hypsiboas freicanecae DD,as well as Thoropa miliaris LC and Crossodactylus caramaschii LC. Moreconcerningly, the altitudinal range is broad, spanning from less than 100mto about 2,400m (in the Parque Nacional do Itatiaia). The widespread occurrenceof chytrid in the Atlantic Forest adds to the challenge of conservingan already threatened biome. More recently, Toledo et al. (2006) extendedthe distribution of the fungus in Brazil ca. 630km southward from the previoussouthernmost record of Carnaval et al. (2006), reaching São Franciscode Paula in the state of Rio Grande do Sul (the southernmost limits of theAtlantic rainforest), and speculated on its distribution in the Cerrado andPantanal (and see Ron 2005).The Brazilian politics of conservation include important legal instruments,such as lists of threatened species and the selection of priority areas for conservationin all Brazilian biomes. On the other hand, the country still has muchto do to improve its protected areas network, particularly given the noticeablegaps in coverage in the Atlantic Forest. The Cerrado biome deserves specialattention because of the scarce knowledge about amphibians and its high rateof habitat loss due to the rapid advance of the agricultural frontier. Brazilianherpetologists have clearly made dramatic strides forward in the last twodecades in improving our knowledge on natural history, ecology, and basiclife-history of many species, but a great deal remains to be done to betterunderstand the causes of the declines being witnessed among the country’samphibians, and the most appropriate means to mitigate these threats.Débora Leite Silvano
Chapter 9. <strong>Amphibian</strong>s of the Neotropical Realm 103ReferencesCarnaval, A.C.O.Q.C., Puschendorf, R., Peixoto, O.L., Verdade, V.K., and Rodrigues, M.T.2006. <strong>Amphibian</strong> Chytrid Fungus Broadly Distributed in the Brazilian Atlantic RainForest. EcoHealth 3:41-48.Eterovick, P.C., Carnaval, A.C.O.Q.C., Borges-Nojosa, D.M., Silvano, D.L., Segalla,M.V. and Sazima, I. 2005. <strong>Amphibian</strong> Declines in Brazil: An Overview. Biotropica37:166-179.Mittermeier, R.A., Robles Gil, P. and Mittermeier, C.G. (eds.). 1997. Megadiversity: Earth’sBiologically Wealthiest Nations. CEMEX, Mexico City, Mexico.Mittermeier, R.A., Robles-Gil, P., Hoffmann, M., Pilgrim, J.D., Brooks, T.M., Mittermeier,C.G., Lamoreux, J.L. and Fonseca, G. 2004. Hotspots Revisited: Earth’s BiologicallyRichest and Most Endangered Ecoregions. Second Edition. CEMEX, Mexico City,Mexico.Ron, S.R. 2005. Predicting the distribution of the amphibian pathogen Batrachochytriumdendrobatidis in the New World. Biotropica 37(2):209-221.Toledo, L.F., Britto, F.B., Araujo, O.G.S., Giasson, L.M.O. and Haddad, C.F.B. The occurrenceof Batrachochytrium dendrobatidis in Brazil and the inclusion of 17 new cases ofinfection. South American Journal of Herpetology 1(3):185-191.Figure 1. Richness map of all amphibian species in Brazil, with dark redcolours corresponding to regions of higher richness. Colour scale based on10 quantile classes. Maximum richness equals 139 species.Figure 2. Richness map of all threatened amphibian species in Brazil, withdark red colours corresponding to regions of higher richness. Colour scalebased on five quantile classes. Maximum richness equals 24 species.ESSAY 9.5. A BRIEF OVERVIEW OF THE AMPHIBIANS OF COLOMBIAThe amphibian fauna of Colombia is among the largest and most diverse onthe planet. According to the results of the Global <strong>Amphibian</strong> Assessment,nearly 700 recognized species of amphibians are known from, or expected tooccur in, Colombia, and our current estimate stands at 732. The diversity ofamphibians in Colombia is, to a certain degree, the fortuitous consequenceof human politics – it is as if Colombia’s borders were drawn with the specificintent of maximizing its amphibian diversity. That is, Colombia’s amphibiandiversity is a function not only of the area of this tropical country, but also itsspecific location. For example, the two countries with the greatest number ofamphibian species are Brazil and Colombia (Ecuador is a distant third, with“only” 449 species). With 752 recognized species listed in the GAA, Brazil hasa slightly larger amphibian fauna, but its area is over eight times greater thanthat of Colombia. Consequently, Brazil has 8.8X10 -5 species per km 2 , whereasColombia has 6.1X10 -4 species per km 2 – a full order of magnitude more.In occupying the north-western-most portion of South America, Colombiaincludes the rich amphibian fauna of the rain-soaked Pacific lowlands andadjacent Andean foothills, and this is augmented by capturing many species(e.g., the dendrobatid Colostethus panamensis, LC) and lineages (e.g., thebrachycephalid genus Craugastor) that extend into Colombia from CentralAmerica. The eastern borders reach far into Amazonia, and further north theLlanos secure fauna associated with the Orinoco river drainage. PredominantlyVenezuelan lineages, such as the aromobatid Aromobates, extend intoColombia in the Serranía de Perijá, and the isolated Sierra Nevada de SantaMarta harbors an endemic fauna that includes such enigmatic species as thebrachycephalid Geobatrachus walkeri (EN).Nevertheless, although Colombia’s regional span contributes greatly tothe diversity of amphibians, it is the Andean backbone that is most significant(Lynch et al. 1997). Whereas to the south and north-east the Andes formcomparatively simple systems, in Colombia they divide into three isolatedranges that radiate from the Nudo de Pasto, and these ranges harbor abouttwo-thirds of Colombian amphibians. Among the Andean species, most occurin the cool, moist cloud forests between 1,200 and 2,500m asl, and many areconfined to extremely small areas. Although experimental data are lacking, itis assumed that this isolation is due to the adaptation of species to specificenvironments and their inability to survive under even mildly different conditions.For example, although two adjacent mountains may share identicalenvironmental conditions, the different environment (e.g., higher temperatureand lower precipitation) of the intervening valley would serve as a barrier todispersion and gene flow (Lynch and Duellman 1997).The limited geographic distribution of most Colombian amphibians makesthem extremely susceptible to habitat alteration and destruction. This posesa special challenge for Colombian policy makers because humans havetargeted precisely the same elevations of the Andes for their developmentactivities. For many Andean species, the removal of a single remaining patchof forest may mean the extinction of the species. For example, Atopophrynussyntomopus (CR) is the only species of its genus and is known from a singlelocality in the Cordillera Central of Antioquia in an area that has beensubjected to extreme deforestation. In addition to the habitat alterationthat accompanies human development, other actual or potential threats toColombian amphibians include the introduction of exotic species (includingthe illicit introduction of the North American Bull frog, Lithobates catesbeiana,for commercial purposes), global climate change and increased exposure toultraviolet radiation, and infectious disease – especially chytridiomycosis,caused by the chytrid fungus Batrachochytrium dendrobatidis (Rueda-Almonacidet al. 2004).According to the IUCN Red List, just less than half (47%) of all Colombianamphibian species are classified as Least Concern. Of the remainder, 18% areEndangered or Critically Endangered, and another 18% are Near threatenedor Vulnerable. Quantitative data derived from rigorous monitoring studies arelacking for all of those species, but data are so scant for an additional 17%of Colombian species that not even a rough estimate of their status couldbe made, and they are designated as Data Deficient.Given the state of knowledge of Colombian amphibians, two areas ofresearch are in urgent need of increased attention. First, taxonomic research– including the exploration of under-sampled areas and the production ofrevisionary, monographic studies of groups and regions – must be expanded tocomplete the identification of Colombian amphibians. Although few localitiescan be considered thoroughly sampled, Acosta-Galvis (2000) highlighted anumber of high-priority regions, including mid- to high-elevations of the centralGeobatrachus walkeri (Endangered) is a frog known only from the northwesternand western slopes of the Sierra Nevada de Santa Marta in northernColombia. © Taran GrantFigure 1. Priority regions for further inventory and survey work in Colombia.
104Threatened <strong>Amphibian</strong>s of the Worldand northern Cordillera Central and Cordillera Occidental, higher elevationsalong the length of the Serranía de Perijá, the páramos of the CordilleraOriental in southern Cundinamarca and Tolima departments, the Serraníadel Darién along the Colombo-Panamanian border, the southern CordilleraOccidental and adjacent lowlands in Cauca and Nariño departments, andthe Cordillera Oriental and rainforests of Putumayo, Amazonas, Caquetá,Guaviare, Vaupés, and Gauinía departments (Figure 1).The discovery and identification of previously unknown species in allmajor groups of Colombian amphibians shows no sign of slowing in theforeseeable future. Indeed, as the expansion of institutional (e.g., naturalhistory collections, molecular laboratories, GIS databases, parallel computingfacilities) and human resources (e.g., active scientists and hyperactivestudents trained in amphibian systematics) continues, we anticipate that thecurrent rate of discovery will continue or increase in the coming years. Forexample, although it once seemed that the Amazonian fauna was spatiallyquite uniform (albeit highly diverse), denser sampling, exploration of previouslyunstudied localities, and analysis of non-traditional data – especiallyDNA sequences – are revealing much greater complexity, and what werebelieved to be widespread species are frequently found to involve numerous,even distantly related species of more modest distributions. As ourappreciation of the diversity of Colombian species increases, so too doesour understanding of their basic biology so crucial to implementing effectiveconservation strategies to ensure their survival.A second critical area of research in need of attention is the establishmentof long-term, reliably funded studies that monitor natural populations at keylocalities in both pristine and fragmented, or otherwise developing, areas.Such monitoring programs would allow researchers to track the spread ofinfectious diseases, understand the response of individual species to differingpressures, and distinguish natural and normal population fluctuations fromextreme and abnormal declines, all of which is necessary to design andimplement an efficient conservation strategy to ensure the survival of oneof the world’s most diverse and fascinating amphibian faunas.Taran Grant, Andrés R. Acosta-Galvis and John D. LynchReferencesAcosta-Galvis, A.R. 2000. Ranas, salamandras y caecilias (Tetrapoda: Amphibia) deColombia. Biota Colombiana 1:289-319.Lynch, J.D. and Duellman, W.E. 1997. Frogs of the genus Eleutherodactylus in westernEcuador. Systematics, ecology, and biogeography. Special Publication. Natural HistoryMuseum, University of Kansas 23:1-236.Lynch, J.D., Ruiz-Carranza, P.M. and Ardila-Robayo, M.C. 1997. Biogoegraphic patterns ofColombian frogs and toads. Revista de la Academia Colombiana de Ciencias Exactas,Físicas y Naturales 21:237-248.Rueda-Almonacid, J.V., Lynch, J.D. and Amézquita, A. 2004. Libro Rojo de Anfibios de Colombia.Conservación Internacional Colombia, Instituto de Ciencias Naturales-UniversidadNacional de Colombia, Ministerio del Medio Ambiente, Bogotá, Colombia.ESSAY 9.6. THREATENED AMPHIBIANS OF THE WEST INDIESEleutherodactylus orientalis (Critically Endangered) from a small flat topmountain in eastern Cuba called El Yunque de Baracoa. The very smallrange and declining quality of habitat in the region are causes for concern.Adults are only 11mm long, only one millimetre longer than the smallestfrog in the world, E. iberia, which also occurs in eastern Cuba. © S. BlairHedges, Penn StateThe West Indies is a complex assortment of islands and countries locatedbetween North and South America. In total land area (224,000km²) it is similarin size to Great Britain and includes three major island groups: a chain of fourlarge and old islands (the Greater Antilles), a relatively flat limestone bank tothe north (Bahamas and Turks and Caicos Islands), and a classical volcanicisland-arc in the east (the Lesser Antilles). The Greater and Lesser Antilles arelocated within, or at the border of the Caribbean Sea, but the Bahamas Bankis within the Atlantic Ocean. From the standpoint of biodiversity, the WestIndies – sometimes called the “Caribbean Islands” – includes the Caymanand Swan Islands, but usually excludes islands neighboring Central and SouthAmerica (e.g., Aruba, Curaçao, Trinidad and Tobago, etc.), which have faunasthat more closely resemble those on the continents (Figure 1).The origin of the West Indian fauna has been debated for more than acentury, and continues to be an area of active research. Because the GreaterAntilles were once connected, as a geological unit, with North and SouthAmerica in the late Cretaceous (~60-70 million years ago), it has been suggestedthat the present fauna arose by “vicariance” – in other words, traveledwith the islands as they broke away from the continents. But fossil andgenetic research has failed to identify more than a few West Indian groupsthat fit this model, if any. Most, or all, groups probably arrived to the WestIndies by flying, swimming, or floating on flotsam (mats of vegetation). Theeast to west direction of ocean currents means that the source for almostall flotsam in the West Indies is South America (or, more rarely, Africa), andthis agrees with the evolutionary affinities of much of the non-flying landfauna (Hedges 2001, 2006).With its 172 native species, the amphibian fauna of the West Indies isremarkably diverse for such a small land area. Yet it is also peculiar in thatall the native amphibians are frogs – there are no salamanders or caecilians– and most (147 species) belong to a single genus of direct-developing leptodactylidfrogs, Eleutherodactylus (Schwartz and Henderson 1991; Hedges1999). West Indian amphibians range in adult size, from the smallest frogin the world, Eleutherodactylus iberia of eastern Cuba, at 10mm, to the giantditch frog Leptodactylus fallax (the “Mountain Chicken”) of the LesserAntilles, reaching 210mm.Frogs of the genus Eleutherodactylus (see Essay 1.4) lay their eggs onland, bypassing the aquatic tadpole stage, which eventually hatch into miniaturesof the adults. One species of Eleutherodactylus in Puerto Rico evengives birth to living froglets. Parental care is common among the species,and many guard their eggs during development. The sex of the egg-guarderfollows evolutionary lines, with the father having this job in the Puerto Ricangroup of species, whereas in Jamaica the mother is usually the guarder(Townsend 1996). Individual species are adapted to a great many terrestrialniches, including underground burrows, rock caves, cliffs, salt marshes,waterfalls, bromeliads, tree holes, leaf litter, and vegetation of all types.The term “ecomorph” has been used with West Indian Eleutherodactylusto recognize the morphological and ecological convergence in species fromdifferent islands and their adaptations to these niches.Other native amphibians include a modest radiation of toads (11 species,family Bufonidae) and an assortment of treefrogs (nine species, family Hylidae).With eight species, Cuba is the center of diversity for toads, whereasJamaica and Hispaniola are hot spots of hylid frog diversity, with four specieseach. There are several species of aquatic ditch frogs (Leptodactylus) as well,including the Mountain Chicken that occurs on Montserrat and Dominica. Asingle species of dendrobatid frog occurs on Martinique. All but a few speciesof West Indian amphibians are endemic to a single island.Many species occur in the lowlands, but a peak in species density occursbetween 550 and 1,150m elevation, usually corresponding to cloud foresthabitat. On average, species body size decreases by about one mm per100m of increasing elevation, so a lowland species is typically twice as long(~56mm) as one on a mountaintop at 2,500m (Hedges 1999). The number ofsympatric (co-occurring) species varies among and within islands, with thehighest number recorded being 24 species near the Haitian village of Castillon,in the Massif de la Hotte of Hispaniola.From a conservation standpoint, the West Indies is one of the hottestbiodiversity hotspots (Smith et al. 2005). On average humans have destroyedmore than 90% of the original native habitat in the West Indies and it is nosurprise that these forest-dwelling species have been decimated. Clearingof land is often for subsistence farming, but trees are also sold for buildingmaterials or made into charcoal for cooking fuel. Charcoaling is practiced inJamaica, Cuba, and Hispaniola and is one of the major sources of incomein Haiti where the human population has soared to over eight million andwhere essentially no original forests remain (Hedges and Woods 1993;Young et al. 2004).A recent assessment of the status of West Indian amphibians found that84% of the species are threatened (Young et al. 2004), with 37% listed asCritically Endangered, 36% as Endangered, and 11% as Vulnerable. There isno other region of the world that has such a high proportion of threatenedspecies. Among those 63 species listed as Critically Endangered, eight areconsidered to be “possibly extinct” because they have not been seen inmany years (Hedges 1993, 1999; Young et al. 2004). These include the livebearingspecies Eleutherodactylus jasperi of Puerto Rico, as well as severalstream-dwelling species.Besides the major threat from deforestation, a few species have disappearedfrom forested areas and the reason for this is unclear. Certainly, noforests in the West Indies are pristine because of introduced flora and faunathat impact the native biota. For example, Old World rats and mongoosescan be encountered throughout forested areas high on mountains in theGreater Antilles and these species are known to prey on amphibians. Still,it remains to be established whether introduced predators, climate change,a chytrid fungus, another threat, or rather a combination of these factors isthe primary cause for the presumed extinctions of these amphibians (Burroweset al. 2004).Most countries have made some efforts to control deforestation, such asthe designation of national parks and protected areas. These efforts are to beapplauded, but unfortunately most have had limited or no success in slowingthe destruction of habitat. This is especially true in the countries such as Haitiand the Dominican Republic, where clear-cutting and charcoaling continuewithin protected areas, mostly because budgets allocated to environmentalprotection are insufficient. Essentially no original forests remain in Haiti(Hedges and Woods 1993), and therefore many endemic species – includingthose not found in the Dominican Republic – will likely become extinct inthe near future unless something is done soon. Species in other countriesmay not be far behind.It is imperative that international agencies, both conservation-based andFigure 1. Map of the West Indies(Caribbean Islands).Eleutherodactylus glanduliferoides(Critically Endangered) from theMassif de La Selle of Haiti. Thisspecies is only known from a fewplaces on the northern slope of thesemountains, just above the denselypopulated capital city of Port-au-Prince. The region is completelydeforested and this species ispossibly extinct. © S. Blair Hedges,Penn State
Chapter 9. <strong>Amphibian</strong>s of the Neotropical Realm 105otherwise, step in to help protect the environment in Haiti and elsewhere inthe West Indies before it disappears. Salaries for park guards and logisticalsupport (e.g., vehicles, communication equipment, and supplies) for existingparks would provide the most immediate benefit. An accurate knowledgeof the amphibian fauna is also a pre-requisite for conservation efforts, asis basic systematic work, which needs to be supported through increasedtraining of local scientists, better education of government officials chargedwith protecting the environment (e.g., scientists do not pose a threat!), andgreater facilitation of work by foreign scientists. Together with promptand vigorous support directed towards existing protected areas, the realthreats facing the amphibian fauna of the West Indies may be reduced– if we are lucky.S. Blair HedgesReferencesBurrowes, P.A., Joglar, R.L., and Green, D.E. 2004. Potential causes for amphibian declinesin Puerto Rico. Herpetologica 60:141-154.Hedges, S.B. 1993. Global amphibian declines: a perspective from the Caribbean. Biodiversityand Conservation 2:290-303.Hedges, S.B. 1999. Distribution patterns of amphibians in the West Indies. In: W.E. Duellman(ed.), Patterns of distribution of amphibians: A global perspective, pp. 211-254.The Johns Hopkins University Press, Baltimore, Maryland, USA.Hedges, S.B. 2001. Caribbean biogeography: an outline. In: C.A. Woods and F.E. Sergile(eds.), Biogeography of the West Indies: Patterns and Perspectives, pp. 15-33. CRCPress, Boca Raton, Florida, USA.Hedges, S.B. 2006. Paleogeography of the Antilles and the origin of West Indian terrestrialvertebrates. Annals of the Missouri Botanical Garden 93:231-244.Hedges, S.B. and Woods, C.A. 1993. Caribbean hot spot. Nature 364:375.Schwartz, A. and Henderson, R.W. 1991. <strong>Amphibian</strong>s and reptiles of the West Indies: descriptions,distributions, and natural history. University of Florida Press, Gainesville.Smith, M.L., Hedges, S.B., Buck, W., Hemphill, A., Inchaustegui, S., Ivie, M., Martina, D.,Maunder, M., and Ortega, J.F. 2005. Caribbean islands. In: R.A. Mittermeier, P. Robles-Gil, M. Hoffmann, J.D. Pilgrim, T.M. Brooks, C.G. Mittermeier, J.L. Lamoreux and G.Fonseca (eds.), Hotspots revisited: Earth’s biologically richest and most endangeredterrestrial ecoregions, pp. 112-118. CEMEX, Mexico City, Mexico.Townsend, D.S. 1996. Patterns of parental care in frogs of the genus Eleutherodactylus.Contributions to West Indian herpetology: a tribute to Albert Schwartz. R. Powelland R. W. Henderson. Society for the Study of <strong>Amphibian</strong>s and Reptiles, Ithaca,New York, USA.Young, B.E., Stuart, S.N., Chanson, J.S., Cox, N.A., and Boucher, T.M. 2004. Disappearing jewels:the status of New World amphibians. NatureServe, Arlington, Virginia, USA.ESSAY 9.7. SPREAD OF DISEASE IN LATIN AMERICAN AMPHIBIAN POPULATIONSIn 2005-2006, the world watched as avian flu spread across Asia and intoEurope. As we write this, Americans are expecting the disease to cross theAtlantic and infect birds in the United States. Fortunately, at least in the caseof bird flu, we have an example of a global monitoring system that can trackthe spread of disease across geopolitical boundaries, as well as a networkof health-care providers that are prepared to treat patients infected by thevirus. Although many people will be saved, many will still suffer from thisemerging infectious disease despite the benefit of advanced warning systems,treatment facilities, and trained personnel. But let us consider a differenthypothetical situation. What would happen if:• Entire populations of humans were dying from an unknown disease inremote regions of the world?• Few scientists or doctors were aware of the situation?• Nobody contacted the news media or policy makers?• We realized that this was an epidemic, but we had no monitoring networkor treatment facilities?• The few personnel trained to detect and potentially treat the diseasewere distantly located and had neither financial resources nor sufficientinfrastructure to offer any help?• We could prevent deaths in hospitals, but nowhere else?Where and how could we even begin to offer help? With few data, nodedicated sources of funding, and no infrastructure, the situation would seemimpossible. Yet, to do nothing would clearly be unacceptable. In all respects,this is the situation for Latin American amphibians, as population after populationsuccumbs to the frog-killing fungal disease, chytridiomycosis.The current crisis of global amphibian extinctions is the result of multiplecausal factors (Collins and Storfer 2003), but none is more insidious thanchytridiomycosis. Considered an emerging infectious disease (Daszak et al.2000), caused by a recently discovered fungal pathogen, Batrachochytriumdendrobatidis (Bd), chytridiomycosis has been found infecting more than 80species of amphibians in Latin America and over 150 species worldwide,and more areas and species are predicted to be affected in the future (Ron2005). The disease has been directly implicated in numerous populationdeclines and extinctions, and is acknowledged to have caused many othersuch catastrophes that were not observed. Yet, we still lack a completeunderstanding of Bd’s basic biology, pathology, epidemiology, and taxonomic/geographicdistribution.A case study from El Copé, Panama (Lips et al. 2006) illustrates thedevastation that Bd can inflict upon diverse tropical amphibian communitiesthat are typical of upland areas in Central and South America. Following aperiod of eight years of monitoring both amphibian abundance and diseaseprevalence, field crews obtained the first Bd-positive sample on 23 September2004 (Figure 1). Within one week, several dead frogs had been found, andshortly thereafter as many as 19 dead frogs were found in a single day. Afterfour months, researchers had found 350 dead frogs, representing 40 speciesamong eight families of anurans and salamanders, all of which were heavilyinfected with Bd. This report was the first definitive link between catastrophicpopulation declines of amphibians and the sudden appearance of Bd at a site.Within six months, amphibian abundance had been reduced by more than75%, with 50% of species missing and almost all species affected to somedegree. Nocturnal surveys prior to October 2004 often produced as many as170 captures, representing as many as 23 species, but those same transectsnow produce no more than five or six frogs, representing only two or threespecies. Within a remarkably short space of time, the amphibian communityof El Copé has been devastated by this disease, and is not anticipated torecover, because populations have been greatly reduced and because Bdpersists at this site.Although many diseases can impact host populations by causingtemporary or permanent declines in abundance, only recently has diseasebeen considered a major cause of species extinctions (de Castro and Bolker2005). Theoretical work on disease ecology predicts that, as an epidemicinfectious disease reduces the abundance of its hosts, there is an increasein the relative abundance of immune individuals; thus, disease transmissionis reduced to zero, such that the pathogen becomes extinct before the host.Bd is unusual in that it affects a broad taxonomic array of species, and ishighly virulent killing most infected individuals. These are classic traits ofinvasive or novel pathogens, and the arrival of Bd in the Neotropics, and itssubsequent extermination of the native fauna, is similar to the effect smallpoxhad when it was introduced from Europe to the Americas by ChristopherColumbus and his crew.A large number of amphibian species have already been identified as hostsof Bd, and it is likely that both the environment and the frogs are potentialdisease reservoirs (Lips et al. 2006). When populations begin to decline,they can be wiped out in a short period of time with little chance of recoveryor replenishment from other populations. It is this lethal combination of anexotic virulent pathogen (with a broad host range) invading a highly endemicamphibian fauna with small geographic distributions that produces high levelsof species extinction in very short periods of time. In conclusion, we canexpect to see many more losses of amphibian species from the Neotropics,as this disease continues to expand its range. Worse yet, bioclimatic modeling(e.g., Ron 2005; and see Essay 11.4) suggests that Bd can survive in manyother parts of the globe, and is likely to infect hundreds, if not thousands, ofadditional species in Africa and Asia.Many questions remain regarding how the relationships among Bd,amphibian hosts, and environmental conditions produce such a wide rangeof amphibian population responses. We are beginning to appreciate thecomplex challenges involved in mitigating or even reversing impacts ofemerging infectious diseases. We also know that traditional conservationefforts that are tied to habitat protection are inadequate by themselves insuch instances, so effective solutions remain elusive. Trade and transportof amphibians and other wildlife may spread Bd (Hanselmann et al. 2004),but the actual frequency and impact of these factors is not known. Regionaland local climatic conditions may influence the growth and survival of Bd(Pounds et al. 2006), but until a mechanism is identified that can link globalor regional climate changes to individual mortality or reduced populationgrowth, we cannot hope to design effective conservation measures thatwould mitigate these impacts. At this time, while we can effectively treatanimals in captivity (Nichols et al. 2001), we cannot control the spread of Bdin the wild, or treat animals or ecosystems in situ. Another problem is that Bdis difficult to detect because it is microscopic and may persist in ecosystemsfor undetermined periods of time.Chytridiomycosis is an alarming model system for disease-driven extinctionsof an entire fauna. For one emerging infectious disease to appearso suddenly and have such uncontrollable effects on global biodiversity,demands an immediate response. We are facing the synchronous extinctionof a significant proportion of an entire group of vertebrates, and we proposethat it is no longer correct to speak of global amphibian declines but, moreappropriately, of global amphibian extinctions.ReferencesKaren R. Lips and Joseph R. Mendelson IIICollins, J.P. and Storfer, A. 2003. Global amphibian declines: sorting the hypotheses.Diversity and Distributions 9:89-98.Daszak, P, Cunningham, A.A, Hyatt, A.D. 2000. Emerging infectious diseases of wildlife– threats to human health and biodiversity. Science 287:443-449.de Castro, F. and Bolker, B. 2005. Mechanisms of disease-induced extinction. Ecol Letters8:117-126.Hanselmann, R., Rodriguez, A., Lampo, M., Fajardo-Ramos, L., Aguirre, A.A, Kilpatrick,A.M., Rodriguez, J.P. and Daszak, P. 2004. Presence of an emerging pathogen ofamphibians in introduced bullfrogs Rana catesbeiana in Venezuela. BiologicalConservation 120:115-119.Lips, K.R., Brem, F., Brenes, R., Reeve, J.D., Alford, R.A., Voyles, J., Carey, C., andCollins, J.P. 2006. Infectious disease and global biodiversity loss: pathogens andenigmatic amphibian extinctions. Proceedings of the National Academy of Sciences,USA 103:3165-3170.Nichols, D.K., Lamirande, E.W., Pessier, A.P. and Longcore, J.E. 2001. Experimental transmissionof cutaneous chytridiomycosis in dendrobatid frogs. J. Wildl. Dis. 37:1-11.Pounds, J.A., Bustamante, M., Coloma, L., Consuegra, J., Fogden, M., Foster, P., LaMarca,E., Masters, K.L., Merino-Viteri, L.A, Puschendorf, R., Ron, S., Sanchez-Azofeifa, G.,Still, C., and Young, B. 2006. Widespread amphibian extinctions from epidemic diseasedriven by global warming. Nature 439:161-167.Ron, S. 2005. Predicting the distribution of the amphibian pathogen Batrachochytriumdendrobatidis in the New World. Biotropica 37:209-221.Figure 1. Timelines of sequential catastrophic declines of amphibians, asa result of chytridiomycosis, in Costa Rica and Panama. Modified from Lipset al. (2006).An undescribed species of Eleutherodactylus found dead floating in astream during a die off near El Cope, Panama in 2004. © Forrest Brem &Roberto Brenes
CHAPTER 10. AMPHIBIANS OF THE PALAEARCTIC REALMFigure 1. Summary of Red List categoriesfor amphibians in the Palaearctic Realm.The percentage of species in each categoryis also given.Red List Category Number of speciesExtinct (EX) 2Extinct in the Wild (EW) 0Critically Endangered (CR) 13Endangered (EN) 40Vulnerable (VU) 58Near Threatened (NT) 48Least Concern (LC) 245Data Deficient (DD) 62Total Number of Species 46852%Table 1. The number of Palaearctic amphibiansin each taxonomic Family present inthe region.Family13% 0.4% 3%9%12%10%Pachyhynobius shangchengensis (Vulnerable)is a member of the Asian salamanderFamily Hynobiidae. It is known only from theDabieshan area in central China, and it livesin slow-flowing hill streams in forested areas,where its larvae also develop. Over-harvestingfor human consumption is a major threat tothis species. © Arnaud JaminNative species(endemics toregion)Brandon Anthony, J.W. Arntzen, Sherif Baha El Din, Wolfgang Böhme, DanCoglniceanu, Jelka Crnobrnja-Isailovic, Pierre-André Crochet, Claudia Corti,Richard Griffiths, Yoshio Kaneko, Sergei Kuzmin, Michael Wai Neng Lau,Pipeng Li, Petros Lymberakis, Rafael Marquez, Theodore Papenfuss, JuanManuel Pleguezuelos, Nasrullah Rastegar, Benedikt Schmidt, Tahar Slimani,Max Sparreboom, smail Uurta, Yehudah Werner and Feng XieTHE GEOGRAPHIC AND HUMAN CONTEXTThe Palaearctic Realm includes northern Africa, all of Europe, and much of Asia, excludingthe southern extremities of the Arabian Peninsula, the Indian Subcontinent (south of thecrest of the Himalaya), Southeast Asia, and the southern parts of China. It is by far thelargest of the six biogeographic realms.The Palaearctic Realm is dominated by the Eurasian tectonic plate, which comprises all of Europeand most of Asia. Over the past 60 million years, the African, Arabian and Indian plates have collidedwith and compressed the Eurasian plate, forming an extensive array of mountain ranges, generallyrunning in an east-west direction. These ranges include: the Pyrenees; the Alps; the Carpathians; theBalkan mountains; the Caucasus; the mountains of Turkey, Iran, Afghanistan, Pakistan and centralAsia; and the Himalaya. The northern part of the African Plate and most of the Arabian plate arenow dominated by a Palaearctic fauna, whereas the fauna on the Indian Plate is overwhelminglyIndomalayan (as is the fauna on the south-eastern part of the Eurasian Plate). Although the Palaearctichas an extensive land connection with the Afrotropical Region, there is relatively little mixing ofthe faunas, due to the barrier to dispersal formed by the Sahara and Arabian Deserts, particularlyfor organisms such as amphibians. However, there is much more overlap with the Indomalayanfauna, and the boundary between the two regions is hard to delineate in China.For the reasons given above, the southern part of the region is much more mountainousthan the northern part, and includes the highest mountains in the world, peaking atSagarmatha (Mount Everest) at 8,850m. All of the world’s mountains higher than 8,000moccur in the Himalayan and Karakorum ranges.Boreal coniferous forests dominate the northern part of the region, through Scandinaviaand Russia. Further to the south, both the western and eastern parts of the region wereoriginally covered in mixed and broad-leaved temperate forests, giving way to steppe landsin the central part of the region. However, very little remains of the original temperate foresthabitat through most of the region. In keeping with the topography, habitat diversity is greaterin the southern part of the region, ranging from deserts, to grassland, to Mediterranean-typescrubland, and to coniferous forests.The Palaearctic Realm has a very uneven human population density (approximately 32people per square kilometre in Europe in 2005, compared with 137 in China, 339 in Japan,but only 8 in Russia and 11 in Saudi Arabia). The percentage of the population living in ruralareas also varies greatly, ranging from 11.5% in Saudi Arabia, to 26.7% in Europe and Russia,34.3% in Japan, and 59.5% in China. In general, most of the people in the region areconcentrated in eastern Asia and western Europe. The gross income per capita also varieshugely across the region, from US$1,740 in China in 2005, to US$4,460 in Russia, US$11,770in Saudi Arabia, US$27,900 in western Europe, and US$38,390 in Japan. Economic growthrates are very high in China (reaching 10% annually), and now averaging 6% in easternEurope, Russia, and central Asia, but much lower (
Chapter 10. <strong>Amphibian</strong>s of the Palaearctic Realm 107and also extend into Indomalaya. Two of the three species of Cryptobranchidae (giantsalamanders) occur in the Palaearctic, one in China, the other in Japan. These are thelargest amphibians in the world, and are associated with clear streams where they breedby larval development. Finally, one of the six species of Proteidae occurs in the Palaearctic(the other five being in the Nearctic). The Palaearctic species is the Olm Proteus anguinus(VU) which occurs in underground streams in karstic landscapes, in north-eastern Italy,Slovenia, Croatia and a few locations in Bosnia-Herzegovina. It lays eggs, and the adultsretain their larval form.The remaining families include the Hylidae (treefrogs: a large family occurring mainly inthe Americas, New Guinea and Australia, with just 13 species in the region, all in the genusHyla), Microhylidae (narrow-mouthed frogs: globally widespread, with just 13 species inthe region, none of which are endemic), and the Plethodontidae (lungless salamanders: alarge mainly Nearctic and Neotropical family, with just eight species in the region, sevencentred on Italy and one in Korea).The threatened and extinct species in the Palaearctic show very distinct taxonomicpatterns (Table 2). Salamanders, which account for less than one-quarter of the species inthe region, constitute 45% of the threatened or extinct species, with high levels of threat inall families. Among the larger salamander families, 56% of the Hynobiidae are threatened,and over 40% of the Salamandridae. In both cases, habitat loss and the impact of excessiveutilization are the most common threats. This tendency for salamanders to show very highlevels of threat is found also in the Indomalayan, Nearctic and the Neotropical Realms. Thehigh level of threat in the Hynobiidae is probably related to the small geographic ranges ofmany of the species, and their narrow ecological niches in mountainous regionsMost of the threatened frog species occur in the larger families, Megophryidae andRanidae (Table 2). The Megophryidae (Asian spadefoots) has a high percentage (one-third)of threatened species, largely due to habitat loss in China, and often very small geographicranges. These species are usually dependent on clear mountain streams for breeding, avery threatened habitat. The threatened Palaearctic Ranidae (which account for half of thethreatened frogs in the region) are overwhelmingly concentrated in China, where they aregenerally threatened both by over-harvesting for human food, and by habitat loss.Remarkably, the toads (Bufonidae), which in most other regions show high levelsof threat, have no threatened species at all in the Palaearctic. In this region, the familyis dominated by widespread, generally adaptable species. There are also low levels ofthreat in the Rhacophoridae. There are no globally threatened Palaearctic species inthe Hylidae and the Microhylidae. Among the small endemic families, threat levels are25% in the Discoglossidae (painted frogs and midwife toads) and Pelobatidae (Europeanspadefoots), but, at least on the basis of current knowledge, negligible in the Pelodytidae(parsley frogs). It is perhaps noteworthy that 31% of Palaearctic species in the primitivesuborder Archaeobatrachia (Bombinatoridae, Discoglossidae, Megophryidae, Pelobatidaeand Pelodytidae) are globally threatened, compared with an average of 17% for anuransas a whole in the Palaearctic.The great majority (87%) of the threatened amphibians in the Palaearctic are in the Endangeredand Vulnerable categories. Again, the generally low number of Critically Endangeredspecies masks some important family-level differences, with 12% of the Palaearctic Hynobiidae,and 50% of the Palaearctic Cryptobranchidae falling into this category. Salamandersaccount for 69% of the Critically Endangered species in the region.Geographic Patterns of Species Richness andEndemismA map of overall species richness of amphibians in the Palaearctic Realm (Figure 2) showsthat species richness is low through most of the region, especially in most of Russia andcentral Asia. In dry areas, such as in much of the Arabian Peninsula and on the TibetanPlateau, and in very cold areas such as the northernmost belt of the region, there are noamphibians at all. Species richness is highest in China, and moderate in parts of Europe,Japan, and Korea. The high richness in China is partly a reflection of certain species ofIndomalayan origin occurring there, as well as the absence of glaciations in much of centraland southern China during the Pleistocene ice ages. The Palaearctic Realm is generallywell studied, and Figure 2 probably reflects genuine overall patterns of amphibian speciesrichness, though more species are still being discovered regularly, especially in the easternparts of the region, and sometimes even in western Europe.Threatened species (Figure 3a) in the Palaearctic are overwhelmingly concentrated incentral China (especially in Sichuan and northern Yunnan). Elsewhere, there is little discerniblepattern, but with some threatened species in Mediterranean Europe, north-west Africa,Asia Minor, central Asia, and Japan. Not surprisingly, given the small number of speciesinvolved, there are no noteworthy concentrations of Critically Endangered species in theregion (Figure 3b) (much of the apparent concentration in China reflects the wide distributionof one species, the Chinese Giant Salamander Andrias davidianus, which is subject toover-exploitation as a food source).Figure 2. The species richness of amphibians in the Palaearctic Realm, with darker colourscorresponding to regions of higher richness. Colour scale based on 10 quantile classes;maximum richness equals 40 species.a.b.Figure 3. a) The richness of threatened amphibians in the Palaearctic Realm, with darkercolours corresponding to regions of higher richness. Colour scale based on five quantileclasses; maximum richness equals 11 species. b) The richness of CR amphibians in thePalaearctic Realm. Maximum richness equals one species.Species Richness and Endemism within Countries<strong>Amphibian</strong>s are native in 81 countries and territories in the Palaearctic Realm (Figure 4). Chinahas by far the largest number of species and of endemics in the region (265 species, of which137 are endemic). More than half (57%) of Palaearctic species occur in China, and 29% areendemic to this country (see Essay 10.2). India, although second on the list, extends onlymarginally into the Palaearctic, and consequently has no endemics in the region. Only fourother countries (Japan, Italy, France and Spain) have more than 30 species; remarkably, theRussian Federation, despite its huge size, has only 28 species and no endemics, due to thesevere continental climate over a large part of its territory. The low number of species and thelow level of endemism in most countries are caused in part by low overall species richness,but also by the small size of many of the countries in the region. After China, only Japan andThe Alpine Newt Triturus alpestris (Least Concern),in the Family Salamandridae, is widelydistributed in Europe, occurring in both alpineand lowland habitats including forests, meadowsand pastureland. The species breeds,and the larvae develop, in stagnant waters,including shallow ponds, temporary pools, lakes,ditches, drinking troughs, ruts and sometimesslow-moving streams. © Henk WallaysTable 2. The number of species within eachIUCN Red List Category in each Family andOrder in the Palaearctic Realm. Introducedspecies are not included.The Oriental Fire-bellied Toad Bombina orientalis (Least Concern) is one of ten species inthe Family Bombinatoridae. It is widespread in the Korean peninsula, north-eastern China,and parts of the Russian Far East. Although generally common, there is concern aboutthe level of harvest for traditional Chinese medicine, and for the international pet trade.© Twan LeendersFamily EX CR EN VU NT LC DD Total numberof speciesNumber Threatenedor Extinct% Threatenedor ExtinctAnuraBombinatoridae 0 0 0 2 0 5 0 7 2 29Bufonidae 0 0 0 0 3 31 5 39 0 0Discoglossidae 1 0 0 2 4 5 0 12 3 25Hylidae 0 0 0 0 0 12 1 13 0 0Megophryidae 0 2 11 11 5 27 16 72 24 33Microhylidae 0 0 0 0 0 13 0 13 0 0Pelobatidae 0 0 1 0 1 2 0 4 1 25Pelodytidae 0 0 0 0 0 3 0 3 0 0Ranidae 0 2 11 18 14 89 24 158 31 20Rhacophoridae 0 0 0 1 5 23 10 39 1 3TOTAL ANURA 1 4 23 34 32 210 56 360 62 17CaudataCryptobranchidae 0 1 0 0 1 0 0 2 1 50Hynobiidae 0 5 8 11 2 11 6 43 24 56Plethodontidae 0 0 1 2 4 1 0 8 3 38Proteidae 0 0 0 1 0 0 0 1 1 100Salamandridae 1 3 8 10 9 23 0 54 22 41TOTAL CAUDATA 1 9 17 24 16 35 6 108 51 47TOTAL ALL AMPHIBIANS 2 13 40 58 48 245 62 468 113 24
108Threatened <strong>Amphibian</strong>s of the WorldChina*India*Japan*China*TurkeyItalyTurkeyAlgeriaChina*Japan*FranceJapan*China*SpainTajkistanGreeceGreeceJapan*Russian FederationTurkeyItalyGreeceCzech RepublicGermanyIranSpainIranSerbia and MontenegroAustriaCroatiaIranSloveniaItalyTurkeyIranAlgeriaIndia*ItalyAfghanistanIraqPortugalRomaniaAlbaniaMoroccoSlovakiaKorea, RepublicCroatiaSpainUkraineBosnia and HerzegovinaHungarySwitzerlandBulgariaPakistan*AfghanistanMoroccoFranceMoroccoSloveniaTunisiaAlbaniaCroatiaKorea, RepublicPolandGreeceAfghanistanSloveniaAlbaniaBelgiumBosnia andHerzegovinaKazakhstanNetherlandsDenmarkEgyptGeorgiaGeorgiaKorea, D.P.R.IraqKorea, D.P.R.LuxemburgSudan*Macedonia, F.Y.R.KazakhastanKorea, RepublicBelarusAlgeriaSpainKorea, D.P.R.FranceGeorgiaKorea, RepublicBosnia andLatviaHerzegovinaFranceMoldovaPortugalIndia*MoroccoSwedenSerbia andAlgeriaMontenegroSwitzerlandKazakhstanLithuaniaSwitzerlandPortugalAzerbaijanPakistan*LiechtensteinTunisiaSerbia andMontenegro0 50 100 150 200 250 3000 20 40 600 20 40 60 800 10 20 30 40Number of speciesPercentage of endemic speciesNumber of threatened speciesPercentage of species threatenedEndemics Non-endemicsEndemics Non-endemicsFigure 4 Figure 5 Figure 6 Figure 7Figure 4. The number of amphibians presentin and endemic to each Palaearctic country.*denotes countries not entirely within thePalaearctic Realm, hence only the specieswhose ranges fall within the region are included.Only countries with at least 10 nativespecies are included.Figure 5. Percentage of species endemic toeach Palaearctic country. *denotes countriesnot entirely within the Palaearctic Realm,hence only the species whose ranges fallwithin the region are included. Only countrieswith at least one endemic species areincluded.Figure 6. The number of globally threatenedamphibians present in and endemic to eachPalaearctic country. Countries with no globallythreatened species are not included inthe diagram. *denotes countries not entirelywithin the Palaearctic Realm, hence only thespecies whose ranges fall within the regionare included.Figure 7. Percentage of native species thatare globally threatened. Countries with noglobally threatened species are not includedin the diagram. *denotes countries not entirelywithin the Palaearctic Realm, hence only thespecies whose ranges fall within the regionare included.Italy have more than 10 endemic species (25 and 11, respectively). Thirty-six countries in theregion have fewer than 10 native amphibian species (not shown on Figure 4), and only fourof these (Afghanistan, Egypt, Sudan and Tajikistan) have endemics (one each).The amphibian fauna of the Palaearctic has been well summarized in extensive reviewliterature. Important regional works include: Ananjeva and Borkin (1981), Arnold (2002, 2003),Balletto et al. (1985), Borkin (1984, 1999), Cog lniceanu et al. (2000), Corti et al. (1999),Duguet and Melki (2003), Gasc et al. (1997), Griffiths (1996), Grossenbacher and Thiesmeier(1999, 2003, 2004), Kuzmin (1996, 1999), Kuzmin and Semenov (2006), Leviton et al. (1992),Nöllert and Nöllert (1992), Pleguezuelos (1997), Salvador (1996), Schleich et al. (1996),Tarkhnishvili and Gokhelashvili (1999), Thorn (1968), Thorn and Raffaëlli (2001) and Zhao(1999). There are numerous national-level publications, including, but by no means limitedto: Arnold (1995), Baran and Atatür (1998), Bauwens and Claus (1996), Bons and Geniez(1996), Cabela and Tiedemann (1985), Castanet and Guyetant (1989), Crespo and Oliveira(1989), Disi (2002), Fei et al. (1999, 2005), García-París (1985), García-París et al. (2004),Geniez et al. (2005), Goris and Maeda (2004), Groenveld (1997), Grossenbacher (1988), Khan(2006), Kuzmin et al. (1998), Llorente et al. 1995, Maeda and Matsui (1999), Malkmus (2004),Moravec (1994), Parent (1979), Pleguezuelos et al. (2002), Puky et al. (2003), Saleh (1997),Salvador and García-Paris (2001), Schleich and Kästle (2002), Scoccianti (2002), Sindaco etal. (2006), Societas Herpetologica Italica (1996), Uchiyama et al. (2002), Werner (1988), Yeet al. (1993), Zhao and Adler (1993), and Zhao et al. (2000).Although China has many more endemics than any other country in the region, Japan hasthe highest percentage of endemic species at almost 70% (Figure 5), because of the insularnature of the country. In the Palaearctic part of China, over 50% of the amphibians are endemic.In addition to species-poor Tajikistan (already mentioned), high levels of endemism (>20%)also exist in Iran, Italy, and Turkey. In both Japan and China, the levels of endemism are highin frogs and salamanders. In Iran, Italy and Turkey, the endemics are mainly salamanders.China has many more threatened species (64) than any other country in the Palaearctic(Figure 6). Well over half of the threatened species in the region (57%) occur in China, and50% are endemic to China. Endemic species in China are much more threatened (45%)than non-endemics (2%). The number of globally threatened species is less than 10 in allother countries in the region (Figure 6). The percentage of threatened amphibian speciesis highest in Turkey (35%), and is greater than 20% in Algeria, China, Greece, Japan, andIran (Figure 7). With the exception of Turkey, in all Palaearctic countries, the level of threatis much lower than the global average of 33%. The high percentage of threatened speciesin Turkey is a reflection of the presence of nine species of salamanders with small ranges,all threatened by habitat loss.These figures all relate to the number of globally threatened amphibian species in eachcountry. Many countries, especially in Europe, list many globally Least Concern species asnationally threatened. Assessments of the conservation status of Palaearctic amphibianshave been carried out in several countries, including, for example: Switzerland (Grossenbacher1994; Schmidt and Zumbach 2005); Japan (Japan Agency of Environment 2000; Ota2000); Spain (Pleguezuelos et al. 2002); and China (Zhao 1998; Xie and Wang, 2004). Corbett(1989) published an overview of amphibian conservation in Europe, while Cox et al. (2006)presented a review of the status and distributions in the Meditteranean (and see Essay 10.3).Xie et al. (2007) proposed a conservation plan for the amphibians of China.There are only 13 Critically Endangered Palaearctic species, but seven of these occur inChina, two each in Iran and Japan, and one each in Afghanistan and Turkey. Outside China,all Critically Endangered species in the Palaearctic are salamanders.HABITAT AND ECOLOGYHabitat PreferencesMost Palaearctic amphibians (78%) occur in forests, but almost one-third of the fauna (31%)can survive in secondary terrestrial habitats (Table 3; Figure 8). This latter figure is almostdouble that of the Nearctic Realm, perhaps suggesting a higher percentage of adaptablespecies in the Palaearctic. As natural habitats have been completely lost in many parts ofthe Palaearctic, some amphibian species are now dependent of artificial habitats. As in otherregions, forest-dwelling and stream-associated amphibians are more likely to be threatenedthan those occurring in any other habitats, with over 20% of these species being globallythreatened. This is the combination of habitat preferences that has been associated withrapid declines in amphibian populations worldwide (Stuart et al. 2004). <strong>Amphibian</strong>s occurringin savannahs, arid and semi-arid habitats, and secondary terrestrial habitats are lesslikely to be threatened than those occurring in other habitats (Table 3; Figure 8). At leastone highly threatened species, Ranodon sibiricus (EN), is mainly associated with forests,but is surviving at much reduced densities in secondary habitats due to the loss of forestcover (Kuzmin and Thiesmeier 2001).Reproductive ModesLarval development is by far the most common reproductive mode in the Palaearctic (94%of species), compared with 3% for direct development and 3% live-bearing (Table 4; thiscompares with the global picture of 68% larval development, 30% direct development,and 1% live-bearing). The Palaearctic has a smaller proportion of direct-developing speciesthan in any other region of the world. The direct-developing Palaearctic amphibians includeplethodontid salamanders in the genera Speleomantes and Karsenia, and frogs in the generaPhilautus and perhaps Ingerana. The live-bearing species are all salamandrid salamandersin the genera Salamandra and Lyciasalamandra. All of the live-bearing salamanders of theworld are found only in the Palaearctic Realm.Habitat typeNumber ofspecies ineach habitat% of allspeciesoccurring inthe habitatGloballyThreatenedand Extinctspecies% of allspecies inhabitat thatare globallyThreatenedor ExtinctNumber of speciesForestSavannahGrassland% of species in habitat that are threatenedTable 3. The habitat preferences of amphibiansin the Palaearctic Realm.Figure 8. The habitat preferences of Palaearcticamphibians. The plot on the left-hand sideshows the number of species in the regionin each habitat type. On the right-hand side,the percentage of these species which arethreatened is given.Forest 365 78 81 22Savannah 16 3 0 0Grassland 114 24 17 15Shrubland 150 32 23 15Secondary terrestrial habitats 143 31 15 10Flowing freshwater 346 74 87 25Marsh/swamp 127 27 17 13Still open freshwater 254 54 36 14Arid and semi-arid habitats 26 6 0 0ShrublandSecondary terrestrial habitatsFlowing freshwaterMarsh/swampStill open freshwaterArid and semi-arid habitats0 100 200 3000 8 16 24
Chapter 10. <strong>Amphibian</strong>s of the Palaearctic Realm 109The Marsh Frog Rana ridibunda (Least Concern)occurs widely from western Europe towestern China, with invasive populationsspreading in several places in the Palaearcticoutside its natural range. It is a highly opportunisticsemi-aquatic ranid frog, living in mosthabitats, especially in open, well-warmedareas with abundant herbaceous vegetation.It may also be found in slightly saline water.© Miroslav SamardžiReproductive mode All Species Threatened orExtinct speciesTable 4. Palaearctic amphibians categorized by reproductive mode.% Threatenedor ExtinctDirect development 14 3 21Larval development 439 101 23Live-bearing 13 9 69Not known 2 0 0Threat type Threatened species % Threatened speciesAll habitat loss 90 81Agriculture – Crops 41 37Agriculture – Tree plantations 4 4Agriculture – Livestock 16 14Timber and other vegetation removal 48 43Urbanization and industrial development 59 53Invasive species 9 8Utilization 41 37Accidental mortality 5 4Pollution 41 37Natural disasters 11 10Disease 2 2Human disturbance 11 10Fire 5 4Table 5. The major threats to globally threatened amphibians in the Palaearctic Realm. Onlypresent threats to species are tallied.In the Palaearctic, the percentage of globally threatened or Extinct live-bearing amphibiansis much higher than in direct-developing and larval-developing species (Table 4),though, in view of the small number of species involved, the significance of this findingis not clear.MAJOR THREATSHabitat loss is overwhelmingly the major threat to amphibians in the Palaearctic (Table 5;Figure 9), affecting over 80% of the threatened species. Pollution and utilization are thenext most serious threats, each impacting over one-third of the threatened species. Invasivespecies, disease, human disturbance and natural disasters also have significant impacts oncertain species. Most other threats are of relatively minor importance. Chytridiomycosis hasbeen recorded in many parts of Europe, with records from seven countries and 20 out of28 species examined (Garner et al. 2005, 2006). It has been associated with some seriousdeclines in Spain, but so far only of non-threatened species (Bosch et al. 2001). However, itdoes not seem to kill amphibians in most areas where it has been recorded in Europe, andso its overall impact currently seems to be less severe than in some other regions.In terms of the types of habitat loss that are impacting amphibians in the Palaearctic, theimpacts of urbanization and industrial development (affecting over half of the threatenedspecies), vegetation removal (mainly logging in Asia) (>40%) and expanding croplandsand agricultural intensification (over one-third) are the most severe. Tree plantations andlivestock are less important threats in most cases. The heavy impact of urbanization andindustrialization reflects the high human population density in China, Japan, and Europein the areas where amphibian species richness is highest. These factors, as well as theextensive development of agriculture, are also important threats in some parts of the formerSoviet Union. The coding of major threats used in the Global <strong>Amphibian</strong> Assessment doesnot sufficiently depict habitat loss resulting from the over-exploitation of water resources,which is increasingly affecting amphibians in the south-western part of the Palaearctic(especially in the Iberian Peninsula, Greece and northern Africa), resulting in the widespreadloss of breeding sites.All habitat lossInvasive speciesUtilizationAccidental mortalityPersecutionPollutionNatural disastersDiseaseHuman disturbanceChanges in native sp. dynamicsFire0 20 40 60 80 100Percentage of threatened species affectedFigure 9. The major threats impacting threatened amphibians in the Palaearctic Realm.The Green Toad Bufo viridis (Least Concern)from the Family Bufonidae has an extremelywide range in North Africa, Europe, and Westand Central Asia. It is one of the most adaptableamphibians of the Palaearctic, living inforests, steppes, dry grasslands, alpine areas,arid habitats (usually close to oases), andurban areas. © Maik Dobiey
110Threatened <strong>Amphibian</strong>s of the WorldThe Common Spadefoot Pelobates fuscus(Least Concern), one of four species in theFamily Pelobatidae, ranges from westernEurope to central Asia. It occurs mostly inopen areas, and burrows in loose soil whennot breeding. It breeds in small still waterbodies, including ditches, ponds and lakes.© Miroslav SamardžiTable 6. The purposes for which amphibiansare used in the Palaearctic Realm. The numbersin brackets are the number of specieswithin the total that are threatened species.Table 7. The population trends for all extantPalaearctic amphibians.Table 8. The number of species in “rapiddecline” and “over exploited decline” in thePalaearctic Realm by Family.Purpose Subsistence Sub-national/NationalA total of 153 species (50 of which are threatened) are recorded as being used in the region(Table 6). The most common reasons for harvesting Palaearctic amphibians are for food (88species, mostly at local and national levels), pet trade (54 species, mostly at national andinternational levels), and medicinal use (45 species, mostly at local and national levels). Notall of the harvesting of amphibians in the region is considered to constitute a major threat tothe species. Of the 153 species being harvested, utilization is considered to be a threat for96 (of which 46 are threatened species for which harvesting is believed to be contributingto a deterioration in their status). Over 60% of these species seriously threatened by overharvestingoccur in China, where many species of amphibians are extensively harvestedfor human food and medicines. Examples include the Chinese Giant Salamander (which hasundergone catastrophic declines), 12 species of ranid frogs (eight in the genus Paa), andsix species of hynobiid salamanders. Threatened species outside China that are harvestedinclude six species of hynobiid salamanders (in the genus Hynobius) in Japan (mainly pettrade), nine species of salamandrid salamanders (in the genera Lyciasalamandra and Neurergus)in Iran and Turkey (pet trade), and the hynobiid Ranodon sibiricus in Kazakhstan (mainlymedicinal use). A much higher percentage of Palaearctic threatened species is negativelyimpacted by utilization (37%) than in any other region (Indomalaya is the next highest at8%). Harvesting of non-threatened amphibians in Russia as food and medicine exports toChina (mainly Rana dybowskii, but also R. amurensis, R. asiatica, R. nigromaculata, Bufogargarizans, Hyla japonica and Bombina orientalis) has resulted in significant populationdeclines at regional levels in eastern Russia (Maslova and Lyapustin 2005).POPULATION STATUS AND TRENDSEstimates of Population TrendsRegional/InternationalNumberof speciesFood – human 83 (23) 33 (9) 10 (1) 88 (24)Food – animal 3 (0) 0 0 3 (0)Medicine – human and42 (10) 24 (4) 7 (0) 45 (10)veterinaryPets, display animals 7 (2) 39 (9) 47 (9) 54 (15)Research 1 (1) 8 (1) 3 (0) 8 (1)Specimen collecting 1 (1) 7 (7) 8 (8) 9 (9)Population Trend Number of species % of extant speciesDecreasing 246 53Stable 126 27Increasing 5 1Unknown 89 19FamilyNumber of Percentagespecies in of species“rapid decline” in family in“rapid decline”Number ofspecies in“over-exploiteddecline”Percentageof speciesin family in“over-exploiteddecline”Bufonidae 1 3 0 0Discoglossidae 3 25 0 0Megophryidae 2 3 0 0Pelobatidae 2 50 0 0Ranidae 20 13 12 8Cryptobranchidae 1 50 1 50Hynobiidae 2 5 1 2Plethodontidae 1 13 0 0Salamandridae 10 19 4 7A summary of the inferred population trends of Palaearctic amphibians is presented in Table7. For the majority of the species, these trends are inferred from trends in the state of thehabitats on which the species depend (though in some cases, actual population declineshave been noted, especially for species that are being over-harvested). The overall trendsof Palaearctic amphibians reflect a worse situation than the global trend (where 42% aredecreasing and only 27% are stable). In both cases, the percentage of increasing speciesis very small. These results suggest that, although the Palaearctic currently has a lowerpercentage of threatened species than the global average, the situation is probably deteriorating,given the high percentage of decreasing species. One reason for the large numberof decreasing species is that the majority of the region’s amphibians occur in China, wherehabitat loss and over-harvesting are both serious threats. Many species in Europe are alsoin decline, especially due to agricultural intensification.“Rapidly Declining” SpeciesOnly 42 (9%) of the 470 globally “rapidly declining” species occur within the PalaearcticRealm (a full list of all “rapidly declining” species is provided in Appendix IV and includestheir occurrence within each of the realms). Eighteen of these species are in decline due toover-exploitation, 23 due to reduced habitat, and one due to so-called “enigmatic declines”. Notsurprisingly for this region, more declines are attributed to reduced habitat and over-exploitationthan to enigmatic declines. The Palaearctic accounts for 47% of the world’s rapid declines dueto over-exploitation, but only 11% of the reduced habitat declines, and 0.4% of the enigmaticdeclines. One species in the region, Nanorana pleskei (NT) from Qinghai, Gansu and SichuanProvinces in China, has been recorded as undergoing an enigmatic decline, the causes of thisdecline are not known, and have not so far been linked to either chytridiomycosis or climatechange (although these two threats have now been associated with many such declines thathave taken place elsewhere in the world (Lips et al. 2006; Pounds et al. 2006)).The “rapidly declining” species show a distinct taxonomic pattern (Table 8). Among thelarger families, the Ranidae and Salamandridae show a higher tendency to serious declinethan the Bufonidae, Megophryidae and Hynobiidae. There are no Palaearctic species in rapiddecline in the two treefrog families, Hylidae and Rhacophoridae, nor in the Microhylidae.Some small families have high percentages of species in serious decline, most notably theDiscoglossidae and Pelobatidae (both families with large tadpoles) and Cryptobranchidae.Among the larger families, “over-exploited declines” are concentrated in the Ranidae andthe Salamandridae.The “rapid declines” in the Palaearctic also show a clear geographic pattern. The majorconcentration of declines is in China (23 species), followed by Iberia (8), north-westernAfrica (three), and Iran (two). Of the “over-exploited declines”, 16 are in China, and twoin Iran (Neurergus newts in the pet trade). The rapid declines in Iberia and north-westernAfrica have been linked to loss of habitat due to a long-term drying trend in the climate(see Pleguezuelos et al. 2002), linked with the over-exploitation of water resources, whichresults in the widespread loss of breeding sites.KEY FINDINGS• A total of 468 species are recorded from the Palaearctic Realm, of which 113 (24%) areconsidered globally threatened or Extinct.• At the species level, 260 amphibians (56% of those present) are endemic to the Palaearctic;of the 15 families found in the region, three are endemic, and of 66 amphibian generaoccurring, 22 are endemic. Endemism is lower in the Palaearctic than some other regions,especially due to the unclear and somewhat arbitrary boundary with the IndomalayanRegion, especially in China.• The percentage of threatened or Extinct species is lower than in many other parts of theworld, but highest in the families Proteidae (100%), Hynobiidae (56%), Cryptobranchidae(50%), Salamandridae (41%), Plethodontidae (38%), Megophryidae (33%), Bombinatoridae(29%), Discoglossidae (25%) and Pelobatidae (25%).• Overall, the threat levels are much higher among salamanders and newts (47%) thanfrogs and toads (17%).• Geographic concentrations of threatened species in the Palaearctic are overwhelminglycentred on China; elsewhere there is little discernible pattern, though there are smallconcentrations in Mediterranean Europe, north-west Africa, Asia Minor, Central Asiaand Japan.• China has the largest number of species in the Palaearctic Realm (265 species), and alsohas more endemics (137). Another five countries (India, Japan, Italy, France, and Spain)have more than 30 species, but only two of these (Japan and Italy) have more than 10endemics.• China also has by far the largest number of threatened species (64), all other countrieshaving fewer than 10 threatened species. However, the percentage of threatened speciesis higher in Turkey (35% cf. 24% in China).• Threatened species tend to show distinct habitat preferences, with forest-dwellingand stream-associated species being the most frequently threatened (22% and 25%,respectively). This mirrors patterns seen elsewhere in the world.• Habitat loss, primarily due to the impacts of urbanization and industrial development,vegetation removal (mainly logging), expanding croplands and agricultural intensification,is affecting over 80% of the threatened species in the region. Over-harvesting andpollution each impact over one-third of the threatened species. Disease has not beenrecorded as a significant threat in the region so far, although chytridiomycosis is spreadingin Europe.• The overall trends of Palaearctic amphibians are worse than the global situation, with53% of the species in decline.• Of the 470 globally “rapidly declining” species, 9% occur within the region. Most ofthese rapid declines (55%) are caused by severe habitat loss, and 43% are due to overexploitation.Over-exploitation is a much more serious threat, especially in China, thanin any other part of the world.• Two amphibian extinctions have been recorded from the Palaearctic, one in China, theother in Israel. A third species (from China) is possibly extinct.REFERENCESAnanjeva, N.B. and Borkin, L.J. 1981. The fauna and ecology of amphibians and reptiles of the PalaearcticAsia. Academy of Sciences of the USSR, Proceedings of the Zoological Institute 101:1-126.Arnold, H.R. 1995. Atlas of <strong>Amphibian</strong>s and Reptiles in Britain. Institute of Terrestrial Ecology ResearchPublication 10:1-80.Arnold, E.N. 2002. Field Guide to the Reptiles and <strong>Amphibian</strong>s of Britain and Europe. Collins, London, UK.Arnold, E.N. 2003. Reptiles and <strong>Amphibian</strong>s of Europe. Princeton University Press, Princeton, NewJersey, USA.Balletto, E., Cherchi, M.A. and Gasperetti, J. 1985. <strong>Amphibian</strong>s of the Arabian Peninsula. Fauna of SaudiArabia 7:318-392.Baran, I. and Atatür, M.K. 1998. Turkish herpetofauna (<strong>Amphibian</strong>s and Reptiles). Republic of Turkey Ministryof Environment, Ankara, Turkey.Bauwens, D. and Claus, K. 1996. Verspreiding van Amfibieën en Retielen in Vlaanderen. Die Wielewaal,Turnhout, Belgium.
Chapter 10. <strong>Amphibian</strong>s of the Palaearctic Realm 111Bons, J. and Geniez, P. 1996. Amphibiens et Reptiles du Maroc (Sahara Occidental compris): Atlas Biogéographique.Asociación Herpetológica Española, Barcelona, Spain.Borkin, L.J. 1984. Ecology and faunistics of amphibians and reptiles of the USSR and adjacent countries.Academy of Sciences of the USSR. Proceedings of the Zoological Institute 124:1-150.Borkin, L. 1999. Distribution patterns of amphibians in North Africa, Europe, Western Asia, and the FormerSoviet Union In: W.E. Duellman (ed.), Patterns of Distribution of <strong>Amphibian</strong>s: A Global Perspective, pp.329-420, Johns Hopkins University Press, Baltimore, Maryland, USA.Bosch, J., Martínez-Solano, I. and García-París, M. 2001. Evidence of a chytrid fungus infection involvedin the decline of the common midwife toad (Alytes obstetricans) in protected areas of central Spain.Biological Conservation 97:331-337.Cabela, A. and F. Tiedemann, F. 1985. Atlas der Amphibien und Reptilien Österreiches. Verlag FerdinandBerger & Söhne, Vienna, Austria.Castanet, J. and Guyetant, R. 1989. Atlas de Repartition des Amphibiens et Reptiles de France. SociétéHerpétologique de France, Paris, France.Coglniceanu, D., Aioanei, F. and Bogdan, M. 2000. Amfibienii din România Determinator. Editura ArsDocendi, Bucharest, Hungary.Corbett, K. (ed.) 1989. Conservation of European Reptiles and <strong>Amphibian</strong>s. Christopher Helm, London, UK.Corti, C., Masseti, M., Delfino, M. and Pérez-Mellado, V. 1999. Man and herpetofauna of the Mediterraneanisland. Revista Española de Herpetología 13:83-100.Cox, N., Chanson, J. and Stuart, S. (Compilers) 2006. The Status and Distribution of Reptiles and <strong>Amphibian</strong>sof the Mediterranean Basin. IUCN, Gland, Switzerland and Cambridge, UK. v + 42 pp.Crespo, E.G., and Oliveira, M.E. 1989. Atlas da Distribuição dos Anfíbios e Répteis de Portugal Continental.Serviço Nacional de Parques, Reservas e Conservação da Natureza, Lisboa, Portugal.Disi, A.M. 2002. Jordan Country Study on Biological Diversity: The Herpetofauna of Jordan. The GeneralCorporation for the Environmental Protection, Amman, Jordan.Duguet, R. and Melki, F. (eds.). 2003. Les Amphibiens de France, Belgique et Luxembourg. CollectionParthénope, Editions Biotope, Mèze, France.Fei, L., Ye, C.-Y., Huang, Y.-A. and Liu, M.-Y. 1999. Atlas of <strong>Amphibian</strong>s of China. Henan Science andTechnical Press, Zhengzhou, ChinaFei L., Ye, C.-Y., Huang, Y.-A. and Xie, F. 2005. An illustrated Key to Chinese <strong>Amphibian</strong>s. Sichuan Publishing<strong>Group</strong> - Sichuan Publishing House of Science and Technology, Chengdu, China.Frost, D.R., Grant, T., Faivovich, J.N., Bain, R.H., Haas, A., Haddad, C.F.B., de Sá, R.O., Channing, A.,Wilkinson, M., Donnellan, S.C., Raxworthy, C.J., Campbell, J.A., Blotto, B.L., Moler, P., Drewes, R.C.,Nussbaum, R.A., Lynch, J.D., Green, D.M. and Wheeler, W.C. 2006. The amphibian tree of life. Bulletinof the American Museum of Natural History 297:1-370.García-París, M. 1985. Los Anfibios de España. Ministerio de Agricultura, Pesca y Alimentacion, Madrid,Spain.García-París, M., Montori, A. and Herrero, P. 2004. Amphibia, Lissamphibia. In: M.A. Ramos et al. (eds.).Fauna Iberica vol. 24, pp. 1-639. MNCN, CSIC, Madrid, Spain.Garner, T.W.J., Perkins, M.W., Govindarajulu, P., Seglie, D., Walker, S., Cunningham, A.A. and Fisher, M.C.2006. The emerging amphibian pathogen Batrachochytrium dendrobatidis globally infects introducedpopulations of the North American bullfrog, Rana catesbeiana. Biology Letters 2:455-459.Garner, T.W.J., Walker, S., Bosch, J., Hyatt, A.D., Cunningham, A.A. and Fisher, M.C. 2005. Chytrid fungusin Europe. Emerging Infectious Diseases 11:1639-1641.Gasc, J.-P., Cabela, A., Crnobrnja-Isailovic, J., Dolmen, D., Grossenbacher, K., Haffner, P., Lescure, J.,Martens, H., Martinez Rica, J.P., Maurin, H., Oliveira, M.E., Sofianidou, T.S., Veith, M., Zuiderwijk,A. 1997. Atlas of <strong>Amphibian</strong>s and Reptiles in Europe. Societas Europea Herpetologica and MuseumNational d’Histoire Naturelle, Paris, France.Geniez, P., Mateo, J.A., Geniez, M. and Pether, J. 2004. The <strong>Amphibian</strong>s and Reptiles of the Western Sahara.Edition Chimaira, Frankfurt am Main, Germany.Goris, R.C. and Maeda, N. 2004. Guide to the <strong>Amphibian</strong>s and Reptiles of Japan. Krieger, Malabar,Florida, USA.Griffiths, R.A. 1996. Newts and Salamanders of Europe. Poyser Natural History. London, UK.Groenveld, A. 1997. Handleiding voor het Monitoren van Ampfibieen in Nederland. Stichting ReptielenAmfibieen Vissen Onderzoek Nederland, Werkgroep Monitoring Central Bureau voor de Statistiek,Amsterdam, The Netherlands.Grossenbacher, K. 1988. Atlas de distribution des amphibiens de Suisse. Documenta faunistica helvetiae7:1-207.Grossenbacher, K. 1994. Rote Liste der gefährdeten Amphibien der Schweiz. Rote Liste der gefährdeten Tierartenin der Schweiz. Pp. 33-34. BUWAL (Bundesamt für Umwelt, Wald und Landschaft), Bern, Germany.Grossenbacher, K. and Thiesmeier, B. (eds.) 1999. Handbuch der Reptilien und Amphibien Europas, Volume4: Schwanzlurche (Urodela) I. Aula-Verlag. Wiesbaden, Germany.Grossenbacher, K. and Thiesmeier, B. (eds.) 2003. Handbuch der Reptilien und Amphibien Europas, Volume4: Schwanzlurche (Urodela) IIa. Aula-Verlag. Wiesbaden, Germany.Grossenbacher, K. and Thiesmeier, B. (eds.) 2004. Handbuch der Reptilien und Amphibien Europas, Volume4: Schwanzlurche (Urodela) IIb. Aula-Verlag. Wiesbaden, Germany.Japan Agency of Environment. 2000. Threatened Wildlife of Japan – Red Data Book. 2nd ed. Reptilia/Amphibia(in Japanese with English summary). Japan Wildlife Research Center, Tokyo, Japan.Khan, M.S. 2006. <strong>Amphibian</strong>s and Reptiles of Pakistan. Krieger Publishing Company, Malabar, Florida, USA.Kuzmin, S.L. 1996 Threatened amphibians in the former Soviet Union: the current situation and the mainthreats. Oryx 30:24-30.Kuzmin, S.L. 1999. The <strong>Amphibian</strong>s of the Former Soviet Union. Pensoft, Sofia and Moscow, Russia.Kuzmin, S.L., Borkin, L.J., Vorobyeva, E.I., Darevsky, I.S., Munkhbayar, Kh. and Semenov, D.V. 1998.<strong>Amphibian</strong>s and Reptiles of Mongolian People’s Republic: General Problems. <strong>Amphibian</strong>s. Nauka,Moscow, Russia.Kuzmin, S.L. and Thiesmeier, B. 2001. Mountain Salamanders of the Genus Ranodon. Advances in <strong>Amphibian</strong>Research in the Former Soviet Union, volume 6. Pensoft Publishers, Sofia-Moscow.Kuzmin, S.L. and Semenov, D.V. 2006. Conspect of the fauna of amphibians and reptiles of Russia. KMK,Moscow, Russia.Leviton, A.E., Anderson, S.C., Adler, K. and Minton, S.A. 1992. Handbook to Middle East <strong>Amphibian</strong>s andReptiles. Society for the Study of <strong>Amphibian</strong>s and Reptiles, Lawrence, Kansas, USA.Lips, K.R., Brem, F., Brenes, R., Reeve, J.D., Alford, R.A., Voyles, J., Carey, C., Livo, L., Pessier, A.P. andCollins, J.P. 2006. Emerging infectious disease and the loss of biodiversity in a Neotropical amphibiancommunity. Proceedings of the National Academy of Sciences, USA 103:3165-3170.Llorente, G. A., Montori, A., Santos, X. and Carretero, M. A. 1995. Atlas dels Amfibis I Rèptils de Catalunyai Andorra. Edicions El Brau, Figueres, Spain.Maeda, N. and Matsui, M. 1999. Frogs and Toads of Japan. Bun-ichi Sogo, Shuppan, Japan.Malkmus, R. 2004. The <strong>Amphibian</strong>s and Reptiles of Portugal, Madeira and the Azores-Archipelago. A.R.G.Gantner Verlag K.G. Ruggel, Germany.Maslova, L.V. and Lyapustin, S.N. 2005. Illegal export of amphibians and reptiles from the Russian Far East tocountries of the Asian region: the situation in 2003. In: N.B. Anayeva and O. Tsinenko (eds.), HerpetologiaPetropolitana, pp. 191-192, Societas Europaea Herpetologica, St. Petersburg, Russia.Moravec, J. (ed.) 1994. Atlas Rozši eni Obojživlniku v eské Republice. Národní Museum, Prague, CzechRepublic.Nöllert, A. and Nöllert, C. 1992. Die Amphibien Europas. Franckh-Kosmos Verlags-GmbH & coco, Stuttgart,Germany.Ota, H. 2000. Current status of the threatened amphibians and reptiles of Japan. Population Ecology 42:5-9.Parent, G.H. 1979. Atlas Commenté de l’Herpétofaune de la Belgique et du Grand-Duché de Luxembourg.Les Naturalistes Belges, Bruxelles, Belgium.Pleguezuelos, J.M. 1997. Distribucion y Biogeografia de los Anfibios y Reptiles en España y Portugal.Asociación Herpetológica Española. Las Palmas de Gran Canarias.Pleguezuelos, J.M., Márquez, R. and Lizana, M. 2002. Atlas y Libro Rojo de los Anfibios y Reptiles deEspaña. Dirección General de la Conservación de la Naturaleza -Asociación Herpetológica Española,Madrid, Spain.Pounds, J.A., Bustamante, M.R., Coloma, L.A., Consuegra, J.A., Fogden, M.P.L., Foster, P.N., La Marca,E., Masters, K.L., Merino-Viteri, A., Puschendorf, R., Ron, S.R., Sánchez-Azofeifa, G.A., Still, C.J. andYoung, B.E. 2006. Widespread amphibian extinctions from epidemic disease driven by global warming.Nature 439:161-167.Puky, M., Schád, P., Szövényi, G., Fodor, A., Sallai, Z. and Révész, A. 2003. Preliminary Herpetological Atlasof Hungary. Varangy Akciócsoport Egyesület, IUCN SSC DAPTF Hungary, Budapest.Saleh, M.A. 1997. <strong>Amphibian</strong>s and Reptiles of Egypt. Egyptian Environmental Affairs Agency, Cairo, Egypt.Salvador, A. 1996. <strong>Amphibian</strong>s of northwest Africa. Smithsonian Herpetological Information Service109:1-43.Salvador, A. and García-París, M. 2001. Anfibios Españoles. Ed. Canseco. Talavera de la Reina, Spain.Schleich, H.H. and Kästle, W. (eds). 2002. <strong>Amphibian</strong>s and Reptiles of Nepal. A.R.G. Gantner Verlag K.G.,Ruggell, Germany.Schleich, H.H., Kästle, W. and Kabisch, K. 1996. <strong>Amphibian</strong>s and Reptiles of North Africa. Koeltz ScientificBooks, Koenigstein.Schmidt, B.R. and Zumbach, S. 2005. Rote Liste der Gefährdeten Amphibien der Schweiz. BUWAL-ReiheVollzug Umwelt, 48 S.Scoccianti, C. 2002. Amphibia: Aspeti di Ecologia della Conservazione. Guido Persichino Grafica, Firenze,Italy.Sindaco, R., Doria, G., Razzetti, E. and Bernini, F. (eds.) 2006. Atlas of Italian <strong>Amphibian</strong>s and Reptiles /Atlante Degli Anfibi E Dei Rettili D’Italia. Polistampa.Societas Herpetologica Italica 1996. Atlante provvisorio degli Anfibi e Rettili Italiani. Estratto dagli Annalidel Museo Civico di Storia Naturale “G. Doria”, Genova 91:95-178.Stuart, S.N., Chanson, J.S., Cox, N.A., Young, B.E., Rodrigues, A.S.L., Fischman, D.L. and Waller, R.W. 2004.Status and trends of amphibian declines and extinctions worldwide. Science 306:1783-1786.Tarkhnishvili, D.N. and Gokhelashvili, R.K. 1999. The <strong>Amphibian</strong>s of the Caucasus. Advances in <strong>Amphibian</strong>Research in the Former Soviet Union, 4. Pensoft, Sofia, Moscow, Russia.Thorn, R. 1968. Les Salamandres d’Europe, d’Asia, et d’Afrique du Nord. Éditions Paul Lechevalier, Paris,France.Thorn, R. and Raffaëlli, J. 2001. Les Salamanders de L’Ancien Monde. Societé Nouvelle des EditionsBoubée, Paris, France.Uchiyama, R., Maeda, N., Numata, K. and Seki, S. 2002. A Photographic Guide: <strong>Amphibian</strong>s and Reptilesin Japan. Heibonsha, Tokyo, Japan.Weisrock, D.W., Papenfuss, T.J., Macey, J.R., Litvinchuk, S.N., Polumeni, R., Uurta, I.H., Zhao, E.,Jowkar, H. and Larson, A. 2006. A molecular assessment of phylogenetic relationships and lineageaccumulation rates within the family Salamandridae (Amphibia, Caudata). Molecular Phylogeneticsand Evolution 18:434-448.Werner, Y.L. 1988. Herpetofaunal survey of Israel (1950-85), with comments on Sinai and Jordan and onzoogeographical heterogeneity. In: Y. Yom-Tov and E. Tchernov, (eds.), Zoogeography of Israel, pp.355-388. Monographiae Biologicae 62, W. Junk, Dordrecht, The Nerthlands.Xie, F., Lau, M.W.N., Stuart, S.N., Chanson, J., Cox, N.A. and Fischman, D.L. 2007. Conservation needs ofamphibians in China: A review. Science in China, Series C, Life Sciences 50:265-276.Xie, Y. and Wang, S. 2004. China Species Red List, Vol. 1 Red List, Higher Education Press, Beijing,China.Ye, C.-Y, Fei, L. and Hu, S.Q. 1993. Rare and Economic <strong>Amphibian</strong>s of China. Sichuan Publishing House ofScience and Technology, Chengdu, China.Zhao, E.M. 1998. China Red Data Book of Endangered Animals – Amphibia and Reptilia. Science Press,Beijing, China.Zhao, E.M. 1999. Distribution patterns of amphibians in temperate East Asia. In: Duellman, W.E. (ed.),Patterns of Distribution of <strong>Amphibian</strong>s: A Global Perspective, pp. 421-443, Johns Hopkins UniversityPress, Baltimore, Maryland, USA.Zhao, E.M. and Adler, K. 1993. Herpetology of China. Society for the Study of <strong>Amphibian</strong>s and Reptiles,Lawrence, Kansas, USA.Zhao, E.M., Chang, H.W., Zhao, H. and Adler, K. 2000. Revised checklist of Chinese Amphibia and Reptilia.Sichuan Journal of Zoology 19:196-207.The Parsley Frog Pelodytes punctatus (LeastConcern) occurs mainly in France, Spain andPortugal. It is one of just three species inthe Family Pelodytidae. It lives in stony andsandy habitats, often in calcareous areas,and can occur in cultivated land. It breeds inshallow, sunny, open waters, including smallpools, ditches and slow, small streams. ©Jelger HerderEndnotes1 P
112Threatened <strong>Amphibian</strong>s of the WorldESSAY 10.1. CURRENT STATUS OF JAPANESE SMALL SALAMANDERS OF THE GENUS HYNOBIUSThe Japanese archipelago includes more than 3,000 islands. In additionto the four main islands – Hokkaido, Honshu, Shikoku and Kyushu – thearchipelago includes smaller island groups, such as the Ogasawara-shoto(the Bonin Islands and Iwo or Volcano Islands), and the Nansei-shoto (Ryukyuand Satsunan Islands) (Figure 1).The amphibian fauna of Japan is represented by 56 species. Endemismis marked, with around 45 species found nowhere else. One-third of theendemic species belong to the genus Hynobius, a diverse group of 27 smallsalamander species in the family Hynobiidae, with its only other representativesin mainland China (six species), the island of Taiwan (three), and theKorean Peninsula (three). Most species in the genus have allopatric distributions(for example, the Hokkaido or Ezo Salamander H. retardatus is the onlyspecies found on Hokkaido, the most northerly of the Japanese islands) andvery small ranges. For example, the Critically Endangered Oki SalamanderHynobius okiensis is confined entirely to the island of Dogo in the Oki Islandsin Shimane Prefecture, while the Tsushima Salamander H. tsuensis (LC) isfound only on the island of Tsushima (Figure 1).Sixteen species of the genus are recorded from Japan, all of which areendemic. As a result of studies involving the use of molecular techniques,three new species have been described since 1984, including Hynobius katoi(DD) described only in 2004 from montane regions of the Chubu Districtin south-central Japan (Matsui et al. 2004). More recent studies are alsorevealing the presence of large genetic variation in wide-ranging species,and the number of species is likely to increase. For example, among thestream-breeding, montane species, the Odaigahara Salamander H. boulengeri(VU) has been shown to comprise at least three species, each occurring ondifferent islands of Japan (Nishikawa et al. 2001). The Blotched SalamanderHynobius naevius (LC) is also known to contain two lineages that are partiallysyntopic and surely represent different species (Tominaga et al. 2003).Similarly, the Hida Salamander H. kimurae (LC) is genetically split into twodistinct lineages that are morphologically quite different as well (Matsui etal. 2000). Likewise, still-water (lentic) breeding, lowland species are knownto exhibit a great deal of intraspecific variation. It is certain, for example,that H. nebulosus (LC) from western Japan contains more than two species,although delimiting the geographic boundaries between the two is not easydue to their complex variation patterns (Matsui et al. 2006). Finally, TohokuSalamander Hynobius lichenatus (LC) from eastern Japan is also split intoseveral distinct genetic lineages that may warrant recognition at the specieslevel (Aoki and Matsui unpubl.).Hynobiid salamanders are highly aquatic, occurring in streams and pools,and breed by means of external fertilization, with the eggs laid in two distinctiveegg-sacs that are attached to rocks or submerged vegetation. The maleremains in the vicinity of the egg sacs, possibly for parental care, in somespecies. The larvae typically hatch and metamorphose in the same year as theeggs are laid, but in most species (e.g., Abe’s Salamander Hynobius abei; CR), afew larvae may overwinter and only metamorphose the following year. In fact,in the Odaigahara Salamander, the large overwintering larvae sometimes preyon the next year’s batch of new larvae (Nishikawa and Matsui unpubl.).Currently, around one-third (20 species) of Japan’s amphibian species areconsidered threatened, eight of which are from the genus Hynobius. However,the impending taxonomic division of several wide-ranging species discussedabove will almost certainly result in an increase in the number of species listedas threatened in the near future. Abe’s Salamander, currently categorized asCritically Endangered (which together with the Oki Salamander are the onlytwo Critically Endangered amphibians in Japan), has recently been foundfrom several new localities, although these discoveries were made prior toongoing land development in the area. Today, H. abei is specially protectedby the Japan Environment Ministry, and the capture of individuals and themodification of its habitats are strictly regulated.For many years, the ranges of still-water breeding lowland species havebeen much impacted by increasing land development, including road constructionand changes in cultivation practices. In an attempt to increase riceproduction, cultivation of rice paddies was halted for a season or seasons,and then bulldozed flat and reconstructed into large rectangles with theoriginal fertile substrate mud bulldozed back into the paddies. The result ofsuch development was large-scale devastation of the amphibian fauna, exacerbatedby the fact that bulldozing usually took place in autumn and winter,when populations were hibernating (Matsui 2002). Besides lowland species,stream-breeding (lotic) montane species are now also subject to increasinghabitat degradation as a result of the construction of montane roads anddams, as well as ongoing deforestation at higher elevations. Over-harvestingof animals for the national pet trade is also an important threat for speciessuch as Tokyo Salamander H. tokyoensis (VU) and the Oita Salamander H.dunni (EN). As a result of these threats, many local governments are tryingto implement legislation to restrict the collection of animals and to preventland development projects that are detrimental to the salamanders’ survival.Habitat restoration and captive-breeding programmes have been attemptedfor a number of species, but both efforts are currently hampered by an oftenlimited knowledge of species-specific life histories.ReferencesMasafumi MatsuiMatsui, M. 2002. Frogs – our riparian neighbors. Chuo-Koron-Shinsha Company, Tokyo.194 pp.Matsui, M., Kokuryo, Y., Misawa, Y. and Nishikawa, K. 2004. A new species of salamanderof the genus Hynobius from central Honshu, Japan (Amphibia, Urodela). ZoologicalScience 21:661-669.Matsui, M., Misawa, Y., Nishikawa, K. and Tanabe, S. 2005. Allozymic variation ofHynobius kimurae Dunn (Amphibia, Caudata). Comparative Biochemistry and PhysiologyB 125:115-125.Matsui, M., Nishikawa, K., Utusunomiya, T. and Tanabe, S. 2006. Geographic variation inthe clouded salamander, Hynobius nebulosus (Amphibia: Urodela). Biological Journalof the Linnean Society 89:311-330.Nishikawa, K., Matsui, M., Tanabe, S. and Sato, S. 2001. Geographic enzyme variationin a Japanese Salamander Hynobius boulengeri Thompson (Amphibia: Caudata).Herpetologica 57:281-294.Tominaga, A., Matsui, M., Nishikawa, K. and Sato, S. 2003. Occurrence of two typesof Hynobius naevius in northern Kyushu, Japan (Amphibia: Urodela). ZoologicalScience 20:1467-1476.OkiHokkaidoFigure 1. Map of Japan showingthe main islands and islandchains, and the distribution of thegenus Hynobius in the JapaneseArchipelago.HonshuTsushimaRyukyu IslandsShikokuKyushuBonin IslandsVolcano IslandsHynobiid salamanders are highlyaquatic, and breed by means of externalfertilization. Females deposita pair of distinctive egg sacs (hereHynobius tokyoensis), including afull clutch of unfertilized eggs, andmales focus on these egg sacs duringbreeding, rather than on the female.© Henk WallaysESSAY 10.2. CONSERVATION NEEDS OF AMPHIBIANS IN CHINAChina is one of the most geographically varied countries in the world. Itslandscapes include the highest mountains and plateaus, vast river basins,deserts and wetlands, the most extensive karstic region on earth, and bothtemperate and tropical forests. China spans the Indomalayan and PalaearcticRealms, and much of the country is considered to be a transition area betweenthem (Zhao 1999). As a result, the country is particularly rich in biodiversity,with many endemic species, especially in the southern and south-westernparts of the country that were never affected by glaciations.There are 346 extant native amphibians in China 1 comprising 299 speciesof frog, 46 salamanders and one caecilian, plus two extinct species: Cynopswolterstorffi (globally Extinct) (He 1998) and Echinotriton andersoni (extincton Taiwan, still present in the Ryukyu Islands, Japan). China’s amphibiandiversity is greater than in any other country in the Old World, and is the fifthhighest in the world. Further, China has the third highest salamander diversityin the world after the USA and Mexico. Diversity is highest in the centre andsouth of the country, and lowest in the north. Three of the regions with thehighest diversity are Hengduan, Wuyi, and Nanling Mountains, where thefaunas comprise Indomalayan and Palaearctic elements. Two other regionsof high diversity are in the southern tropical regions of Xishuangbanna andHainan. China is also important in terms of endemic species, with 198 speciesoccurring nowhere else, putting the country in sixth position globally.According to the results of the Global <strong>Amphibian</strong> Assessment, 98 amphibianspecies in China (28% of the total) are Extinct or globally threatened and66 species (19%) are categorized as Data Deficient, most of which are likelyto prove to be highly threatened. Threatened species are concentrated mostlyin the central and southern parts of the country, Hainan Island being theplace with the highest concentration of threatened species. Unfortunately,the current protected area network in China (Xie 2003) does not provideadequate coverage for Chinese amphibians (Rodrigues et al. 2004). Most ofthe large nature reserves are in areas with few or no amphibians (especiallyin the north and west of the country), while many of the most important sitesin the central and southern parts of the country are not properly protected.With the exception of the Chinese Giant Salamander Andrias davidianus(CR) (and see Essay 4.7), very few nature reserves have been established foramphibians in China and managed appropriately, and those that do exist areusually protected only at the county level.The eight Critically Endangered species are of very high conservationpriority, and occur in scattered locations across central and southern China.Seven of these species (two salamanders: Echinotriton chinhaiensis andHynobius amjiensis; and five frogs: Oreolalax liangbeiensis, Rana chevronta,R. minima, R. wuchuanensis and Scutiger maculatus) have very small distributions,and these can readily be protected in a small number of reserves. Ofthese, E. chinhaiensis, O. liangbeiensis, R. minima and R. wuchuanensis arenot present in any nature reserve, and their sites need urgent protection ifthey are to be saved from extinction. Unlike the other Critically Endangeredspecies, the Chinese Giant Salamander still occurs very widely, but is nowextremely rare throughout its range and has disappeared from many areas(Zhang et al. 2002; Wang et al. 2004). Some other very threatened speciesthat are very high priorities for conservation attention in China, but that alsooccur in other countries, include Leptolalax ventripunctatus, Rana psaltesand Ranodon sibiricus.Salamanders (with 59% of species threatened or Extinct) are much morethreatened than frogs (24%), and 63% of the salamander species are used insome way by humans. At the family level widely divergent patterns are seen.Over 60% of the threatened species occur in the two largest families, Ranidaeand Megophryidae, both of which also have high percentages of threatenedspecies (26% and 34%, respectively). However, several smaller families showa higher propensity to become seriously threatened, especially Bombinatoridae(60% of species threatened), Cryptobranchidae (100%), Hynobiidae (74%) andSalamandridae (40%).In China, most conservation is implemented at the provincial level. Itis, therefore, important to indicate the relative importance of the differentprovinces for amphibian conservation. Sichuan has easily the largest numberof seriously threatened species, followed by Yunnan, and other provinces incentral and southern parts of the country are also important. However, thepercentage of threatened species shows a somewhat different pattern, withthe Provinces of Qinghai, Sichuan, Ningxia and Taiwan scoring the highest,followed by Hainan, Guizhou, Shaanxi, Shanxi and Henan. Sichuan scoresmore highly in terms of both numbers and percentages of threatened species,reflecting its high level of endemism, with many severely threatened specieswith very restricted ranges.Over 80% of the threatened species are associated with forests, and over80% occur in or around flowing water, usually streams. Streamside speciesappear to be particularly at risk, and in China these species are threatened byalien invasive species, pollution, dams, over-harvesting, siltation, and generalhabitat degradation. Forest species are especially threatened because theytend not to be very adaptable, and timber harvests in China have increased18-fold in the past 50 years, while the area of natural forest has declined by30% (Li and Wilcove 2005).Habitat loss is by far the most pervasive threat, affecting 94% of threatenedspecies, compared with utilization (34%) and pollution (23%). However,when utilization is operational, it often drives species to threatened statusmore rapidly than is the case with the other threats. A total of 78 species ofamphibian in China is negatively impacted by utilization (Table 1), of which 16are rapidly declining (as defined by Stuart et al. 2004), out of a total of 22 rapidlydeclining species in China. More significantly, utilization is a major factor in 28out of a total of 34 category deteriorations in China (category deteriorations are
Chapter 10. <strong>Amphibian</strong>s of the Palaearctic Realm 113FamilyNumber ofspecies adverselyimpacted byutilizationNumber of rapidlydeclining speciesthreatened byutilizationNumber ofcategorydeteriorations forutilized speciesBombinatoridae 2 0 0Bufonidae 4 0 0Hylidae 2 0 0Megophryidae 8 0 0Microhylidae 0 0 0Ranidae 33 12 21Rhacophoridae 3 0 0Cryptobranchidae 1 1 3Hynobiidae 12 1 2Salamandridae 13 2 2Ichthyophiidae 0 0 0Grand Total 78* 16 28Table 1. The impact of utilization on China’s amphibians. Rapidly decliningspecies are those that have deteriorated in Red List category since 1980. Onecategory deterioration is a movement of a species by one Red List categorysince 1980. For example, a movement of one species from Least Concern toNear Threatened is one category deterioration. A movement of two speciesfrom Least Concern to Near Threatened is two category deteriorations. Amovement of one species from Near Threatened to Critically Endangered (asis the case with Andrias davidianus) is three category deteriorations.* If the disputed area with India is included, 84 species in China are adverselyimpacted by utilization.defined in the footnote to Table 1). In short, although utilization impacts manyfewer species than habitat loss, it is the major threat driving species into rapiddecline in China. Ranid species in particular are threatened by over-harvestingfor food, most notably the genus Paa, which has seven rapidly declining species(accounting for 14 category deteriorations), all as a result of utilization.Paa are large, economically valuable frogs, and according to Ye et al. (1993),75% of the species in China are used as human food at the sub-national ornational level. The Chinese Giant Salamander is probably the species that hasdeclined most seriously as a result of over-harvesting.Xie et al. (2007) have provided the basic outline of a conservation strategyfor China’s amphibians. The key elements are: 1) conservation of important sitesand habitats for amphibians; 2) managing for sustainable harvests; 3) scientificresearch (on taxonomy, threatening processes, and basic species biology); 4)planning for chytridiomycosis (not yet recorded from China); and 5) rationalizinggovernmental responsibility for amphibians (at present, responsibility for frogsfalls under the State Forestry Administration, whereas that for salamanders isunder the Ministry of Agriculture, thus making a coherent approach to amphibianconservation difficult). It is now a high priority for China to develop and implementa nationwide strategy to save its remarkable amphibian fauna.ReferencesFeng Xie and Michael Wai Neng LauHe, X.-R. 1988. Cynops wolterstoffi, an analysis of the factors caused its extinction.Sichuan Zoological Journal 17:58-60.Li, Y. and Wilcove, D.S. 2005. Threats to vertebrate species in China and the UnitedStates. BioScience 55:147-153.Rodrigues, A.S.L., Andelman, S.J., Bakarr, M.I., Boitani, L., Brooks, T.M., Cowling, R.M.,Fishpool, L.D.C., Fonseca, G.A.B., Gaston, K.J., Hoffmann, M., Long, J.S., Marquet,P.A., Pilgrim, J.D., Pressey, R.L., Schipper, J., Sechrest, W., Stuart, S.N., Underhill, L.G.,Waller, R.W., Watts, M.E.J. and Yan, X. 2004. Effectiveness of the global protectedarea network in representing species diversity. Nature 428:640-643.Stuart, S.N., Chanson, J.S., Cox, N.A., Young, B.E., Rodrigues, A.S.L., Fischman, D.L. andWaller, R.W. 2004. Status and trends of amphibian declines and extinctions worldwide.Science 306(5702):1783-1786.Wang, X.-M., Zhang, K.-J., Wang, Z.-H., et al. 2004. The decline of the Chinese giant salamanderAndrias davidianus and implications for its conservation. Oryx 38:197-202.Xie, Y. 2003. Problems in the Protected Area Management in China. 2003 World ParkCongress Report.Xie, F., Lau, M.W.N., Stuart, S.N., Chanson, J., Cox, N.A. and Fischman, D.L. 2007.Conservation needs of amphibians in China: A review. Science in China, Series C,Life Sciences 50:265-276.Ye, C.-Y., Fei, L. and Hu, S.-Q. 1993. Rare and Economic <strong>Amphibian</strong>s of China. SichuanPublishing House of Science and Technology, Chengdu, China.Zhang, K.-J., Wang, X.-M., Wu, W., et al. 2002. Advances in conservation biologyof Chinese giant salamander. Biodiversity Science 10:291-297. [In Chinese, withEnglish abstract]Zhao, E.-M. 1999. Distribution patterns of amphibians in temperate Eastern Asia. Pages421-443. In: W.E. Duellman (ed.), Patterns of Distribution of <strong>Amphibian</strong>s – A GlobalPerspective, pp. 421-443. The John Hopkins University Press, Baltimore, USA.Zhao, E.-M. 1998. China Red Data Book of Endangered Animals. Amphibia and Reptilia.Science Press, Beijing, China.1 Since the completion of data collection for the analysis in this book, eleven newamphibian species have been described from China, making a total of 357 species inthe country. However, if the disputed area controlled by India is included, then thereare 365 species in China, rising to 376 with the new species descriptions. Note that forthe purposes of this essay, Taiwan, Province of China, is included, although statisticsfor this island are presented separately elsewhere in the book.ESSAY 10.3. THE STATUS AND DISTRIBUTION OF AMPHIBIANS IN THE MEDITERRANEAN BASINThe Mediterranean Basin, Eurasia and Africa lies at the meeting point oftwo major landmasses. During the mid-Tertiary, a collision between thesetwo continental plates – the northward moving African-Arabian continentand the stationary Eurasian plate – produced an unusual geographical andtopographical diversity, with high mountain ranges (more than 4,500m in elevation),peninsulas, and one of the largest island archipelagos in the world, withalmost 5,000 islands and islets. Biogeographically, the Mediterranean Basin isusually taken as that portion of land around the Mediterranean Sea that has aMediterranean climate, but for the purposes of this essay we take a relativelyloose definition of the Mediterranean Basin, combining a geographic focuson states with a pragmatic cut-off point to the north and west in Europe andTurkey, and in the Sahara Desert to the south. Despite this broader definition,the region is still characterized first and foremost by its climate, where mildwet winters alternate with long hot dry summers. In some parts of the Mediterranean(such as the coastal areas of Libya and Egypt), annual rainfall can beas low as 50mm per year, whereas in the wetter regions, such as the Adriaticcoast of the Balkan countries, annual rainfall can exceed 1,000mm.As with other Mediterranean-type landscapes across the world, includingfor instance the Cape Fynbos region of South Africa and south-westernAustralia, the defining characteristic of the region, at least in terms ofbiodiversity, is the richness of plant species. The flora of the MediterraneanBasin is estimated to include around 25,000 species of vascular plants,13,000 of which are endemic (Médail and Myers 2004). This remarkablefloristic diversity, combined with a concomitant high level of threat, has ledto the region being designated as a global biodiversity hotspot. However, aswith other Mediterranean-climate regions, diversity and endemism amongvertebrates are much lower than that for plants, particularly for birds andmammals. The mammal fauna is largely derived from Eurasian and Africanelements (even the North African mammal fauna has closer affinities withtropical Africa than with the Mediterranean Basin), whereas the avifaunais dominated by Eurasian elements. Diversity among vertebrates is highestamong reptiles, with approximately 355 species present in the region, ofwhich 170 are endemic (Cox et al. 2006).<strong>Amphibian</strong> diversity in the Mediterranean Basin is much lower thanreptile diversity, this being largely a reflection of the extent to which aridand semi-arid habitats predominate within the region. However, at 64%,regional endemism among the Mediterranean amphibian species is relativelyvery high. The family Discoglossidae (painted frogs and midwife toads) isalmost endemic to the Mediterranean region, and two of the three speciesof Pelodytidae (parsley frogs) are fully endemic. All four members of theFigure 1. Richness map of all amphibians in the Mediterranean basin, withdark red colours corresponding to regions of higher richness. Colour scalebased on 10 quantile classes. Maximum richness equals 18 species.Figure 2. Richness map of all threatened amphibians in the Mediterraneanbasin, with dark red colours corresponding to regions of higher richness. Colourscale based on five quantile classes. Maximum richness equals 3 species.Pelobatidae (Eurasian spadefoots) occur in the region, two of them beingwholly restricted to the Mediterranean. Among the newts and salamanders,49% of the world’s 70 Salamandridae species occur in the region, with fiveendemic genera (Chioglossa, Euproctus, Lyciasalamandra, Pleurodeles andSalamandrina 1 ). The region is also noteworthy for its seven endemic cavesalamander species of the genus Speleomantes (family Plethodontidae).Until the recent discovery of a species in Korea (Min et al. 2005), these werethought to be the only Old World members of a family that has around 350species in the Americas. The single Old World member of the Proteidae, theOlm Proteus anguinus, is found only in a small part of north-eastern Italy andotherwise Slovenia, Croatia and a few localities in Bosnia-Herzegovina; theother five members of the family occur in eastern North America.The richness of amphibian species in the Mediterranean basin is highest inEurope (Figure 1), especially in areas of higher rainfall. Diversity is much lowerin the eastern and southern parts of the region. <strong>Amphibian</strong>s clearly avoid aridareas, and are absent from most of the arid Sahara. According to the resultsof the Global <strong>Amphibian</strong> Assessment, 25.5% of the Mediterranean amphibianspecies are considered to be threatened, with 1% Critically Endangered, 12%Endangered and 12% Vulnerable. The most notable concentration of threatenedspecies is Sardinia (Italy), with four threatened species present on this island(Figure 2). One species is listed as Extinct, the painted frog from Israel, Discoglossusnigriventer. Recent surveys conducted in Lebanon following reportsthat the species may survive in the Aammiq marsh in south-east Lebanonunfortunately failed to find any individuals of this species (Tron 2005).The human population of the Mediterranean-rim countries currently is around400 million people, with most people concentrated along the coast. A steadyhistorical and continuing migration towards coastal areas, and specifically inthe south and east of the Mediterranean, has resulted in growing pressureon the coastal environment and, more importantly, on its biodiversity. Afterseveral millennia of human impact, most of the region’s deciduous forests havebeen converted to agricultural lands, evergreen woodlands, and maquis, manywetlands have been lost through drainage and diversion often to irrigate crops,and increasing aridity combined with unsustainable farming and range managementpractices have led to continuing desertification and land degradation inmany areas. Interestingly, amphibian families that have a higher percentageof threatened species are also those considered to be more primitive phylogenetically,and coincidentally those that have large tadpoles making them moredependent on the temporal availability of water, as well as on the presence ofavailable resources in this water to grow to reach maturity.More recently, tourism has had a serious impact on the environment, particularlyin western and southern Turkey, and in Cyprus, Tunisia, and Morocco,as well as the Mediterranean islands of the Balearics (Spain), Sardinia andSicily (Italy), and the Cyclades Archipelago and Crete (Greece). Not surprisingly,then, habitat loss and degradation, mainly due to agriculture and infrastructuredevelopment, has had the largest impact on the region’s amphibian fauna,currently affecting 19 of the 27 threatened species. However, pollution alsohas been a major threat, followed by invasive alien species (e.g., Ficetola et al.2007) not to mention predation by domestic and commensal mammal species.Finally, there is also the risk that the fungal amphibian disease chytridiomycosiscould become a more serious threat to amphibians in the Mediterranean basinin the future. Chytridiomycosis was first recorded in the Mediterranean Basin inSpain in 1997, and has since been implicated in declines of the Mediterraneanpopulations of the common midwife toad Alytes obstetricans (Bosch et al. 2001)as well as the fire salamander Salamandra salamandra and common toad Bufobufo (Bosch and Martínez-Solano 2006). If this fungal disease starts to becomeas pathogenic to Mediterranean amphibians as it has done to species elsewherein the world, then it could rapidly become a much more serious threat in theregion. In particular, other species of midwife toad (i.e., Alytes cisternasii, A.dickhilleni, A. maurus and A. muletensis) may be susceptible to the disease. Ifthis is the case, species infected with the disease, and especially those withsmall insular ranges, could quickly move into a higher category of threat.Sherif Baha el Din, Wolfgang Böhme, Claudia Corti, JelkaCrnobrnja Isailovic, Petros Lymberakis, Rafael Marquez, ClaudeMiaud, Tahar Slimani, smail Uurta, and Yehudah L. WernerReferencesBosch, J., Martínez-Solano, I. and García-París, M. 2001. Evidence of a chytrid fungusinfection involved in the decline of the common midwife toad (Alytes obstetricans)inprotected areas of central Spain. Biological Conservation 97:331-337.Bosch, J. and Martínez-Solano, I. 2006. Chytrid fungus infection related to unusualmortalities of Salamandra salamandra and Bufo bufo in the Peñalara Natural Park(Central Spain). Oryx 40:84-89.Carranza, S. and Amat, F. 2006. Taxonomy, biogeography and evolution of Euproctus(Amphibia: Salamandriadae), with the resurrection of the genus Calotriton and thedescription of a new endemic species from the Iberian peninsula. Zoological Journalof the Linnean Society 145:555-582.Cox, N., Chanson, J. and Stuart, S. (Compilers) 2006. The Status and Distribution of Reptilesand <strong>Amphibian</strong>s of the Mediterranean Basin, pp. v+42. IUCN, Gland, Switzerlandand Cambridge, UK.Ficetola, G.F., Coïc, C., Detaint, M., Berroneau, M., Lorvelec, O. and Miaud, C. 2007. Patternof distribution of the American bullfrog Rana catesbeiana in Europe. BiologicalInvasions 9:762-772.Médail, F. and Myers, N. 2004. Mediterranean Basin. In: R.A. Mittermeier, P. Robles-Gil, M.Hoffmann, J.D. Pilgrim, T.M. Brooks, C.G. Mittermeier, J.L. Lamoreux and G. Fonseca(eds.), Hotspots: Revisited: Earth’s Biologically Richest and Most Endangered TerrestrialEcoregions, pp. 144-147. CEMEX, Mexico City, Mexico.Min, M.S., Yang, S.Y., Bonett, R.M., Vieites, D.R., Brandon, R.A. and Wake, D.B. 2005.Discovery of the first Asian plethodontid salamander. Nature 435:78-90.Myers, N. Mittermeier, R.A, Mittermeier, C.G., Fonseca, G.A.B. de and Kent, J. 2000.Biodiversity hotspots for conservation priorities. Nature 403:853-858.Tron, F. 2005. Second Discoglossus nigriventer rediscovery expedition in the central BekaaValley, Lebanon: 17-28 April 2005 Expedition Report. A Rocha International.1 At the time of writing, the genus Calotriton, represented by two species, had beenremoved from the synonymy of Euproctus (Carranza and Amat 2006).
CHAPTER 11. AMPHIBIAN CONSERVATION – RESPONDING TO THE GLOBAL DECLINE OF AMPHIBIANSColostethus ruthveni (Critically Endangered) isone of seven species of Critically Endangeredor Endangered amphibians that are known tobe confined entirely to the Sierra Nevada deSanta Marta massif in northern Colombia. Thearea is partly protected by the Parque NacionalSierra Nevada de Santa Marta and therecently proclaimed El Dorado Nature Reserve.© Fundación ProAves / www.proaves.orgMichael Hoffmann, Don Church, James P. Collins, Neil Cox, Claude Gascon,Joseph H. Mendelson III, Robin D. Moore, Simon N. Stuart and Kevin C. ZippelModern amphibians have been on this planet for well over 100 million years;they are survivors, and their decline is puzzling. Scientific study of amphibiansholds promise for a deeper understanding of the resilience as well as the limitsof environments. This is an era of increased concern about issues in biodiversityand its maintenance in the face of environmental changes that many believe arisedirectly from human activities. <strong>Amphibian</strong>s may serve usefully as bioindicators,organisms that convey information on the state of health of environments. Howto read the message, and what to do about it, are timely challenges to scientistsand to the public. David Wake, 1991A foray through the scientific literature of the late 1980s and early 1990s reveals a sense ofalarm, and controversy, about amphibian population declines (e.g., Barinaga 1990; Blausteinand Wake 1990; Pechmann et al. 1991; Pechmann and Wilbur 1994). Reports of decreasingamphibian populations, particularly in seemingly undisturbed environments, made it clearthat the cause was not just habitat loss (Pounds and Crump 1994). Care was also calledfor in reporting declines, because many observations may reflect only short-term naturalfluctuations (Pechmann et al. 1991; Pechmann and Wilbur 1994). The issue was nonethelessof sufficient concern that IUCN’s Species Survival Commission established a Declining<strong>Amphibian</strong> Populations Task Force (DAPTF) in 1991, to determine the reality, nature, extentand causes of declines of amphibians throughout the world (Heyer and Murphy 2005; andsee Essay 11.1).A little over a decade later, controversy has given way to the widely held conclusionthat the world’s amphibians are indeed declining and a resulting plea for a unified front tosave them (Mendelson et al. 2006; Gascon et al. 2007). Much of the evidence presentedboth in the preceding pages and those that follow indicates that global amphibian declinesare not only real, but driven by agents familiar and understood (habitat loss, commercialuse, exotic species) as well as novel and insidious (disease, climate change, toxins, and thesynergistic effects thereof). The remaining controversy is how best to arrest an extinctionepisode that is already in progress.In September of 2005, less than a year after the initial release of the results of theGlobal <strong>Amphibian</strong> Assessment, more than 80 of the world’s leading herpetologists andconservationists convened at a three-day <strong>Amphibian</strong> Conservation Summit in Washington,D.C., to write a consolidated action plan to halt further global losses of amphibian populations.The assumption was that it is irresponsible to document amphibian declines andextinctions without also designing and promoting an appropriate response. The resulting<strong>Amphibian</strong> Conservation Action Plan (ACAP; see Gascon et al. 2007) outlines the need forfour types of intervention to conserve amphibians: 1) Expanded understanding of the causesof declines and extinctions; 2) Ongoing documentation of amphibian diversity, and how it ischanging; 3) Development and implementation of long-term conservation programmes; and4) Emergency responses to immediate crises (see Appendix VI). An initial five-year budgetto implement this Action Plan requires at least US$400 million.Given the existence of a consensus conservation framework among those present atthe <strong>Amphibian</strong> Conservation Summit, this chapter is not a new vision for conservation action.Nor is it a detailed review of amphibian conservation efforts, a topic covered in detailelsewhere (e.g., Semlitsch 2003, Heatwole and Wilkinson in press). Rather, this chapter isintended to summarize the key action items of the ACAP, measured against our knowledgeof threats to amphibians – and biodiversity more broadly – accompanied by conservationrecommendations for immediate uptake by governments, corporations, civil society, biodiversityconservation organizations, and the scientific community.THE CORE RESPONSE: DESIGNINGAND IMPLEMENTING AN IMPROVED PROTECTEDAREAS NETWORK FOR AMPHIBIANSIn the preceding pages, we have already established that for nine out of every 10 amphibianspecies classified as threatened, habitat loss and degradation is a major threat. In suchcases, area- or site-based action, which usually takes the form of the establishing protectedareas, is the most effective conservation response for safeguarding biodiversity in the longterm (Bruner et al. 2001). The Programme of Work on Protected Areas of the Conventionon Biological Diversity (CBD) states that protected areas are “…essential components innational and global biodiversity conservation strategies.” However, habitat protection is notnecessarily sufficient to ensure long-term viability in the face of threats such as emerginginfectious disease (Lips et al. 2006) or climate change (Pounds et al. 2006), and often needsto be complemented by other actions, such as environmental education and targeted ex-situinterventions (see later), as well as by actions at the landscape scale that aim to respondto threats operating at a broader scale (Boyd et al. 2008).Unfortunately, although protected areas cover 11.5% of the world’s land surface, theexisting network of protected areas is incomplete and does not adequately capture globalbiodiversity. Indeed, assessments conducted at differing scales (e.g., Rodrigues et al. 2004a;Rondinini et al. 2005), consistently reveal large gaps in the network, this being particularlyevident in the tropics (Brooks et al. 2004), leaving many threatened species unprotected.According to the Global <strong>Amphibian</strong> Assessment, around 40% of all threatened amphibiansare not represented in any protected area. An evaluation of the protection afforded to threatenedamphibians through the current protected areas network suggests that amphibiansare markedly less well covered than other taxa (mammals, threatened birds, and turtles andtortoises; Rodrigues et al. 2004a,b; Essay 11.2). Many of the amphibians that do not occurwithin a protected area are also found only at a single site thereby increasing the risk ofextinction above that of generally more widespread bird and mammal species (Ricketts etal. 2005). Furthermore, protected areas vary in legal status and management type, resultingin variable levels of effectiveness, and enforcing area protection and related laws is oftenlogistically difficult in many countries.The last two decades saw an explosion of literature on the subject of systematic conservationplanning, a field of conservation biology that aims to identify comprehensive networksof sites or protected areas that together will contribute to the overall goal of minimizingbiodiversity loss (Pressey et al. 1993; Margules and Pressey 2000). This is necessary because,as is evident from Chapter 4, neither biodiversity nor threats to it are distributed evenly, withthe result that investments must be made in some places with greater urgency than others.The significant advances made in the field of systematic conservation planning (Kirkpatrick1983; Margules and Pressey 2000) have seen the science move beyond theory to on-thegroundapplication (e.g., Cowling et al. 2003; BirdLife International 2004).Strategic decision-making of this order requires information on both the spatial andtemporal options available for inclusion in the conservation planning framework. Thesetwo variables are commonly referred to as irreplaceability and vulnerability, respectively, inthe conservation planning literature (Pressey and Taffs 2001). Irreplaceability estimates thedegree to which spatial options available for conservation of unique biodiversity featuresare lost if a particular site is lost. At its most extreme, for example, a site with the entirepopulation of a species is wholly irreplaceable – there are no other sites available (i.e., spatialoptions) for conserving the species (Pressey et al. 1994). Vulnerability is a measure of ourtemporal options available. Just as threatened species are more likely to be lost before nonthreatenedspecies, our options for conserving those sites facing high levels of vulnerabilityor threat are more limited in time, with places of higher threat likely to lose their biodiversityvalue sooner (Rodrigues et al. 2004b). Vulnerability and irreplaceability interact in complexways to define conservation priorities. For example, sites of simultaneously high threat andhigh irreplaceability are the highest-order priorities as they correspond to places where theloss of unique biodiversity is imminent. By contrast, conservation in low irreplaceabilityregions can afford to be opportunity-driven, as there are plenty of spatial options.Based on these two concepts, Rodrigues et al. (2004b) expanded their earlier analysisand provided a first-ever attempt at a global framework for the next step of strategicallyexpanding the global protected area network to ensure appropriate coverage of mammals,amphibians, freshwater turtles and tortoises, and globally threatened birds. They identifiedseveral urgent priorities for expanding the network (Figure 1), which fall overwhelmingly inthe tropics, especially in tropical and subtropical moist forests. Not surprisingly, the resultsof this study, in terms of geography, show remarkable congruence with areas already knownto represent consensus priorities for reactive conservation action (Brooks et al. 2006).However, just as any broad-based global priority setting exercise (see Brooks et al. 2006for review of these) is useful for guiding the allocation of resources on a broad scale, theregions identified as urgent priorities for the expansion of the global network by Rodrigueset al. (2004b) are not useful for determining the location of the boundaries of new protectedareas. Consequently, given the coarse scale of their analysis, the key recommendation fromtheir study is that the highlighted areas become urgent priorities for finer-scale assessmentsto identify manageable units of global conservation significance.The <strong>Amphibian</strong> Conservation Action Plan adopted the Key Biodiversity Areas approach(KBAs; Eken et al. 2004; Langhammer et al. 2007) as a tool for identifying globally importantsites for amphibian conservation. Key Biodiversity Areas, which hinge on the concepts ofthreat and irreplaceability, build on nearly a quarter century of work by BirdLife Internationalin relying on a set of criteria for identifying globally significant sites for bird conservation(Important Bird Areas; see, for example, Fishpool and Evans 2001), but extend this conceptto create a taxon-neutral umbrella to incorporate all taxa (see Essay 11.3). The focus of KBAsis on species most vulnerable to extinction: globally threatened species and geographically
Chapter 11. <strong>Amphibian</strong> Conservation – Responding to the Global Decline of <strong>Amphibian</strong>s 115Figure 1. Global distribution of priority sitesfor the expansion of the global protected-areanetwork, based on data for all mammals,amphibians, turtles, and threatened birds.Adapted from Rodrigues et al. (2004b).concentrated species. KBA identification for amphibians is already advanced in severalregions of the world, thanks to data collated through the Global <strong>Amphibian</strong> Assessment(Langhammer et al. 2007), and will provide a ready basis for directing valuable conservationresources to sites of known global biodiversity importance.However, while all KBAs represent global priorities for site-scale conservation, there willbe a subset of sites where conservation action is most urgent. The <strong>Amphibian</strong> ConservationAction Plan itself calls for the identification and safeguarding of the 120 KBAs where uniqueamphibian biodiversity is most at risk. Fortunately, there has already been considerable effortaimed at locating such places through the work of the Alliance for Zero Extinction 1 , a jointinitiative of more than 65 biodiversity conservation organizations around the world that aimsto prevent imminent extinctions by pinpointing and safeguarding sites that represent thelast refuges of highly threatened species. Such sites, termed Alliance for Zero Extinction (orAZE) sites, are discrete areas containing ~95% or more of the global population of one ormore species listed as Critically Endangered or Endangered on the IUCN Red List (Rickettset al. 2005) 2 . The Alliance has identified 546 sites holding 758 Critically Endangered (CR)or Endangered (EN) species of amphibians, reptiles (crocodiles, iguanas, and turtles andtortoises), mammals, birds, and conifers. At least half of these sites (263) have been identifiedfor 381 amphibians (Figure 2). Of the sites identified so far, 125 have no formal protectionand 27 only partial protection 3 , yet again emphasizing that a large proportion of the world’smost threatened biodiversity is not adequately represented in protected areas.All AZE sites/species are important and top priorities in the sense that they representknown places where conservation action is needed now. However, establishing protectedareas may not be the most appropriate response in all cases, but will depend on the nature ofthe threat. Indeed, in the context of site-scale conservation, one set of immediate prioritieswill be sites for which the overwhelming threat driving species declines is loss or degradationof natural habitat and for which the most obvious conservation action involves habitatprotection, maintenance, or restoration. This will be particularly urgent for sites with noformal protection, or at least only partial protection. For example, the Massif de la Hottein Haiti is the only known site for 13 Critically Endangered or Endangered amphibians, andthe overwhelming threat at this site is habitat loss and degradation. Even though part of thesite is protected as the Parc Natural Macaya, there is little active protection of the area andhabitat loss continues even within park boundaries. Such sites (i.e., those where site-basedthreat and habitat loss are high) are priorities for safeguarding, and indeed several, such asthe Parque Nacional Sierra Nevada de Santa Marta in the Colombian Andes, have benefitedfrom collaborative efforts to safeguard remaining habitat 4 . At the time of going to press,efforts were underway to transform a priority cloud forest site in Sri Lanka, Morningside 5 ,into a Biodiversity Reserve managed by the Forest Department of Sri Lanka in collaborationwith local civil society organizations.Establishing protected areas is not normally a simple process. There are usually manycompeting demands for using particular parcels of land, whatever their size. For a protectedarea to be long-lasting, the interests of multiple stakeholders must be considered. A numberof possibilities exist for building support from local stakeholders for protected areas,including: a) enabling local communities to benefit from nature reserves (such as allowingsustainable harvest of relevant products, and demonstrating the benefits of securing watercatchments); b) providing local employment (for example in ecotourism, and in reserve protection,management and monitoring; and c) developing alternative livelihoods in the vicinity ofreserves that enable people to enhance their standards of living in ways that are compatiblewith securing a sustainable future for the reserve in question. Most of the new protectedareas that need to be established to conserve amphibians are in mountainous areas of thehumid tropics, where both human population densities and poverty levels tend to be high. Thesuccess of these plans to establish new protected areas depends on forging alliances withdevelopment assistance agencies and community-based organizations to achieve the twingoals of biodiversity conservation and sustainable economic development. Further, establishmentof protected areas is not the only way to secure areas for biodiversity, and other meansthat complement protected areas, including land purchase, land ownership/stewardship, andland concessions and negotiations with private landowners, may be options.Establishing protected areas that remain resilient to the increasing threat of climate variabilityis another major challenge. Climate change, driven by human activity forces speciesto track preferred habitat conditions, but this movement may be difficult or impossible infragmented landscapes. Further, the rate and magnitude of current climate change is suchthat many species may be unable to disperse quickly enough. For instance, species thatinhabit high-elevation montane regions often have nowhere to disperse to as temperaturesrise and other climatic conditions change. Thus, protecting species where they currentlyexist is only the beginning – protection is needed where species will be in the future, aswell as connections in the landscape between the two. Biologists are now able to createcomputer models of species’ range shifts that can be used to plan corridors, comprisingadditional parks, or multiple-use areas such as forest reserves, to limit the damage ofclimate change. Landscape conservation of this sort requires a large percentage of remainingnatural habitats to be successful. Proactive investment in these areas will help preventaccelerating extinctions in the near future due to the ‘double whammy’ of climate changein a fragmented landscape. For example, numerous threatened frog species in Sri Lanka arehanging on within small fragments of the country’s 5% of remaining rainforest. These speciesmay already be affected by decreasing precipitation and warmer temperatures – conditionsthat increasingly wring small forest fragments dry. In these cases, restored forests aroundexisting patches will provide water retentive buffers locally, as well as corridors to forestremnants that respond differently to a changing climate.It is necessary to emphasize that while there is little doubt that habitat protectionmust remain the cornerstone of any conservation action, the ecological requirements ofsome species means that conservation action is required at scales larger than that ofprotected areas. Among mammals and birds, for example, this is particularly the case forarea-demanding species that have very low population densities or are migratory. Further,the nature of many threats to biodiversity is such that habitat protection alone, or othersite-based interventions, is not necessarily sufficient to preserve the integrity of the broadscaleecological and evolutionary processes necessary to ensure the persistence of specieswithin individual sites (Lens et al. 2002).A recent study provides a unique perspective on the appropriate scale for conservationaction for threatened amphibians, using data collated to support IUCN Red Listassessments. Boyd et al. (2008) found that while most species can be conserved throughindividual sites, or networks of sites, more than one-fifth (21%, or 353 species) of globallythreatened amphibians cannot be conserved at the site scale alone in the medium-term(cf. 13% for mammals and 19% for birds). For amphibians, this is entirely due to alterationsin hydrological processes, such as changes in flow regimes (including various aspects ofseasonality and flow rate), which is deemed necessary for 115 species, and water quality(e.g., temperature, pH, and sediment loads), which is considered an issue for 278 species(Boyd et al. 2008) (Appendix VIIa and VIIb) 6 .Several initiatives and organizations are incorporating broad-scale ecological processesinto conservation planning (e.g., Pressey et al. 2003). However, the task remains challengingdue to problems with setting priorities for ecological processes, and developing targets fortheir conservation (Boyd et al. 2008). Encouragingly, the recovery plans for several threatenedspecies, including the California Red-legged frog Rana aurora 7 , Corroboree Frog Pseudophrynecorroboree 8 and stream-dwelling rainforest frogs of the Wet Tropics region in North-eastQueensland 9 incorporate components relating specifically to the development and implementationof guidelines for maintaining adequate water flow regimes. For example, the recovery planfor the California Red-legged Frog, the only species in the United States for which a recoveryplan has been developed, includes allocating water budgets to county planners and waterdistricts, particularly those in the San Simeon Creek and Santa Rosa Creek in San Luis ObispoCounty, and managing dams and reservoirs that affect populations of the species. Anotherexample is the recovery efforts for the Kihansi Spray Toad Nectophrynoides asperginis, whichincluded the construction of a gravity-fed artificial spray system to create a fine spray in anattempt to maintain the spray-zone microhabitat in the Kihansi Gorge, following the constructionof a dam upstream on the Kihansi River (Lee et al. 2006; Krajick et al. 2006).EX-SITU MANAGEMENT AND REINTRODUCTIONPROGRAMMESWhile immediate habitat protection must be considered an emergency measure for severalamphibians (see above), even with timely and effective protection from direct anthropogenicthreats, such as habitat destruction and over-collection, there are some species for whichwe cannot readily safeguard wild populations from uncontrollable indirect threats, such asclimate change, and direct threats, such as emerging infectious diseases. Reference is oftenmade to the Golden Toad Bufo periglenes as the model case of an amphibian that disappearedin pristine and well-protected habitat (Pounds and Crump 1994), but in the current era itis one of many species that have declined under similar circumstances. In cases involvingthreats of such a nature, conservation action in situ must be complemented by immediateinterventions that may be invasive, but unavoidable.Indeed, with the realization that in the absence of any clear understanding on how tocombat the spread of the chytrid pathogen, the current lack of any management techniqueto prevent wild populations succumbing to the disease, and no real understanding on the
116Threatened <strong>Amphibian</strong>s of the WorldFigure 2. Map of Alliance for Zero Extinctionsites (n=263) triggered by the presence of aCritically Endangered or Endangered amphibian(381 species). Yellow sites are eitherfully or partially contained within declaredprotected areas (n=122), and red sites arecompletely unprotected or have unknownprotection status (n=141). In areas of overlap,unprotected (red) sites are mapped aboveprotected (green) sites to highlight the moreurgent conservation priorities. Modified fromRicketts et al. (2005); AZE data version 2.1.The Massif de la Hotte in Haiti is home tothe last remaining populations of 13 CriticallyEndangered and Endangered amphibians,more than any other single AZE site. © RobinD. Mooredisease’s origins or mechanisms of spread, one strategy is establishing emergency ex-situsurvival-assurance colonies where infected animals can be treated 10 , and as yet unaffectedbut susceptible species may be safeguarded. Indeed, this may well be one of the mostimportant roles for the ex-situ conservation community at this time, as through extensivefield research and predictive modelling, we can, in some cases, anticipate when and wherecertain species will be impacted (see Essay 11.4; and Essay 9.7), thereby creating a narrowwindow of opportunity for proactive intervention.Ex-situ survival-assurance colonies may provide the only option for the eventual returnof some species or populations to safeguarded natural habitat. Now, more than ever, thereis a need for the ex-situ conservation community to play an active role in averting speciesextinctions, not just in terms of providing the much-needed facilities and husbandryexpertise, but in supporting disease-related research, education and conservation effortson the ground. Ex-situ programmes cannot replace in-situ conservation activities, but theyhave the potential to provide the means for species survival while complementary researchand conservation programmes proceed. The role of ex-situ management as a conservationmeasure is controversial for several reasons: 1) gaps in our knowledge of the biology andbreeding behaviour of most species; 2) the removal of individuals with potentially higherfitness from populations perhaps already severely decimated; 3) uncertainty regarding thenumber of individuals required to maintain a viable population; 4) absence of resources forlong-term maintenance of captive populations; 5) the low success rates of several previousex-situ conservation efforts (see later); 6) the number of species for which such survivalassurancecolonies may be needed, and 7) the degree to which such efforts may avert ormisdirect funding from active conservation on the ground.Various authors have discussed the candidacy of amphibians for ex-situ managementprogrammes (Wiese and Hutchins 1994; Bloxam and Tonge 1995) and the role of ex-situmanagement in amphibian conservation has been detailed in several works (e.g., Zippel2005; Griffiths and Kuzmin 2006; Mendelson and Rabb 2006). The valuable role of ex-situmanagement, particularly as part of a coordinated recovery programme (see Essay 11.5)has been recognized as a useful conservation tool by IUCN, which states that it should beinitiated “…to help support the conservation of a threatened taxon, its genetic diversity,and its habitat”, while noting that “Ex situ programmes should give added value to othercomplementary programmes for conservation.” 11 Consequently, just as others have madeprevious calls for ex-situ conservation action as part of a broader set of conservation prioritiesin declining amphibian communities (e.g., Young et al. 2001), the <strong>Amphibian</strong> ConservationAction Plan has incorporated ex-situ management as an explicit component of the overallstrategy, with the proviso that dedicated infrastructure of staff members and facilities willrequire long-term commitments of reliable financial support.However, in the face of estimates that the global ex-situ conservation community cancurrently manage viable populations of only approximately 50 amphibian species (seeEssay 11.5), we need a reference point for assessing the magnitude of task. In AppendixVIII, we list 247 species for which ex-situ survival-assurance colonies are proposed as anurgent conservation measure to ensure the persistence of species in the face of the threatof chytridiomycosis (either because the chytrid fungus has already been documented in thespecies, or because the species has undergone declines and chytridiomycosis is deemedlikely to be the cause 12 ). Mapping the distributions of these species (Figure 3), we see thatmost of the species for which this is deemed necessary are concentrated in the Neotropics,mainly due to the susceptibility of montane, stream-dwelling species in the genera Atelopus,Craugastor, Telmatobius, and Colostethus to chytridiomycosis, although there are alsoconcentrations in the Eastern Arc Mountains and in Australia.An important caveat is that these figures exclude species flagged as Critically Endangered(Possibly Extinct), since such species represent the most urgent priorities for immediatesurvey work to determine whether they persist in the wild (see later). In such cases, anysurviving individuals may need to form the basis for the establishment of an ex-situ survival-assurancecolony, although this depends on the nature of any threat to the species.In addition, there are other cases where ex-situ survival-assurance colonies are neededbecause of the impact of invasive species (for example, Cape Platanna Xenopus gilli, EN),or to mitigate against severe overexploitation (e.g., several Ambystoma species), or becausehabitat loss has been so severe that ex-situ management is deemed necessary pending theinitiation of habitat restoration efforts (for example, Puerto Rican Toad Bufo lemur). Such alist of priority species is not complete, but serves as a useful starting point for the globalconservation community to initiate targeted management programmes.While we draw attention to the need for any ex-situ management programme to adhereto the best available husbandry techniques, we also stress several important considerations.First, while funding opportunities are more likely to be available for such programmes indeveloped countries, there is often reluctance on behalf of developing countries to surrendertheir biodiversity to foreign institutions. This reaction is based on historical and commercial/trade precedents 14 . One solution involves transferring technology and capacity to developingnations by means of establishing ex-situ management facilities with sustainable fundingsources, and backed by appropriate guidance in husbandry techniques for the species inquestion. One example of such a programme in development (it is neither complete inconstruction nor does it have sustainable funding), is the El Valle <strong>Amphibian</strong> ConservationCenter (EVACC) at the El Nispero Zoo in Panama, an effort spear-headed by the HoustonZoo in collaboration with several zoo and non-governmental organizations. This projectaims to serve as a biological repository for threatened Panamanian amphibian species andto use these populations as a possible source for reintroductions, but has a second objectivewhich is to foster appreciation and raise awareness of amphibians among the public,through programs of education and research. Indeed, half of the allotted 220-m² space atEVACC is dedicated to public exhibits and the rest to behind-the-scenes space for managingsurvival-assurance populations and research projects. It had been hoped that EVACC wouldbe operational before the arrival of chytrid in the region, but in April 2006 the first amphibiandeaths due to chytridiomycosis were reported from frogs inhabiting waters of the Rio de Jesús(collected a few months before). Consequently, the emergency collection of amphibianswas initiated in advance of the facility being completely constructed, and a temporaryquarantine and treatment area was established in a nearby hotel. As of end July 2006,collecting teams of 50 volunteers representing 26 institutions had collected 10 of the 12priority species 15 . The goal is for current project leaders to leave the programmes and turnover responsibility for conservation initiatives to Panamanian colleagues.Another possibility involves negotiating ownership rights such that source countries mayretain ownership over frogs and their genetic material sent to foreign zoos to form the basisfor ex-situ survival-assurance colonies. This has already been achieved for the Kihansi SprayToad Nectophrynoides asperginis, which is being bred in the Toledo and Bronx Zoos. Thesetoads are being managed under an agreement with the Government of Tanzania, whichretains ownership of the animals (see Lee et al. 2006; Krajick 2006).Second, any ex-situ programme must be accompanied by appropriate actions directedat the long-term conservation of the species in situ. This could include, but may not belimited to, habitat protection, public education and awareness, research (e.g., breedingbiology), population monitoring, targeted species-specific actions (such as control ofinvasives), and so forth.Since the over-riding conservation role for ex-situ management programmes is theeventual reintroduction/translocation of species back into the wild, it is worth noting that
Chapter 11. <strong>Amphibian</strong> Conservation – Responding to the Global Decline of <strong>Amphibian</strong>s 117Figure 3. The global distribution of CriticallyEndangered and Endangered amphibians(n=247) requiring ex-situ intervention (incombination with complementary in-situ andresearch-based actions). 13 No fewer than 59of these species have their entire distributionsconfined to single sites (i.e., AZE species;see Figure 2).achieving the first has usually proved much easier than the latter, with much consequentdebate surrounding the value of these techniques (Dodd and Seigel 1991; Seigel and Dodd2002; Trenham and Marsh 2002; Dodd 2005). Indeed, even considering conservation successstories, such as the Mallorcan Midwife Toad Alytes muletensis (see Essay 11.6), anumber of long-running projects have yet to demonstrate similar success, even in developedcountries such as the United States. For example, Wyoming Toads Bufo baxteri, now Extinctin the Wild, have been part of an active breeding programme since 1993 and yet despiterepeated introductions of toadlets and tadpoles to Mortenson Lake, the population is stillnot self-sustaining (Dreitz 2006; and see Essay 11.7). The causes for the failure of successfulreintroduction are not always clear, although disease and other factors are often implicated.In any case, there are several examples of species that would be extinct at this time if theyhad not been included in captive programmes (such as the Wyoming Toad). In such cases,extinction has been deferred, giving researchers time to solve the in-situ problems.Fortunately, other long-running conservation breeding programmes are finally showingsome signs of success, such as that for the Puerto Rican Toad Bufo lemur. This species wasbelieved extinct until its rediscovery in 1967, when a small breeding population of toads wasfound in north-west Puerto Rico (near Quebradillas) and subsequently in the Guanica ForestPreserve in the south-west of the island. No toads have been seen at the north-western sitesince 1992, and the Guanica Forest Preserve has become the last locality known to hold awild population of this species. An ex-situ programme for the Puerto Rican Toad began in1980 at the Mayaguez Zoo, with offspring from this programme later sent to zoos in NorthAmerica, including Buffalo Zoo in New York and the Toronto Zoo in Canada. A SpeciesSurvival Plan (SSP) 16 was formed in 1983, with the goal of assisting the recovery of thisspecies. To date, the Puerto Rican Crested Toad SSP programme includes some 23 zoos andaquaria; its efforts include education and habitat restoration, and the SSP members aresupporting high school students who look for toads and study ponds in the northern part ofPuerto Rico and have a special biology club with the toad as their logo. The SSP members(the zoos and aquaria in the SSP, along with Puerto Rican partners, including teachers,students, the Guanica Forest Manager, the Puerto Rican DNR and USFWS) construct newponds for toads; install gates and signs to protect the breeding beach; print conservationbooklets, bumper stickers and decals for students and interpretive centres; work with thelocal Juan Rivero Zoo in Mayaguez to help in their conservation programmes for PuertoRican wildlife, including the toad; and support research on toad habitats and diseases byPuerto Rican graduate students and veterinarians. In zoos, the toads are managed geneticallyto ensure a diverse assurance population in the event of the unexpected loss of thesmall Guanica population. Tadpoles produced in the ex-situ programme have been sentback to Puerto Rico for release into the wild, and two artificial release ponds have beenconstructed to receive the tadpoles. Releases began in 1983 with 75 toadlets, and about100,000 tadpoles have been released over the last 10 years. Eventually, in 2003, the firstadult toads released as tadpoles returned to breed in the constructed ponds, evidence ofthe first signs of success (Zippel 2005).While it is not possible to identify here a specific unbiased set of species for whichreintroduction may be an appropriate conservation tool, it is essential that species arecarefully appraised for their suitability for reintroduction, as they should also be appraisedfor their suitability for captive breeding, and in accordance with the IUCN/SSC Guidelinesfor Reintroductions 17 . Priorities for reintroduction clearly should focus on globally threatenedspecies, and since the most successful animal reintroductions have usually involved thosespecies that have reversible threats (Griffith et al. 1989; Wilson and Stanley Price 1994), itmay well be necessary to give preference to those species for which actions are alreadyunderway to mitigate threats such as direct persecution, pollution, and introductions offish or other predators. Reintroducing Axolotls Ambystoma mexicanum to Lake Xochimilco,for example, is complicated by the fact that existing threats need to be neutralized andpotential disease and genetic risks addressed before animals from ex-situ populations arereintroduced into the wild (and see Essay 11.8).This also seems the most appropriate place to mention the occasional need for translocationof threatened species to new sites as a result of impending habitat loss. An example isChirixalus romeri, an endemic to Hong Kong that lost part of it natural habitat when the newHong Kong International Airport was constructed. With funding from the Hong Kong JockeyClub, the University of Hong Kong undertook a study of the ecology and population geneticsof this species to identify suitable sites for relocation of this threatened population. Morethan 200 individuals were rescued from Chek Lap Kok in 1992 before full-scale constructiontook place. A collaborative partnership was also formed with Melbourne Zoo to breed thisspecies ex-situ, which was successful and over 2,800 frogs and tadpoles were released intoeight sites in Hong Kong Island and the New Territories where they have been monitoredevery year. Breeding populations have established in seven of them.Finally, ex-situ rearing of animals can also form part of an important conservation strategyaimed at promoting reasonable and sustainable use of wildlife, although only if the supplyfrom farmed animals is such that it replaces that from the wild (see Essay 11.9). In Mexico,for example, despite the wide availability of Axolotls produced in ex-situ populations, wildanimals are still captured and sold illegally in local markets (McKay 2003; and see Essay2.3), while in China, even the existence of more than 100 apparently legal Chinese GiantSalamander farms to supply the ever-growing food market is insufficient to meet marketdemands (Essay 4.7). Furthermore, an important complication of some of these commercialenterprises is that they often farm non-native species, such as the American Bullfrog Ranacatesbeiana, which escape and become invasive (see Essay 4.8). This could have seriousimplications for conservation, because the rearing of bullfrogs is a growing industry in partsof the world such as China and South America, particularly Brazil, Uruguay, and Argentina,and this species may carry chytridiomycosis (see Mazzoni et al. 2003).Nonetheless, sustainable community-operated farms and commercial breeding farms canhave benefits, but it is recommended that they use local species instead of exotic ones toreduce the risk of disease spread and establishment of exotic species. It is also necessaryto monitor commercial breeding farms for highly valuable species to prevent wild-caughtindividuals from entering into the trade. Finally, a percentage of the profits generated fromsuch breeding farms should be channelled back to amphibian conservation whenever possible(Carpenter et al. 2007).In conclusion, while there is disagreement about the interplay between in-situ and ex-situconservation action, it is preferable not to have one undermining the other. In practice, ifwe are to prevent amphibian extinctions, there can be no doubt of the importance of stemmingrampant environmental degradation (Pounds et al. 2006). Other amphibian-specificconservation actions, such as those ex-situ, should continue, but their effectiveness willlikely be reduced or compromised in the face of growing environmental deterioration. Yet,the two are compatible, complementary actions, insofar as their relative contributionsand limitations are understood, accepted, and explicitly stated: ex-situ action is vital for afinite set of highly threatened species (but clearly not urgent for all), yet requires parallelin-situ efforts. Our ability to respond depends largely on the priorities of the global ex-situconservation community.TARGETED IN-SITU ACTIONSHabitat protection and the establishment of ex-situ survival-assurance colonies representthe two most urgent in-situ and ex-situ conservation actions required, respectively, if weare to have any immediate impact on amphibian declines globally. But, as already discussedabove, even though they complement one another, they will not suffice on their own. Indeed,even Ricketts et al. (2005) note that in the case of sites identified using their methodology topinpoint species having their last remaining populations confined to single sites, measuresThe El Valle <strong>Amphibian</strong> Conservation Center(EVACC) at the El Nispero Zoo in Panama isan effort spear-headed by the Houston Zoo incollaboration with several zoo and non-governmentalorganizations. Half of the allotted220-m² space at EVACC is dedicated to publicexhibits and the rest to behind-the-scenesspace for managing survival-assurance populationsand research projects. © Sara Riger
118Threatened <strong>Amphibian</strong>s of the WorldA mascot, highlighting the unique characteristicsof the endemic Puerto Rican Crested ToadBufo lemur (Critically Endangered), contributesto island-wide conservation programmes atschools, fiestas, and zoo education and outreachevents. © Toronto Zooof habitat protection will need to be complemented by other actions, such as the control ofinvasive alien predators/competitors or disease.Invasive speciesThe <strong>Amphibian</strong> Conservation Action Plan does not deal specifically with the issue of theimpact of invasive species, which could have detrimental effects on populations as competitors,predators, and interbreeding to create hybrids. Studies show that alien predators,particularly introduced fish species (e.g., Trout Oncorhynchus spp., Salmo spp., centrarchidslike bass and sunfish, and Mosquitofish Gambusia spp.), American Bullfrogs, and crayfish(Procambrus clarkia) have contributed to amphibian population declines (see Kats and Ferrer2003). Some of these studies documented declines among amphibian communities withinprotected areas (e.g., Knapp and Matthews 2000). Although introduced predators may beubiquitous in watersheds within the range of the threatened species, areas of high concentrationsshould be identified and the numbers of non-native predators reduced, particularlywithin protected areas. For example, the recovery plan for the California Red-legged FrogRana aurora draytonii identifies a number of sites as areas that may benefit from non-nativepredator removal, including Yosemite National Park. 18While the most important conservation measure is prevention by means of more effectivequarantine measures and enforced legislation (see Policy below), more aggressive actioninvariably is required for combating alien predators (e.g., Knapp and Matthews 1998) 19 .Control and removal of invasive predators is not always feasible or possible in those cases,where, for example, these species have commercial or recreational value (e.g., alien gamefish), or where the species exhibit particular traits that characterize successful invaders (e.g.high reproductive rate), thereby making removal difficult. Control methods generally involvepond drainage, physical removal, poisoning (e.g., rotenone 20 ), and eliminating breedinghabitat of non-native predators. On the island of Mallorca in the Mediterranean Sea, forexample, considerable effort was expended to control introduced snakes (Natrix maura),but these labour-intensive efforts mostly involved removing snakes by hand from breedingsites (Guicking et al. 2006). Although relatively large numbers of snakes were removed frombreeding sites, there have been no studies to assess the effectiveness of this technique incontrolling snake numbers. Most importantly, toads continue to survive and breed in thesepools. One recent study found that large-scale removal of introduced non-native fish couldresult in at least partial reversal of the decline of Mountain Yellow-legged Frog Rana muscosa(CR), once a common inhabitant of the Sierra Nevada (California, USA). At three lakeswhere fish were removed, amphibian population densities increased significantly followingremoval of predaceous fish. Following these population increases, frogs dispersed to adjacentsuitable (but unoccupied) sites, moving between 200 and 900m along streams or across dryland (Knapp et al. 2007). On the other hand, the afore-mentioned California Red-legged Frogrecovery plan notes that filling in stock ponds known to have non-native species may be morecost effective and productive over the long-term than removing individuals. In Venezuela,the transportation of Rana catesbeiana to other regions outside of Mérida has been legallyprohibited, and recommendations for its control and removal were passed (Resolution #64of 15 July 2002). Furthermore, the national government, via its National Office for BiologicalDiversity, Ministry of the Environment, and the State Environmental Authority of Mérida,actively engage in collection and removal of individuals of all stages of the species (e.g.,collection of eggs, use of dragnets, nets, air rifles and traps).New studies involving age-structured population models provide interesting insights intothe control and management of invasive species for the benefit of threatened amphibians.Doubledee et al. (2003), in discussing the impacts of American Bullfrogs on the CaliforniaRed-legged Frog, assessed the effectiveness of different management strategies used tocontrol bullfrog populations (such as shooting of adults and pond draining). Their resultsfound that efforts taken to eradicate bullfrog populations by increasing adult mortalitythrough shooting are likely to be ineffective in promoting coexistence, first because alarge amount of effort – equivalent to a mortality of 65% or greater every two years – isrequired to make shooting adults beneficial for Red-legged Frog persistence, and secondbecause such effort can create fluctuations in bullfrog population dynamics, which in turnmay cause large fluctuations in the Red-legged Frog population. Their results suggest thata combination of shooting adults and draining livestock grazing ponds is the most successfulbullfrog management strategy. Even low shooting efforts significantly decreased adultbullfrog densities by 80% when coupled with pond draining.The recent emergence of Batrachochytrium dendrobatidis, the chytrid fungus that causeschytridiomycosis, may itself be the result of unintentional introductions of a pathogen as aninvasive alien species. One suggestion is that the spread of the pathogen started with theexport of the African Clawed Frog Xenopus laevis from Africa for use in pregnancy testingduring the 1930s onwards. But more research is needed to test this hypothesis. Regardlessof the origin of the chytrid fungus, however, bullfrogs carry it and so establishment of feralpopulations of this species in countries is one means by which the pathogen can gain accessto other hosts (Weldon et al. 2004; and see Essay 4.8).DiseasesTo date, there have been few direct intervention efforts to prevent the spread of diseasein wild populations of animals. Relatively successful examples include African Wild DogsLycaon pictus in Tanzania’s Serengeti National Park for rabies (Woodroffe 2001) andEthiopian Wolves Canis simensis in the Bale Mountains National Park of Ethiopia (Haydonet al. 2006). There is still no vaccine for chytridiomycosis, and development would, in anyevent, probably take many years. Furthermore, direct treatment of amphibians in the wildwith anti-fungal agents is not without problems: release of anti-fungal agents in a waythat would target the frog population significantly enough to deal with infections wouldhave unknown effects on the fungal component of the ecosystem (Daszak et al. 2008).Therefore, population management strategies involving capture of wild individuals and exsitu treatment, combined with selection for resistant individuals that could ultimately formthe basis of lineages that could be released back into the wild, are the only viable optionsat present (see earlier). It may be possible to collect animals for survival-assurance coloniesby making use of predictive modelling and thereby move ahead of the planned spread of thedisease, as was conducted by Project Golden Frog (PGF) (see Essay 11.5) and attempted withEVACC. Other preventative measures in the interim include the disinfection of vehicles andfootwear with 10% chlorine bleach solution to reduce the risk of pathogen dispersal 21 , anddistributing signs to make people aware of the disease, the risk of spread, and means tosterilize potentially affected items. The best way to prevent unwanted diseases is to blocktheir entry to a region. Australia affords an example of such a strategy. In July 2002, theAustralian Government Minister for the Environment and Heritage decided that a threatabatement plan (TAP) “was a feasible, effective and efficient way to abate the infectionprocess, and directed a nationally coordinated threat abatement plan be prepared to guidemanagement of the impact of the amphibian chytrid fungus on Australian amphibians.” ATAP was adopted in 2006 and one goal was to prevent amphibian populations or regionsthat are currently chytridiomycosis-free from becoming infected by blocking further spreadof the amphibian chytrid within Australia.Water qualityEarlier we discussed evidence that changes in water quality and water flow regimes areoften a significant threat to amphibian species globally. Changes in water quality may includechanges in sediment load as a result of upstream logging, but often are also due to theinfluence of environmental contaminants or pollutants (including pesticides, pharmaceuticals,and heavy metals). In much of the Neotropics, for example, lowland agricultural regions aresubject to extensive agricultural spraying (e.g., Castillo et al. 1997). Furthermore, abioticfactors (temperature, salinity, pH, and ultraviolet-B radiation) may also pose a threat whennormal values are exceeded and can, in turn, influence the toxicity of other contaminants.Most work to date has focused on the detrimental effects of contaminants on the aquaticlife-stage of amphibians, although recent studies have also demonstrated that contaminantscan have negative effects in the terrestrial environment (e.g., Hayes et al. 2002).As already discussed, actions targeted at contending with changes in hydrologicalprocesses are already incorporated into the recovery plans of several species, and generallyinvolve actions that may not be directed explicitly at actual sites where declines ofamphibians are occurring (such as protected areas). However, there are instances in whichsuch intervention may be required. Boone et al. (2007) propose that sites where amphibiandeclines are taking place should be evaluated for environmental contamination that maybe present, either as a result of direct application or movement through air or water, basedon which emergency clean-up action may be necessary. Here again, the recovery plan forthe California Red-legged Frog Rana aurora draytonii 22 exemplifies a management plan thatidentifies several contaminated areas (e.g., Vandenberg Air Force Base in Santa BarbaraCounty) where the species may be exposed to toxins, and proposes that contaminants shouldbe removed and other measures that decrease exposure of the frog should be undertaken atthese sites. In such cases, animals should be removed from the site while clean up occurs andeither relocated or allowed to disperse back into ponds once water quality is improved.Over-harvestingFinally, species-targeted responses may be necessary to deal with the threat of over-harvesting,either for species in use for medicinal or food purposes (e.g., Telmatobius spp. orAmbystoma spp.; and see Essay 11.8) or for the pet trade (e.g., dendrobatid frogs, Mantellaspp., salamanders, and newts of the genera Tylototriton, Paramesotriton, and Cynops). Thecollecting of animals and plants usually is not permitted within protected areas, or at leastnot within particular zones. However, the resources available to ensure collecting only inassigned areas and management are often inadequate, and illegal collecting often takesplace even within nature reserves (as in the case of the Chinese Giant Salamander; seeWang et al. 2004; Essay 4.7).In-situ sustainable harvesting has real potential as a management option providing thatthe biological requirements of the species concerned are understood and proper managementis in place (see Essay 11.9). Determining sustainable harvest quotas is complex and demandsinformation on the abundance, behaviour, and life-history characteristics of the species inquestion, as well as an understanding of a host of socio-economic factors. In a recent surveyof levels of exploitation of species in the genus Mantella in Madagascar, Rabemananjaraet al. (in press) note that because of the apparent high density of many populations, andtheir restricted and patchy distributions, these frogs may be well suited for a controlledsystem of sustainable harvesting. Most Mantella species are characterized by a rather highreproductive output, with up to 150 eggs per clutch, and the capacity to produce severalclutches per season. Despite the high to very high numbers of several Mantella species thathave been continuously exported from Madagascar over the past 15 years, most speciesappear not to have been directly impacted as a result of over-harvesting. Rabemananjaraet al. (in press) visited populations of Mantella aurantiaca and M. milotympanum that localcollectors claimed to have heavily exploited during past years (e.g., Vieites et al. 2005), andfound Mantella to be very common at these sites. Rabemananjara et al. (in press) proposetransferring the focus of the trade regulation more to the sites of collection that are usuallyin non-protected areas threatened by habitat destruction.Even where the capture of wild specimens does not yet constitute a threat to a species, thedevelopment of in-situ harvesting practices could provide an incentive motivating local landowners and entire communities to protect native habitat instead of clearing it, with resultantconservation benefits. A local, sustainable, production programme for species of relativelyhigh worth (e.g. Mantella frogs or dendrobatid frogs) could also have the additional benefitof playing a significant role in poverty reduction strategies in some of the poorest parts ofthe world. For example, the Global Environment Facility contributed financial support to aproject in Peru aiming to promote sustainable cultivation of poison dart frogs of the generaEpipedobates and Dendrobates 23 for export. These frogs fetch US$40-120 in hobbyist marketsin the United States, Europe and Japan. The Peru project established a business that exportsthe frogs to hobbyists in these countries. This business – with expected annual revenues ofabout US$300,000 in Year 3 – in turn provides supplemental livelihoods to more than 250farmers, an incentive for preserving over 15,000ha of tropical forest, and the sustainablebreeding methods conserve the populations of more than 60 species of frogs. 24THE NEED FOR POLICY-LEVEL INTERVENTIONPolicy-based actions are essential for providing the institutional support, human and financialresources, and legal framework to ensure effective biodiversity conservation. Frequently,such actions occur by developing and implementing legislation at the national or sub-nationallevels, or through international agreements (e.g., Table 1).Legislation is typically regarded as being directed at the protection of particular species,such as by regulating the harvesting of individuals (e.g., Convention for the Regulation ofWhaling 25 ), their trade (e.g., Convention on International Trade in Endangered Species ofWild Fauna and Flora; CITES 26 ), or alterations in their habitat (e.g., the Ramsar Convention27 ). In the United States, for example, species listed under the United States EndangeredSpecies Act (1973) 28 are protected from exploitation and disturbance, and their habitatsare subject to legal protection. As of October 2006, more than 30 amphibian species werelisted on the ESA (Table 2) – with a few additional species proposed as candidates for listing(such as Mountain Yellow-legged Frog Rana muscosa, CR) – including several speciesnot native to the US 29 .Legislation can also promote habitat protection, with perhaps the most well known being theConvention Concerning the Protection of the World Cultural and Natural Heritage, better knownas the World Heritage Convention (1972) 30 . Legislation also has the potential to protect habitat
Chapter 11. <strong>Amphibian</strong> Conservation – Responding to the Global Decline of <strong>Amphibian</strong>s 119by regulating land use patterns at a broader scale (e.g., Brazil’s Forestry Law). Finally, legislationcan also regulate anthropogenic activities that are frequently the most pervasive causes ofspecies declines (e.g., pollution generated by industry, transport leading to the introduction ofinvasive species, consumption of fossil fuels leading to climate change).There are now more than 500 international treaties that concern the environment 31 , andmost countries have ratified key international treaties, although several remain unratifiedby key governments; for example, several countries in Asia and the Middle East, wheresignificant commercial trade in species occurs, have yet to join CITES. Such internationaltreaties give conservation agencies a stronger mandate domestically (Steiner et al. 2003),which is important given that most conservation action takes place at the national level. Ofcourse, any legislation is only useful if it is adequately implemented, and such implementationis lacking in many cases.Species-targeted legislationIn terms of international legislation specifically targeting species, the most relevant for amphibiansis CITES, instituted in 1975 (and see Table 3). Effectively, CITES is an agreement betweengovernments designed to ensure that international trade in wild animals and plants does notthreaten their survival. Currently, CITES attempts to regulate the trade of some 30,000 differentspecies around the world, both plants (25,000) and animals (5,000), whether dead or alive,whole animals, parts or products (e.g., carved ivory). Membership to the Convention is voluntary,and member countries, known as Parties, act jointly by agreeing to restrict international tradein a particular species that might be threatened with extinction.In effect, CITES restricts and regulates trade in wildlife species. All forms of import andexport are regulated by means of appendices, which have varying degrees of flexibility accordingto the required protection. Appendix I includes species threatened with extinction,and trade in specimens of these species is permitted only if the purpose of the import isnon-commercial (e.g., scientific study). Appendix II includes species that are not necessarilythreatened with extinction, but in which trade must be controlled to avoid levels of use thatwould be incompatible with their survival. All trade in Appendix I and Appendix II species issupposed to be on the basis of a “non-detriment finding” indicating that the trade in questionwill not harm the conservation status of the species. Appendix III contains species that areprotected in at least one country, and which has then asked other CITES Parties for assistancein controlling the trade. At the request of any Party, a species can be included on Appendix III.The Secretariat and Parties to the Convention meet every two years to revise the Appendices,and species may be downgraded or upgraded depending on their status (for an amendment tobe made, there must be a two-thirds majority of Parties present), and to debate the benefits ofopening trade. For this reason, every Party to the Convention designates a Scientific Authorityfor advice on the benefits or detriments of trade, and as to the current status of species. Partiesare also required to submit annual reports detailing exports and imports of CITES-listedspecies (although some countries have never submitted a single report). A Party that does notagree with a species listing may enter a reservation 32 and is then considered a non-Party withrespect to the species in question, until the reservation is withdrawn.Since its inception, CITES has proved to be a successful agreement, and remains one ofthe largest of its kind in the world. International bans implemented by means of the CITESAppendices have done much to slow the trade in wildlife products across borders, and it isperhaps a measure of CITES success, that since its inception, no species listed on one of itsAppendices has been declared formally Extinct because of international trade. Nonetheless,several species known to be threatened by international trade are not currently listed on anyCITES Appendix. According to the Global <strong>Amphibian</strong> Assessment, 47 amphibian species thatare listed as threatened are adversely impacted by exploitation for the international trade;currently, only 20 of these species are listed on Appendix I or II of CITES, leaving severalspecies as priorities for inclusion on a CITES Appendix (Table 4).CITES has some drawbacks, largely because of which trade has been able to continuein many parts of the globe unchecked. First, as already noted, not all countries are Partiesto the convention (currently, there are 169 signatories). Since membership is voluntary, anycountry not Party to the convention need not report to CITES, and so trade between thesecountries goes largely undocumented. These countries are, in effect, loopholes through whichspecies can be illegally traded. Secondly, CITES, while legally binding, is an internationalbody, and as such governs only international trade. The Convention does not replace domesticlegislation, and its effectiveness is hamstrung by the degree to which countries implementand enforce their own domestic wildlife trade policies. In China, for example, the ChineseGiant Salamander Andrias davidianus, several Tylototriton spp. and Hoplobatrachus rugulosaare listed as Class II State Key Protected Animals whose collection, transport, cultivation,and sale requires permission from provincial authorities. Regardless, law enforcement isinadequate and illegal collecting is widespread (Wang et al. 2004). Further, while someParties to CITES have domestic legislation with trade controls stricter than those requiredby the Convention, the effectiveness with which CITES is implemented varies betweencountries. At the time of writing, an <strong>Amphibian</strong> Identification Guide from EnvironmentCanada containing all CITES protected species, is in the final stages of preparation. Theguide is designed specifically for customs officers, to aid in the identification of protectedspecies. It includes a colour key and a descriptive page for each species with full colourillustrations. Texts are in three languages: English, French and Spanish. Also, while CITESis intended to protect species threatened by international trade, it can sometimes hinderconservation, for example, blocking or delaying international movement of entire animals forex-situ management programmes or parts thereof (material for genetic analysis).Habitat-based legislationSeveral international treaties are concerned with site or habitat protection, including theRamsar Convention on Wetlands that has designated 1,429 Wetlands of InternationalImportance for conservation and wise use and the World Heritage Convention that hasdesignated 830 properties as part of its World Heritage List. However, the most powerfulconvention related to protected areas is the Convention on Biological Diversity (CBD) 33 , signedby 150 government leaders at the 1992 Rio Earth Summit, and dedicated to: a) conservingbiological diversity; b) sustainable use of its components; and c) fair and equitable sharingof the benefits arising from the use of genetic resources. The CBD is currently focused onthe 2010 Biodiversity Target: to achieve by 2010 a significant reduction of the current rateof biodiversity loss at the global, regional and national level as a contribution to povertyalleviation and to the benefit of all life on earth. To achieve this ambitious target, the CBDhas employed a number of strategies, including the development and implementation ofnational biodiversity strategies and action plans (NBSAPs), thematic programmes (e.g., onforests, inland waters, mountains, etc), and cross-cutting issues (e.g., on plants, taxonomy,invasive alien species, and protected areas).Protected areas are a central part of the CBD since the Parties themselves have consistentlyidentified efforts to develop and maintain their national protected area systemsSpeciesSites and habitatsActivitiesNational legislationUnited States Endangered Species Act (1973): the species listed areprotected from exploitation and disturbance, and their habitats aresubject to legal protection.Brazil’s Forestry Law (1965): establishes that each rural property inthe Amazonian basin must preserve at least 80% of its forest cover.Thailand’s Wild Animals Reservation and Protection Act (1960) andNational Park Act (1961): legal basis for the creation of conservationareas or protected areas, including national parks (144 sites), wildlifesanctuaries (53 sites), forest parks (42 sites), wildlife non–huntingareas (52 sites), biosphere reserves (1 sites), World Heritage Naturalsites (1 sites), watershed class 1 and conservation of mangroves.China’s Law on Environmental Impact Assessment (2003): requiresthat governmental and non-governmental planning on land use,urban engineering, communication, and natural resource explorationgoes through the process of an environmental impact assessment.Australian quarantine regulations: strict control measures aimed atpreventing the introduction of pests and diseases (mainly establishedto protect the agricultural sector, but also human health and thenative flora and fauna).The Federal Constitution of the United States of Mexico(Constitución Federal de Los Estados Unidos Mexicanos) Article27: states that all natural resources are property of the nation,therefore all species of flora and fauna are protected. To use, collect,kill, transport or trade any amphibians, either living specimens ortheir parts, requires a collection permit, issued by the Mexicanenvironmental authority (SEMARNAT).Scientific Name Where Listed Listing Status IUCN CategoryEleutherodactylus jasperi entire T CRRana aurora draytonii subspecies range clarified T NTRana chiricahuensis entire T VUConraua goliath entire T ENDiscoglossus nigriventer entire E EXRana capito sevosaWherever found west of Mobile E CR 1and Tombigbee Rivers in AL, MS,and LARana muscosa southern California DPS E CRAtelopus varius zeteki entire E CR 2Leiopelma hamiltoni entire E ENEleutherodactylus cooki entire T ENEurycea sosorum entire E VUAmbystoma californiense U.S.A. (CA - Santa Barbara County) E VUAmbystoma californiense U.S.A. (CA - Sonoma County) E VUAmbystoma californiense Central CA DPS T VUPlethodon nettingi entire T NTAndrias davidianusentire E CR(=davidianus d.)Batrachoseps aridus entire E 3Ambystoma cingulatum entire T VUAndrias japonicusentire E NT(=davidianus j.)Phaeognathus hubrichti entire T ENEurycea nana entire T VUAmbystoma macrodactylumentire E LCcroceumPlethodon shenandoah entire E VUAmbystoma tigrinum stebbinsi entire E LCTyphlomolge rathbuni entire E VU 4Bufo californicusentire E EN(=microscaphus)Bufo superciliaris entire E LCBufo houstonensis entire E ENBufo periglenes entire E EXPeltophryne lemur entire T CR 5Bufo baxteri (=hemiophrys) entire E EWNectophrynoides spp. entire E 6as the central element of their strategy to implement the Convention. Since the 1960s, theIUCN World Congress in National Parks and Protected Areas has fundamentally influencedthe protected areas agenda. The Congress, which meets every 10 years, provides a forumfor discussion on all ecological, social, economic, political, and practical matters related toprotected areas. The establishment of a 10% target for protected areas stemmed from theFourth World Parks Congress in Caracas, Venezuela, in 1992, where it was recommended“that protected areas cover at least 10 percent of each biome by the year 2000” (IUCN1993). Subsequently, the 10% target for protected areas became deeply entrenched inthe thinking of many conservationists and incorporated into the national legislation ofmany countries for establishing protected areas. It was, and still is, generalized to applyInternational agreementsConvention on International Trade in Endangered Speciesof Wild Fauna and Flora (CITES; 1975; global): regulatesinternational trade of the species listed on its appendices.The Bern Convention on the Conservation of European Wildlifeand Natural Habitats (1979; regional): ensures the conservationof European wildlife and natural habitats via cooperationbetween member States.EC Habitats Directive (EC Council Directive on the Conservationof Natural Habitats of Wild Fauna and Flora; 1992; regional):the natural habitat listed must be maintained at a favourablestatus, particularly by creating a network of protected sites(Natura 2000 network).Ramsar Convention on Wetlands (1975; global): provides theframework for national action and international cooperation forthe conservation and wise use of wetlands and their resources,in particular through the designation of sites under the RamsarList of Wetlands of International Importance.World Heritage Convention (1972; global): encourages theidentification, protection and preservation of cultural andnatural heritage (including habitats of threatened species)around the world considered to be of outstanding value tohumanity. Countries submit places for designation under theWorld Heritage List.United Nations Framework Convention on Climate Change(1994) and Kyoto Protocol (adopted in 1997, not yet intoforce; global): caps greenhouse gas emissions in participatingindustrialized nations from 2008 to 2012 and establishes aninternational market in emissions credits that will allow thesenations to seek out the most cost-effective means to reduceatmospheric concentrations of greenhouse gases.Table 1. Examples of national legislationand international agreements relevant toamphibian conservation, for the conservationof particular species, for the protection of sitesor habitats, and for the regulation of activitiesthat can pose threats to biodiversity. Datescorrespond to when the agreement enteredinto force. For international agreements,there is an indication of whether their scopeis global (any country can ratify it) or regional.Note: many of these laws/agreements couldbe listed under two or more categories (e.g.,the EC Habitats Directive simultaneouslyprovides for the protection of species andsites/habitats, and for the regulation ofactivities). Many national biodiversity acts,such as South Africa’s Biodiversity Act of 2004,also fall in multiple categories. Adapted, withpermission, from Baillie et al. (2004).Table 2. <strong>Amphibian</strong>s listed on the UnitedStates Endangered Species Act as of October2006. E = Endangered; T = Threatened. Endangeredspecies are those in danger of extinctionthroughout all or a significant portion of theirrange; Threatened species are those that arelikely to become Endangered in the foreseeablefuture. Note that these categories areindependent of the IUCN Categories of Threat(final column), but species appearing on the USEndangered Species list are an under-representationof species known to be threatenedwith extinction. 1 considered a distinct species;2 considered a distinct species; 3 considereda subspecies of Batrachoseps major (LC);4 included in the genus Eurycea; 5 as Bufolemur; 6 11 species recognized (8 threatened,2 DD, 1 LC).
120Threatened <strong>Amphibian</strong>s of the WorldTable 3. <strong>Amphibian</strong>s listed on CITES AppendicesI and II. No amphibians are listedon Appendix III. Many of the amphibianslisted are traded internationally as pets (e.g.,Phyllobates, Dendrobates, Epipedobates,Mantella, Dyscophus antongilii, Scaphiophrynegottlebei, Ambystoma). Euphlyctishexadactylus and Hoplobatrachus tigerinusare in the frog-leg trade. Andrias davidianusis exploited for food, but is not generally ininternational trade. Other CITES-listed species(e.g., some of the African toad generasuch as Nectophrynoides) have never beenthe subject of international trade, and so theutility of their listing is doubtful. The genusRheobatrachus is Extinct, but not because ofinternational trade.Table 4. Species threatened by internationaltrade according to the results of the Global<strong>Amphibian</strong> Assessment, indicating those speciesalready listed on a CITES Appendix, andthose for which legislation is required.Environment Canada have produced an<strong>Amphibian</strong> Identification Guide containingall CITES listed species, specifically to aidcustoms officers in the identification ofprotected species. Image courtesy of TamaraMaliepaard.Appendix I Appendix II Appendix IIIANURABufonidae ToadsAltiphrynoides spp.Atelopus zetekiBufo periglenesBufo superciliarisNectophrynoides spp.Nimbaphrynoides spp.Spinophrynoides spp.Dendrobatidae Poison frogsAllobates femoralisAllobates zaparoDendrobates spp.Epipedobates spp.Phyllobates spp.Mantellidae MantellasMantella spp.Microhylidae Red rain frog, tomato frogDyscophus antongiliiScaphiophryne gottlebeiMyobatrachidae Gastric-brooding frogsRheobatrachus spp.Ranidae FrogsEuphlyctis hexadactylusHoplobatrachus tigerinusCAUDATAAmbystomidae AxolotlsAmbystoma dumeriliiAmbystoma mexicanumCryptobranchidae Giant salamandersAndrias spp.to individual countries and to the entire planet, despite its proven shortcomings (Soulé andSanjayan 1998; Rodrigues et al. 2004a).At the Fifth Congress held in South Africa in 2003, a workshop on “Building ComprehensiveProtected Area Systems” demonstrated that despite substantial gains, global protected areasystems are still far from comprehensive, and reiterated that percentage-based targets arenot sufficient for protecting our biodiversity. Results from the Global <strong>Amphibian</strong> Assessmentwere key to building the case (see Essay 11.2). The Congress report to the CBD statedthat “the global system of protected areas needs to safeguard all globally and nationallyimportant areas for biodiversity”, and in the Durban Accord asked the global community fora “commitment to expand and strengthen worldwide systems of protected areas, prioritizedon the basis of imminent threat to biodiversity”. Several countries responded immediately,with the President of Madagascar and the Governors of the Brazilian states of Amazonasand Amapá announcing at the Congress itself that they would significantly expand theirprotected area systems.Building on these commitments, the Seventh Conference of the Parties (the governing bodyof the CBD) adopted a Programme of Work on Protected Areas (Decision VII/28 34 ) with “theobjective of the establishment and maintenance by 2010 for terrestrial and by 2012 for marineareas of comprehensive, effectively managed, and ecologically representative national andregional systems of protected areas”. This Programme of Work has four elements (implementation,governance and equity, enabling activities, and monitoring) each with several goals. Thefirst goal of the first element −“to establish and strengthen national and regional systems ofprotected areas integrated into a global network as a contribution to globally agreed goals,”bears mentioning since it requires the identification of sites of global biodiversity significancein each country to determine which sites are currently not represented in protected areasystems, and sets priorities for new actions among these sites (and therefore links directlyback to the need to identify sites requiring urgent habitat protection).In 2002, the CBD adopted the Global Strategy for Plant Conservation, which includes16 targets under five general headings: a) understanding and documenting plant diversity;b) conserving plant diversity; c) using plant diversity sustainably; d) promoting educationand awareness about plant diversity; and e) building capacity for the conservation of plantdiversity. In view of the amphibian crisis documented in this book, a multifaceted CBD globalstrategy on amphibians, building on the ACAP, should now be considered, and at the time ofgoing to press, discussions were ongoing regarding the incorporation of a global strategyon amphibians into the CBD.Legislation aimed at regulation of activitiesAmong international legislative agreements regulating activities that can pose threats tobiodiversity, arguably the most important is the United Nations Framework Convention onClimate Change 35 and the Kyoto Protocol. The UNFCCC, which entered into force in 1994, isan international treaty that sets an overall framework for intergovernmental efforts to tacklethe challenge posed by climate change. The Convention has near universal membership, withthe ratification of 189 countries 36 . Recently, a number of nations have approved an additionto the treaty: the Kyoto Protocol 37 , an international and legally binding agreement to reducegreenhouse gas emissions world wide, which came into effect on 16 February 2005. TheKyoto Protocol significantly strengthens the Convention by committing Annex I Parties toindividual, legally binding targets to limit or reduce their greenhouse gas emissions. However,only Parties to the Convention that have also become Parties to the Kyoto Protocol (i.e., byratifying, accepting, approving, or acceding to it) are bound by the Protocol’s commitments.165 countries have ratified the Protocol to date, with the most notable exceptions beingthe United States and Australia.Under the Kyoto Protocol, developed countries (termed Annex 1 countries) have committedthemselves to reducing their collective emissions of six key greenhouse gases by atleast 5.2%, with a reduced emissions target of 2008-2012 (calculated as an average overthe five years) 38 . Although these caps are national-level commitments, most countries willdevolve their emissions targets to individual industrial entities. The complicating factor is thatactual emission reductions will need to be much larger than 5%, because for some wealthyindustrialized countries reduction targets will need to be as much as 15% lower than theirexpected emissions in 2008. To provide countries with the flexibility to meet their emissiontargets, the Kyoto Protocol has established three market-based mechanisms:Order Family Name Appendix I Appendix II Not listedAnura Bufonidae Atelopus cruciger yAnura Bufonidae Atelopus zeteki yAnura Bufonidae MelanophryniscusycambaraensisAnura Dendrobatidae Dendrobates altobueyensis yAnura Dendrobatidae Dendrobates bombetes yAnura Dendrobatidae Dendrobates granuliferus yAnura Dendrobatidae Dendrobates lehmanni yAnura Dendrobatidae Dendrobates opisthomelas yAnura Dendrobatidae Dendrobates speciosus yAnura Dendrobatidae Dendrobates steyermarki yAnura Dendrobatidae Dendrobates virolensis yAnura Dendrobatidae Phyllobates terribilis yAnura Hylidae Agalychnis annae yAnura Hylidae Phyllodytes auratus yAnura Leptodactylidae Caudiverbera caudiverbera yAnura Mantellidae Mantella aurantiaca yAnura Mantellidae Mantella bernhardi yAnura Mantellidae Mantella cowanii yAnura Mantellidae Mantella crocea yAnura Mantellidae Mantella expectata yAnura Mantellidae Mantella madagascariensis yAnura Mantellidae Mantella milotympanum yAnura Mantellidae Mantella pulchra yAnura Mantellidae Mantella viridis yAnura Microhylidae Platypelis milloti yAnura Microhylidae Scaphiophryne boribory yAnura Microhylidae Scaphiophryne gottlebei yAnura Microhylidae Scaphiophryne marmorata yAnura Ranidae Conraua goliath yAnura Ranidae Limnonectes macrodon yAnura Ranidae Rana shqiperica yCaudata Hynobiidae Hynobius tokyoensis yCaudata Hynobiidae Ranodon sibiricus yCaudata Plethodontidae Plethodon petraeus yCaudata Salamandridae Cynops ensicauda yCaudata Salamandridae Echinotriton andersoni yCaudata Salamandridae Lyciasalamandra antalyana yCaudata Salamandridae Lyciasalamandra atifi yCaudata Salamandridae Lyciasalamandra billae yCaudata Salamandridae Lyciasalamandra fazilae yCaudata Salamandridae Lyciasalamandra flavimembris yCaudata Salamandridae Lyciasalamandra luschani yCaudata Salamandridae Neurergus kaiseri yCaudata Salamandridae Neurergus microspilotus yCaudata Salamandridae Paramesotriton fuzhongensis yCaudata Salamandridae Salamandra algira yCaudata Salamandridae Tylototriton kweichowensis y• Emissions Trading: the option to buy and sell emissions credits among developedcountries. If one country exceeds its emissions target for one year, while another’s fallsbelow its targets, the first is permitted to purchase the second country’s unused emissioncredits to meet its emission target.• Joint Implementation: a country can receive emissions credits for a specific projectundertaken in another country.• Clean Development Mechanism: developed countries can receive emissions credit forfinancing projects that reduce emissions in developing countriesCO 2emissions from deforestation are another type of emission that can be profitablyreduced if allowed into a market. At present, avoided deforestation (AD) carbon trading isrestricted to particular voluntary markets in the US. The much larger Kyoto Protocol-basedEuropean markets do not currently trade in avoided deforestation, largely due to politicalconcerns of the past. Developing countries took the position that developed countries shouldtake the first step toward tackling climate change. Now that a European carbon market isin place, developing countries see a financial opportunity to sell emissions reductions fromAD. Credits for AD would be related only to the amount of deforestation avoided, not thetotal amount of forest. This would be true for either a project-level or country-level scheme.Imagine a country that has one million hectares of forest, and an annual forest loss baselineof ten thousand hectares per year 39 . If this loss is reduced to 5,000ha per year, the countrywould be credited for a 5,000ha/year reduction, not their entire million hectare carbonstock. A proposal to bring AD into the Kyoto Protocol was introduced in November 2005 bythe Coalition for Rainforest Nations (CRN), a group of tropical developing countries led byPapua New Guinea and Costa Rica. This concept was originally proposed by Santilli et al.(2005) under the name “compensated reduction.” The CRN proposal has been endorsed todate by the African Union, European Union, Pacific Island Forum, British Commonwealth, Associationof Small Island States, and most recently, Indonesia. Several years of internationalnegotiations will need to take place before an agreement can be finalized.In the absence of an international treaty specifically designed to reduce greenhouse gases,the Intergovernmental Panel on Climate Change 40 estimates that global mean temperatureswill rise by between 1.4°C and 5.8°C, with resulting catastrophic consequences for weatherpatterns, biodiversity, and sea levels. However, limiting climate change requires majorchanges beyond simply signing the Kyoto Protocol; it involves the evolution of a society thatbecomes carbon neutral on a global scale in this century (Lovejoy and Hannah 2005).RESEARCH AS A CONSERVATION ACTIONConservation action is more effective when supported by knowledge, not just on speciesthemselves, but on the threats affecting species and the most effective measures needed foraddressing those threats. Furthermore, research that is integrated with the implementation ofconservation can allow for adaptive management of projects, thereby building on successesand learning from failures in a manner that best serves the species at risk. The results of
Chapter 11. <strong>Amphibian</strong> Conservation – Responding to the Global Decline of <strong>Amphibian</strong>s 121Figure 4. Richness map of Data Deficientamphibian species, with darker reds correspondingto regions of higher richness. Colourscale based on five quantile classes. Maximumrichness equals 18 species. Note: this map isonly an approximation, since for most DataDeficient species the extent of occurrence ispoorly known.the Global <strong>Amphibian</strong> Assessment provided a much-needed context for the well-publicizedphenomenon of amphibian declines, but they also provide us with directions and prioritiesfor research needs, not only on a taxon basis, but also on a thematic basis.Among the species that emerge as priorities for research are those flagged as DataDeficient. The Red List category Data Deficient is assigned to species for which there isinadequate information available to make a direct, or indirect, assessment of its risk ofextinction based on distribution or population status. As we have already seen, nearly onequarterof all amphibians are classified as Data Deficient for one of three reasons: unknownprovenance; taxonomic uncertainty; and/or inadequate data. Data Deficient species tend tobe concentrated in regions with high biodiversity, but are poorly surveyed (Figure 4). Thereare also noticeable concentrations in regions where recent taxonomic investigations arerevealing unexpected complexities in terms of species limits, such as in the Western Ghatsof India (see Essay 7.2).It is necessary to preface a discussion of research priorities and needs with a note thatclassification in the Data Deficient category does not imply lack of threat. Indeed, IUCN’s(2006) user guidelines explicitly note “it may be appropriate …to give them the same degreeof attention as threatened taxa until their status can be assessed.” The pessimistic listingof actual Data Deficient species as threatened during the Red Listing process can lead to amuddling of conservation priorities with research priorities. This stems from concerns thatspecies listed as Data Deficient are seldom beneficiaries of conservation investment, becausethey are not listed as threatened (e.g. see Garnett et al. 2003). However, Data Deficient speciesshould not be the immediate targets for conservation action per se: by definition, theyare priorities for research action, be it in the form of taxonomic investigation or field-basedsurvey work, which in turn may reveal the need to conserve these species. 41TaxonomyAlthough it is not yet possible to provide a reliable figure on which species are in need offurther taxonomic investigation (i.e., those Data Deficient species so categorized becauseof taxonomic uncertainty), there are particular taxa that repeatedly emerge as in need oftaxonomic work, including confused genera such as Arthroleptis (14 of 34 species DataDeficient), Caecilia (23 of 35), and Ichthyophis (27 of 34).The taxonomic impediment is by no means restricted to those known species categorizedas Data Deficient based on issues surrounding their actual taxonomic status. Just asspecies description rates continue to increase (Köhler et al. 2005), new studies that usecomplementary diagnostic characters, such as genetic sequences and acoustic features, arerevealing unexpected and cryptic diversity within wide-ranging taxa, with the implicationthat single, widespread ‘species’ may actually represent multiple species having smallergeographic ranges, and, consequently, greater vulnerability to extinction (Stuart et al. 2006a).In the last mentioned study, the authors found that torrent frogs that have been identified todate on the basis of morphology as Rana livida and Rana chalconota represent at least 14different species. Indeed, it is becoming increasingly apparent that morphology alone willnot suffice for the purposes of biodiversity inventory work, and that new and complementarytechniques are required to help identify species that warrant recognition and protection(see Essay 11.10 and Essay 11.11). In this regard, there is clearly a need to expedite theapplication of these techniques to known or suspected species complexes (e.g., Angulo etal. 2003; Fu et al. 2005).The implications of such taxonomic investigations for conservation planners are as yetto be fully revealed, but may be far-reaching. It is to be expected that many Data Deficientspecies will really emerge as threatened species in their own right. Likewise, unravellingthe complexities of current wide-ranging species complexes will likely result in a markedincrease in the numbers of species currently considered threatened, and probably will seemany species move from a lower category of threat to a higher category of threat. This isas a result of the influence of splitting formerly wide-ranging species on overall populationsize and geographic range size, which are key factors in the IUCN Red List criteria (Collar1996). In turn, a surge in threatened species will have implications for those initiativesincorporating threatened species listings, of which the Red List is the most commonlyused, into priority setting exercises. For example, studies that have investigated how theinfluence of differing species concepts will affect the identification of important areas forconservation have shown conflicting results (e.g., Peterson and Navarro-Sigüenza 1999;Dillon and Fjeldså 2005).One possible side-effect of the windfall of species descriptions is that in the race todescribe new species in the face of a biodiversity crisis, the publication of new descriptionsof rare species might inadvertently facilitate their extinctions if the species in question turnout to have commercial value (Courchamp et al. 2006). Most modern species descriptionsprovide very detailed information on the locality and habitat where the new species occurs,turning “…a scientific article into a treasure map for commercial collectors” (Stuart et al.2006b). The latter authors cite the example of the salamander Paramesotriton laoensisfrom northern Laos, which was not known in the international pet trade prior to its recentdescription as a new species (Stuart and Papenfuss 2002). Over the past year, Japanese andGerman collectors used the published description to find these salamanders, and they arenow being sold to hobbyists in those countries for US$170 to US$250 each. In the face ofrecognition that withholding such locality information hampers conservation and science asmuch as it does those seeking to profit from it, Stuart et al. (2006b) propose that taxonomistsshould work closely with relevant governmental agencies to coordinate publication of thedescription with legislation or management plans that thwart overexploitation of the newspecies and that while this might lengthen publication time, alternative solutions that allowtaxonomists to continue their work without contributing to species decline are wanting.Surveys and MonitoringClear descriptions of species by taxonomists go hand in hand with survey work. Severallarge regions, such as Indonesian Papua, Indonesian Borneo, central Africa and the AlbertineRift, and parts of the Andean countries, remain very poorly surveyed, and further surveysvery likely will reveal impressive levels of diversity. To cite just one recent study, Stuartet al. (2006c) undertook the first ever collection of amphibians in hilly eastern Cambodiasince Henri Mouhout’s work in 1859. Their collection comprised 30 species of amphibians,including two new species Leptobrachium mouhoti and Ophryophryne synoria, not to mention11 new country records for Cambodia!While such herpetological collections have great value in terms of improving knowledgeon a country’s national biodiversity assets, and in turn have immediate implications fornational conservation strategies, there is also a need for targeted species surveys. Amongthose species urgently in need of survey work – indeed, representing the top prioritiesfor field-based survey work – are species considered Critically Endangered, and flaggedas Possibly Extinct (PE). This marker was designed specifically to avoid the Romeo Error(Collar 1998) – scenarios in which we might give up on a species as being extinct beforeit truly disappears (Butchart et al. 2006a). The term was first applied to the case of a bird,the Cebu Flowerpecker Dicaeum quadricolor from the Philippines, which was rediscoveredin 1992 after 86 years without a record (Dutson et al. 1993), having been written off asextinct at least 40 years earlier on the presumption that no forest remained on the island ofCebu (Magsalay et al. 1995). Such remarkable rediscoveries are by no means unique, withseveral species having been rediscovered, sometimes as long as a century after their dateof last record. Among amphibians, recent rediscoveries include a surviving population ofAtelopus cruciger in Venezuela, and the rediscovery of Atelopus nahumae and A. laetissimus,both believed to have gone extinct in the Colombian Andes. On the other hand, survey workconducted in Lebanon to search for Hula Painted Frog Discoglossus nigriventer, a speciesknown only from the eastern shore of Lake Huleh in Israel and last recorded in 1955, failedto record the species following tantalizing reports that it might survive in the Aammiqmarsh in south-east Lebanon (although the surveys did result in a new country record forPelobates syriacus) (Tron 2005).Among those amphibians flagged here as CR(PE) (Appendix IX), one recent interestingrediscovery published at the time of writing is that of Conraua derooi, which has not onlybeen rediscovered in the Togo Hills (Leaché et al. 2006), but has since been found outsideits former range in the Atewa mountains (M.-O. Rödel, pers. comm.). Habitat loss and degradationis the major threat to this species (including increased sedimentation in breedingstreams), with the result that the most immediate conservation action required is effectivemaintenance of natural habitat within the species’ limited range.Besides survey work, population monitoring is a required conservation action formost threatened species, especially for those where chytridiomycosis is believed to be apotential threat but has not yet resulted in population declines. Another set of species forwhich monitoring is important are those categorized as Vulnerable under the D2 criterion(Appendix X). These species usually have stable populations, but typically have very smalldistributions. As such, they are especially prone to the effects of human activities orstochastic events that could result in the species becoming Critically Endangered or evenExtinct in a very short time period.ThreatsAs we have already seen, while many declines are due to habitat loss and over-harvesting,other factors are also operating, some of which are rapidly driving species to extinction.
122Threatened <strong>Amphibian</strong>s of the WorldSome salamander species, such as Neurerguskaiseri (Critically Endangered) from the southernZagros Mountains of Iran, are increasinglythreatened by the growing international pettrade, but have yet to be officially proposedfor listing on a CITES appendix. © TwanLeendersMany of the reasons for amphibian declines have been acknowledged for decades (seeCollins and Storfer 2003); others are only now beginning to be better understood (Beebeeand Griffiths 2005). Stuart et al. (2004) coined the term “enigmatic decline species” for thosespecies that have shown dramatic declines (see Chapter 4), even where suitable habitatremains, for reasons that are not fully explained. We now know that one of the primaryreasons for these enigmatic declines is likely the emerging infectious disease chytridiomycosis(spread by its causal agent, the pathogenic fungus Batrachochytrium dendrobatidis)(Lips et al. 2006), perhaps acting in deadly synergy with other factors, particularly climatechange (Pounds et al. 2006).The most important research needs in terms of threats, include better understandingof the impacts of climate change, the role of environmental contaminants in declines,the spread and treatment of disease (specifically chytridiomycosis, but other emerginginfectious diseases, too), and, perhaps most important of all, the context-dependency ofthese and other factors (Blaustein and Kiesecker 2002), particularly when compoundedwith land use change.In the past decade, a great deal has been learned about the ecology, biology and impactof the chytrid pathogen (see Essay 4.5). This knowledge has included the developmentof advanced molecular diagnostic tests (Annis et al. 2004; Boyle et al. 2004); analysisof biochemical defences of amphibians against the pathogen (Rollins-Smith et al. 2002;and see Essay 2.2); and the use of ecological niche modelling to predict the spread ofthe disease (Ron 2005; and see Essay 11.4) and phylogenetic-based predictive models(Lips et al. 2006). Nonetheless, there remain several unanswered questions concerningthis disease, and these offer important and urgent opportunities for targeted research(Daszak et al. 2007):• Studies on the ecology of B. dendrobatidis, including basic and critical aspects of itsnatural history, such as how and where it survives, and how long it can persist in theenvironment. Initial studies suggest it can survive for up to 8 weeks as a saprobe, anorganism that derives its nutrition from the dead remains of other organisms, in sterilepond water (Johnson and Speare 2003).• Understanding how amphibians respond to infection. Do any amphibians become immunewhen first infected? We know, for example, that a number of species become susceptibleagain even after they have cleared an initial infection. Do amphibians respond to infectionby changing behaviour, e.g., basking, to eliminate infections?• How does the chytrid fungus spread? And is there any relationship between its spreadand trade in amphibians? Despite the availability of advanced modelling techniques topredict the spread of disease, one of the highest priorities is to determine the meansby which B. dendrobatidis moves among sites, species, and individuals over varyingscales.• Why does B. dendrobatidis cause declines in some amphibian populations, while othersare unaffected (e.g., Retallick et al. 2004; Lips et al. 2006). Studies are needed of howimmune responses, antimicrobial peptide responses (Woodhams et al. 2006; Harris et al.2006), or the genetics of species (or populations) that appear to be tolerant of the disease(e.g., American Bullfrogs), or completely resistant to infection, differ from susceptiblespecies.• How does chytridiomycosis cause death? Does it affect the ability of frogs to respireor osmoregulate through their skin, or does the pathogen release toxins that ultimatelycause death?• What caused the emergence of B. dendrobatidis? This includes surveying museum collections(e.g., Puschendorf et al. 2006) and conducting molecular phylogenetic studiesto determine when and where chytrid first emerged, or whether it has always beenwidespread and local environmental conditions cause emergence and spread (Rachowiczet al. 2005).• Can lineages resistant to chytridiomycosis be selected for in captivity and reintroducedto native habitats?Research needs on the effects of environmental contaminants on amphibians arepresented by Boone et al. (2007), who emphasize again that there is a primary need toexamine the interactive effects of either multiple contaminants or contaminants with otherthreats (such as disease, pathogens, climate change, and habitat alteration), to help planmitigation measures to thwart declines. Other important directions for research into thethreats posed by contaminants include:• Improved understanding of the impact of contaminants on both aquatic and terrestriallife stages (currently, there are limited data focusing on the terrestrial life-stage orinteractions between aquatic and terrestrial stages);• Studies to investigate how contaminants affect populations over long time periods (e.g.,Semlitsch et al. 1996), and how adaptation to a chemical stressor may influence populationpersistence or make individuals vulnerable to other factors (e.g. Semlitsch et al. 2000).• Investigating the effects of other common pollutants on amphibians (recent studies havefocused heavily on carbaryl, atrazine, and coal combustion wastes), particularly herbicidesand insecticides. For example, the herbicide atrazine disrupts the endocrine system (e.g.,Hayes et al. 2002), and herbicides can reduce the food base of the community (Diana etal. 2000; Boone and James 2003). Other groups of contamination resulting from industryby-products, mining activities and oil and gas prospecting leakages, as well as humanand other animal waste products (pharmaceuticals, sewage by-products), also posepotential threats that require study (Brooks et al. 2003).• The types of contaminants and combinations of contaminants that amphibians areexposed to in nature.Finally, research related to climate change is needed. Recent climate change is causingsome species to breed earlier (e.g., Beebee 1995; Gibbs and Breisch 2001; Corn 2003), andrecent warming episodes may play some causal role in declines in some areas (Pounds etal. 1999, 2006). However, there remains a need for further research to understand howclimate change affects amphibians, and given the loss of amphibians from pristine habitat,the possible synergies between disease dynamics and climate change.AMPHIBIAN CONSERVATION – CODA<strong>Amphibian</strong> declines were open to debate only 15 years ago, but increasing evidence revealsthat many amphibians are undergoing cataclysmic declines, some to extinction, and that asuite of causes is responsible. How we respond, and in what way, will depend on whetherthe conservation community at large can focus attention on known priorities and use thetools and knowledge available to act.Some have argued that hope is already lost, the resources do not exist, and that the bestconservation scientists can do is act as scribes documenting the declines of a once diversefauna. We contend that to do so, in the face of explicit existing conservation options, wouldbe not unlike the fire trucks standing by while the Sistine Chapel burns. History has shownthat targeted conservation efforts can help the recovery of even the most threatened species,including species that have declined to low numbers, such as the Rodrigues Fody Foudiaflavicans (Impey et al. 2002), Black Robin Petroica traverse (Aikman et al. 2001), Mallorcanmid-wife toad Alytes muletensis (Essay 11.6), Antiguan Racer Alsophis antiguae (Daltry etal. 2001), and Black-footed Ferret Mustela nigripes (Dobson and Lyles 2000).In a recent study investigating how many bird extinctions conservationists have prevented,Butchart et al. (2006b) used data on population sizes, population trends, threatening pro-
Chapter 11. <strong>Amphibian</strong> Conservation – Responding to the Global Decline of <strong>Amphibian</strong>s 123cesses, and conservation actions, to identify at least 26 bird species surviving in the wildthat would have very probably gone extinct without conservation programmes. Of course,many still require sustained conservation efforts, and a major increase in global conservationresources is necessary to extend such efforts to thousands of threatened species.Nonetheless, such case studies prove that action directed at priority species can be a pathto future recovery (Rodrigues 2006).We have demonstrated that we have the information at hand to at the very least identifywhich species require what type of conservation action, and which species require that actionfirst. This, in the end, is what defines our ability to mitigate biodiversity loss – our abilityto set priorities for where we should invest resources. The resources are limited, but theconstraints can act as a lens that concentrates options and resources on the most urgent.We cannot expect to ensure habitat protection for the 90% of species for which habitatloss is a threat, but there are is a finite set of species for which our failure to secure thelast remaining tracts of habitat now means, almost certainly, the loss of a country’s, eventhe Earth’s, unique biodiversity assets.So, as we set out to put a face on the amphibian crisis in the pages that follow, weend with a challenge. A proposed action plan has been developed with many ambitiouscomponents, including some not discussed above, such as establishing national networksin priority countries to monitor trade in amphibians. These actions should form part of aunified and coordinated conservation response that must address the top priorities. Tocoordinate and facilitate such targeted conservation programmes for amphibians, Mendelsonet al. (2006) called for the formation of an <strong>Amphibian</strong> Survival Alliance (ASA) – under theumbrella of the <strong>Amphibian</strong> <strong>Specialist</strong> <strong>Group</strong> (ASG) of the Species Survival Commission ofIUCN (see Essay 11.12). The ASA is envisioned as a partnership-based alliance, consistingof a large and diverse set of stakeholders, and representing a global vehicle for mobilizingand coordinating stakeholders to examine, deliberate, and act on advancing the <strong>Amphibian</strong>Conservation Action Plan.Our research designed to understand the causes and consequences of amphibian declineswill require inspired thinking, and must lead to explicit practical recommendations for actions.Our actions, in turn, will need to be methodical and exacting. Our failures will needto motivate us, while our successes will need to be promoted. The hope is that, in the end,we can succeed in even the most difficult of cases.REFERENCESAikman, H., Davis, A., Miskelly, C., O’Connor, S. and Taylor, G. 2001. Chatham Islands Threatened Birds:Recovery and Management Plans. Department of Conservation, Wellington, New Zealand.Angulo, A., Cocroft, R.B. and Reichle, S. 2003. Species identity in the genus Adenomera (Anura: Leptodactylidae)in southeastern Peru. Herpetologica 59:490-504Annis, S.L., Dastoor, F., Ziel, H., Daszak, P. and Longcore, J.E. 2004. A DNA-based assay to identify Batrachochytriumdendrobatidis in amphibians. Journal of Wildlife Diseases 40:420-428.Baillie, J.E.M., Bennun, L.A., Brooks, T.M., Butchart, S.H.M., Chanson, J.S., Cokeliss, Z., Hilton-Taylor,C., Hoffmann, M., Mace, G.M., Mainka, S.A., Pollock, C.M., Rodrigues, A.S.L., Stattersfield, A.J. andStuart, S.N. 2004. 2004 IUCN Red List of Threatened Species. A Global Species Assessment. Gland,Switzerland and Cambridge, UK.Barinaga, M. 1990. Where Have All the Froggies Gone? Science 247:1033-1034.Beebee, T.J.C. 1995. <strong>Amphibian</strong> breeding and climate. Nature 374:219-20.Beebee, T.J.C. and Griffiths, R.A. 2005. The amphibian decline crisis: A watershed for conservation biology?Biological Conservation 125:271-285.BirdLife International. 2004. State of the World’s Birds 2004: indicators for our changing world. BirdLifeInternational, Cambridge, UK.Blaustein, A.R. and Kiesecker, J.M. 2002. Complexity in conservation: lessons from the global decline ofamphibian populations. Ecology Letters 5:597-608.Blaustein, A.R. and Wake, D.W. 1990. Declining amphibian populations: a global phenomenon? Trends inEcology and Evolution 5:203-204.Bloxam, Q.M.C. and Tonge, S.J. 1995. <strong>Amphibian</strong>s: suitable candidates for breeding-release programmes.Biodiversity and Conservation 4:636-644.Boone, M.D. and James, S.M. 2003. Interactions of an insecticide, herbicide, and natural stressors inamphibian community mesocosms. Ecological Applications 13:829-841.Boone, M.D., Cowman, C., Davidson, C., Hayes, T., Hopkins, W., Relyea, R., Schiesari, L. and Semlitsch,R. 2007. Evaluating the role of environmental contamination in amphibian population declines. In: C.Gascon, J.P. Collins, R.D. Moore, D.R. Church, J. McKay, and J.R. Mendelson III (eds), <strong>Amphibian</strong> ConservationAction Plan, pp. 32-35. IUCN/SSC <strong>Amphibian</strong> <strong>Specialist</strong> <strong>Group</strong>. IUCN, Gland, Switzerland.Boyd, C., Brooks, T.M., Butchart, S.H.M., Edgar, G.J., da Fonseca, G.A.B., Hawkins, A.F.A., Hoffmann, M.,Sechrest, W., Stuart, S.N. and van Dijk, P.P. 2008. Scale and the conservation of threatened species.Conservation Letters 1:37-43.Boyle, D.G., Boyle, D.B., Olsen, V., Morgan, J.A.T. and Hyatt, A.D. 2004. Rapid quantitative detection ofchytridiomycosis (Batrachochytrium dendrobatidis) in amphibian samples using real-time Taqman PCRassay. Diseases of Aquatic Organisms 60:141-148Brooks, B.W., Turner, P.K., Stanley, J.K., Weston, J., Glidewell, E., Foran, C.M., Slattery, M., La Point,T.W. and Huggett, D.B. 2003. Waterborne and sediment toxicity of fluoxetine to selected organisms.Chemosphere 52:135-142.Brooks, T.M., Bakarr, M.I., Boucher, T., Da Fonseca, G.A.B., Hilton-Taylor, C., Hoekstra, J.M., Moritz, T.,Olivier, S., Parrish, J., Pressey, R.L., Rodrigues, A.S.L., Sechrest, W., Stattersfield, A., Strahm, W. andStuart, S.N. 2004. Coverage provided by the global protected-area system: Is it enough? BioScience54:1081-1091.Brooks, T.M., Mittermeier, R.A., da Fonseca, G.A.B., Gerlach, J., Hoffmann, M., Lamoreux, J.F., Mittermeier,C.G., Pilgrim, J.D. & Rodrigues, A.S.L. 2006. Global biodiversity conservation priorities.Science 313:58-61.Bruner, A.G., Gullison, R.E., Rice, R.E. and da Fonseca, G.A.B. 2001. Effectiveness of parks in protectingtropical biodiversity. Science (Washington) 291:125-128.Butchart, S.H.M., Stattersfield, A. and Brooks, T.M. 2006a. Going or gone: defining ‘Possibly Extinct’ speciesto give a truer picture of recent extinctions. Bulletin of the British Ornithologists’ Club 126:7-24.Butchart, S., Stattersfield, A. and Collar, N. 2006b. How many bird extinctions have we prevented? Oryx40:266-278.Carpenter, A.I., Dublin, H., Lau, M., Syed, G., McKay, J.E. and Moore, R.D. 2007. Over-harvesting. In: C.Gascon, J.P. Collins, R.D. Moore, D.R. Church, J. McKay, and J.R. Mendelson III (eds.), <strong>Amphibian</strong> ConservationAction Plan, pp. 26-31. IUCN/SSC <strong>Amphibian</strong> <strong>Specialist</strong> <strong>Group</strong>. IUCN, Gland, SwitzerlandCastillo, L.E., de la Cruz, E. and Ruepert, C. 1997. Ecotoxicology and pesticides in tropical aquatic ecosystemsof Central America. Environmental Toxicology and Chemistry 16:41-51.Collar, N.J. 1996. Species concepts and conservation: a response to Hazevoet. Bird Conservation International6:197-200.Collar, N.J. 1998. Extinction by assumption; or, the Romeo Error on Cebu. Oryx 32:239-244.Collins, J.P. and Storfer, A. 2003. Global amphibian declines: Sorting the hypotheses. Diversity & Distributions9:89-98.Corn, P.S. 2003. <strong>Amphibian</strong> breeding and climate change: the importance of snow in the mountains.Conservation Biology 17:622-625.Courchamp, F., Angulo, E., Rivalan, P., Hall, R.J., Signoret, L., Bull, L. and Meinard, Y. 2006. Rarity value andspecies extinction: the anthropogenic Allee effect. PLOS Biology 4(12):e415.Cowling, R.M., Pressey, R.L., Rouget, M. and Lombard, A.T. 2003. A conservation plan for a global biodiversityhotspot – the Cape Floristic Region, South Africa. Biological Conservation 112:191-216.Daltry, J.C., Bloxam, Q., Cooper, G., Day, M.L., Hartley, J., Henry, M., Lindsay, K. and Smith, B.E. 2001. Fiveyears of conserving the ‘world’s rarest snake’, the Antiguan racer Alsophis antiguae. Oryx 35:119-127.Daszak, P., Lips, K., Alford, R., Carey, C., Collins, J.P., Cunningham, A., Harris, R. and Ron, S. 2007. Infectiousdiseases. In: C. Gascon, J.P. Collins, R.D. Moore, D.R. Church, J. McKay, and J.R. Mendelson III(eds), <strong>Amphibian</strong> Conservation Action Plan, pp. 21-25. IUCN/SSC <strong>Amphibian</strong> <strong>Specialist</strong> <strong>Group</strong>. IUCN,Gland, Switzerland.Diana, S.G., Resetarits, W.J., Schaeffer, D.J., Beckmen, K.B. and Beasley, V.R. 2000. Effects of atrazineon amphibian growth and survival in artificial aquatic communities. Environmental Toxicology andChemistry 19:2961-2967.Dillon, S. and Fjeldså, J. 2005. The implications of different species concepts for describing biodiversitypatterns and assessing conservation needs for African birds. Ecography 28:682-692.Dobson, A. and Lyles, A. 2000. Black-Footed Ferret Recovery. Science 288:985-988.Dodd, C.K., Jr. 2005. Population manipulations. In: M.J. Lannoo (ed.), <strong>Amphibian</strong> declines: the ConservationStatus of United States Species, pp. 265-270. University of California Press, Berkeley and LosAngeles, USA.Dodd, C.K., Jr. and Seigel, R.A. 1991. Relocation, repatriation, and translocation of amphibians and reptiles:are they conservation strategies that work? Herpetologica 47:336-350.Doubledee, R.A., Muller, E.B. and Nisbet, R.M. 2003. Bullfrogs, disturbance regimes, and the persistenceof California red-legged frogs. Journal of Wildlife Management 67:424-438.Dreitz, V.J. 2006. Issues in Species Recovery: An Example Based on the Wyoming Toad. BioScience56:765-771.Dutson, G.C.L., Magsalay, P.M. and Timmins, R.J. 1993. The rediscovery of the Cebu Flowerpecker Dicaeumquadricolor, with notes on other forest birds on Cebu, Philippines. Bird Conserv. Intern. 3:235-243.Eken, G., Bennun, L., Brooks, T.M., Darwall, W., Fishpool, L.D.C., Foster, M., Knox, D., Langhammer, P.,Matiku, P., Radford, E., Salaman, P., Sechrest, W., Smith, M. L., Spector, S. & Tordoff, A. 2004. KeyBiodiversity Areas as Site Conservation Targets. BioScience 54:110-118.Fishpool, L.D.C. and Evans, M.I. 2001. Important Bird Areas in Africa and associated islands: Priority sitesfor conservation. Pisces Publications and BirdLife International, Newbury and Cambridge, UK.Fontenot, L.W., Noblet, G.P. and Platt, S.G. 1994. Rotenone hazards to amphibians and reptiles. HerpetologicalReview 25:150-156.Fu, J., Weadick, C.J., Zeng, X., Wang, Y., Liu, Z., Zheng, Y., Li, C. and Hu, Y. 2005. Phylogeographic analysis ofthe Bufo gargarizans species complex: A revisit. Molecular Phylogenetics and Evolution 37:202-213.Garnett, S., Crowley, G. and Balmford, A. 2003. The costs and effectiveness of funding the conservation ofAustralian threatened birds. Bioscience 53:658-665.Gascon, C., Collins, J.P., Moore, R.D., Church, D.R., McKay, J. and Mendelson, J.R. III (eds.). 2007.<strong>Amphibian</strong> Conservation Action Plan. IUCN/SSC <strong>Amphibian</strong> <strong>Specialist</strong> <strong>Group</strong>. IUCN, Gland,Switzerland. 64 pp.Gibbs, J.P. and Breisch, A.R., 2001. Climate warming and calling phenology of frogs near Ithaca, New York,1900-1999. Conservation Biology 15:1175-1178.Griffith, B., Scott, J.M., Carpenter, J.W. and Reed, C. 1989. Translocation as a species conservation tool:status and strategy. Science 245:477-480.Griffiths, R.A., and S.L Kuzmin. 2006. Captive breeding of amphibians for conservation. In H.H. Heatwoleand J.W. Wilkinson (eds.), Conservation and Decline of <strong>Amphibian</strong>s, <strong>Amphibian</strong> Biology, Volume 9A,Surrey Beatty & Sons, Chipping Norton, New South Wales, Australia.Guicking, D., Griffiths, R.A., Moore, R.D., Joger, U. and Wink, M. 2006. Introduced alien or persecutednative? Resolving the origin of the Viperine snake (Natrix maura) on Mallorca. Biodiversity and Conservation15:3045-3054.Harris, R.N., James, T.Y., Lauer, A., Simon, M.A. and Patel, A. 2006. <strong>Amphibian</strong> pathogen Batrachochytriumdendrobatidis is inhibited by the cutaneous bacteria of amphibian species. EcoHealth 3:53-56.Haydon, D.T., Randall, D.A., Matthews, L., Knobel, D.L., Tallents, L.A., Gravenor, M.B., Williams, S.D.,Pollinger, J.P., Cleaveland, S., Woolhouse, M.E.J., Sillero-Zubiri, C., Marino, J., Macdonald, D.W.and Laurenson, M.K. 2006. Low-coverage vaccination strategies for the conservation of endangeredspecies. Nature 443:692-695.Hayes, T., Haston, K., Tsui, M., Hoang, A., Haeffele, C. and Vonk, A. 2002. Feminization of male frogs inthe wild. Nature 419:895-896.Heatwole, H. and Wilkinson, W. (eds.). in press. <strong>Amphibian</strong> Biology, vol. 8. Conservation of <strong>Amphibian</strong>s.Surrey Beatty & Sons Pty. Ltd., Chipping Norton, Australia.Heyer, W.R. and Murphy, J.B. 2005. Declining amphibian populations task force. In: M.J. Lannoo (ed.),<strong>Amphibian</strong> Declines: The conservation status of United States species, pp. 17-21. University ofCalifornia Press, Berkeley, California.Impey, A.J., Côte´, I.M. and Jones, C.G. 2002. Population recovery of the threatened endemic Rodrigues fodyFoudia flavicans (Aves, Ploceidae) following reforestation. Biological Conservation 107:299-305.IUCN 1993. Parks for Life: Report of the IV th World Congress on National Parks and Protected Areas.IUCN, Gland, Switzerland.IUCN 2006. Guidelines for the Using the IUCN Red List Categories and Criteria. Version 6.1 (July 2006).Prepared by the Standards and Petitions Working <strong>Group</strong> for the IUCN SSC Biodiversity AssessmentsSub-Committee in July 2006. Downloadable from http://app.iucn.org/webfiles/doc/SSC/RedList/RedListGuidelines.pdf.Johnson, M. and R. Speare. 2003. Survival of Batrachochytrium dendrobatidis in water:quarantine andcontrol implications. Emerging Infectious Diseases 9:922-925.Kats, L.B. and Ferrer, R.P. 2003. Alien predators and amphibian declines: Review of two decades of scienceand the transition to conservation. Diversity & Distributions 9:99-110.Kirkpatrick, J.B. 1983. An iterative method for establishing priorities for the selection of nature reserves- an example from Tasmania. Biol. Conserv. 25:127-134.Knapp, R.A. and Matthews, K.R. 1998. Eradication of nonnative fish by gill-netting from a small mountainlake in California. Restoration Ecology 6:207-213.Knapp, R.A. and Matthews, K.R. 2000. Non-native fish introductions and the decline of the mountain yellow-leggedfrog from within protected areas. Conservation Biology 14:428-438.Knapp, R.A., Boiano, D.M. and Vredenburg, V.T. 2007. Removal of nonnative fish results in populationexpansion of a declining amphibian (mountain yellow-legged frog, Rana muscosa). Biological Conservation135:11-20.Kohler, J., Vieites, D.R., Bonett, R.M., Garcia, F.H., Glaw, F., Steinke, D. and Vences, M. 2005. New <strong>Amphibian</strong>sand Global Conservation: A Boost in Species Discoveries in a Highly Endangered Vertebrate<strong>Group</strong>. Bioscience 55:693-696.Krajick, K. 2006. The Lost World of the Kihansi Spray Toad. Science 311:1230-1232.Langhammer, P.F., Bakarr, M.I., Bennun, L.A., Brooks, T.M., Clay, R.P., Darwall, W., De Silva, N., Edgar,G., Eken, G., Fishpool, L., Fonseca, G.A.B. da, Foster, M.N., Knox, D.H., Matiku, P., Radford, E.A.,Rodrigues, A.S.L., Salaman, P., Sechrest, W., and Tordoff, A. 2007. Identification and Gap Analysis ofKey Biodiversity Areas: Targets for Comprehensive Protected Area Systems. IUCN, Gland, Swizterlandand Cambridge, UK.Endnotes1 www.zeroextinction.org2 The cornerstones of AZE site identification, as withthat for KBAs, are the IUCN Red List categoriesassigned to taxa that trigger the identification of asite in the first place. Thus, it is crucial that the RedListing process is rigorous, transparent, objectiveand repeatable, and appropriately supported bythe relevant supporting documentation, given theutility and value of these in conservation planning(see also Rodrigues et al. 2006).3 Protection status is not known for 16 sites.4 In this instance, three conservation NGOs- Fundación ProAves Colombia, ConservationInternational, and American Bird Conservancy- joined by the IUCN/SSC <strong>Amphibian</strong> <strong>Specialist</strong><strong>Group</strong>, teamed up to protect a 1,600-acre site(the El Dorado Nature Reserve) on the north-westslope of the Sierra Nevada de Santa Martamassif, on the Caribbean coast of Colombia. Thesite provides what is believed to be a critical lastrefuge for several highly threatened amphibianspecies (including Atelopus laetissimus, A. nahumae,Colostethus ruthveni, and Cryptobatrachusboulengeri) as well as for several threatened birdspecies (Pyrrhura viridicata, Myiotheretes pernix,and Campylopterus phainopeplus).5 Morningside is a 1,000-ha area just to the east ofthe Sinharaja World heritage Site, and the onlyknown site for five highly threatened amphibians:Microhyla karunaratnei (CR), Polypedates fastigo(CR), Philautus simba (CR), Philautus procax (CR),and Philautus decoris (EN).6 Although disease is a major threat factor, thecurrent priority conservation response is researchand probably captive breeding. At this stage, it’snot clear what conservation action can be takenat either the site or landscape scale to reduce thethreat of disease.7 http://ecos.fws.gov/docs/recovery_plans/2002/020528.pdf8 http://www.deh.gov.au/biodiversity/threatened/publications/recovery/corroboree-frog/index.html9 http://www.deh.gov.au/biodiversity/threatened/publications/recovery/rainforest-frogs/index.html10 Treatment is usually via antifungal drugs (Parkeret al. 2002) or heat (Woodhams et al. 2003).11 http://www.iucn.org/themes/ssc/publications/policy/exsituen.htm12 In some cases, it is reasonable to predict thatchytrid could be the cause of such declines where aspecies shares particular biological traits or habitatpreferences that would render it susceptible toinfection.13 We identified any CR or EN species for which a)chytrid was already identified as a known threat(i.e., known to be a major threat resulting indeclines, whether in tandem with other threatssuch as habitat loss or not), or b) chytrid wasbelieved very likely to be the cause of observeddeclines given that the species shared certainbiological traits or habitat preferences (e.g.,montane, stream-breeding, congeneric) with otheraffected species such that it was very likely to beaffected by chytrid, as those species for whichthe establishment of ex-situ assurance coloniesis absolutely necessary.14 http://www.planeta.com/planeta/98/0598property.html15 Atelopus zeteki, Anotheca spinosa, Gastrothecacornuta, Hemiphractus fasciatus, Eleutherodactyluspunctariolus, Eleutherodactylus bufoniformis,Eleutherodactylus museosus, Hylomantis [Phyllomedusa]lemur, Ecnomiohyla [Hyla] fimbiimembra,and Hyloscirtus [Hyla] palmeri. Two priorityspecies Dendrobates vicentei and Hyloscirtus[Hyla] colymba are yet to be collected.16 The Species Survival Plan programme began in1981 as a cooperative population managementand conservation program for selected species inzoos and aquariums in North America. Each SSPmanages the breeding of a species in order tomaintain a healthy and self-sustaining populationthat is both genetically diverse and demographicallystable. Beyond this, SSPs participate in avariety of other cooperative conservation activities,such as research, public education, reintroductionand field projects. Currently, 107 SSPs covering 161individual species are administered by the Associationof Zoos and Aquarium, whose membershipincludes accredited zoos and aquariums throughoutNorth America. Besides the Puerto Rican Toad,the only other amphibian species for which an SSPexists is the Wyoming Toad. See http://www.aza.org/ConScience/ConScienceSSPFact/ for moreinformation.
124Threatened <strong>Amphibian</strong>s of the World17 http://www.iucn.org/themes/ssc/publications/policy/reinte.htm18 http://ecos.fws.gov/docs/recovery_plans/2002/020528.pdf19 Comprehensive reviews of options for invasivespecies control and prevention are provided inMcNeely et al. (2001), Wittenberg and Cock (2001),and Veitch and Clout (2002). IUCN has also prepareda set of guidelines to help countries, conservationagencies and concerned individuals to reduce thethreats posed by invasive alien species to globalbiodiversity (http://www.iucn.org/themes/ssc/publications/policy/invasivesEng.htm).20 Rotenone is a piscicide that has been used toremove unwanted fish stocks from a variety ofaquatic habitats, although not without negativeimpacts on other aquatic fauna and amphibians.The impacts of rotenone-containing piscicides onamphibians have been reviewed by Fontenot et al.(1994) and McCoid and Bettoli (1996).21 www.nwhc.usgs.gov/research/amph_dc/sop_mailing.html22 http://ecos.fws.gov/docs/recovery_plans/2002/020528.pdf23 These species are listed on Appendix II of CITES(see later), which means that international tradein these species is permissible if sustainably managed.CITES officials have been supportive of thisproject because it will alleviate pressure on poisondart frog populations.24 http://www.gefonline.org/projectDetails.cfm?projID=148525 http://www.iwcoffice.org/commission/convention.htm26 www.cites.org27 www.ramsar.org28 http://www.fws.gov/endangered/esa.html29 The ESA implements US participation in CITES, andthese were rolled together in the legislation whenthe ESA was implemented in 1973 (the same yearas CITES was formed). Consequently, there is a linkbetween ESA and CITES and some species threatenedby trade have also been listed. In the late 1970s, FWShad a long list of candidate species (about 200 species),including many foreign species (many of whichwere unrelated to CITES issues). A Fund for Animalslawsuit pushed for the listing of most or all of thecandidates, and the resultant mass listing resultedin the listing of many foreign species. As such, mostof the foreign listings occurred in the first decade ofthe ESA and there have been very few since. FWScurrently has little interest in listing new foreignspecies. Provisions on take do not apply in foreignjurisdictions and are unenforceable. Further, FWShas a stated policy that foreign listed species are thelowest in priority among listed species, and there areno recovery plans for listed species and no funding.30 http://whc.unesco.org/en/conventiontext/31 www.ecolex.org32 A Party may enter a Reservation only at the timethat it joins the Convention, or within 90 days of achange being made in the listing of a species onthe Appendices.33 www.biodiv.org34 http://www.biodiv.org/doc/publications/pa-texten.pdf35 http://unfccc.int/2860.php36 Iraq, Somalia and Timor-Leste are among those yetto ratify37 http://unfccc.int/kyoto_protocol/items/2830.php38 Cuts in the three most important gases – carbondioxide (CO 2 ), methane (CH 4 ), and nitrous oxide(N 2 0) – will be measured against a base year of1990. Cuts in three long-lived industrial gases– hydrofluorocarbons (HFCs), perfluorocarbons(PFCs), and sulphur hexafluoride (SF 6 ) – can bemeasured against either a 1990 or 1995 baseline.39 To know how much deforestation has been reduced, itis necessary to know how much deforestation wouldoccurred otherwise. This reference level is referred toas a baseline. While there are a number of ways thisbaseline could be selected (e.g. modeled projections,present deforestation rate), the best baseline for avariety of reasons is an average deforestation rateover a recent historical time period.40 http://www.ipcc.ch/41 Conversely, listing species that are known to begenuinely threatened with extinction as DataDeficient, either because assessors demandsubstantial evidence that a species is threatenedbefore making such a classification, or to side-stepwell intentioned but misguided government policiesthat restrict field research on threatened species,could result in species not receiving conservationattention before it is too late (see Pimenta et al.2005; Stuart et al. 2005 for discussion).Several amphibians have been rediscovered after not having been seen after extendedperiods in the wild, including Atelopus nahumae (Critically Endangered) which was rediscoveredin March 2006 on the north-west slope of the Sierra Nevada de Santa Marta massifin Colombia. © Conservacion Internacional-ColombiaLeaché, A.D., Rödel, M.-O., Linkem, C.W., Diaz, R.E., Hillers, A. and Fujita, M.K. 2006. Biodiversity ina forest island: reptiles and amphibians of the West African Togo Hills. <strong>Amphibian</strong> and ReptileConservation 4:22-45.Lee, S., Zippel, K., Ramos, L. and Searle, J. 2006. Captive-breeding programme for the Kihansi spray toadNectophrynoides asperginis at the Wildlife Conservation Society, Bronx, New York. International ZooYearbook 40:241-253.Lens, L., Van Dongen, S., Norris, K., Githiru, M. and Matthysen, E. 2002. Avian Persistence in FragmentedRainforest. Science 298:1236-1238.Lips, K.R., Brem, F., Brenes, R., Reeve, J.D., Alford, R.A., Voyles, J., Carey, C., Livo, L., Pessier, A.P. andCollins, J.P. 2006. Emerging infectious disease and the loss of biodiversity in a Neotropical amphibiancommunity. Proceedings of the National Academy of Sciences 103:3165-3170.Lovejoy, T.E. and Hannah, L. (eds). 2005. Climate Change and Biodiversity. Yale University Press, New Haven,USA.Magsalay, P., Brooks, T., Dutson, G. and Timmins, R. 1995. Extinction and conservation on Cebu. Nature 373:294.Margules, C.R. and Pressey, R.L. 2000. Systematic conservation planning. Nature 405:243-253.Mazzoni, R., Cunningham, A.A., Daszak, P., Apolo, A., Perdomo, E. and Speranza, G. 2003. EmergingPathogen of Wild <strong>Amphibian</strong>s in Frogs (Rana catesbeiana) Farmed for International Trade. EmergingInfectious Diseases 9:995-998.Mendelson, J.R., III and Rabb, G.B. 2006. Global amphibian extinctions and the role of living-collections institutions.World Association of Zoos and Aquariums. Proceedings WAZA Conferences: Proceedings ofthe 60 th Annual Meeing, New York City, USA, 2-6 October 2005: 179-181.Mendelson, J.R., III, Lips, K.R., Gagliardo, R.W., Rabb, G.B., Collins, J.P., Diffendorfer, J.E., Daszak, P., IbanezD, R., Zippel, K.C., Lawson, D.P., Wright, K.M., Stuart, S.N., Gascon, C., da Silva, H.R., Burrowes, P.A.,Joglar, R.L., La Marca, E., Lotters, S., du Preez, L.H., Weldon, C., Hyatt, A., Rodriguez-Mahecha, J.V.,Hunt, S., Robertson, H., Lock, B., Raxworthy, C.J., Frost, D.R., Lacy, R.C., Alford, R.A., Campbell, J.A.,Parra-Olea, G., Bolanos, F., Domingo, J.J.C., Halliday, T., Murphy, J.B., Wake, M.H., Coloma, L.A.,Kuzmin, S.L., Price, M.S., Howell, K.M., Lau, M., Pethiyagoda, R., Boone, M., Lannoo, M.J., Blaustein,A.R., Dobson, A., Griffiths, R.A., Crump, M.L., Wake, D.B. and Brodie, E.D., Jr. 2006. BIODIVERSITY:Confronting <strong>Amphibian</strong> Declines and Extinctions. Science 313(5783):48.McCoid, M.J. and Bettoli, P.W. 1996. Additional evidence for rotenone hazards to turtles and amphibians.Herpetological Review 27:70-71.McKay, J.E. 2003. “An evaluation of captive breeding and sustainable use of the Mexican axolotl (Ambystomamexicanum)”. MSc dissertation, University of Kent, Canterbury, UK.McNeely, J.A., Mooney, H.A., Neville, L.E., Schei, P.J. and Waage, J.K. (eds.). 2001. A Global Strategy onInvasive Alien Species. IUCN, Gland, Switzerland and Cambridge, UK.Parker, J.M., Mikaelian, I., Hahn, N. and Diggs, H.E. 2002. Clinical diagnosis and treatment of epidermalchytridiomycosis in African clawed frogs (Xenopus tropicalis). Comparative Medicine 52:265-268.Pechmann, J.H.I, Scott, D.E., Semlitsch, Z.D., Caldweil, J.P., Vitt, L.J. and Gibbons, J.W. 1991. Decliningamphibian populations: The problem of separating human impacts from natural fluctuations. Science253:892-895.Pechmann, J.H.K. and Wilbur, H.M. 1994. Putting declining amphibian populations in perspective: naturalfluctuations and human impacts. Herpetologica 50:65-84.Peterson, A.T. and Navarro-Sigüenza, A.G. 1999. Alternate species concepts as bases for determiningpriority conservation areas. Conservation Biology 13:427-431.Pimenta, B.V.S., Haddad, C.F.B., Nascimento, L.B., Cruz, C.A.G. and Pombal, J.B.J. 2005. Comment on “Statusand Trends of <strong>Amphibian</strong> Declines and Extinctions Worldwide”. Science 309:1999b.Pounds, J.A. and Crump, M.L. 1994. <strong>Amphibian</strong> declines and climate disturbance: The case of the goldentoad and the harlequin frog. Conservation Biology 8:72-85.Pounds, J.A., Bustamante, M.R., Coloma, L.A., Consuegra, J.A., Fogden, M.P.L., Foster, P.N., La Marca,E., Masters, K.L., Merino-Viteri, A., Puschendorf, R., Ron, S.R., Sa´nchez-Azofeifa, G.A., Still, C.J.and Young, B.E. 2006. Widespread amphibian extinctions from epidemic disease driven by globalwarming. Nature 439:161-167.Pounds, J.A., Carnaval, A.C., Puschendorf, R., Haddad, C.F.B. and Masters, L.K. 2006. Responding to<strong>Amphibian</strong> Loss. Science 314(5805):1541.Pounds, J.A., Fogden, M.P.L. and Campbell, J.H. 1999. Biological response to climate change on a tropicalmountain. Nature 398:611-615.Pressey, R.L., Humphries, C.J., Margules, C.R., Vane-Wright, R.I. and Williams, P.H. 1993. Beyond opportunism- key principles for systematic reserve selection. Trends in Ecology & Evolution 8:124-128.Pressey, R.L., Johnson, I.R. and Wilson, P.D. 1994. Shades of irreplaceability – towards a measure of thecontribution of sites to a reservation goal. Biodiversity and Conservation 3:242-262.Pressey, R.L. and Taffs, K.H. 2001. Scheduling conservation action in production landscapes: priority areasin western New South Wales defined by irreplaceability and vulnerability to vegetation loss. Biol.Conserv. 100:355-376.Pressey, R.L., Cowling, R.M. and Rouget, M. 2003. Formulating conservation targets for biodiversity patternand process in the Cape Floristic Region, South Africa. Biological Conservation 112:99-127.Puschendorf, R., Bolaños, F. and Chaves, G. 2006. The amphibian chytrid fungus along an altitudinal transectbefore the first reported declines in Costa Rica. Biological Conservation 132:136-142.Rabemananjara, F.C.E., Raminosoa, N.R., Ramilijaona, O.R., Andreone, F., Bora, P., Carpenter, A.I., Glaw,F., Razafindrabe, T., Vallan, D, Vieites, D.R. and Vences, M. in press. Malagasy poison frogs in thepet trade: a survey of levels of exploitation of species in the genus Mantella. <strong>Amphibian</strong> and ReptileConservation.Rachowicz, L.J., Hero, J-M., Alford, R.A., Taylor, J.W., Morgan, J.A.T., Vredenburg, V.T., Collins, J.P. andBriggs, C.J. 2005. The novel and endemic pathogen hypotheses: Competing explanations for the originof emerging diseases of wildlife. Conservation Biology 19:1441-1448.Retallick, R.W.R., McCallum, H. and Speare, R. 2004. Endemic infection of the amphibian chytrid fungusin a frog community post-decline. PLoS Biology 2:1965-1971.Ricketts, T.H., Dinerstein, E., Boucher, T., Brooks, T.M., Butchart, S.H.M., Hoffmann, M., Lamoreux, J.F.,Morrison, J., Parr, M., Pilgrim, J.D., Rodrigues, A.S.L., Sechrest, W., Wallace, G.E., Berlin, K., Bielby,J., Burgess, N.D., Church, D.R., Cox, N., Knox, D., Loucks, C., Luck, G.W., Master, L.L., Moore, R.,Naidoo, R., Ridgely, R., Schatz, G.E., Shire, G., Strand, H., Wettengel, W. and Wikramanayake, E. 2005.Pinpointing and preventing imminent extinctions. Proceedings of the National Academycs Sciences,USA 102:18497-18501.Rodrigues, A.S.L. 2006. Are global conservation efforts successful? Science 313:1051-1052.Rodrigues, A.S.L., Andelman, S.J., Bakarr, M.I., Boitani, L., Brooks, T.M., Cowling, R.M., Fishpool, L.D.C., Fonseca,G.A.B., Gaston, K.J., Hoffmann, M., Long, J.S., Marquet, P.A., Pilgrim, J.D., Pressey, R.L., Schipper,J., Sechrest, W., Stuart, S.N., Underhill, L.G., Waller, R.W., Watts, M.E.J. and Yan, X. 2004a. Effectivenessof the global protected area network in representing species diversity. Nature 428:640-643.Rodrigues, A.S.L., Akcakaya, H.R., Andelman, S.J., Bakarr, M.I., Boitani, L., Brooks, T.M., Chanson, J.S.,Fishpool, L.D.C., Da Fonseca, G.A.B., Gaston, K.J., Hoffmann, M., Marquet, P.A., Pilgrim, J.D., Pressey,R.L., Schipper, J., Sechrest, W., Stuart, S.N., Underhill, L.G., Waller, R.W., Watts, M.E.J. and Yan,X. 2004b. Global gap analysis: Priority regions for expanding the global protected-area network.Bioscience 54:1092-1100.Rodrigues, A.S.L., Pilgrim, J.D., Lamoreaux, J.L., Hoffmann, M. and Brooks, T.M. 2006. The value of theIUCN Red List for conservation. Trends in Ecology & Evolution 21:71-76.Rollins-Smith, L.A., Carey, C., Longcore, J.E., Doersam, J.K., Reinert, L.K., Boutte, A., Bruzgal, J. and Conlon,J. M.. 2002. Antimicrobial peptide defenses against Batrachochytrium dendrobatidis, the chytrid fungusassociated with global amphibian declines. FASEB Journal 16:A291-A291.Ron, S.R. 2005. Predicting the distribution of the amphibian pathogen Batrachochytrium dendrobatidis inthe New World. Biotropica 37:209-221.Rondinini, C., Stuart, S. and Boitani, L. 2005. Habitat Suitability Models and the Shortfall in ConservationPlanning for African Vertebrates. Conservation Biology 19:1488-1497.Santilli, M., Moutinho, P., Schwartzman, S., Nepstad, D., Curran, L. & Nobre, C. 2005. Tropical deforestationand Kyoto Protocol. Climatic Change 71:267-276.Seigel, R.A., and Dodd, C.K. 2002. Translocations of amphibians: proven management method or experimentaltechnique? Conservation Biology 16:552-554.Semlitsch, R.D. (ed.). 2003. <strong>Amphibian</strong> Conservation. Smithsonian Institution Press, Washington, D.C.,USA.Semlitsch, R.D., Scott, D.E., Pechmann, J.H.K. and Gibbons, J.W. 1996. Structure and dynamics of anamphibian community: evidence from a 16-year study of a natural pond. In: M.L. Cody and J.A.Smallwood (eds.), Long-term studies of vertebrate communities, pp. 217-248. Academic Press, SanDiego, California, USA.Soulé, M.E. and Sanjayan, M.A. 1998. Conservation targets: do they help? Science 279:2060-2061.Steiner, A., Kimball, L.A. and Scanlon, J. 2003. Global governance for the environment and the role ofMultilateral Environmental Agreements in conservation. Oryx 37:227-237.Stuart, B.L. and Papenfuss, T.J. 2002. A new salamander of the genus Paramesotriton (Caudata: Salamandridae)from Laos. Journal of Herpetology 36:145-148.Stuart, B.L., Rhodin, A.G.J., Grismer, L. and Hansel, T. 2006b. Scientific description can imperil species.Science 312:1137-1138.Stuart, B.L., Sok, K. and Neang, T. 2006c. A collection of amphibians and reptiles from hilly eastern Cambodia.Raffles Bulletin of Zoology 54:129-155.Stuart, B.L., Inger, R.F. and Voris, H.K. 2006a. High level of cryptic diversity revealed by sympatric lineagesof Southeast Asian frogs. Biology Letters 2:470-474.Stuart, S.N., Chanson, J.S., Cox, N.A., Young, B.E., Rodrigues, A.S.L., Fischman, D.L. and Waller, R.W. 2004.Status and trends of amphibian declines and extinctions worldwide. Science 306:1783-1786.Stuart, S.N., Chanson, J.S., Cox, N.A., Young, B.E., Rodrigues, A.S.L., Fischman, D.L., and Waller, R.W.2005. Response to Comment on ‘Status and Trends of <strong>Amphibian</strong> Declines and Extinctions Worldwide’’.Science 309(5743):1999c.Trenham, P.C. and Marsh, D.M. 2002. <strong>Amphibian</strong> translocation programs: reply to Seigel and Dodd.Conservation Biology 16:555-556.Tron, F. 2005. Second Discoglossus nigriventer rediscovery expedition in the central Bekaa Valley, Lebanon:17-28 April 2005. Expedition Report. A Rocha International.Veitch, C.R. and Clout, M.N. (eds.). 2002. Turning the tide: the eradication of invasive species. Proceedingsof the international conference on eradication of island invasives. Occasional Paper of the IUCN SpeciesSurvival Commission. No. 27. (available at: http://www.hear.org/articles/turningthetide/).Vieites, D.R., Rabemananjara, F.C.E., Bora, P., Razafimahatratra, B., Ramilijaona Ravoahangimalala, O.and Vences, M. 2005. Distribution and population density of the black-eared Malagasy poison frog,Mantella milotympanum Staniszewski, 1996 (Amphibia:Mantellidae). In: B. Huber, B.J. Sinclair andK.H. Lampe (eds.), pp. 197-204. African Biodiversity - Molecules, Organisms, Ecosystems. Springer,New York, USA.Wake, D.B. 1991. Declining amphibian populations. Science 253:860.Wang, X.-M., Zhang, K.-J., Wu, W., Wang, Z.-H., Ding, Y.-Z. and Huang, S. 2004. The decline of the Chinesegiant salamander and applications for its conservation. Oryx 38:197-202.Weldon C., du Preez, L.H., Hyatt, A.D., Muller, R. and Speare, R. 2004. Origin of the <strong>Amphibian</strong> ChytridFungus. Emerging Infectious Diseases 10:2100-2105.Wittenberg, R. and Cock, M.J.W. (eds). 2001. Invasive alien species: a toolkit of best prevention andmanagement practices. CABI Publishing, Wallingford, Oxon, UK (available at: http://www.cabi-bioscience.ch/wwwgisp/gt1goto.htm).Wiese, R.J. and Hutchins, M. 1994. The role of zoos and aquariums in amphibian and reptile conservation.In: J.B. Murphy, K. Adler, and J.T. Collins (eds.), Captive Management and Conservation of <strong>Amphibian</strong>sand Reptiles, pp. 37-45. Contributions to Herpetology, Society for the Study of <strong>Amphibian</strong>s andReptiles, vol. 11, Ithaca, USA.Wilson, A.C. and Stanley Price, M.R. 1994. Reintroduction as a reason for captive breeding. In: P.J.S Olneyet al. (eds.), Creative Conservation, pp. 243-264. Chapman & Hall, London, UK.Woodhams, D. C., R. A. Alford, and G. Marantelli. 2003. Emerging disease of amphibians cured by elevatedbody temperature. Diseases of Aquatic Organisms 55:65-67.Woodhams, D.C., Voyles, J., Lips, K.R., Carey, C. and Rollins-Smith, L.A. 2006. Predicted disease susceptibilityin a Panamanian amphibian assemblage based on skin peptide defenses. Journal of WildlifeDiseases 42:207-218.Woodroffe, R. 2001. Assessing the risks of intervention: immobilization, radio-collaring and vaccination ofAfrican wild dogs. Oryx 35:234-244.Young, B.E., Lips, K.R., Reaser, J.K., Ibanez, R., Salas, A.W., Cedeno, J.R., Coloma, L.A., Ron, S., La Marca,E., Meyer, J.R., Munoz, A., Bolanos, F., Chaves, G. and Romo, D. 2001. Population declines and prioritiesfor amphibian conservation in Latin America. Conservation Biology 15:1213-1223.Zippel, K. 2005. Zoos play a vital role in amphibian conservation. See: http://elib.cs.berkeley.edu/aw/declines/zoo/index.html26 July 2005.
Chapter 11. <strong>Amphibian</strong> Conservation – Responding to the Global Decline of <strong>Amphibian</strong>s 125ESSAY 11.1. THE DECLINING AMPHIBIAN POPULATIONS TASK FORCE: A SHORT HISTORYThe global amphibian community first became aware of the amphibian declinephenomenon at the first World Congress of Herpetology in Canterbury,UK, in 1989. Conversation outside the formal sessions was dominated byanecdotal reports, from all over the world, of once-common species that haddisappeared. In the following year, a workshop set up by the US NationalAcademy of Sciences lead to the formation of the Declining <strong>Amphibian</strong>Populations Task Force (DAPTF) in 1991, under the aegis of IUCN’s SpeciesSurvival Commission. From the start, the DAPTF was formerly linked to theWorld Congress of Herpetology (WCH).The first DAPTF Office was established at Oregon State University, Corvallis,under the direction of James L. Vial, assisted by Lorelei Saylor. In 1994,the DAPTF Office moved to the Open University, UK, with Tim Halliday asInternational Director and John Baker as International Coordinator; it remainedthere until the closure of the DAPTF in June, 2006. During its existence, theDAPTF has had five Chairs: David B. Wake, Robert Johnson, W. Ronald Heyer,James Hanken, and James P. Collins. It has had three International Coordinators:John Baker, John Wilkinson, and Jeanne McKay.At a meeting in 1992, the DAPTF set itself the following goals (Heyerand Murphy 2005):1. Catalyse, catalogue and coordinate efforts to gain an understanding ofamphibian population declines.2. Identify those target populations, species and regions that merit immediateattention.3. Gather and critically examine evidence concerning causal factors contributingto amphibian declines and identify remedial action.4. Promote data collection on amphibian populations on a long-term basis.5. Enlist the support of appropriate scientific disciplines needed to addressthe issues.6. Disseminate information on amphibian declines to the scientific communityand promote public awareness.7. Advise the IUCN, other conservation organizations, and appropriategovernmental bodies on necessary and immediate action.An important product of the DAPTF has been its regular, free newsletter,Froglog. This has been used as a means by which the DAPTF Office cancommunicate with the herpetological community, and as a medium throughwhich herpetologists can report the results of their work and air their viewson amphibian declines. As the DAPTF has developed and grown, Froglog hasincreased in size and frequency of publication; in 1997, it went from a quarterlyto bi-monthly publication. As of June 2006, 75 issues of Froglog had beenpublished. Since 2004, Froglog has been published electronically.The membership of the DAPTF was informal and it is impossible to sayhow many people around the world considered themselves to be members.The circulation of Froglog reached 3,000 when it was produced only in hardcopy, but many of these copies went to groups rather than individuals. Themembership was organized into 90 Regional Working <strong>Group</strong>s, coveringspecific regions (e.g., Southeast Asia), specific countries, or specific regionswithin countries. The work of some of these working groups contributed tothe production of major regional reports on amphibians, such as those forthe Lesser Antilles (Kaiser and Henderson 1994), the former Soviet Union(Kuzmin et al. 1995), Canada (Green 1997), Australia (Campbell 1999),southern Africa (Minter et al. 2004), and the USA (Lannoo 2005). From thebeginning, the DAPTF recognized the importance of developing protocols formonitoring amphibian populations and for disseminating best practice inpopulation monitoring among its members. An issue-based DAPTF workinggroup addressed this issue and produced an important book on the subject(Heyer et al. 1994).Since its inception, the DAPTF has allocated a substantial proportion ofits budget to an annual programme of Seed Grants. These are small awards(typically $500 to $2000) given to support projects that further the DAPTF’smission, with the intention that they will not only yield results that furtherour scientific understanding of the amphibian decline phenomenon, but willalso lead to recipients setting up new lines of research that will attractfurther, more substantial funding from conventional sources (Halliday 2002).While the greatest number of proposals has been received from the USA,the DAPTF steadily increased its global outreach year by year. Up until June2006, proposals had been received from over 80 different countries, and theDAPTF had funded projects in 49 countries. While most projects have beenfor research, some Seed Grants were awarded to particular Regional Working<strong>Group</strong>s to fund workshops and meetings. In the last few years, the budget forSeed Grants was augmented by large donations from other organizations: ananonymous donor (AD), Conservation International (CI), the Critical EcosystemPartnership Fund (CEPF), and the <strong>Amphibian</strong> and Reptile Monitoring Initiative(ARMI). These donors specified the areas in which their funding can beused: climate change (AD), specific biodiversity hotspots (CI and CEPF), andactivities within the USA (ARMI).The decline in the number of applications for DAPTF Seed Grants from2004 onwards (Table 1) is probably a reflection of the fact that the amphibiandecline phenomenon has achieved much higher status in the wider academiccommunity since the DAPTF was established. This has enabled amphibianresearchers in many parts of the world to obtain substantial grants from conventionalgrant-giving bodies. The changing pattern of applications for DAPTFSeed Grants reflects the DAPTF’s most important achievement: it stimulatedand sustained interest in amphibian declines until such time as the academiccommunity as a whole came to recognize its full importance. The DAPTFSeed Grant program was very successful in achieving its aim of enablingresearchers to initiate innovative lines of research into amphibian declinesand their causes. As of June 2006, the number of papers in refereed journalsthat acknowledged the DAPTF as a source of funding exceeded 100.In addition to its Seed Grant programme, the DAPTF maintained a smallRapid Response Fund, recognizing that some aspects of amphibian declines,notably mass mortality events, require more immediate action than can beprovided by an annual grant program. Between 1998 and 2006, the DAPTFreceived 17 bids to this fund, and funded eight of them.The development of the DAPTF coincided with the development of theinternet, enormously facilitating the capacity of organizations like the DAPTFto communicate and disseminate information globally. The DAPTF launchedits own web site in 2004 and is now linked to numerous web sites, suchas AmphibiaWeb (www.amphibiaweb.org), which cover various aspectsof amphibian biology, status and conservation. In June 2006, the DAPTFwas disbanded as an independent organization, with many of its activitiesbeing incorporated into the IUCN/SSC <strong>Amphibian</strong> <strong>Specialist</strong> <strong>Group</strong> (ASG)(see Essay 11.12).ReferencesTim HallidayCampbell, A. (ed.). 1999. Declines and Disappearances of Australian Frogs. EnvironmentAustralia, Canberra, Australia.Green, D.M. (ed.). 1997. <strong>Amphibian</strong>s in Decline: Canadian Studies of a Global Problem.SSAR, St. Louis, Missouri, USA.Halliday, T. 2002. Getting started with seed grants – the Declining <strong>Amphibian</strong> PopulationsTask Force. Species 38:18.Heyer, W.R. and Murphy, J.B. 2005. Declining <strong>Amphibian</strong> Populations Task Force. In: M.Lannoo (ed.), <strong>Amphibian</strong> Declines. The Conservation Status of United States Species,pp. 17-21. University of California Press, Berkeley, California, USA.Kaizer, H. and Henderson, R.W. 1994. The Conservation Status of Lesser Antillean Frogs.Herpetological Natural History 2:41-56.Kuzmin, S.L., Dodd, C.K. and Pikulik, M.M. (eds.). 1995. <strong>Amphibian</strong> Populations in theCommonwealth of Independent States: Current Status and Declines. Pensoft Publications,Moscow, Russia.Lannoo, M. (ed.). 2005. <strong>Amphibian</strong> Declines. The Conservation Status of United StatesSpecies. University of California Press, Berkeley, California, USA.Minter, L.R., Burger, M., Harrison, J.A., Braack, H.H., Bishop, P.J. and Kloepfer, D. (eds.).2004. Atlas and Red Data Book of the Frogs of South Africa, Lesotho and Swaziland.Smithsonian Institution, Washington D.C, USA.Table 1. DAPTF Seed Grants submitted and awarded by year.Year No. Submitted No. Awarded Value ($$)1992 2 1 1,0001993 31 5 4,9751994 1 0 01995 38 9 15,5171996 3 2 3,0001997 49 11 22,9211998 53 15 27,5501999 45 14 23,8282000/1 47 21 40,2832002 57 37 58,2172003 63 19 32,5372004 65 23 43,1232005 48 14 25,4502006 32 12 23,133Totals 534 183 $321,534ESSAY 11.2. AMPHIBIAN GLOBAL GAP ANALYSIS: EVALUATING THE EFFECTIVENESS OF THE WORLD’S PROTECTED AREASIN REPRESENTING AMPHIBIANSThe in-situ conservation of viable populations in natural ecosystems iswidely recognized as a fundamental requirement for the maintenance ofbiodiversity (e.g., Convention on Biological Diversity). Indeed, the practicalvalue of protected areas in shielding areas of land from destructive use hasbeen clearly demonstrated (e.g. Bruner et al. 2001). Protected areas havetherefore received wide recognition as core components of conservationstrategies, and their designation is a requirement of several multilateralenvironmental agreements (e.g., the Convention on Biological Diversity andthe Ramsar Convention on Wetlands), as well as national and internationallegislation (e.g., European Union Birds and Habitats Directives).In 1992, the Fourth Congress on National Parks and Protected Areas (Caracas,Venezuela) called for protection of at least 10% of each major biomeby the Year 2000 (IUCN 1993), an ambitious target at a time when only anestimated 3% of the planet’s land area was under protection. In 2003, the FifthWorld Parks Congress (Durban, South Africa) witnessed the announcementthat 11.5% of the Earth’s land surface is now under some form of protection(Chape et al. 2003). Most Governments have invested in the creation ofprotected areas systems, with more than 100,000 being recognized by the2003 United Nations List of Protected Areas (Chape et al. 2003).This extraordinary expansion of the global network of protected areasshould be celebrated as a major conservation achievement, as they areno doubt contributing very significantly for the protection of the world’sbiodiversity. However, this global network is still largely incomplete. A recentglobal gap analysis found that at least 12% of the species of birds, mammals,amphibians and turtles analysed were not covered by any protectedarea in any part of their ranges (Rodrigues et al. 2004). <strong>Amphibian</strong>s hadthe highest proportion of gap species. Here, we update the results of this2004 global gap analysis for amphibians, drawing on improved species andprotected area data.A precise evaluation of how effective the world’s protected areas arein safeguarding amphibians is not possible with current knowledge. On theone hand, our data on species’ distributions are very coarse: all we have aregeneralized maps of extent of occurrence that for most species are likely toinclude vast expanses of unsuitable habitat. On the other hand, our data onprotected areas are very limited: the database is likely to be incomplete,but also likely to include many areas in which amphibian species are poorlyprotected, or not protected at all. It is therefore impossible to know exactlywhich species are adequately conserved in which protected areas. We useda diversity of approaches to obtain a range of estimate of the degree to whichamphibian species are covered by the global network of protected areas.The first three approaches employed (Table 1) investigated the spatialoverlap between the amphibian distribution maps compiled through theGlobal <strong>Amphibian</strong> Assessment and the 2006 World Database on ProtectedAreas (WDPA 2006). The WDPA includes about 57,500 protected areasmapped as polygons and about 118,000 protected areas mapped as points.Amongst the latter, the 80,500 for which area information was availablewere converted to circles, while the remaining protected areas were simplymapped as points.In the most simple of the gap analysis approaches (Gap 1), we lookedfor species whose ranges do not overlap any of the protected areas in theWDPA. This approach considers a species to be ‘covered’ if any part of itsmapped range overlaps any protected area; otherwise, it is a ‘gap species’.Given the data limitations explained above, this is very likely to be a crudeoverestimate of the overall species coverage. Trying to focus on protectedareas more likely to effectively protect species, in our second approach(Gap 2) we narrowed down the definition of protected area to include onlythose classified by IUCN as ‘strictly protected’, that is, under categories I toVI (IUCN 1994). The third approach (Gap 3) considered only protected areaslarger than 1,000 ha (thus excluding also all of those mapped as points) whichare classified under categories I to IV (Table 1). The fourth and final approach(Gap 4) did not use the WDPA data. Instead, it used information providedby the Global <strong>Amphibian</strong> Assessment experts on whether or not a specieswas known to occur in protected areas. A species was considered coveredif protected areas were considered to be a conservation measure in place,and a gap species otherwise.The fraction of species identified as gap species varied between 14.1%and 28.8% of all amphibians, and between 19.7% and 35.1% of threatenedspecies (Table 1). The strong bias towards threatened species is again evidentfrom Figure 1, which also demonstrates that species of higher levels of threat(Critically Endangered) are particularly likely to be gap species. Data Deficientspecies are the dominant Red List category amongst gap species (Figure 1).Less-known species tend to have poorly known distributions, so many of thesespecies may be subsequently found to occur in protected areas. However, lackof knowledge is often associated with rarity, and thus many of these speciesare likely to have truly small populations and to be highly threatened.Previous studies found that levels of coverage for amphibians aresubstantially lower than for other vertebrate taxa (Rodrigues et al. 2004).This is likely a reflection of their much smaller range sizes, as widespreadspecies tend to be covered in protected areas even if by chance alone. Otherexplanations include habitat preference – amphibians tend to be associatedwith freshwater habitats, which are not particularly well addressed by theterrestrial network of protected areas – and taxonomic bias – few protectedareas were created with any consideration of amphibian distributions. Bymapping the gap species found according to each approach it is possible toobtain a map of the regions where the global protected area network is mostincomplete in representing amphibian species (Figure 2).Overall, the areas identified as having higher concentrations of gap speciesGap analysis approach All species ThreatenedspeciesGap 1 (All protected areas in the WDPA) 815 (14.1%) 356 (19.7%)Gap 2 (IUCN categories I to IV) 1,390 (24.0%) 599 (33.1%)Gap 3 (IUCN categories I to IV AND 1,473 (25.4%) 635 (35.1%)>1,000 ha)Gap 4 (GAA experts) 1,669 (28.8%) 618 (34.1%)Total number of species 5,794 1,810Table 1. Number and percentage of gap species under each approach, forall species and for threatened species. The total number of species refers tothose for which distribution maps were compiled in the Global <strong>Amphibian</strong>Assessment (i.e., it excludes 124 species of unknown distributions).
126Threatened <strong>Amphibian</strong>s of the Worldfall overwhelmingly in the tropics, especially in tropical and subtropical moistforests. They are also disproportionately located on islands, and on regions ofhigh topographic complexity (tropical mountains). In the Western Hemisphere,the highest concentrations of gap species are found in the tropical Andesand in the Sierra Madre mountains in Central America. The Atlantic Forestand the Caribbean are also highlighted. Although the Guayana Shield andthe Amazon are noted centres of endemism (see Chapter 4), the general lackof gaps there reflects their extensive networks of protected areas and therelatively wide ranges of most of their species.For Africa, gap species tend to concentrate almost exclusively in themountains, including the Cameroonian highlands, the Eastern Arc Mountains,the Albertine rift, the Ethiopian Highlands, and eastern Madagascar. Mostgap species found in these regions of high endemism (see Chapter 4) havevery restricted ranges. Concentrations of gap species in Somalia, on the other% of species in each Red List Category100806040200All species Gap 1 Gap 2 Gap 3 Gap 4EW CR EN VU NT LC DDhand, reflect this region’s extremely poor protected area coverage.In Asia, the main concentrations of gap species are found in the WesternGhats and Sri Lanka, but also in Himalayan slopes, southern China, and Japan,particularly the Nansei-Shoto (or Ryukyu) Islands. Further east, New Guineaand the Solomon Islands emerge as major priorities for the establishmentof new protected areas. All of these are areas of very high endemism foramphibians (see Chapter 4).Nearly all of the regions identified here as having major gaps in protectedarea coverage of amphibian species are located in low-income countries in thetropics – those that can least afford the costs of establishing and enforcingprotected areas (James et al. 1999). This is the case even if the significantlocal benefits of protected areas are factored in (Balmford et al. 2003), becausemuch of the benefit of the establishment of protected areas is realized at aglobal scale (Kremen et al. 2000). Thus, our recommendation for the rapidFigure 1. Distribution of Red List categories amongst all species of amphibiansand amongst those identified as gap species. Red List categories: CR– Critically Endangered; EN – Endangered; VU – Vulnerable; NT – Near Threatened;LC – Least Concern; DD – Data Deficient; EW – Extinct in the Wild.Figure 2. Number of amphibian gap species per equal-area (3,113km 2 )hexagon, averaged across the results of the four approaches to gap analysisemployed. Darker cells have, on average, a larger number of gap species;colour scale based on seven quantile classes.establishment of protected areas in these regions goes hand-in-hand with arecommendation that the costs of this conservation are largely borne by theglobal community. Donor country governments, through bilateral and multilateralinstitutions, as well as NGOs, foundations, and private corporationsand individuals all have an important role to play in financing conservation(Balmford and Whitten 2003).ReferencesAna S.L. RodriguesBalmford, A. and Whitten, T. 2003. Who should pay for tropical conservation, and howcould the costs be met? Oryx 37:238-250.Balmford, A., Gaston, K.J., Blyth, S., James, A. and Kapos, V. 2003. Global variation interrestrial conservation costs, conservation benefits, and unmet conservation needs.Proceedings of the National Academy of Sciences of the United States of America100:1046-1050.Bruner, A.G., Gullison, R.E., Rice, R.E. and Fonseca, G.A.B. 2001. Effectiveness of parks inprotecting tropical biodiversity. Science 291:125-128.Chape, S., Blyth, S., Fish, L., Fox, P. and Spalding, M. 2003. 2003 United Nations List ofProtected Areas. IUCN and UNEP/WCMC, Gland, Switzerland and Cambridge, UK.IUCN 1993. Parks for Life: Report of the IV th World Congress on National Parks and ProtectedAreas. IUCN, Gland, Switzerland.IUCN and WCMC, 1994. Guidelines for Protected Area Management Categories. IUCNand WCMC, Gland, Switzerland.James, A.N., Gaston, K.J. and Balmford, A. 1999. Balancing the Earth’s accounts. Nature401:323-324.Kremen, C., Niles, J.O., Dalton, M.G., Daily, G.C., Ehrlich, P.R., Fay, J.P., Grewal, D. andGuillery, R.P. 2000. Economic incentives for rain forest conservation across scales.Science 288:1828-1832.Rodrigues, A.S.L., Andelman, S.J., Bakarr, M.I., Boitani, L., Brooks, T.M., Cowling, R.M.,Fishpool, L.D.C., Fonseca, G.A.B., Gaston, K.J., Hoffmann, M., Long, J.S., Marquet,P.A., Pilgrim, J.D., Pressey, R.L., Schipper, J., Sechrest, W., Stuart, S.N., Underhill, L.G.,Waller, R.W., Watts, M.E.J. and Yan, X. 2004. Effectiveness of the global protectedarea network in representing species diversity. Nature 428:640-643.WDPA Consortium. 2006. 2006 World Database on Protected Areas. IUCN-WCPA andUNEP-WCMC, Washington D.C., USA.ESSAY 11.3. IDENTIFYING AND SAFEGUARDING KEY BIODIVERSITY AREAS FOR AMPHIBIAN CONSERVATIONThe overwhelming threat to biodiversity worldwide is the loss of nativehabitat (Baillie et al. 2004). Nearly 90% of globally threatened amphibians arebeing negatively impacted by habitat loss. Thus, conserving habitat is criticalfor the survival of amphibian species. One of the most effective means oftargeting habitat conservation efforts is through the identification of globallysignificant sites for biodiversity conservation, termed Key Biodiversity Areas(KBAs; Eken et al. 2004).KBAs are identified using a set of globally standard criteria and thresholdsderived from those developed by BirdLife International for the identificationof Important Bird Areas (IBAs; e.g., Fishpool and Evans 2001). The KBAcriteria align with the two principal measures of systematic conservationFigure 1. Key Biodiversity Areas identified for amphibian species in thePhilippines, indicating the single Alliance for Zero Extinction site (SouthGigante Island. Numbers on the map correspond as follows:1 - Southwestern Negros; 2 - Northern Negros Natural Park; 3 - Bataan NaturalPark and Subic Bay Forest Reserve; 4 - Buguey Wetlands; 5 - Kalbario-PatapatNational Park; 6 - Pagbilao and Tayabas Bay; 7 - Timpoong and Hibok-hibokNatural Monument; 8 - Dumaran-Araceli; 9 - Balabac Island; 10 - PuertoGalera; 11 - Mt. Makiling Forest Reserve; 12 - Balbalasang-Balbalan NationalPark; 13 - Apayao Lowland Forest; 14 - North Central Sierra Madre Mountains;15 - Angat Watershed Forest Reserve; 16 - Mts. Irid-Angilo and Binuang; 17- Mt. Kulasi; 18 - Malpalon; 19 - Busuanga Island; 20 - Ban-ban; 21 - Biliranand Maripipi Island; 22 - Anonang-Lobi Range; 23 - Mt. Nacolod; 24 - Mt.Diwata Range; 25 - Bislig; 26 - Mt. Agtuuganon and Mt. Pasian; 27 - Mt.Kampalili-Puting Bato; 28 - Mt. Kaluayan-Mt. Kinabalian Complex; 29 - Mt.Tago Range; 30 - Siburan; 31 - Balogo Watershed; 32 - Mt. Mantalingajan; 33- South and North Gigante Island; 34 - Mt. Capayas; 35 - Mt. Dajo NationalPark; 36 - Victoria and Anepahan Ranges; 37 - Mt. Dingalan; 38 - AuroraMemorial National Park; 39 - Zambales Mountains; 40 - Mt. Bandila-an; 41- Mt. Dapiak-Mt. Paraya; 42 - Mt. Busa-Kiamba; 43 - Mt. Sinaka; 44 - Mt.Hilong-hilong; 45 - Mt. Kambinlio and Mt. Redondo; 46 - Polillo Island; 47- Marinduque Wildlife Sanctuary; 48 - Central Cebu Protected Landscape;49 - Rajah Sikatuna Protected Landscape; 50 - San Vicente-Taytay-RoxasForests; 51 - Central Panay Mountains; 52 - Mt. Halcon; 53 - NorthwestPanay Peninsula Natural Park; 54 - Mt. Canlaon Natural Park; 55 - PasonancaNatural Park; 56 - Basilan Natural Biotic Area; 57 - Mt. Malindang NaturalPark; 58 - Mt. Kitanglad Range Natural Park; 59 - Mt. Matutum ProtectedLandscape; 60 - Malampaya Sound Protected Landscape and Seascape; 61- El Nido Managed Resource Protected Area; 62 - Mt. Guiting-guiting NaturalPark; 63 - Mt. Calavite Wildlife Sanctuary; 64 - Quirino Protected Landscape;65 - Mt. Kalatungan Range Natural Park; 66 - Mt. Isarog Natural Park; 67- Casecnan Protected Landscape; 68 - Mt. Apo Natural Park; 69 - Cuernosde Negros; 70 - Agusan Marsh Wildlife Sanctuary; 71 - Mts. Banahaw-SanCristobal Protected Landscape; 72 - Samar Island Natural Park; 73 - Mt.Pulag National Park; 74 - North Eastern Cagayan Protected Landscapeand Seascape; 75 - Northern Sierra Madre Natural Park; 76 - PenablancaProtected Landscape and Seascape; 77 - Calauit Island; 78 - Culion Island;79 - Romblon Island
Chapter 11. <strong>Amphibian</strong> Conservation – Responding to the Global Decline of <strong>Amphibian</strong>s 127planning, vulnerability and irreplaceability (Margules and Pressey 2000),and can be applied to all taxonomic groups. Sites that hold one or moreglobally threatened species or that have globally significant populations ofa geographically concentrated species qualify. Geographically concentratedspecies include those that have a limited global range size (provisionally setat 50,000km²), termed restricted-range species, as well as globally significantcongregations of species.Boundaries for KBAs are drawn to yield sites that can be managed forconservation, using data on management units, species’ ecological requirements,the extent of remaining habitat, topographical features, and humansettlement patterns. In identifying and delineating KBAs for amphibians,information from the Global <strong>Amphibian</strong> Assessment (GAA), including rangepolygons, population estimates, and information on threats, conservationmeasures, and habitat requirements of species, can be used in combinationwith more specific locality data to help identify globally important sites.The identification of the set of KBAs within a region is typically drivenfrom the national level. A good example of a country where this process isfar advanced is the Philippines. With more than 20,000 endemic species, thePhilippines is one of the world’s 17 “megadiversity” countries (Mittermeier etal. 1997), but with less than 7% of its original forest cover remaining intact, itis also one of 34 global biodiversity hotspots (Mittermeier et al. 2004). As such,accurately targeting scarce conservation resources is particularly important.Several priority-setting processes have contributed to this goal, including theidentification of 117 IBAs by BirdLife International and the Haribon Foundationin 2001 and of 206 conservation priority areas by the Philippine BiodiversityConservation Priority-setting Program (PBCPP) in 2002. In 2004, ConservationInternational-Philippines, in collaboration with the Haribon Foundation andthe Protected Areas and Wildlife Bureau of the Department of Environmentand Natural Resources, built on this earlier work to identify KBAs for multipletaxonomic groups, using a systematic, data-driven process. A number of otherpartner NGOs, government agencies, research institutions, and individualexperts were involved in contributing data and peer review.A total of 128 KBAs were identified for threatened and endemic amphibians,mammals, birds, reptiles, and freshwater fish, with 79 sites triggeredby 49 amphibian species (Figure 1). This total includes one Alliance for ZeroExtinction site (see main text) identifi ed for an amphibian species (the Endangeredisland forest frog, Platymantis insulata, which is entirely restrictedto the tiny island of South Gigante).The KBA process sometimes focuses on a regional level and involvesmulti-country cooperation. For example, in 2002, Nature Kenya and theWildlife Conservation Society of Tanzania, with the support of the CriticalEcosystem Partnership Fund (CEPF), collaborated to identify globally importantsites for conservation within the Eastern Arc Mountains and Coastal Forestsof Tanzania and Kenya biodiversity hotspot (sensu Myers et al. 2000). Buildingupon the successful identifi cation of IBAs in the region, a total of 160 KBAswere identified across five taxonomic groups (plants, gastropods, birds, mammals,and amphibians). A total of 20 KBAs were identifi ed for 44 amphibianspecies. Although KBAs continue to be refi ned as additional species andhabitat data are obtained, the process of communicating these conservationtargets to partners is well underway. In East Africa, in addition to providinga geographically explicit strategy for US$7 million of CEPF investment in thehotspot, these sites have also been adopted by a number of conservationpartners in Tanzania and Kenya. Most importantly, they serve as the basisfor priority sites in the $62.2 million Eastern Arc Mountains EndowmentFund, supported by the Global Environment Facility (GEF). The identifi cationof KBAs, therefore, clearly serves as a vital tool in focusing and leveragingfunding for conservation.Once identifi ed, safeguarding KBAs can take many forms, ranging fromformal governmental protection and management, to strengthened managementat existing sites, to implementing community-based conservation, tostrengthening and monitoring the success of existing projects on the ground.One recent example from Colombia concerns the proclamation of the ElDorado Nature Reserve, contiguous with the Parque Nacional Natural SierraNevada de Santa Marta, which is the only known site for seven threatenedamphibians, including the Critically Endangered Santa Marta Harlequin FrogAtelopus laetissimus and San Lorenzo Harlequin Frog Atelopus nahumae.Upon learning of the impending sale of plots from the site for the constructionof vacation homes, three conservation organizations, Fundación ProAves,the American Bird Conservancy, and Conservation International, stepped into protect this 1,600-acre site on the north-west slope of the Sierra Nevadade Santa Marta massif.In summary, site conservation is clearly critical in ensuring the long-termpersistence of amphibian species, and in many cases complements andenhances the effectiveness of other important conservation techniques, suchas disease mitigation, invasive species eradication, and captive breeding.However, effective conservation action is only possible if we know where suchsites are – and the KBA approach provides the tools necessary to highlightsites of global conservation signifi cance for amphibians.ReferencesNaamal De Silva, Ruth Grace Ambal, Melizar V. Duya,Matt Foster, Kim Howell, David Knox, Penny Langhammer,Robinson Mugo and Alex NgariBaillie, J.E.M., Hilton-Taylor, C. and Stuart, S.N. 2004. A Global Species Assessment.IUCN, Gland, Switzerland.Eken, G., Bennun, L., Brooks, T.M., Darwell, W., Fishpool, L.D.C., Foster, M., Knox, D.,Langhammer, P., Matiku, P., Radford, E., Salaman, P., Sechrest, W., Smith, M.L.,Spector, S. and Tordoff, A. 2004. Key Biodiversity Areas as Site Conservation Targets.Bioscience 54:110-118.Fishpool, L.D.C. and Evans, M.I. 2001. Important Bird Areas in Africa and associatedislands: Priority sites for conservation. Pisces Publications and BirdLife International,Newbury and Cambridge, UK.Margules, C.R. and Pressey, R.L. 2000. Systematic conservation planning. Nature405:243-253.Mittermeier, R.A., Robles Gil, P. and Mittermeier, C.G. (eds.). 1997. Megadiversity. CEMEX,Mexico City, Mexico.Mittermeier, R.A., Robles-Gil, P., Hoffmann, M., Pilgrim, J.D., Brooks, T.M., Mittermeier,C.G., Lamoreux, J.L. and Fonseca, G. (eds.). 2004. Hotspots Revisited: Earth’s BiologicallyRichest and Most Endangered Ecoregions. Second Edition. CEMEX, MexicoCity, Mexico.Myers, N., Mittermeier, R.A., Mittermeier, C.G., Fonseca, da G.A.B. and Kent, J. 2000.Biodiversity hotspots for conservation priorities. Nature 403:853-858.ESSAY 11.4. PREDICTING THE DISTRIBUTION AND SPREAD OF PATHOGENS TO AMPHIBIANSKnowledge of the distribution of species is essential in order to conserve biodiversity.Conventional methods for inferring and monitoring changes in speciesdistributions require labour- and time-intensive efforts and are realisticallypractical only for selected taxa and small geographic regions. Nevertheless,as human-induced pressures on biological diversity and extinctions increaseworldwide, accurate predictions of species distributions are in increasinglyurgent demand by both scientific and conservation communities.Modelling ecological niches to predict the geographic distribution ofspecies has become an indispensable tool and has been used to study awide variety of processes in ecology, evolution, and conservation (Grahamet al. 2004). This suite of modelling techniques use complex mathematicalalgorithms to quantify the environmental space, or envelope, of species bydetermining the association between occurrence records and a series ofenvironmental or biotic niche dimensions (e.g., temperature, precipitation,vegetation; see Figure 1). This relationship is then used to estimate theprobability of occurrence of the target species in regions where it has notyet been recorded, and to estimate the geographic extent of suitable habitat.These areas are “analogous ecologically” to areas where the species hasbeen reported to occur. As such, they are a function of the species’ ecologicalniche or environmental requirements, at least along the niche dimensionsconsidered (Soberón and Peterson 2005).More recently, ecological niche modelling has been used in epidemiologicalstudies to predict the distributions of pathogens, pests and diseases. Forexample, areas of Chagas disease, Ebola haemorrhagic fever, and Sudden OakDeath outbreaks have been successfully predicted (Peterson et al. 2002, 2004;Guo et al. 2005). These studies also yielded a detailed understanding of diseaseoccurrence and risk areas, parasite-host distributional relationships, andecological factors contributing to outbreaks. These and other examples revealthe applicability of ecological niche modelling to better inform programmesaimed at managing wildlife infectious diseases, particularly in regions wherespecies survival has been compromised by the arrival of emerging diseases.Nevertheless, the application of ecological niche modelling on studies ofamphibians’ pathogens has been surprisingly limited.Emerging infectious diseases have been increasingly identified acrossthe globe as a threat to wildlife and human welfare (Daszak et al. 2000). Anemerging disease generally has two characteristics: (1) its geographical rangeor host range is expanding, or its prevalence has been increasing in recentyears, and (2) these changes are frequently driven by some form of largescaleanthropogenic environmental change, such as climate anomalies ordeforestation (Daszak et al. 2004). Given the link between disease occurrenceand environmental conditions, ecological niche modelling should prove to bea valuable tool for examining the dynamics of emerging diseases.Studies have shown that habitat degradation and climate change canaffect the life cycle of pathogens and can, therefore, influence the patternsof disease outbreak and transmission. As a consequence, modelling thedistribution of pathogens under different scenarios of future climate change,habitat loss, and fragmentation can be an important predictive tool to facilitatedisease control. Identifying areas where disease is likely to spread as a resultof climate change and habitat degradation should allow prioritization ofmonitoring efforts into high risk and presently uninfected areas. Predictionsof both current and future distributions should also be useful for managementof both pathogens and infected species.<strong>Amphibian</strong>s may provide a dramatic example of the devastating impact ofemerging diseases on wildlife. Over the past few years, a number of studieshave implicated fungal, viral, bacterial, and parasitic diseases in populationdeclines, and even extinctions, of amphibians (Daszak et al. 2003). Ofparticular relevance is chytridiomycosis, a disease caused by a pathogenicfungus that may be related to mass deaths and severe declines in amphibianpopulations around the Earth (Longcore et al. 1999; Daszak et al. 2003).Niche modelling and disease in amphibians:an illustrative exampleThe fi rst application of niche modelling as a tool to characterize the environmentalenvelope and potential distribution of an amphibian pathogen wasINPUT DATA1. Species occurrence records 2. Ecological variablesENM3. Niche model in ecological dimensions 4. Distributional predictionElevationAnnual PrecipitationAnnual Mean TemperatureGeographic projectionFigure 1. Ecological niche modeling (ENM). Predictions of niche occurrenceare based on: (1) Species geographic distribution in the form of primary pointoccurrence data, and (2) Environmental variables. Modeling (3) consists onfi nding the association between species occurrence records and environmentalor ecological variables. The associations fi nd “resemblances” on theenvironmental layers between occurrence records and other regions of themap. The output is a prediction of the distribution of regions suitable for theoccurrence of the target species (4). The prediction represents the ecologicalniche projected back onto geography. Most of the modeling methods yieldmaps showing varying probabilities of the presence of suitable conditionsacross the region.OUTPUTAnnual Mean TemperatureVegetationAnnual PrecipitationMinimum Temperature of Coldest PeriodElevation20-4040-6020-4040-60
128Threatened <strong>Amphibian</strong>s of the WorldFigure 2. Predicted distribution of the fundamental niche of (A) the chytridfungus Batrachochytrium dendrobatidis, and (B) the Jambato toad, Atelopusignescens, in Ecuador, South America. Darker yellow and red tones indicate ahigher probability of occurrence. (C) shows areas of overlap between both species(gray areas). Red and yellow tones show areas of no overlap. Models werebuilt from nine chytrid and 76 A. ignescens localities of known occurrenceusing MAXENT (Phillips et al. 2004). A 0.5 threshold was used to transformthe probability data to presence/absence data for the chytrid fungus model.The predicted areas for the pathogen and the host overlap widely.A. Chytrid distribution model C. Overlap of distribution areaspublished by Ron (2005). Niche modelling was used to predict the distributionof the chytrid fungus Batrachochytrium dendrobatidis, in the New World. Thepredictions indicate that the regions of highest suitability for the chytrid arealso the areas with the most diverse amphibian faunas worldwide. This studymakes recommendations for management based on the fact that regionssuitable for the establishment of the pathogen are widespread and that thepathogen has been regularly found in the pet trade. Specifically, Ron (2005)suggests the implementation of severe trade regulations for live amphibiansto avoid anthropogenic spread of the pathogen.The predicted occurrence of the chytrid fungus under a wide variety ofenvironmental regimes and habitat types contrasts with the fact that mostrecords for the chytrid fungus in the West Indies, Central, and South Americaare restricted to a somewhat limited portion of the predicted environmentalniche (e.g., from montane forests and paramos). This asymmetry probablyresults from the inclusion of North American records in the process of modelbuilding, and highlights potential biases in the application of environmentalniche modelling when the underlying locality data is not a representativesample of the pathogen’s environmental niche. Ideally, the input of the modelshould consist of positive localities found from uniform sampling throughoutthe distribution range. In reality, the distribution of positive records isbiased by accessibility to field sites, availability of museum collections andeconomic resources, and even by scientists’ idiosyncrasies (e.g., a prioriperceptions of where the pathogen should occur). Other sources of modelerror are false positive localities and the exclusion of niche dimensionsthat are relevant to limit the pathogen niche. Comprehensible reviews ofthese sources of error are provided by Guisan and Zimmerman (2000) andGuisan and Thuiller (2005).Predicting pathogen and host overlapTo exemplify the applicability of ecological niche modelling in the study ofamphibian declines, we modelled the distribution of both the chytrid fungusand the Jambato Toad, Atelopus ignescens (CR), in Ecuador. The JambatoToad was once widespread and common in the northern Andes and representsa well-documented case of the disappearance of an amphibian in theNeotropics during the late 1980s. According to our predictions, the geographicdistribution of chytrid in Ecuador overlaps widely with that of the JambatoToad (Figure 2). The environmental envelope analysis shows that both havevery similar environmental requirements (i.e., low temperatures during thecoldest and driest seasons; Figure 3). These results suggest an ecologicaland geographical association between both species that is consistent withhypotheses implicating the chytrid fungus in the extinction of the JambatoToad and other Andean amphibians (Ron et al. 2003; Pounds et al. 2006). Moredetailed studies to explore the overlap between the niche space of threatenedspecies and the chytrid fungus would be valuable to help clarify the role ofthis pathogen in widespread amphibian population declines.Newly available informationSeveral new types of information should be used to improve our understandingof the geographic and ecological distribution of the chytrid fungus andother pathogens of amphibians, as well as to predict how these distributionswill change as a result of anthropogenic activities. The past several yearshave witnessed a tremendous increase in the availability of information thatincludes extensive databases on species occurrence (hosts and pathogens),high-resolution spatial data from remote-sensing platforms, comprehensivetreatments of species phylogenies, and new insights on pathogen environmentalphysiology. Species occurrence records can be used to evaluate thespatial overlap of amphibian species and pathogens to assess extinctionrisks in the context of their respective evolutionary histories. Fine-grainedremotely sensed information and faster computer processors should allow usto build more precise and refined predictions of amphibian disease outbreaksusing ecological niche modelling. At present, the temporal resolution ofclimate maps is 30 years, which is too gross to predict disease driven bydemographic processes. Finally, manipulative experimentation has resultedin new information about the physiology of chytrid fungus that can also beused to refine distribution models.We expect that the combination of these diverse sources of informationin the framework of ecological niche modelling will contribute significantlyto understand disease epidemiology. New insights on disease distributionand spread would also help to develop and test hypotheses on diseasedynamics that will improve our capacity to design effective conservationprogrammes for amphibians.References0-2020-4040-6060-8080-100B. Atelopus ignescens distribution model0-2020-4040-6060-8080-100Pablo A. Menéndez-Guerrero, Santiago R. Ronand Catherine H. GrahamDaszak, P., Cunningham, A.A. and Hyatt, A.D. 2000. Emerging infectious diseases of wildlife- threats to biodiversity and human health. Science 287:443-449.Daszak, P., Cunningham, A.A. and Hyatt, A.D. 2003. Infectious disease and amphibianpopulation declines. Diversity and Distributions 9:141-150.Daszak, P., Tabor, G.M., Kilpatrick, A.M., Epstein, J. and Plowright, R. 2004. ConservationMedicine and a new agenda for emerging diseases. Annals of the New York Academyof Science 1026:1-11.Guisan, A. and Thuiller, W. 2005. Predicting species distribution: offering more than simplehabitat models. Ecology Letters 8:993-1009.Guisan, A. and Zimmermann, N.E. 2000. Predictive habitat distribution models in ecology.Ecological Modelling 135:147-186.Graham, C.H., Ferrier, S., Huettman, F., Moritz, C. and Peterson, A.T. 2004. New developmentsin museum-based informatics and application in biodiversity analysis. Trendsin Ecology and Evolution 19:497-503.Guo, Q., Kelly, M. and Graham, C.H. 2005. Support vector machines for predicting distributionof Sudden Oak Death in California. Ecological Modeling 182:75-90.Longcore, J.E., Pessier, A.P. and Nichols, D.K. 1999. Batrachochytrium dendrobatidis gen.et sp. nov., a chytrid pathogenic to amphibians. Mycologia 91:219-227.Phillips, S.J. Dudík, M., and Schapire R. E. 2004. A maximum entropy approach to speciesdistribution modeling. Proceedings of the Twenty-First International Conference onMachine Learning, pp. 655-662.Pounds, A.J., Bustamante, M.R., Coloma, L.A., Consuegra, J.A., Fogden, M.P.L., Foster, P.N.,La Marca, E., Masters, K.L., Merino-Viteri, A., Puschendorf, R., Ron, S.R., Sanchez-Azofeifa, G.A., Still, C.J. and Young, B.E. 2006. Widespread amphibian extinctionsfrom epidemic disease driven by global warming. Nature 439:161-167.Peterson, A.T., Bauer, J.T. and Mills, J.N. 2004. Ecologic and geographic distribution offilovirus disease. Emerging Infectious Diseases 10:40-47.Peterson, A.T., Sanchez-Cordero, V., Beard, C.B. and Ramsey, J.M. 2002. Ecologic nichemodelling and potential reservoirs for Chagas disease, Mexico. Emerging InfectiousDiseases 8:662-667.Ron, S.R. 2005. Predicting the distribution of the amphibian pathogen Batrachochytriumdendrobatidis in the New World. Biotropica 37:209-221.Ron, S.R., Duellman, W.E., Coloma, L.A. and Bustamante, M.R. 2003. Population declineof the Jambato Toad Atelopus ignescens (Anura: Bufonidae) in the Andes of Ecuador.Journal of Herpetology 37:116-126.Soberón, J. and Peterson, A.T. 2005. Interpretation of models of fundamental ecologicalniches and species’ distributional areas. Biodiversity Informatics 2:1-10.Primarily mean diurnal temperature rangelow highPC II2.50.0-2.5TaxaChytrid modelEcuadorian amphibian recordsChytrid recordsJambato toad records-2.0 0.0 2.0 4.0PC Ilow highPrimarily temperatures during coldest and driest seasonsFigure 3. Axes I and II from principal components analysis based on 19environmental variables in Ecuador. Gray circles: 2000 random locations withinthe Chytrid fungus predicted niche distribution; green circles: 296 localities ofknown occurrence of Ecuadorian endemic species of amphibians in the generaColostethus and Atelopus; blue squares: 9 localities of known occurrence ofChytrid fungus Batrachochytrium dendrobatidis; red circles: 74 localities ofknown occurrence of Jambato Toad Atelopus ignescens. So far, all examinedspecimens of A. ignescens for chytridiomycosis have tested negative (Ron etal. 2003). However, the overlap between chytrid fungus model and Jambatotoad’s occurrences in the environmental space is evident. Locality data isfrom specimens deposited in Field Museum of Natural History, Museo deZoología Pontificia Universidad Católica del Ecuador, Museo de HistoriaNatural Gustavo Orcés, Museum of Comparative Zoology Harvard University,Museum of Zoology University of Michigan, Museum of Vertebrate ZoologyUniversity of California, Natural History Museum University of Kansas, andNatural History Museum of Los Angeles County.ESSAY 11.5. ON THE ROLE OF EX-SITU MANAGEMENT IN THE CONSERVATION OF AMPHIBIANSThe best place to conserve wildlife is in the wild. However, in-situ threatssometimes cannot be mitigated quickly enough to prevent the extinction ofa species in the immediate future, with the result that ex-situ interventionthen becomes the only option available. However, given the magnitude of theproblem versus the currently limited resources of the global ex-situ community,there simply is no room for most species in need of ex-situ management. Forexample, we estimate that the global zoo community can currently manageviable populations of ~50 amphibian species, which amounts to perhaps10% of those requiring ex-situ intervention. Much ex-situ space exists inthe private sector, but very little is currently utilized for conservation, with afew notable exceptions. Other limitations of ex-situ programmes are expenseand risk of disease transmission, inbreeding and artificial selection. Ex-situprogrammes must be placed in the broader context of integrated recoveryefforts: they are one component of the global conservation response, onethat cannot stand alone, and one whose success still ultimately relies uponmitigation of the in-situ threats.We see five conservation roles for ex-situ populations, balancing theirpotential contributions with their inherent limitations, all of which directlyor indirectly benefit wild populations:• management for release to augment or restore wild populations• conservation research
Chapter 11. <strong>Amphibian</strong> Conservation – Responding to the Global Decline of <strong>Amphibian</strong>s 129• conservation education• commercial production to relieve in-situ collecting pressure• fund-raising to support any of the first four activities and/or directly supportin-situ conservationThese roles are not mutually exclusive, and with careful planning, mostex-situ populations can serve and benefit from multiple roles. Although theseroles have been dealt with in larger monographs (e.g., Griffiths and Kuzmin2006, Marantelli et al. unpubl.), management for release is a task unique tothe ex-situ community and will therefore be the focus of this essay. Here,we submit case studies in which programmes implemented by the ex-situcommunity have helped prevent the extinction of a threatened species. Wepresent these case studies as models show-casing a range of options forfuture action.Translocations with time in ex-situ programmelimited to that required for transportIn circumstances where threats have been identified and mitigated or arespatially limited, and where populations still exist that are demographicallyrobust enough to sustain harvesting, the simple translocation of animals tothreat-free locations may lead to the re-establishment of populations previouslylost. Such programmes can be achieved cheaply and with minimum risk.Successful re-establishment of populations has been achieved by this methodfor the Natterjack Toad Bufo calamita (LC; Denton et al. 1997). Translocationof tadpoles from one wild site to another has established new populationsof the Mallorcan Midwife Toad Alytes muletensis (VU; Buley and Gonzalez2000; and see Essay 11.6) where previously more risky and expensive ex-situbreeding programmes were employed.Translocations/reintroductions with time inex-situ programme limited to that required forhead-startingWhere threats are mitigated, but extant populations cannot sustain the harvestinglevels required to establish new populations through translocation, or wherereduction of mortality can help achieve a positive rate of population increase,head-starting programmes can be an effective and economical solution. Suchprojects utilize naturally produced individuals – usually eggs – and protectivelyrear them through periods of otherwise naturally high mortality. This usuallyresults in the production of large numbers of individuals that would otherwisehave perished, without the cost or risk of a captive-breeding programme. Anumber of projects have used head-starting to some effect (Sredl et al. 2002;Gibson and Freeman 1997; Sredl and Healy 1999; Krofta 2003).Translocations/reintroductions where ex-situmanagement is required until in-situ threatscan be mitigatedOften threats are not immediately controllable or even identified and, insuch cases, species may require ex-situ management across generations. Incases where threats are known to be temporally limited or able to be quicklymitigated, the ex-situ programme may be short or comprise only a generationor two. It is always desirable to reduce ex-situ time to minimize risks andmaximize the value of the limited available resources. Captive breeding andreintroduction of frogs have been used to relocate and re-establish populationsof Romer’s Treefrog (Chirixalus romeri, EN) following the loss of theirhabitat to development (Banks 1996; Dudgeon and Lau 1999). Over 100,000zoo-produced tadpoles of the Puerto Rican Crested Toad (Bufo lemur, CR)have been released, over the past decade, to augment small wild populationsand restore extirpated populations in areas where breeding habitat has beenrestored (Johnson 1999). In some cases the duration of ex-situ management isindeterminate. Such programmes are resource-intensive and face additionalrisks, including genetic loss, artificial selection, and the prospect that the speciesmay never be repatriated. For the Kihansi Spray Toad (Nectophrynoidesasperginis, CR), the ex-situ population has circumvented complete extinction,but there is currently no way to mitigate the in-situ threats (Krajick 2006).Project Golden Frog (PGF; Zippel 2002) and a collaborative multi-species effortin Panama by the Atlanta Botanical Garden and Zoo Atlanta (Mendelsonand Rabb 2006) are other examples where the ex-situ component of theprogramme will be of indeterminate duration. PGF focused its efforts for thePanamanian Golden Frog (Atelopus zeteki, CR) along three main objectives:population and habitat assessments, an intensively managed ex-situ breedingprogramme, and range-country education initiatives. Through the breedingprogramme, hundreds of offspring have been produced and distributed amongdozens of AZA-accredited zoos. In the US, the frog became a symbol of theimpacts of emerging diseases), with an immediate response from educatorsand funding from granting agencies. The Atlanta-based initiative attempteda pre-emptive extraction of other Panamanian species at an ecosystemscale. Based on data made available by Lips et al. (2006), the team workedahead of and behind the frontline of the progressing chytrid fungus. Theydemonstrated that it is possible to collect animals from infected areas, treatEducational graphics forming part of Panamanian Golden Frog Atelopus zetekimixed-species exhibit at the Buffalo Zoo. In addition to A. zeteki, the exhibitcurrently houses two other Panamanian species, namely Hylomantis lemur(Endangered) and Colostethus pratti (Least Concern). © John KastMichael Lau returning toHong Kong with the firstbatch of Romer’s TreefrogChirixalus romeri (Endangered)bred at MelbourneZoo. © Chris Banksthem for chytrid infection regardless of their level of infection, and establishthem in ex-situ populations.In conclusion, although species persistence must ultimately be achieved inthe wild, it can be facilitated by effective ex-situ conservation programmes.However, there are several important elements that define a successfulex-situ programme. Firstly, where ex-situ intervention is warranted to avoiduncontrollable threats, it is best done in the range country due to disease risks,political considerations, limited out-of-range capacity, and expense. Ex-situfacilities worldwide that have adequate resources should partner with zoosor other institutions in the range country. If capacity does not exist there, itmust be built. Prioritizing efforts within range countries provides renewedfocus, both on capacity building to facilitate in-country accountability andon government support, for an international response to preserve national(and global) biodiversity.Secondly, it is essential that animals removed from the wild and intendedfor eventual release be kept in strict isolation (Marantelli et al. in prep) to preventexposing them to novel pathogens and parasites. The risk is significantlyincreased as animals cross more or greater biogeographic barriers from theirnatural range. Moreover, specimens must undergo rigorous health screeningprior to return or release to test that isolation has successfully excluded knownorganisms. If the ex-situ community is to be responsible, for amphibians orany organisms they move, they should not gamble on biosecurity issues andrisk becoming the vector for a new disease outbreak in the wildby transferof foreign pathogens to the range or host country.Third, regardless of where the population is maintained, a programme hasa better chance of success if the time spent ex-situ is minimized (thus reducingthe potential for disease exposure, inbreeding, and artificial selection). And,finally, conservation research, education, and fundraising should be simultaneouspriorities for ex-situ populations. All of these activities must be linked to,and for the benefit of, an in-situ conservation programme aimed at reversingthe threats and thereby making the ex-situ programme unnecessary.ReferencesKevin Zippel, Kevin Buley, Richard Gibson,Graeme R. Gillespie, Robert Johnson, Robert C. Lacy,Gerry Marantelli, and Joseph R. Mendelson IIIBanks, C.B. 1996. A conservation program for the threatened Romer’s tree frog (Philautusromeri). In: P.D. Strimple (ed.), Advances in Herpetoculture, pp. 1-5. InternationalHerpetological Symposium, Inc, Des Moines, Iowa, USA.Buley, K.R. and Gonzalez, C. 2000. The Durrell Wildlife Conservation Trust and the Mallorcan MidwifeToad Alytes muletensis - into the 21st century. Herpetological Bulletin 72:17-20.Denton, J.S., Hitchings, S.P., Beebee, T.J. and Gent, A. 1997. A recovery program for thenatterjack toad (Bufo calamita) in Britain. Conservation Biology 11:1329-1338.Dudgeon, D. and Lau, M.W.N. 1999. Romer’s Frog reintroduction into a degraded tropicallandscape, Hong Kong, P.R. China. Re-introduction News 17:10-11.Gibson, R.C. and Freeman, M. 1997. Conservation at home: recovery programme for theagile frog Rana dalmatina in Jersey. Dodo 33:91-104.Griffiths, R.A. and Kuzmin, S.L. 2007. Captive breeding of amphibians for conservation.In: H.H. Heatwole and J.W. Wilkinson (eds.), Conservation and Decline of <strong>Amphibian</strong>s,<strong>Amphibian</strong> Biology, Volume 8A. Surrey Beatty & Sons, Chipping Norton, NewSouth Wales, Australia.Johnson, B. 1999. Recovery of the Puerto Rican crested toad. Endangered SpeciesBulletin 24:8-9.Krajick, K. 2006. The lost world of the Kihansi toad. Science 311:1230-1232.Krofta, D.M. 2003. California red-legged frog: jumping to survival. Endangered SpeciesBulletin 28:18-20.Lips, K.R., Brem, F., Brenes, R., Reeve, J.D., Alford, R.A., Voyles, J., Carey, C. and Collins, J.P.2006. Infectious disease and global biodiversity loss: pathogens and enigmatic amphibianextinctions. Proceedings of the National Academy of Sciences, USA 103:3165-3170.Mendelson, J.R., III and G.B. Rabb. 2006. Global amphibian extinctions and the role ofliving-collections institutions. World Association of Zoos and Aquariums. ProceedingsWAZA Conferences: Proceedings of the 60 th Annual Meeting, New York City, USA,2-6 October 2005: 179-181.Sredl M.J., Field, K.J. and Peterson, A.M. 2002. Mitigating threats and managing theRamsey Canyon leopard frog in Arizona. Nongame and Endangered Wildlife ProgramTechnical Report 207. Arizona Game and Fish Department, Phoenix, Arizona, USA.Sredl, M.S. and Healy, B.L. 1999. Conservation and Management Zones: Evaluating anapproach to conserving Arizona populations of the Chiricahua leopard frog (Ranachiricahuensis). Nongame and Endangered Wildlife Program Technical Report 149.Arizona Game and Fish Department, Phoenix, Arizona, USA.Zippel, K.C. 2002. Conserving the Panamanian Golden Frog: Proyecto Rana Dorada.Herpetological Review 33:11-12.ESSAY 11.6. A CONSERVATION SUCCESS STORY: THE MALLORCAN MIDWIFE TOAD ALYTES MULETENSISThe midwife toad of the Balearic island of Mallorca, Alytes muletensis, gainsits name from the unusual behaviour of the males, which carry fertilized eggsaround their back legs until they hatch; upon hatching the emerging tadpolesare released into a pool of water to complete their development. The localCatalan name of ferreret means “little iron-worker” because their ‘chinking’call sounds like iron being hit with a hammer.Until the late 1970s, the Mallorcan Midwife Toad was known only fromfossil evidence and was thought to be extinct. However, re-examination ofa specimen originally collected in 1978 revealed that this was not, as firstthought, an introduced common midwife toad (Alytes obstetricans), but anexample of the Mallorcan Midwife Toad (Mayol and Alcover 1981). Subsequentsurveys revealed the global distribution of the toad to consist of about13 populations, all contained within the Serra de Tramuntana. Within thesemountains, torrents of water flow through steep-sided karstic gorges duringthe winter, carving out semi-permanent plunge pools that provide breedinggrounds for the toad in the spring and summer months when the rest of thetorrent dries up. Although the toad remains restricted to the mountains,fossil evidence indicates that the species was once widespread acrossMallorca and also inhabited lowland areas (A. Alcover pers. comm.). Theincreasingly reduced and fragmented distribution of the species promptedits listing as Critically Endangered in the 1996 IUCN Red List (Baillie andGroombridge 1996).A number of theories have been proposed to explain the decline of theMallorcan Midwife Toad. Changes in water demand and population pressurehave resulted in increasingly limited availability of breeding sites forthe species and this may have restricted its range to areas where suitablebreeding pools persist. However, most researchers attribute the principalcause of decline to predation and competition from introduced species suchTadpoles from a snake-free pool (upper) and a pool subject to predationfrom snakes (lower) showing the strikingly different morphologies. © RobinD. Moore
130Threatened <strong>Amphibian</strong>s of the WorldMale Mallorcan Midwife Toad Alytes muletensis (Endangered) carryingfertilized eggs on its back legs. © Gerardo Garciaas green frogs, Rana perezi, and, more significantly, the viperine snake,Natrix maura, a semi-aquatic serpent that preys upon both tadpoles andadult toads. Archeological and, more recently, molecular evidence (Guickinget al. 2006) supports the idea that the viperine snake appeared in Mallorcaaround 2000 years ago following the arrival of the Romans. Being an islandspecies that evolved with few natural vertebrate predators, the MallorcanMidwife Toad was undoubtedly susceptible to the impacts of predation andcompetition from introduced species. The snake may have eliminated thetoad from much of the island, and recent research indicates that predationfrom snakes continues to negatively impact some extant populations. Inresponse to intense predation pressure, tadpoles have evolved a numberof behavioural and morphological anti-predator responses. Upon detectingchemical cues from snakes in the water, tadpoles reduce activity levels and,over a matter of weeks, change shape - becoming more streamlined with alarger tail muscle - to facilitate their escape if they are detected (Moore et al.2004). Such defences may have allowed the toad to cling onto survival in theface of intense predation pressure and may have facilitated its co-existencewith the snake in some areas today.In 1985, at the invitation of the Mallorcan government, the Jersey WildlifePreservation Trust (JWPT), now known as the Durrell Wildlife ConservationTrust (DWCT), initiated a species recovery program for the toad. A captivepopulation was initially founded at Jersey Zoo, UK, using 20 individuals collectedfrom one site, and the species was bred in captivity for the first timein 1988. Captive populations stemming from this founder colony are now heldin a number of institutions in both Spain and the UK and these have beenaugmented with several more bloodlines that are maintained separately toensure genetic integrity. One of the main aims of the captive-breeding programhas been to provide toads for reintroduction into their natural habitat.The first reintroduction of 76 captive toads from JWPT occurred in 1989,at the request of the Mallorcan government, into two sites chosen by theConselleria d’Agricultura Pesca (CDAP). Since then, releases of young toadsand tadpoles have been made into numerous unoccupied sites within theknown historical range of the species. Such sites have been identified after acareful assessment of potential threats, with appropriate habitat and predatormanagement carried out in order to maximize the chances of success. Naturalpopulations are also known to use livestock watering troughs, or cisterns,and construction of such artificial breeding sites in the traditional style hasalso proved successful in re-establishing populations in areas where wateris otherwise in short supply. The success of the reintroduction programme isillustrated by the fact that about 25% of the current wild population stemsfrom captive-bred stock and that 12 new breeding sites have been establishedsince 1989 through reintroductions (Buley and Gonzalez-Villavicencio 2000). Ata recovery group meeting in Jersey in November 2002, a decision was madeto suspend reintroductions from ex-situ breeding colonies as a precautionagainst the transmission of diseases, such as the chytrid fungus. It was suggestedthat conservation efforts rather focus on translocating individuals fromexisting populations into new, unoccupied sites and head-starting tadpolesto increase the chances of success for such translocations.The recovery program has proven extremely successful in reversing thedecline of the toad. Nineteen breeding populations now exist within theSerra de Tramuntana and six of these have been established from successfulreintroductions of captive individuals. As a result, the species was downlistedby two categories to Vulnerable during the course of the Global <strong>Amphibian</strong>Assessment. The success of this program can be attributed to a number offactors. Firstly, there has been effective collaboration among internationalgovernments, NGOs, academic institutions, and zoos. This collaboration hasmeant that captive breeding and reintroduction has been just one componentof a wider recovery program involving threat mitigation and habitat management,health screening of wild and captive toads, ongoing monitoring of allthe toad populations, and raising awareness among visitors and stakeholders.Secondly, these activities have been underpinned by targeted research onreproductive biology, survey methodologies, the impact of threats, and populationgenetics. Recent research, for instance, has shown that relatively highlevels of heterozygosity and important fitness attributes can be retained for afew generations of captive breeding in this species, but that both may start todeteriorate in the long-term (Kraaijeveld-Smit et al. 2006); such findings haveimportant implications for this, and other, recovery programmes.Extant populations continue to be monitored and captive populationsmaintained as a ‘safety net’ and for conservation research in order to ensurethe continued recovery of the Mallorcan Midwife Toad. This represents a rareconservation success story and has the potential to serve as a model for otheramphibian recovery programmes throughout the world.Robin D. Moore and Richard A. GriffithsReferencesBuley, K.R. and Gonzalez-Villavicencio, C. 2000. The Durrell Wildlife Conservation Trustand the Mallorcan midwife toad, Alytes muletensis – into the 21 st century. HerpetologicalBulletin 72:17-20.Baillie, J. and Groombridge, B. (compilers and editors) 1996. 1996 IUCN Red List ofThreatened Animals. IUCN, Gland, Switzerland and Cambridge, UK.Guicking, D., Griffiths, R.A., Moore, R.D., Joger, U. and Wink, M. 2006. Introduced alien orpersecuted native? Resolving the origin of the viperine snake on Mallorca. Biodiversityand Conservation 15:3045-3054.Kraaijeveld-Smit, F.J.L., Griffiths, R.A., Moore, R.D. and Beebee, T.J.C. 2006. Captivebreeding and the fitness of reintroduced species: a test of the responses to predatorsin a threatened amphibian. Journal of Applied Ecology 43:360-365.Mayol, J. and Alcover, J.A. 1981. Survival of Baleaphryne Sanchiz and Adrover, 1979(Amphibia: Anura: Discoglossidae) on Mallorca. Amphibia-Reptilia 3/4:343-345.Moore, R.D., Griffiths, R.A., O’Brien, C.M., Murphy, A. and Jay, D. 2004. Induced defencesin an endangered amphibian in response to an introduced snake predator. Oecologia141:139-147.The Sierra Tramuntana ofnorthern Mallorca, BalearicIslands, Spain – hometo the Mallorcan MidwifeToad Alytes muletensis(Endangered). © RobinD. MooreESSAY 11.7. WHEN HABITAT PROTECTION AND SUCCESSFUL CAPTIVE BREEDING ARE NOT ENOUGH: THE CASE OF THE WYOMING TOADDuring the last Ice Age, vast glaciers occupied most of North America’s farnorthern latitudes, and the ranges of many northern, cold-climate plantsand animals extended well to the south of their present distributions. Withglacial recession and subsequent warming, the distributions of these specieswithdrew northward. One of these, the Canadian Toad Bufo hemiophrys,disappeared from most of the southern part of its range in the prairie regionof the north-central United States. Until the 1940s, herpetologists believedthat the Canadian Toad lived only as far south as the northern fringe of theUnited States, including northern Minnesota and northern North Dakota.But, in 1946, George Baxter, newly arrived at the University of Wyoming,discovered an isolated population in the Laramie Basin in south-easternWyoming, about 500 miles away from the nearest known population ineastern South Dakota. Since then, biologists have scoured the region, butall known occurrences of this population have been found only within about50km of the town of Laramie, within an area of about 2,330km², at elevationsbetween 2,300 and 2,500m asl.The toad’s habitat in Wyoming consists of wet meadows, marshy wetlands,and the moist low-gradient edges of open bodies of water. Baxter’sinitial discoveries were along the floodplains of the Big and Little Laramierivers, but recent observations indicate that toads responded to changingirrigation practices in the basin by switching from floodplain pools andpooled irrigation water to more isolated ponds and seepage lakes. Toadssurvive the Laramie Basin’s long, cold winters by burrowing into the deepsandy soils of old, vegetated dunes near the breeding areas, or by movinginto rodent burrows.At the time of its discovery, the toad that Baxter discovered in the LaramieBasin was regarded as a population of the Canadian Toad. In 1968, KennethPorter of the University of Denver carefully compared the characteristics of theWyoming population with those of Canadian Toads in Canada and determinedthat the Wyoming toads warranted recognition as a new subspecies, whichhe named Bufo hemiophrys baxteri, in recognition of Baxter’s discovery. It waslater considered a distinct species (Smith et al. 1998), and the Laramie Basinpopulation is now generally known as the Wyoming Toad (Bufo baxteri).Baxter’s field observations over many years indicated that the WyomingToad was relatively common in the 1950s and 1960s, but then underwent asubstantial decline in distribution and abundance in the 1970s. In fact, by themid-1980s, the Wyoming population appeared to be extinct. At the time, therewas concern that pesticide applications for mosquito control in the LaramieBasin might be a major factor in the decline. Concerted survey efforts in the1980s fortunately revealed tiny remnant populations but, by 1987, the knownrange included only a single site. Wild Wyoming Toads have since been foundonly at this site, initially protected by The Nature Conservancy and nowincluded in the Mortenson Lake National Wildlife Refuge.A “wild” Wyoming Toad Bufo baxteri (Extinct in the Wild) from MortensenLake, Albany Country, Wyoming. A single population of Wyoming toads wasdiscovered at Mortenson Lake in 1987. This location was purchased by TheNature Conservancy, and the Mortenson Lake National Wildlife Refuge wasestablished in 1993. © Douglas A. Keinath
Chapter 11. <strong>Amphibian</strong> Conservation – Responding to the Global Decline of <strong>Amphibian</strong>s 131In the late 1980s and early 1990s, the Mortenson Lake population persistedwith an adult population in the low 100s, and then declined to just a few adultsby 1993. Breeding output dropped from a few egg masses per year to zero.Fearing that the toad might disappear completely from Wyoming, biologistscollected the few remaining individuals in 1993 and 1994 and began attemptsto breed them in captivity. This effort, now involving several zoos and otherfacilities, generated good numbers of offspring for release into the wild. Aneffort in the early 1990s to establish additional populations through releasesof captive-raised toads at Lake George and Rush Lake on the Hutton LakeNational Wildlife Refuge was unsuccessful. At Mortenson Lake, releases ofmany thousands of toadlets and tadpoles beginning in the mid-1990s resultedin at least modest toad survival and even a renewal of reproduction in the wildin 1998-2000, generating hopes for population recovery. However, subsequentdeclines, poor reproduction, and observations of diseased and dead toads inthe early 2000s, put the toad back into an extremely precarious status. Thefree-ranging population surely would be completely gone without annualreleases of thousands of captive-reared toadlets. Accordingly, the speciesremains functionally extinct in the wild.Several factors may have contributed to the toad’s decline and current poorcondition. As with most threatened species, the toad has experienced habitatloss and degradation. Irrigation practices in river floodplains, now used forhay production, probably made streamside areas less suitable for successfultoad reproduction. For example, de-watering prior to hay-cutting may kill toadlarvae before they metamorphose into toadlets capable of living on land. Also,some potential breeding sites have dried up as a result of prolonged drought,while drought-related increases in evaporation have made Mortenson Lakemore saline and perhaps less suitable for toads.However, recent evidence suggests that the primary threat to the WyomingToad is not habitat degradation, but rather the pathogenic chytrid fungus(Batrachochytrium dendrobatidis), now associated with amphibian declinesaround the world. The fungus has been discovered at Mortenson Lake andin the captive population. Retrospective analyses indicate that the chytridfungus has been present at Mortenson Lake since 1989.Continued survival of the Wyoming toad depends on intensive management.An important immediate concern is maintenance of the toad’s geneticdiversity through careful management of the captive breeding stock. Excessiveinbreeding and associated loss of genetic variation potentially couldcompromise the toad’s reproductive performance and hinder the population’sability to respond to environmental variations.Even if the Mortenson Lake population were in better condition, thetoad’s long-term survival and recovery would still depend on the identificationof additional reintroduction sites and the establishment of severalwild populations. This is a basic conservation precaution that minimizesthe probability that localized events do not eliminate the entire species.Happily, private landowners have begun to step forward and allow toads tobe released into suitable habitat on their property. A recent initiative thatmay play an important role in facilitating this effort is known as the SafeHarbor Agreement (SHA). According to the U.S. Fish and Wildlife Service, aSHA “encourages landowners to conduct voluntary conservation activitiesand assures them that they will not be subjected to increased restrictionsshould their beneficial stewardship efforts result in increased endangeredspecies populations. As long as enrolled landowners allow the agreed uponhabitat improvements to be completed on their property and maintain theirresponsibilities, they may make use of the property during the permit term,even if such use results in the take of individual Wyoming toads or harm totheir habitat. This approach may be critical in establishing additional sitesinto which captive-reared toadlets might be released with improved chancesof survival and eventual reproduction.”Recently, a SHA was involved in the release of captive-raised toads on aprivate ranch near Mortenson Lake. Well-managed cattle grazing – which iscompatible with and may even facilitate toad recovery – is being continuedon the ranch. Only time will tell if the toads can avoid or overcome thefungal threat and establish a viable population on this and other potentialreintroduction sites. Meanwhile, the Wyoming Toad remains one of theworld’s most threatened species.ReferencesGeoffrey A. HammersonAnonymous. 2005. Statewide programmatic biological assessment for the Wyoming toad(Bufo baxteri). Final report submitted to BLM Wyoming State Office, 5353 YellowstoneRoad, Cheyenne, Wyoming 82003-1828.Odum, R.A. and Corn, P.S. 2005. Bufo baxteri Porter, 1968. Wyoming toad. In: M. Lannoo(ed.), <strong>Amphibian</strong> declines: the conservation status of United States species, pp. 390-392. University of California Press, Berkeley, California, USA.Smith, H.M., Chiszar, D., Collins, J.T. and van Breukelen, F. 1998. The taxonomic status ofthe Wyoming toad, Bufo baxteri Porter. Contemporary Herpetology 1998(1):http//alpha.selv.edu/ch/1998/1.Taylor, S.K., Williams, E.S., Thorne, E.T., Mills, K.W., Withers, D.I. and Pier, A.C. 1999.Causes of mortality of the Wyoming toad. Journal of Wildlife Diseases 35:49-57.U.S. Fish and Wildlife Service. 1991. Wyoming toad recovery plan. U.S. Fish and WildlifeService, Denver, Colorado, USA.ESSAY 11.8. CONSERVATION ACTION FOR THE MEXICAN AXOLOTL AMBYSTOMA MEXICANUMThe Mexican Axolotl (Ambystoma mexicanum) is one of Latin America’smost threatened amphibians. The vast wetland upon which Mexico Citywas founded – and which once provided a rich and productive habitat forthe Axolotl and other endemic fauna – is now reduced to a handful of small,isolated patches surrounded by development. Of these, Lake Xochimilco isthe largest, covering just over 2km² – but it is certainly no longer a lake.The development of the ‘chinampas’ – raised fields of mud and vegetationreclaimed from the lake – has been going on for centuries and has reducedthe system to a series of canals running between islands of development.Today, the landscape is often referred to as the ‘floating gardens’ (a misnomer,as the chinampas are not floating at all). Habitat loss, introduced predators,pollution, and illegal collection for food and medicines have all taken theirtoll on the Axolotl. Consequently, the threats facing this species are complexand not easily reversible. However, its prominent position within Aztecmythology (see Essay 2.3) and the ancient lacustrine economy of the regionmeans that the Axolotl is well known – although poorly understood – amonglocal people. Some 2000 remeros (local boatmen) earn a living by puntingvisitors along the lake’s canal system in gaily decorated trajineras (pleasureboats), while the chinamperos (local farmers) cultivate the adjacent land,in much the same way as their ancestors have done for centuries. Fishingis also important to the local economy, and although non-native carp andTilapia may have replaced the Axolotl as the main catch, researchers haveyet to improve upon the highly skilled traditional netting method used by thefishermen for finding Axolotls.Over the last five years, a conservation programme on the Axolotl has beeninitiated and fostered by a partnership of British and Mexican organizations(Griffiths et al. 2004). This project was the brainchild of the late Dr VirginiaGraue of the Universita Autonoma Metropolitana at Xochimilco (UAM-X),who contacted the Durrell Institute of Conservation and Ecology (DICE) in1999 for assistance with the development of the project. As it was clearthat addressing the many threats that the Axolotl faced would be impossiblewithout the co-operation of local stakeholders, the project focused onembracing local people within the conservation planning process. This wasdone by promoting the Axolotl as a flagship species for nature tourism andconservation education within the region. Using a field station (run by UAM-X)on the shores of the lake as a base, and with funding from the IUCN/ SSCDeclining <strong>Amphibian</strong> Populations Task Force (DAPTF), as well as the BritishGovernment’s Darwin Initiative programme, the project partnership held trainingworkshops on amphibian biology and conservation for local students andconservation organizations, nature guiding for local boatmen, and souvenirproduction for unemployed artisans.In addition, the project has been actively engaged in ongoing studiesfocusing on the population status of, and threats to, the Axolotl. Despite itsprecarious status in the wild, the Axolotl is one of the most familiar amphibiansin laboratories and aquaria throughout the world. Animals were originally collectedin 1863 for the Natural History Museum in Paris, and many of today’scaptive animals probably stem from these founders (Smith 1989). As a result ofits well-known reproductive biology, and the availability of captive populations,there is considerable interest in reintroducing Axolotls to Lake Xochimilco.However, there are several problems associated with such releases. At thevery least, threats need to be neutralized and potential disease and geneticproblems need to be addressed before captive animals are put back into thewild (Griffiths et al. 2004). Despite the wide availability of captive-bred Axolotls,wild animals are still captured and sold illegally in local markets (McKay2003). A proposal to upgrade Ambystoma mexicanum from CITES Appendix II(controlled international trade) to Appendix I (species threatened with extinctionand international trade permitted only in exceptional circumstances) iscurrently under discussion by the Mexican authorities.As a result of a conservation workshop, held at UAM-X in December 2004,the goals for the conservation of the Axolotl and its habitat were finally distilledinto eight categories: (1) biology of the species; (2) legislation; (3) socialactions; (4) political actions; (5) ecological interactions; (6) local environment;(7) education; and (8) resource use and harvesting. These goals provided theframework for the Species and Habitat Action plan for the Axolotl and theXochimilco system that was published in 2005 (DICE, UAM-X, 2005). Followingthe workshop, the Senate of the Congress of the Mexican governmentpassed a motion requesting the President to instruct the Secretariat of theCommission for the Environment, Natural Resources and Fishing to initiatean urgent governmental programme to avoid the extinction of the Axolotl inLake Xochimilco. What this decision will mean, in practice, remains to beseen, but it will certainly influence governmental actions that impact theAxolotl and Xochimilco conservation. The decision, in itself, is an indicationof the leverage that such projects can achieve.One of the most important products to emerge from the project’s first phaseis the partnership of diverse organizations that all have an interest in the futureof the Axolotl and its habitat: the Grupo por la Investigacione del la Ajolote yXochimilco (GIAX), which is co-ordinated by Dr Luis Zambrano of the Instituteof Biology, UNAM. Despite the obvious benefits accruing as a result of raisingawareness and building local capacity, initial data from this first phase ofthe project indicate that the status of the Axolotl has deteriorated to such anextent that the species now warrants classification as ‘Critically Endangered’according to the IUCN Red List categories and criteria. This reclassificationhas provided a sharper focus for the implementation of the action plan. Thenew partnerships forged within GIAX will be instrumental in taking the planforward during the second phase of the Darwin Initiative project. The trainingof remeros as nature guides has resulted in a significant increase in theirincome from visitors to Lake Xochimilco. Some of the remeros are currentlybeing trained as nature guide ‘trainers’, with a view to the training packageeventually being handed over to, and managed by, the guild of remeros. Bythe end of the second phase of the project, it is hoped that nature tourism willbe contributing significantly to the sustainable development of the Xochimilcosystem, and will be independent of external funding. In parallel, research isA typical Xochimilco canal scene beyond the busy urban area, showing atrajinera (pleasure boat) in the foreground. The boats in the distance areselling ornamental plants grown on the chinampas. © Ian G. BrideThe Critically Endangered Mexican Axolotl Ambystoma mexicanum is endemic to the canals of Lake Xochimilco in central Mexico, on the southern edge ofMexico City. © Ian G. Bride
132Threatened <strong>Amphibian</strong>s of the Worldbeing carried out on the productivity of the Xochimilco system, with a viewto balancing the needs of the local fishermen with ameliorating the threatsassociated with introduced species and poor water quality. Ultimately, thefuture of the Axolotl will depend upon how successfully local stakeholders andtheir livelihoods engage with the protection of this unique wetland.ReferencesRichard A. Griffiths, Ian G. Bride, and Jeanne E. McKaySome of the 50-plus participantswho attended the Axolotl Species/Habitat Action Plan Workshop, heldat the Universita Autonoma Metropolitanaat Xochimilco in December2004. Participants are holding upthe name plate of the trajinera thatthe Darwin Initiative project boughtfor CIBAC. © Ian G. BrideDICE, UAM-X, 2005. The Conservation of the Axolotl (Ambystoma mexicanum) in Xochimilco,Mexico City-A Species/Habitat Action Plan. http://www.kent.ac.uk/anthropology/dice/research/azaxs/Griffiths, R.A., Graue, V., Bride, I.G., and McKay, J.E. 2004. Conservation of the axolotl (Ambystomamexicanum) at Lake Xochimilco, Mexico. Herpetological Bulletin 89:4-11.McKay, J.E. 2003. “An evaluation of captive breeding and sustainable use of theMexican axolotl (Ambystoma mexicanum)”. MSc dissertation, University of Kent,Canterbury, UK.Smith, H.B. 1989. Discovery of the axolotl and its early history in biological research. InDevelopmental Biology of the Axolotl, pp. 3-12. In: J.B. Armstrong and G.M. Malacinski(eds.). Oxford University Press, New York, USA.ESSAY 11.9. MANAGING PROBLEMS OF OVER-EXPLOITATION AND TRADE IN AMPHIBIANSTo many cultures, amphibians are an important and commonly available sourceof protein. In some places, even tadpoles can be made into a local dish. Thewater-holding frogs in Australia store a reservoir of water in the bladder tolast through the extended dry season and are used by the aborigines when noother source of water is available (Tyler 1976). Certain amphibians are alsocommonly used in traditional medicine. For example, in China, nine speciesof amphibians are listed in “The Great Pharmacopoeia” published over fourhundred years ago. Up to 32 species are now recognized to be of medicinalvalue in traditional Chinese medicine (Ye et al. 1993). Some amphibians are alsoexploited to provide useful materials, like the poison from the various PoisonDart frogs for hunting and the skin of the Marine Toad for the leather industryin the Americas. Many exotic frogs, such as the colourful Mantellas (genusMantella) from Madagascar, and a number of salamander species, are alsocollected to supply the pet trade. There is also quite a demand for frogs for usein the laboratory. And, in some countries such as Mexico, certain amphibiansare used in witch craft and art crafts. <strong>Amphibian</strong>s also play a role in shapingthe local culture. For example, the Mexican Axolotl Ambystomma mexicanum,which has various mythological connections – the ancient Mexicans consideredit the twin brother of Quetzalcoatl – has played an important role in the localcommunities around lakes in the Basin of Mexico (see Essay 2.3). There is evena frog festival in a branch of the Zhuang Minority in southern China.These species survived centuries of traditional use and the ‘edible frogs’remained common and widespread until commercial trade set in leading to amuch larger level of exploitation that is often unsustainable. As early as the1930s, Bourret (1942) noted the mass commercial trade of large edible frogsfrom Viet Nam into China. The collapse of populations of favourite ‘frog legs’species in Asia shows that even in common, fast-growing and fecund species,such levels of exploitation are not without limit. Once depleted, the ecologicalfunctions carried out by these frogs are also hampered, which contributesto the outbreak of insect pests in rice paddies. The demand for amphibiansis unlikely to diminish in the near future due to continual growth in humanpopulation and the increased purchasing power that accompanies growingeconomies. The resulting high collecting pressure often acts together withhabitat destruction and degradation and poses a substantial threat to manyamphibians. In China, for example, utilization adversely affects 84 species,some 30% of the amphibian fauna (Baillie et al. 2004).The species hardest hit by over-exploitation are those that are rare, restrictedor highly valuable. In recent years, a number of frogs and salamanderssuch as the Lao Salamander Paramesotriton laoensis (DD) and Kaiser’s SpottedNewt Neurergus kaiseri (CR) have been subjected to commercial collectionfor pet trade at levels that are believed to have removed the majority ofindividuals from the wild (Stuart et al. 2006; Leahy 2006). Another exampleof a species hard hit by commercial exploitation, but for food, is the ChineseGiant Salamander Andrias davidianus (see Essay 4.7). This species, thelargest amphibian in the world (adults can weigh more than 40kg) rangeswidely in central and southern China and large populations once existed inmany places. However, it is regarded as a delicacy and fetches a very highprice. The species is particularly susceptible to over-harvesting because itis nearly fully aquatic and utilizes specific hiding places in clear mountainstreams. Juveniles are also of marketable size and are collected as well asadults. Highly destructive methods, such as liming or the use of poison, aresometimes used to collect all the individuals in the stream. Individuals arealso being collected as breeding stock in commercial farms. All these factorstogether with the long life-cycle make the Chinese Giant Salamanderespecially vulnerable to over-exploitation, and this Critically Endangeredspecies has now disappeared from many areas, and a conservation actionplan is urgently needed to reverse its decline.Frog farming has gained momentum in many places and commercialfeed is now available to feed the frogs and their tadpoles. These farmscan make a positive contribution towards conservation if the supply frombreeding farms substitutes for that from the wild, or if part of the incomegenerated is directed back into biodiversity conservation. However, thereremain challenges, including disease control within farms and the economiccost/benefit of farming efforts as a business activity (Kusrini and Alford2006). One negative consequence of amphibian farming is that the AmericanBullfrog is one of the favourite species in many parts of the world. Theseanimals often escape and become invasive, affecting the local ecosystemand biodiversity. In Mexico, for example, this species has been introducedinto 16 of the country’s 32 states. Most places actually have their own ‘edible’frogs that are more suited to the local environment and are much bettercandidates for farming than exotic species. However, regardless of species,frog farming still runs the risk of transmitting diseases from captive frogs tothose in the wild anywhere from the farm surroundings and transport routesto destination markets.An alternative to farming and its associated problems is to explore optionsfor sustainable use of local wild populations. The short life-cycle, highfecundity and high population size of many large frogs actually renders themquite resilient to certain levels of harvesting. If the requirements of the speciesconcerned are known, and proper management is in place, these frogs can beharvested without affecting their population. There are examples in northernChina where harvest of the Chinese Brown Frog Rana chensinensis (LC), aspecies used in traditional Chinese medicine, can be increased by providingbreeding ponds and raising the tadpoles (Ye et al. 1993). Another exampleof sustainable use of amphibians is the harvesting of the grass frog Ranaforreri (LC), which is a popular laboratory animal. These animals are harvestedaccording to an annual quota and then exported to the United States. InThailand and Indonesia, frogs (mainly Hoplobatrachus rugulosus, Fejervaryacancrivora and Fejervarya limnocharis) living and breeding in rice paddies,not only feed on crop pests but also are harvested for local consumption andexport (Kusrini and Alford 2006). When combined with sustainable land-usepractices, such as organic farming, this increases the economic gains, reducesor eliminates the need for and use of chemicals, and can bring additionalconservation benefits to many other amphibians and wildlife. It might alsoprovide an additional incentive to conserve their natural habitats in the caseof non-commensal species.To prevent unrestricted exploitation and possible extirpation of populationsand species, several countries have implemented legislation thatspecifically regulates or prohibits the exploitation of particular amphibianspecies. Legislation usually also exists to protect particular natural areas asparks or sanctuaries, and amphibian populations inside such areas may bepartly or completely protected by the regulations in force for the area. Forspecies threatened by international trade, the Convention on InternationalTrade in Endangered Species of Wild Fauna and Flora (CITES) is quite effectivein regulating levels of trade and even in banning the commercial tradein highly threatened species (see Chapter 11). Adequate local legislationsand enforcement is also needed as many amphibians are consumed locally.Wildlife trade is dynamic, and monitoring and reporting are important toprovide an early warning system.ReferencesMichael Lau, Peter Paul van Dijk and Gracia P. SyedBaillie, J.E.M., Bennun, L.A., Brooks, T.M., Butchart, S.H.M., Chanson, J.S., Cokeliss, Z.,Hilton-Taylor, C., Hoffmann, M., Mace, G.M., Mainka, S.A., Pollock, C.M., Rodrigues,A.S.L., Stattersfield, A.J. and Stuart, S.N. 2004. 2004 IUCN Red List of Threatened Species.A Global Species Assessment. IUCN, Gland, Switzerland and Cambridge, UK.Bourret, R. 1942. Les Batraciens de l’Indochine. Institut Océanographique de l’Indochine,Hanoi. 547 pp.Kusrini, M.D. and R.A. Alford. 2006. Indonesia’s exports of frogs’ legs. TRAFFIC Bulletin21(1):13-24.Leahy, S. 2006. Biodiversity: The insatiable in pursuit of the inedible. http://www.ipsnews.net/print.asp?idnews=35633Stuart, B.L., Rhodin, A.G.J., Grismer, L.L. and Hansel, T. 2006. Scientific description canimperil species. Science 312:1137.Tyler, M.J. 1976. Frogs. Collins, Sydney, Australia.Ye, C., Fei, L. and Hu, S. 1993. Rare and Economic <strong>Amphibian</strong>s of China. Sichuan PublishingHouse of Science and Technology, Chengdu, China. [In Chinese]A farmed, market-bought Hoplobatrachusrugulosus (Least Concern),the most common species used inthe frog-leg trade in Asia, showingobvious signs of farm rearing, includingbulbous toe-tips and transportdamage behind the nostrils.© Peter Paul van Dijk, 1994-2000An assortment of local languagefrog-farming manuals for the rearingof Hoplobatrachus rugulosus (in Chineseand Thai), Rana catesbeiana(Thai), Paa spp. (Chinese) and localranids (Chinese). © CI/Peter Paulvan Dijk, 2007
Chapter 11. <strong>Amphibian</strong> Conservation – Responding to the Global Decline of <strong>Amphibian</strong>s 133ESSAY 11.10. FILLING THE BLACK HOLE: CHALLENGES IN TAXONOMY TO PROTECT AMPHIBIANSLess than 10% of species on the planet have been discovered and fewerthan 1% are known beyond brief anatomical descriptions (Wilson 2005).Without a doubt, our alarmingly inadequate knowledge of the Earth’s diversityis one of the most significant challenges to effectively protect threatenedspecies, all the more urgent as biologically rich regions are destroyed atunprecedented rates.An excellent example of the significance of this problem is provided byextinction risk assessments, such as those integral to the Global <strong>Amphibian</strong>Assessment. However, Red Lists of threatened species only evaluateformally described species. Although undescribed species may well havea high risk of extinction, they are ignored by conservation initiatives thatrely on information contained within the IUCN Red List. Therefore, fillingthis taxonomic void should be a priority for the implementation of effectiveconservation programmes.Among terrestrial vertebrates, sampling of amphibians appears to be particularlyincomplete. This is indicated by the large number of species describedduring recent decades (for example, see Figure 1) at a rate of discovery thatexceeds that of every other vertebrate group (Cannatella and Hillis 2004). Duringthe period 1992-2003, the number of species of amphibians increased by25% with most of the additions being new discoveries rather than subspecieselevated to the species rank (Kohler et al. 2005; and see Essay 1.1). Recentestimates indicate that the number of amphibians awaiting formal descriptionin Southeast Asia and the Neotropics should be well above 1,000 (seebelow). These figures suggest that, at a global scale, the taxonomic deficitcould be a serious obstacle for the success of any comprehensive programmeto protect amphibians. Thus, intensive efforts in taxonomy and systematicsare indispensable to secure adequate conservation measures.Fortunately, the increasing use of genetic markers in systematics couldincrease the rate at which amphibian species are discovered. These toolsquantify genetic variation within and among populations, which can exposegenetic clusters that correspond to separate species. These data are usuallycomplemented with geographic distribution, and morphological, or behaviouraldata to corroborate species identities. The use of genetic markersallows the identification of previously unsampled species and enables us todetect cryptic species that have previously been hiding under a single morphologicallyidentified species. The available techniques include allozymes,AFLPs, microstatellites, and, most prominently, DNA sequencing (includingDNA bar-coding; see Essay 11.11).Genetic markers have been used recently to estimate the number of speciesof amphibians that remain to be discovered. In a review of species-levelmolecular phylogenies of Neotropical amphibians, Ron et al. (2006) found thatphylogenetic studies have lead to a 28% increase in the number of knownspecies. The increase was higher (39%) for studies where taxon samplinghas been more intensive (i.e., studies that included more than 50% of thedescribed species). This indicates that a significant number of species haveeither been overlooked by morphology-based taxonomic reviews or havenot been sampled at all.Given that there are approximately 2,800 described species of amphibiansin the Neotropics and assuming, conservatively, that the proportion ofundescribed amphibians lies between 0.28 and 0.39, then the number ofNeotropical species awaiting description should lie between 784 and 1,092.This estimate is considered conservative because the proportion of speciesdiscovered should increase with taxon sampling, which until now has beenexhaustive only in a few Neotropical clades. Phylogenies with non-exhaustivesampling often include predominantly species of easy access, availablein the pet trade (e.g., poison-arrow frogs of the genus Dendrobates) and/ordistributed in habitats that, because of their relative accessibility and conspicuousness,are already described.Applying the same logic and approach to another amphibian species-richfaunal region (Indo-China, and the island archipelagos of the Philippines, Malaysia,and Indonesia), we can provide estimates of the magnitude of the problemof underestimated biodiversity using the recent phylogenetic studies of Evanset al. (2003), Brown (2004), and Stuart et al. (2006). Our estimate of undetectedspecies in this region lies between 271 and 364 undescribed forms. We canfurther examine the trends in one small oceanic island archipelago country (thePhilippines) that has been the subject of recent intensive diversity assessment(see http://www.herpwatch.org) and “ground truth” these estimates with firsthand knowledge of new species awaiting description. The estimated numbersfor the Philippines lie somewhere between 32 and 43 undescribed species (seeEssay 7.3). We also have personal knowledge of approximately 55 undescribedspecies awaiting description in the genera Platymantis and Limnonectes fromthe Philippines and Sulawesi (R. Brown, A. Diesmos, and A. Alcala, unpubl.),suggesting again that the estimation process is conservative.Advertisement calls provide acost-effective tool for speciesdiscovery and identification. MaleTrachycephalus venulosus (LeastConcern) call by inflating largelateral vocal sacs. They occur indry forests in western Ecuador.© Santiago R. RonA potential caveat with moleculartechniques is that some geneticmarkers are inadequate to definespecies boundaries because theyeither have evolved too slowly or tofast. In addition, the use of geneticmarkers is still limited in developingcountries, precisely in the regionswhere the taxonomic void is moreextensive. Thus, species identificationin many circumstances willcontinue to rely primarily in morphologicalor behavioural traits.An alternative to discover morphologicallycryptic species is through analysis of advertisement calls.In anurans, males produce advertisement calls which function to attractfemales, defend territories, or confront competing males. Because advertisementcalls also have a function in species recognition and discrimination(Gerhardt and Huber 2002), they can be excellent indicators of speciesboundaries, in some cases as reliable as genetic markers. In one increasinglywell-studied group, the Ceratobatrachine frogs of Southeast Asia andthe South-West Pacific (Alcala and Brown 1999), advertisement calls haveprovided a small group of modestly-funded researchers with a powerfulmeans of species delimitation. Combined with analysis of mitochondrialgene sequences, advertisement calls have served as the primary set ofcharacters for the recognition of more than 45 undescribed species overthe past 10 years. Of approximately 60 species for which sequence dataand call data are both available (Brown 2004, unpubl.), only two casesexist where sequence data and call data lead to differing conclusionswith regards to the distinctiveness of a species. Both are cases in whichpopulations of frogs possess very distinctive advertisement calls, but aregenetically indistinct from sympatric congeners, and both are suspectedcases of hybridization and introgression.The overwhelming trend that results from this work is the general conclusionthat genetic and call data are both very illustrative tools for identificationof cryptic independent evolutionary lineages, particularly when used incomplimentary fashion by field workers.Santiago Ron and Rafe M. BrownReferencesAlcala, A.C. and Brown, W.C. 1999. Philippine frogs of the genus Platymantis (Amphibia:Ranidae). Philippine Journal of Science 128:281-287.Brown, R.M. 2004. Evolution of ecomorphological variation and acoustic diversity inmate-recognition signals of Southeast Asian forest frogs (subfamily Platymantinae).Ph.D. Dissertation, University of Texas, Austin, Texas, USA.Cannatella, D.C. and Hillis, D.M. 2004. <strong>Amphibian</strong>s: living a life of slime. In: J. Cracraft and M.J.Donoghue (eds.), Assembling the tree of life, pp. 430-450. Oxford University Press, Oxford, UK.Evans, B.J., Brown, R.M., McGuire, J.A., Supriatna, J., Andayani, N., Diesmos, A.C.,Iskandar, D., Melnick, D.J. and Cannatella, D.C. 2003. Phylogenetics of fanged frogs:testing biogeographical hypotheses at the interface of the Asian and Australian faunalzones. Systematic Biology 52:794-819.Gerhardt, H.C. and Huber, F. 2002. Acoustic communication in insects and anurans. TheUniversity of Chicago Press, Chicago, USA.Köhler, J., Vieites, D.R., Bonett, R.M., García, F.H., Glaw, F. Skeinke, D. and Vences, M.2005. New amphibians and global conservation: a boost in species discoveries in ahighly endangered vertebrate group. BioScience 55:693-696.Ron, S.R., Santos, J.C. and Cannatella, D.C. 2006. Phylogeny of the túngara frog genusEngystomops (= Physalaemus pustulosus species group; Anura; Leptodactylidae).Molecular Phylogenetics and Evolution 39:392-403.Stuart, B.L., Inger, R.F. and Voris, H.K. 2006. High level of cryptic species diversity revealedby sympatric lineages of Southeast Asian forest frogs. Biology Letters 2:470-474.Wilson, E.O. 2005. Systematics and the future of Biology. Proceedings of the NationalAcademy of Sciences of the United States of America 102:6520-6521.Figure 1. An example of the large number of amphibians that remain to be described is given by the accumulated number of formally described speciesof amphibians in Ecuador (period 1758-2006). The number of species has almost doubled since 1970 and additions continue at a fast rate, especially frommontane habitats.Number of species4504003503002502001501005001755 1772 1792 1812 1832 1852 1872 1892 1912 1932 1952 1972 1992YearTotal (all regions) Montane forests Paramo Amazon rainforestESSAY 11.11. AMPHIBIAN CONSERVATION: NEW PERSPECTIVES THROUGH DNA BARCODINGEffective conservation requires that conservation practitioners are armedwith the appropriate knowledge, specifically about what to conserve andwhere to conserve it. For this reason, conservation efforts on the ground relyheavily on comprehensive assessments in the field (i.e. species inventories)supported by appropriate taxonomic studies. Unfortunately, for the majority ofliving organisms worldwide, both have been inadequately addressed. Amongamphibians, for example, we know that many tropical regions are still far frombeing well sampled (cf. Duellman 1999) and the recent observed increase inspecies numbers (over 25 per cent in 11 years; Köhler et al. 2005; and seeEssay 1.1) is largely due to the intensified exploration of tropical areas andthe application of modern techniques such as bioacoustics and moleculargenetics. A major problem in both field surveys and inventory work, as wellas in taxonomy, is that species are often difficult to identify. In amphibians,this is particularly problematic in species-rich genera, such as Afrotropical treefrogs (e.g., Hyperolius) or the Neotropical harlequin toads (Atelopus), whichgenerally display little inter-specific morphological variation.The amphibian fauna of the Kakamega Forest in western Kenya representsa case in point. This small forest fragment (240km²), long recognized as a siteof global conservation importance (e.g., Fishpool and Evans 2001), is underincreasing pressure, in particular due to firewood gathering and agriculturalexpansion. Despite the fact that it is one of the best sampled regions inKenya, five frog species were recorded only recently (Lötters et al. 2006)resulting in a total of 25 species from this site. However, the taxonomicstatus of several species from the Kakamega Forest still remains difficult todetermine due to their cryptic nature. For example, through extensive andmeticulous “detective” work, we found that there are, in fact, two species ofthe genus Phrynobatrachus in the Kakamega Forest which are morphologicallyindistinguishable (Lötters et al. 2006), and at least three scientific names maybe applicable to them (P. mababiensis from Namibia, P. minutus from Ethiopiaand P. scheffleri from Kenya).An exciting new tool to help speed the identification of known speciesand the discovery of new ones, is termed ‘DNA barcoding’, in which a shortstandardized fragment of DNA is sequenced and compared with referencedata (e.g. Herbert et al. 2003). The method is easy to perform and also allowsfor more objectivity in species diagnosis, and only small tissue samples arerequired from study animals, thereby reducing time and costs. DNA barcodingis similar to the universal barcodes of products in the retail industry, and itwas with the idea of making the barcode of every species on Earth available,i.e. “writing the encyclopedia of life”, that the Consortium for the Barcode
134Threatened <strong>Amphibian</strong>s of the Worldof Life was initiated in 2004 (http://www.barcoding.si.edu/). Although stillscience fiction, we may be well on our way to one day using handheld ‘tricoders’to identify any life-form directly in the field, just as Mr. Spock did in thefamous 1960s space drama Star Trek. Apart from the obvious advantagesfor conservation-related initiatives, barcoding’s benefits include the abilityto identify fragmentary specimens, and different life-stages (e.g., amphibianlarvae) to the level of species (review in Savolainen et al. 2005).There has been a lot of discussion about the barcoding movement, includingthe anxiety that classical taxonomy will be replaced by a code-based,rather than organism-focused, discipline that deals with ‘black box’ species(i.e., information without knowledge), far removed from actual species andhence from conservation (e.g. Ebach and Holdrege 2005). DNA barcoding canonly be a supplement to classical taxonomy and consequently conservation(cf. Gregory 2005). Furthermore, the accuracy of DNA barcoding is not quite100 per cent. In some cases, although genetic variation is low, data other thangenetic information (such as advertisement calls) can also suggest speciesstatus (e.g. Lötters et al. 2005).The idea of using a single universal genetic marker for all groups of organismshas been critically discussed. In contrast to a fragment of the cytochromeoxidase subunit I gene (COI) (Herbert et al. 2003), which has been widelyused in, for example, fish and birds, Vences et al. (2005) advocated that inamphibians the mitochondrial 16S rRNA gene fulfills the requirements betterthen COI due to stronger constancy of priming sites. Currently, a debate hasarisen about the use of mitochondrial versus nuclear DNA, or both combined,for barcoding (Rubinoff 2006).But how relevant and useful is DNA barcoding for the purposes ofamphibian conservation? Can we just undertake a “rapid assessment”into an unexplored region, collect amphibian samples, barcode them, andimmediately obtain results? Certainly, some databases already exist withcatalogued DNA barcode details, such as NCBI/GenBank in the USA, Europe’sEBI/EMBL Nucleotide Sequence Database, and the DNA Database of Japan(DDBJ) – all inter-linked. However, the data are unevenly distributed withrespect to taxon and geography. For example, a search of GenBank 1 , thelargest and most widely used of the databases, for 16S gene sequences ofthe Neotropical poison frogs (Dendrobatidae), a family of frogs attractive toscientists for different reasons, reveals that these are well represented (665sequences versus ~ 240 described species). In contrast, the abovementionedAfrotropical frog genus Phrynobatrachus is represented by not more than 6716S gene sequences, and 17 putative taxa out of about 69 known species.Apart from problems due to missing sequence data for many species, othercriticisms include the need to rely entirely on the taxonomic identificationof original voucher specimens against which sequence data is checked, thegenetic purity of the sequence itself, and the possible overlap of inter- andintra-specific variation (Meyer and Paulay 2005).In summary, DNA barcoding certainly provides new perspectives toamphibian conservation. However, at the current stage, its applicabilityis still limited due to lack of reference data for most species and becausethe taxonomy of many species (complexes) is not at the stage that allowssamples from the field to be quickly sequenced and then definitively allocatedto species. Nonetheless, coupled with traditional taxonomic tools, it couldhave important uses for disclosing hidden diversity.ReferencesStefan Lötters and Susanne SchickDuellman, W.E. 1999. Patterns of distribution of amphibians: a global perspective. JohnsHopkins University Press, Baltimore, Maryland, USA.Ebach, M.C. and Holdrege, C. 2005. DNA barcoding is no substitute to taxonomy. Nature 434:697.Fishpool, L.D.C. and Evans, M.I. (eds.). 2001. Important Bird Areas in Africa and associatedislands: priority sites for conservation. Pisces Publications and BirdLife International,Newbury and Cambridge, UK.Gregory, T.R. 2005. DNA barcoding does not compete with taxonomy. Nature 434:1067.Herbert, P.D.N., Cywinska, A., Ball, S.L. and de Waard, J.R. 2003. Biological identificationsthrough DNA barcodes. Proceedings of the Royal Society of London B 270:313-321.Köhler, J., Vieites, D.R., Bonett, R.M., Garcia, F.H., Glaw, F., Steinke, D. and Vences, M.2005. New amphibians and global conservation: a boost in species discoveries in ahighly endangered vertebrate group. BioScience 55:693-696.Lötters, S., Schmitz, A. and Reichle, S. 2005. A new cryptic species of poison frog from theBolivian Yungas (Dendrobatidae: Epipedobates). Herpetozoa 18:115-124.Lötters, S., Rotich, D., Koester, T.E., Kosuch, J., Muchai, V., Scheelke, K., Schick, S.,Teege, P., Wasonga, D.V. and Veith, M. 2006. What do we know about the amphibiansof the Kenyan central and western highlands? A faunistic and taxonomic review.Salamandra 42:165-179.Meyer C.P. and Paulay, G. 2005. DNA barcoding: Error rates based on comprehensivesampling. PLoS Biology 3:e422.Rubinoff, D. 2006. Utility of mitochondrial DNA barcodes in species conservation. ConservationBiology 20:1026-1033.Savolainen, V., Cowan, R.S., Vogler, A.P., Roderick, G.K. and Lane, R. 2005. Towards writingthe encyclopedia of life: an introduction to DNA barcoding. Philosophical Transactionsof the Royal Society of London B 360:1805-1811.Vences, M., Thomas, M., van der Meijden, A., Chiari, Y. and Vieites, D.R. 2005. Comparativeperformance of the 16S rRNA gene in DNA barcoding of amphibians. Frontiersin Zoology 2:5.1 http://www.ncbi.nih.gov, accessed 1 May 2006Afrixalus osorioi (Least Concern), a banana frog only recently recorded fromthe Kakamega Forest, may represent a species complex. However, the DNAbarcode for specimens from the type locality in Angola is not available.© Stefan LöttersDNA barcoding is a powerful tool for linking different life stages, e.g. frogtadpoles to adults. In this case, the photograph shows a typical Xenopuslarva collected at Kakamega Forest from where only one Xenopus speciesis known. © Stefan LöttersESSAY 11.12. THE AMPHIBIAN SPECIALIST GROUP: PAST, PRESENT AND FUTUREThe Global <strong>Amphibian</strong> Assessment (GAA) sharpened the scientific community’sfocus on both the global nature and extent of amphibian declinesand extinctions (Stuart et al. 2004). The results of the GAA demonstratedthat the amphibian crisis is complex in nature and requires a comprehensiveset of solutions. While traditional approaches to conservation willcontinue to form the core of a global strategy, novel approaches will alsobe required to address threats such as emerging infectious diseases andglobal climate change.Under the auspices of the World Conservation Union (IUCN) andConservation International (CI), an International <strong>Amphibian</strong> Summit wasconvened in September 2005 in Washington, DC, to devise a strategicglobal plan of action for amphibian conservation in the form of the <strong>Amphibian</strong>Conservation Action Plan (ACAP). Prior to the Summit, the IUCNSpecies Survival Commission (IUCN/SSC) focused on promoting amphibianconservation through the Global <strong>Amphibian</strong> <strong>Specialist</strong> <strong>Group</strong> (GASG), ondecline-related research through the Declining <strong>Amphibian</strong> PopulationsTask Force (DAPTF; see Essay 11.1), and on monitoring and assessmentsthrough an informal network of researchers contributing data to the GAA.These programmes have accomplish a great deal, but the magnitude ofthe current crisis requires a coordinated, unified approach to amphibianconservation, research and assessment that is beyond the scope of anyof these individual initiatives (Mendelson et al. 2006). Recognizing this,a decision was made to merge the GASG, DAPTF and the GAA to form asingle body committed to implementing a global strategy for amphibianconservation: the <strong>Amphibian</strong> <strong>Specialist</strong> <strong>Group</strong> (ASG).The logo of the <strong>Amphibian</strong> <strong>Specialist</strong> <strong>Group</strong>The ASG is a network of conservation professionals working under theIUCN/SSC framework with the mission of enabling amphibian research andconservation worldwide. The ASG envisions taking IUCN’s <strong>Specialist</strong> <strong>Group</strong>model to the next level of effectiveness by establishing a Secretariat thatwill coordinate regional working groups and a global web of stakeholdersto leverage their intellectual, institutional, and financial capacity. The Secretariathas two Co-Chairs (currently Claude Gascon and James Collins), anExecutive Officer, and Conservation, Research, Assessment, Developmentand Communications Divisions, each headed by a director.The Conservation Division promotes and supports the conservation ofthreatened amphibian species globally. By strengthening partnerships amonginstitutions in developed and developing countries, and by forging links withgroups such as other IUCN/SSC <strong>Specialist</strong> <strong>Group</strong>s, the ASG builds regionalcapacity to ensure that amphibians are incorporated into conservation plans.Through a collaborative partnership with Arizona State University, amphibianconservation and research projects in priority regions are supported bygrants through the Critical Ecosystems Partnership Fund (CEPF), based atConservation International. Additionally, the ASG also supports conservationand research through the allocation of Seed Grants, building upon the successfulmodel established by DAPTF. An <strong>Amphibian</strong> Conservation Award willbe presented annually to recognize an individual who has made significantcontributions to amphibian conservation worldwide.The Research Division works closely with research partners from theglobal network of national and regional working groups to apply a strategicand coordinated approach to research on the causes of global amphibiandeclines and to disseminating the results. Many amphibian declines andextinctions are caused by complex interactions of factors such as diseaseand climate change, and understanding these processes is vital for effectiveconservation action. The Research division works to narrow knowledge gapsthrough targeted research agendas for poorly known regions and groups, andstrives to apply scientific research results to conservation. A central on-linestorehouse of publications and current research results is being developedto facilitate information exchange amongst researchers and conservationpractitioners. Information will also be presented in multiple languages tofacilitate knowledge-sharing. The ASG will support targeted field researchin poorly known regions of the world and link global expertise with localexpertise in developing countries by conducting training courses for fieldpractitioners and students. These actions will strengthen regional andcountry-based capacity to improve knowledge of the taxonomy, distribution,abundance, and causes of amphibian declines.The Assessment Division – which fulfills the ASG’s Red List Authorityresponsibilities – will regularly assesses the conservation status of everyamphibian species in the world through the GAA. The ASG aims to make theGAA a more proactive process based on a “bottom up” flow of data to ensurethe most up-to-date and accurate information on every amphibian species.The Assessment Division will undertake periodic analysis of the databaseand communicate the findings to the global network and beyond. Findingswill be distributed on CDs to those regions where internet access is poor orunavailable. Information will be disseminated in paper where appropriate viaworking groups through workshops and meetings. The Assessment divisionwill regularly assess the conservation status of every amphibian speciesand feed this information into on-the-ground identification of conservationtargets and priorities.In coordination with the directors of the Conservation, Research andAssessment divisions, regional working group heads will initiate projects intheir respective regions. To aid in the outreach and fundraising aspects ofthe ASG network, an Advisory Board has been established comprising keystakeholders and advisor-advocates representing policymakers, the media,business, academia, conservation organizations, and government agencies.ASG communications will include a new and expanded bi-monthly newsletter(Froglog) that will be available free of charge on the ASG website (www.amphibians.org).The ASG will ensure long-term sustainability of amphibian research andconservation by building on DAPTF’s worldwide network of expert workinggroups and integrating them into IUCN’s global network of <strong>Specialist</strong> <strong>Group</strong>s.The ASG will support the development and dissemination of new tools andbest practices for adoption and application by a network of local, national,and regional working groups. By mainstreaming amphibian conservation bestpractices into the global web of international conservation programmes,national planning processes, and local practice, the ASG will ensure thesustainability of amphibian research and conservation.ReferencesRobin D. Moore, Claude Gascon and James P. CollinsMendelson, J.R., III, Lips, K.R., Gagliardo, R.W., Rabb, G.B., Collins, J.P., Diffendorfer,J.E., Daszak, P., Ibanez D, R., Zippel, K.C., Lawson, D.P., Wright, K.M., Stuart, S.N.,Gascon, C., da Silva, H.R., Burrowes, P.A., Joglar, R.L., La Marca, E., Lotters, S., duPreez, L.H., Weldon, C., Hyatt, A., Rodriguez-Mahecha, J.V., Hunt, S., Robertson,H., Lock, B., Raxworthy, C.J., Frost, D.R., Lacy, R.C., Alford, R.A., Campbell, J.A.,Parra-Olea, G., Bolanos, F., Domingo, J.J.C., Halliday, T., Murphy, J.B., Wake, M.H.,Coloma, L.A., Kuzmin, S.L., Price, M.S., Howell, K.M., Lau, M., Pethiyagoda, R.,Boone, M., Lannoo, M.J., Blaustein, A.R., Dobson, A., Griffiths, R.A., Crump, M.L.,Wake, D.B. and Brodie, E.D., Jr. 2006. Biodiversity: Confronting <strong>Amphibian</strong> Declinesand Extinctions. Science 313:48.Stuart, S.N., Chanson, J.S., Cox, N.A., Young, B.E., Rodrigues, A.S.L., Fischman, D.L. andWaller, R.W. 2004. Status and trends of amphibian declines and extinctions worldwide.Science 306:1783-1786.